
Assessment of Tau Pathology as Measured by 18F-THK5317 and 18F-Flortaucipir PET and Their Relation to Brain Atrophy and Cognition in Alzheimer’s Disease
Abstract
Background:
In Alzheimer’s disease (AD), the abnormal aggregation of hyperphosphorylated tau leads to synaptic dysfunction and neurodegeneration. Recently developed tau PET imaging tracers are candidate biomarkers for diagnosis and staging of AD.
Objective:
We aimed to investigate the discriminative ability of 18F-THK5317 and 18F-flortaucipir tracers and brain atrophy at different stages of AD, and their respective associations with cognition.
Methods:
Two cohorts, each including 29 participants (healthy controls [HC], prodromal AD, and AD dementia patients), underwent 18F-THK5317 or 18F-flortaucipir PET, T1-weighted MRI, and neuropsychological assessment. For each subject, we quantified regional 18F-THK5317 and 18F-flortaucipir uptake within six bilateral and two composite regions of interest. We assessed global brain atrophy for each individual by quantifying the brain volume index, a measure of brain volume-to-cerebrospinal fluid ratio. We then quantified the discriminative ability of regional 18F-THK5317, 18F-flortaucipir, and brain volume index between diagnostic groups, and their associations with cognition in patients.
Results:
Both 18F-THK5317 and 18F-flortaucipir outperformed global brain atrophy in discriminating between HC and both prodromal AD and AD dementia groups. 18F-THK5317 provided the highest discriminative ability between HC and prodromal AD groups. 18F-flortaucipir performed best at discriminating between prodromal and dementia stages of AD. Across all patients, both tau tracers were predictive of RAVL learning, but only 18F-flortaucipir predicted MMSE.
Conclusion:
Our results warrant further in vivo head-to-head and antemortem-postmortem evaluations. These validation studies are needed to select tracers with high clinical validity as biomarkers for early diagnosis, prognosis, and disease staging, which will facilitate their incorporation in clinical practice and therapeutic trials.
INTRODUCTION
The misfolding and deposition of amyloid-β (Aβ) into plaques and of hyperphosphorylated tau into neurofibrillary tangles represent the pathological hallmarks of Alzheimer’s disease (AD) [1]. However, neurofibrillary tangles are more closely associated with synaptic dysfunction, neurodegeneration, and symptom severity than Aβ plaques [2–5]. The advent of tau PET imaging has allowed to visualize cerebral tau deposits in vivo and is a promising tool for early diagnosis, staging of AD, monitoring disease progression, and contributing to design future anti-tau therapeutics [6–9]. The first generation of tau PET tracers includes 18F-THK5317 (also known as (S)-18F-THK5117) [10] and 18F-flortaucipir (also known as 18F-AV1451 or 18F-T807) [11]. In vitro studies in postmortem brain tissues combining autoradiography imaging and immunohistochemical techniques have shown that both THK5117 [12] and flortaucipir [13–15] have high specificity and selectivity to tau deposits with the paired helical filament conformation that is characteristic of AD. Also, more recent antemortem-postmortem studies have shown a good regional overlap between in vivo 18F-flortaucipir uptake and the density and distribution of AD-type tau neuropathology observed in autopsy brain tissue [16, 17]. However, differences in chemical structures among families of tau tracers may lead to variations in both their number of binding sites and their affinity to tau aggregates, depending on their structural conformation or maturation stage [18, 19]. Recent pathological studies have revealed different conformations of tau tangles depending on their maturation stage: from intracellular pretangles and mature tangles, to extracellular ghost tangles observed at later disease stages, suggesting that different antibodies may bind with different intensity depending on the maturity of the tangles [20]. Thus, there is an ongoing debate about whether, as tangles mature, post-translational events of tau may open up or remove ligand binding sites that can influence the uptake of tau PET tracers.
Mounting evidence from in vivo imaging studies supports the diagnostic and prognostic value of tau PET in AD, which has led to the recent approval of 18F-flortaucipir by the US Food and Drug Administration (FDA) to support diagnosis in patients with suspected AD dementia [21]. As additional tau tracers may become under consideration for clinical approval by regulatory agencies in the near future, it becomes imperative to investigate how different tau tracers compare in their accuracy for AD diagnosis and for tracking disease progression. To date, the performance of 18F-THK5317 and 18F-flortaucipir in discriminating between healthy controls (HC) and different stages of AD is unclear. In parallel, structural magnetic resonance imaging (MRI) techniques that assess global brain atrophy and hippocampal volume are considered valid biomarkers of unspecific neurodegeneration in current research criteria of AD [22]. Although tau PET is known to provide added value over MRI measures of brain atrophy in predicting cognitive deterioration [23], the correlative strength between tau tracer uptake, brain atrophy, and cognitive performance in AD patients is still unclear. The overall goal of this study is to quantify the relationships between tau tracer uptake as measured by either 18F-THK5317 or 18F-flortaucipir tau PET tracers using two demographically and clinically matched cohorts, global brain atrophy as measured by MRI, and cognition. Specifically, we aim to: 1) assess the discriminative ability of 18F-THK5317, 18F-flortaucipir, and global brain atrophy between the different diagnostic groups; and 2) assess the performance of each tau tracer and brain atrophy as predictors of impairment in episodic memory and global cognition in AD patients.
MATERIALS AND METHODS
Study sample
We used cross sectional data from two independent cohorts. 18F-THK5317 data were available from a previous study conducted at Karolinska Institutet (KI) [24], whereas 18F-flortaucipir data were downloaded from the Alzheimer’s Disease Neuroimaging Initiative (ADNI) site. Demographics (age, sex, apolipoprotein [APOE] genotyping, and education), brain volume index (described under “Assessment of global brain atrophy” below), and cognitive performance for all diagnostic groups in each cohort are shown in Table 1.
Table 1
Characteristics of Karolinska Institutet (KI) and Alzheimer’s Disease Neuroimaging Initiative (ADNI) cohorts
| KI cohort | ADNI cohort | Comparison KI versus ADNI Statistical test results | |||||||||
| HC | pAD | AD | Statistical test results | HC | pAD | AD | Statistical test results | HC | pAD | AD | |
| n | 9 | 11 | 9 | 9 | 11 | 9 | |||||
| Age, y | 42 (21) | 69 (7) | 67 (7) | H = 10.71 | 64 (2) | 69 (5) | 71 (7) | H = 8.58 | U = 13.50 | U = 60.50 | U = 27.50 |
| mean (SD) | p = 0.005 | p = 0.01 | p = 0.01 | p > 0.99 | p = 0.27 | ||||||
| (HC < AD) | (HC < pAD) | ||||||||||
| Sex | 3/6 | 5/6 | 2/7 | χ2 = 1.19 | 4/5 | 7/4 | 4/5 | χ2 = 1.01 | χ2 = 0.23 | χ2 = 0.73 | χ2 = 1.00 |
| m/f | p = 0.55 | p = 0.60 | p = 0.63 | p = 0.39 | p = 0.32 | ||||||
| APOE ɛ4 | NA | 6/4 | 8/1 | χ2 = 2.04 | NA | 8/2 | 7/1 | χ2 = 0.18 | NA | χ2 = 0.95 | χ2 = 0.01 |
| positive/negative | p = 0.15 | p = 0.67 | p = 0.33 | p = 0.93 | |||||||
| Education, y | 15 (2) | 12 (3) | 13 (3) | H = 4.66 | 16 (2) | 15 (3) | 16 (3) | H = 1.03 | U = 22 | U = 27 | U = 20 |
| mean (SD) | p = 0.10 | p = 0.60 | p = 0.18 | p = 0.02 | p = 0.07 | ||||||
| Brain volume index | 41.3 (18.4) | 25.1 (8.6) | 17.9 (8.2) | H = 10.31 | 35.5 (9.9) | 27.4 (12.3) | 20.1 (8.0) | H = 7.98 | U = 30 | U = 57 | U = 32 |
| mean (SD) | p = 0.006 | p = 0.02 | p = 0.39 | p = 0.85 | p = 0.49 | ||||||
| (AD < HC) | (AD < HC) | ||||||||||
| MMSE | NA | 28 (3) | 23 (3) | U = 10 | NA | 28 (2) | 22 (4) | U = 4.5 | NA | U = 55 | U = 34.50 |
| mean (SD) | p = 0.002 | p < 0.001 | p = 0.73 | p = 0.62 | |||||||
| RAVL learning | NA | 35 (10) | 21 (6) | U = 7 | NA | 39 (10) | 20 (9) | U = 5 | NA | U = 44 | U = 33.50 |
| mean (SD) | p < 0.001 | p < 0.001 | p = 0.29 | p = 0.56 | |||||||
APOE ɛ4 status was missing for one pAD in the KI cohort, and for one pAD and one AD dementia patient in the ADNI cohort. APOE ɛ4 status was not available in the HC group in the KI cohort, and therefore these data were not collected for the HC group in the ADNI cohort. AD, Alzheimer’s disease; ADNI, Alzheimer’s Disease Neuroimaging Initiative; APOE, apolipoprotein E; H, Kruskal-Wallis statistic; HC, healthy controls; KI, Karolinska Institutet; MMSE, Mini-Mental State Examination; pAD, prodromal Alzheimer’s disease; RAVL, Rey Auditory Verbal Learning; U, Mann-Whitney statistic.
18F-THK5317 (KI cohort)
We drew 18F-THK5317 data from a sample of 29 individuals, which included 9 healthy controls [HC], 11 prodromal AD [pAD; also known as Aβ-positive mild cognitive impairment (MCI) patients or 11C-Pittsburgh compound B (PIB)-positive MCI], and 9 Aβ-positive patients diagnosed with AD dementia [AD dementia] (Table 1). To define Aβ-positivity we used a validated PIB cut-off of 1.41 standardized uptake value ratio (SUVr) with the cerebellar cortex as reference [25]. HCs were recruited from either patients’ relatives or the Clinical Trial Consultants AB (Uppsala University Hospital, Uppsala, Sweden). All HCs underwent an extensive clinical and neuropsychological evaluation in order to exclude any cognitive complaint, known neurologic/psychiatric disorder, or prior head injury. The 9 HCs were previously described in a study from our group [24] and included 5 young (20–30 years old) and 4 older (58–71 years old) individuals. Since—according to classical neuropathology studies—young individuals are not expected to have Aβ deposits in their brain, they did not undergo Aβ PET scans. The older HCs had undergone PIB PET scans and were all found to be Aβ-negative using the 1.41 SUVr cutoff [25], as previously reported [24]. Also, the HC group was deemed to be cognitively unimpaired based on global cognitive composites expressed as z-scores with respect to an external control group available at the Karolinska University Hospital, as previously reported [24]. HCs were all non-smokers and free from medication. All patients with prodromal and AD dementia were recruited from the Memory Clinic, Theme Aging, Karolinska University Hospital Stockholm where they underwent extensive clinical investigations including medical history, MRI scans, neuropsychological assessment, physical examination, laboratory blood tests, APOE genotyping, and cerebrospinal fluid (CSF) biomarker analysis. Their diagnosis was determined in a consensus meeting of neurologists, geriatricians, clinical neuropsychologists, and specialized nurses. The NINCDS-ADRDA [26] and the DSM-IV [27] criteria for dementia of the Alzheimer’s type were fulfilled by all patients with AD, whereas all patients with MCI met the Petersen criteria [28].
Ethical approval was obtained from the regional Human Ethics Committee of Stockholm and the Faculty of Medicine and Radiation Hazard Ethics Committee of Uppsala University Hospital, Sweden. All participants and patients’ caregivers provided written informed consent to participate in the study. The study was conducted in accordance with the ethical standards of the institutional and national research committee and with the 1964 Helsinki declaration and its later amendments or comparable ethical standards [24].
18F-flortaucipir (ADNI cohort)
Data for the 18F-flortaucipir compound were available from the ADNI database (http://adni.loni.usc.edu). The ADNI was launched in 2003 as a public-private partnership, led by Principal Investigator Michael W. Weiner, MD. The primary goal of ADNI has been to test whether serial MRI, PET, other biological markers, and clinical and neuropsychological assessment can be combined to measure the progression of MCI and early AD. All subjects gave written informed consent, as approved by local ethics committees and in accordance with the Declaration of Helsinki. For up-to-date information, see http://www.adni-info.org.
We selected a sample of 29 individuals (9 HCs, 11 prodromal AD [pAD; also known as Aβ-positive MCI], and 9 Aβ-positive patients with AD dementia [AD dementia]) with available MRI and 18F-flortaucipir PET scans from the ADNI database. Although the aim of this study was not to perform a direct comparison of the two tau tracers, we still aimed to match the ADNI cohort to the available KI cohort, so to have comparable statistical power across cohorts. Using R (version 3.6.1), we selected participants from the ADNI database who were closest in mean age, sex, educational attainment, and MMSE score (this last for patients with prodromal AD and AD dementia) to the HC, prodromal AD and AD dementia groups in the KI cohort (Table 1).
Aβ-positivity of patients with prodromal AD and AD dementia was verified based on a summary measure of global cortical uptake (i.e., weighted-average uptake across regions of interest [ROIs] including frontal, anterior/posterior cingulate, lateral parietal, and lateral temporal lobes). We measured Aβ-positivity using 18F-florbetapir or 18F-florbetaben (derived from the UCBERKELEYAV45_11_14_17.csv or UCBERKELEYFBB.csv datasets, ADNI website), and using previously validated cut-offs implemented in ADNI studies (1.11 SUVr for 18F-florbetapir and 1.08 SUVr for 18F-florbetaben, both using the whole cerebellum as reference).
For all participants a complete clinical investigation had been performed (i.e., medical history, MRI/PET scans, neuropsychological assessment, physical examination, laboratory blood tests, APOE genotyping, and CSF sampling). All patients with prodromal AD reported a Clinical Dementia Rating of 0.5 and memory impairment but no dementia. All patients with AD dementia fulfilled the NINCDS-ADRDA criteria [26]. Further demographical information is reported in Table 1.
Neuropsychological assessment
Patients from the KI and ADNI cohorts underwent comprehensive neuropsychological assessments. For the purposes of this study, we used the Mini-Mental State Examination (MMSE) as a measure of global cognitive performance that is widely used both in the clinic and in research studies, and the Rey Auditory Verbal Learning (RAVL) encoding subtest as a measure of episodic memory (RAVL learning), considered a marker of early cognitive impairment in AD. We selected these test measures as they were available in both the KI and ADNI cohorts, to make results across cohorts more comparable. Average values of MMSE and RAVL learning across the prodromal AD and AD dementia patient groups in both cohorts are reported in Table 1.
MRI and PET image acquisition and pre-processing
18F-THK5317 (KI cohort)
All participants underwent a PET scan using 18F-THK5317 and a 3D T1-weighted MRI sequence with field strengths of either 1.5 or 3 Tesla (including MPRAGE/FSPGR/GRE) and various manufacturers (Siemens, GE, Philips). The 18F-THK5317 data were acquired in an ECAT EXACT HR+scanner (Siemens/CTI) or a Discovery ST PET/CT scanner (GE) at the Uppsala PET centre, Uppsala, Sweden. The 18F-THK5317 PET scans were acquired in 22 frames over 60 min (6×10 s, 3×20 s, 2×30 s, 2×60 s, 2×150 s, 4×300 s, and 3×600 s frames) after intravenous injection of 212±42 MBq. PET image acquisitions were reconstructed as previously described [24].
18F-flortaucipir (ADNI cohort)
For each participant we downloaded a 18F-flortaucipir PET scan (in the format “Co-registered, Averaged, Standardized Image and Voxel Size, Uniform Resolution”) and a T1-weighted MRI scan (MPRAGE/IRSPGR/Accelerated Sagittal, or MPRAGE/Sagittal 3D, or Accelerated MPRAGE/Accelerated Sagittal IRSPGR image types, voxel size 1.1×1.1×1.2 mm3) that was closest in time to the PET scan (i.e., within one month on average). The 18F-flortaucipir PET images corresponded to the average uptake of the tracer from 80 to 100 min after radiotracer injection. MRI scans had been acquired within two weeks before or two weeks after the in-clinic assessments. After the acquisition, all PET scans underwent a quality check by visual inspection for both frames (temporal) and slices (spatial), extraction and inspection of header information, co-registration of all frames of the multi-frame studies to the first frame of the image set, assessment of motion from the magnitude of translate/rotate parameters, recombination of co-registered frames to create registered dynamic and registered average image set, reorientation/resampling of images into a standard image matrix and image orientation (160×160×96 voxels 1.5 mm in all dimensions). For further details on ADNI PET procedure, see ADNI 2 PET Technical Procedures in adni-info.org.
PET image processing and quantification
Individual dynamic 18F-THK5317-PET images from the KI cohort were co-registered onto the individual T1-weighted MRI image using PMOD v.3.5 software (PMOD Technologies Ltd., Adliswil, Switzerland). The reference Logan graphical method was applied to the 30–60 min 18F-THK5317 PET acquisition interval using the cerebellar grey matter (GM) as reference, which resulted in parametric images representing the 18F-THK5317 distribution volume ratio (DVR) [24]. In the ADNI cohort, we co-registered the 80–100 min averaged 18F-flortaucipir PET images onto the corresponding individual T1-weighted MRI images using Statistical Parametric Mapping (SPM8) implemented in Matlab environment (Matlab R2019a).
The same image processing protocol was applied to image data from both tracers. For all participants from both the KI and the ADNI cohorts, we segmented the T1-weighted MRI images into grey and white matter (GM and WM, respectively) tissue classes using SPM8 software’s unified segmentation, using a corroborated pipeline from our group [24, 29, 30]. We then used the inverse non-linear transformation from the T1-weighted MRI segmentation step to warp the Hammers probabilistic atlas [31] from the Montreal Neurological Institute (MNI) space to each individual’s native T1-weighted MRI space. We multiplied the resulting individual atlases by the corresponding binarized individual GM masks, thus obtaining individual GM atlases. We quantified the SUVr of the 18F-flortaucipir PET scans using the cerebellar GM as reference, extracted from the T1-weighted MRI segmentation.
Regions of interest for PET uptake evaluation
To evaluate the uptake of both tau PET tracers, we selected four bilateral ROIs from the Hammers GM atlas (i.e., fusiform gyrus, parahippocampal gyrus, middle and inferior temporal gyrus, and posterior cingulate cortex) that had been previously reported to be typical regions of tau accumulation in AD [24]. Since our study included prodromal and dementia stages of AD, we intended to cover different stages where tau progressively accumulates according to Braak and Braak descriptions [1], from early deposition in fusiform and parahippocampal regions of the medial temporal cortex, toward the lateral temporal (middle and inferior temporal gyrus) and then the posterior cingulate cortex, which is typically affected at later stages. We also evaluated tau PET uptake in two composite bilateral GM ROIs according to the classical neuropathological staging of tau pathology and consistent with the composite regions as defined in our previous study [24]:
• A limbic ROI (Braak stages III–IV), comprising hippocampi, amygdalae, parahippocampal, fusiform, middle and inferior temporal, orbital and straight frontal gyri, temporal poles, and parietal-temporal-occipital junctions;
• An isocortical ROI (Braak stages V–VI), comprising all isocortical regions except for the precentral and postcentral gyri.
Given the well-established affinity of 18F-THK5317 (and of 18F-flortaucipir to a lesser extent) for the monoamine oxidase-B (MAO-B) enzyme (mainly in caudate, putamen, and thalamus) [18, 32, 33], we included only low MAO-B load regions for the analysis of both tracers.
Assessment of global brain atrophy
To improve comparability of atrophy measures between the KI and the ADNI cohorts, we favored an index of global brain atrophy that is robust to between-scanners variability. We used a previously validated method to quantify the brain volume-to-CSF volume index (here referred to as “brain volume index”) [34]. To quantify this index, total GM volume, total WM volume, and total CSF volume were automatically segmented using FreeSurfer 5.3.0 (http://surfer.nmr.mgh.harvard.edu/). The brain volume index was then calculated as (Total GM + Total WM)/Total CSF. Lower values of the brain volume index correspond to greater global brain atrophy. The brain volume index has already been reported as a marker of neurodegeneration and used as a measure of disease progression [34]. Due to the relative ease of computation and interpretation, the brain volume index has promising potential for use in the context of a memory clinic [34].
Statistical analysis
Within each cohort, we performed statistical comparisons among diagnostic groups using the non-parametric Kruskal-Wallis or Mann-Whitney tests for continuous variables (demographics, brain volume index, MMSE and RAVL learning), and the Chi-square (χ2) test for categorical variables. We estimated the areas under the receiver operating characteristic (ROC) curves (AUC) to assess the accuracy of regional tracer uptake (18F-THK5317 DVR or 18F-flortaucipir SUVr) to discriminate between diagnostic groups. We then combined prodromal AD and AD dementia patients into a single group (n = 20) and applied linear regression models to assess the ability of regional 18F-THK5317 DVR, regional 18F-flortaucipir SUVr, and brain volume index to predict cognitive performance (MMSE and RAVL learning) using age, sex, and education as covariates, as well as the ability of each tau tracer to predict the brain volume index using age and sex as covariates. Normality of the residuals was verified for all linear regression analyses using the Shapiro-Wilk test. Statistical significance was set at p < 0.05, two-tailed. Statistical analyses and graphical displays were performed using GraphPad Prism 9.0.0.
RESULTS
Characteristics of the study samples
The demographics, brain volume index, MMSE, and RAVL learning scores of the two cohorts are presented in Table 1. Within each cohort, the brain volume index was lower in the AD dementia group compared with the HC group, and both MMSE and RAVL learning scores were lower in the AD dementia group compared with the pAD group in both the KI and ADNI cohorts. There were no overall differences in age, sex, APOE ɛ4, and education between the two cohorts. For each diagnostic group, there were no statistically significant differences between the KI and the ADNI cohorts in brain volume index, MMSE and RAVL learning. Overall, the statistical comparisons presented in Table 1 showed that the KI and ADNI cohorts were comparable in terms of demographics and disease severity as measured by the brain volume index and cognitive performance. The HCs in the KI sample were younger than in the ADNI cohort (Mann-Whitney U = 13.50, p = 0.01), and the pAD group had higher education in the ADNI compared to the KI cohort (Mann-Whitney U = 27, p = 0.02). We performed supplementary analyses by restricting the HC group of the KI sample to a subset of n = 4 older adults aged 63±6 years, and for these analyses there were no significant differences in age between the HC groups of the KI and ADNI cohorts (Supplementary Table 1). Of note, to account for potential confounding effects of age, sex, or education, we used these variables as covariates in subsequent statistical analyses.
Performance of 18F-THK5317, 18F-flortaucipir, and brain volume index to discriminate between different diagnostic groups
Figure 1 shows averaged 18F-THK5317 (Logan DVR) and 18F-flortaucipir (SUVr) PET uptake patterns for each of the diagnostic groups within each cohort. 18F-THK5317 showed a similarly high uptake in pAD and AD dementia when compared to HC. 18F-flortaucipir uptake demonstrated a progressively increasing retention from HC, pAD, and AD dementia groups (Fig. 1). The discriminative abilities of regional tau uptake from both tracers and of the brain volume index, as measured by the AUC of the ROC analyses, are presented in Table 2. Regional uptake of both tracers showed high accuracy (AUC > 0.93) to discriminate between AD dementia and HC in all brain regions, which was higher than that using the brain volume index (AUC = 0.86–0.88). This finding was confirmed when the KI cohort was restricted to the subset of older HCs (Supplementary Table 2).
Fig. 1
Surface projections of averaged tau PET scans within each diagnostic group in the KI cohort (18F-THK5317) and the ADNI cohort (18F-flortaucipir). Individual PET images were normalized to MNI space, smoothed with an 8-mm Gaussian filter, averaged across all individuals within each diagnostic group, and projected into standard MNI space using BrainNet Viewer software for visualization purposes. AD, Alzheimer’s disease; DVR, distribution volume ratio; SUVr, standardized uptake volume ratio.
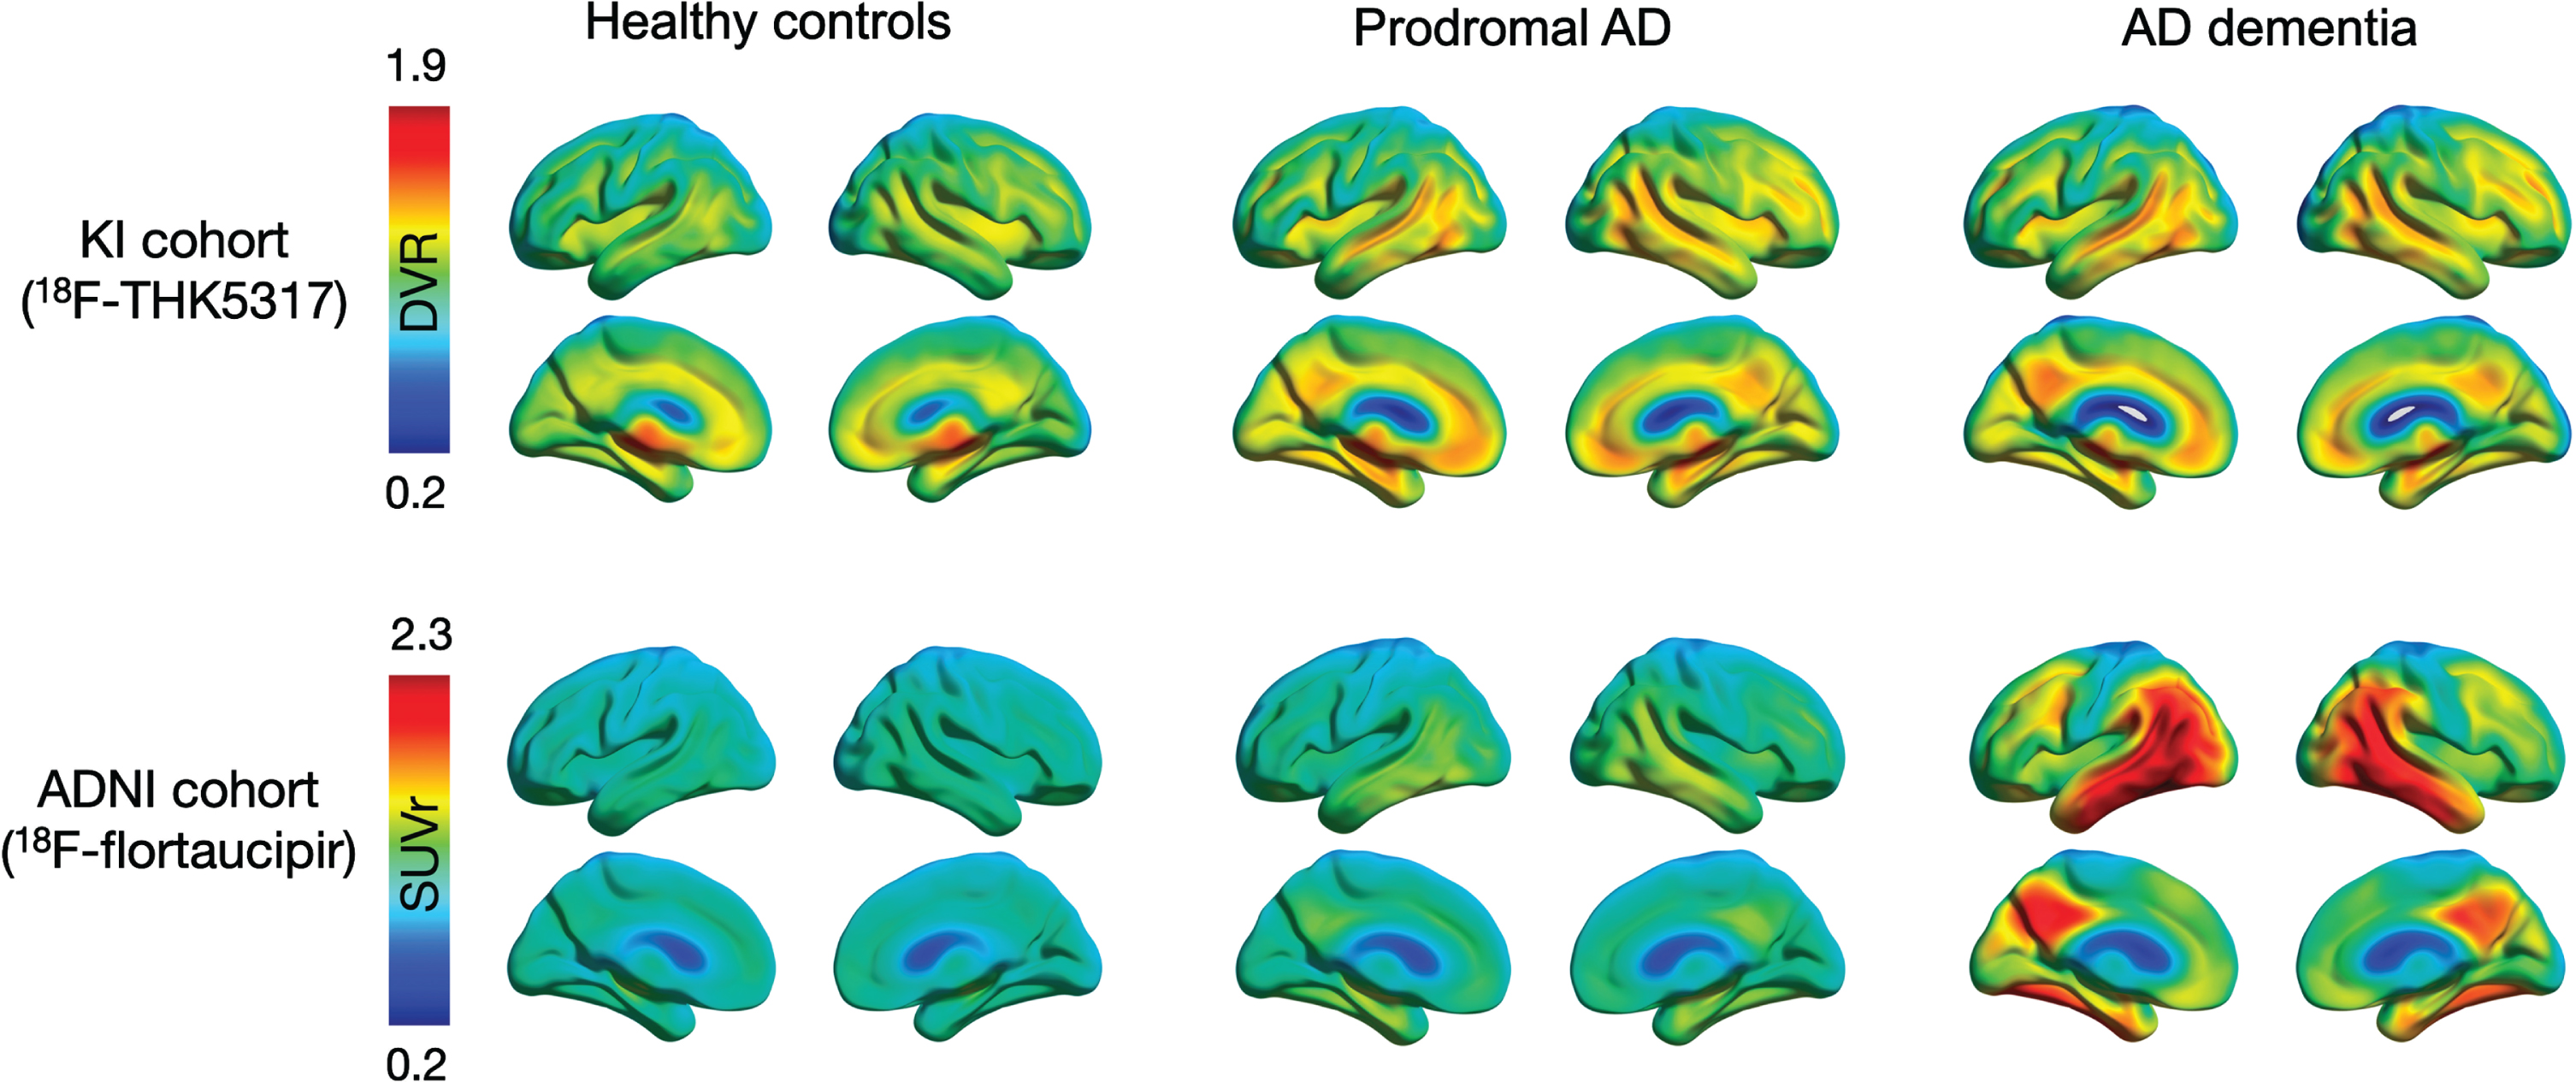
Table 2
Discriminative ability of regional 18F-THK5317 DVR, 18F-flortaucipir SUVr, and brain volume index across diagnostic groups in the KI and the ADNI cohorts
| AD dementia versus healthy controls | Prodromal AD versus healthy controls | AD dementia versus prodromal AD | ||||
| KI (regional 18F-THK5317 or brain volume index) | ADNI (18F-flortaucipir or brain volume index) | KI (regional 18F-THK5317 or brain volume index) | ADNI (18F-flortaucipir or brain volume index) | KI (regional 18F-THK5317 or brain volume index) | ADNI (18F-flortaucipir or brain volume index) | |
| AUC (SE) | AUC (SE) | AUC (SE) | AUC (SE) | AUC (SE) | AUC (SE) | |
| p | p | p | p | p | p | |
| Fusiform gyrus tau | 0.96 (0.04) | 0.98 (0.03) | 0.97 (0.03) | 0.79 (0.11) | 0.58 (0.13) | 0.85 (0.09) |
| p < 0.001*** | p < 0.001*** | p < 0.001*** | p = 0.03* | p = 0.57 | p = 0.009** | |
| Parahippocampal gyrus tau | 0.99 (0.02) | 0.98 (0.03) | 0.97 (0.04) | 0.84 (0.09) | 0.58 (0.13) | 0.82 (0.10) |
| p < 0.001*** | p < 0.001*** | p < 0.001*** | p = 0.01* | p = 0.57 | p = 0.02* | |
| Middle and inferior temporal gyrus tau | 1.0 (0.0) | 1.0 (0.0) | 0.98 (0.03) | 0.81 (0.10) | 0.66 (0.13) | 0.84 (0.09) |
| p < 0.001*** | p < 0.001*** | p < 0.001*** | p = 0.02* | p = 0.24 | p = 0.01* | |
| Posterior cingulate cortex tau | 0.89 (0.09) | 0.93 (0.07) | 0.89 (0.07) | 0.72 (0.12) | 0.62 (0.13) | 0.80 (0.11) |
| p = 0.005** | p = 0.002** | p = 0.003** | p = 0.10 | p = 0.38 | p = 0.03* | |
| Limbic composite tau | 1.0 (0.0) | 0.98 (0.03) | 1.0 (0.0) | 0.82 (0.10) | 0.53 (0.13) | 0.81 (0.11) |
| p < 0.001*** | p < 0.001*** | p < 0.001*** | p = 0.02* | p = 0.85 | p = 0.02* | |
| Isocortical composite tau | 1.0 (0.0) | 0.93 (0.07) | 0.96 (0.04) | 0.78 (0.11) | 0.60 (0.13) | 0.80 (0.11) |
| p < 0.001*** | p = 0.002** | p < 0.001*** | p = 0.04* | p = 0.47 | p = 0.03* | |
| Brain volume index | 0.88 (0.09) | 0.86 (0.09) | 0.78 (0.12) | 0.73 (0.12) | 0.78 (0.11) | 0.71 (0.12) |
| p = 0.007** | p = 0.009** | p = 0.04* | p = 0.09 | p = 0.04* | p = 0.12 | |
AD, Alzheimer’s disease; ADNI, Alzheimer’s Disease Neuroimaging Initiative; AUC, area under the curve; SE, standard error. *p < 0.05; **p < 0.01; ***p < 0.001.
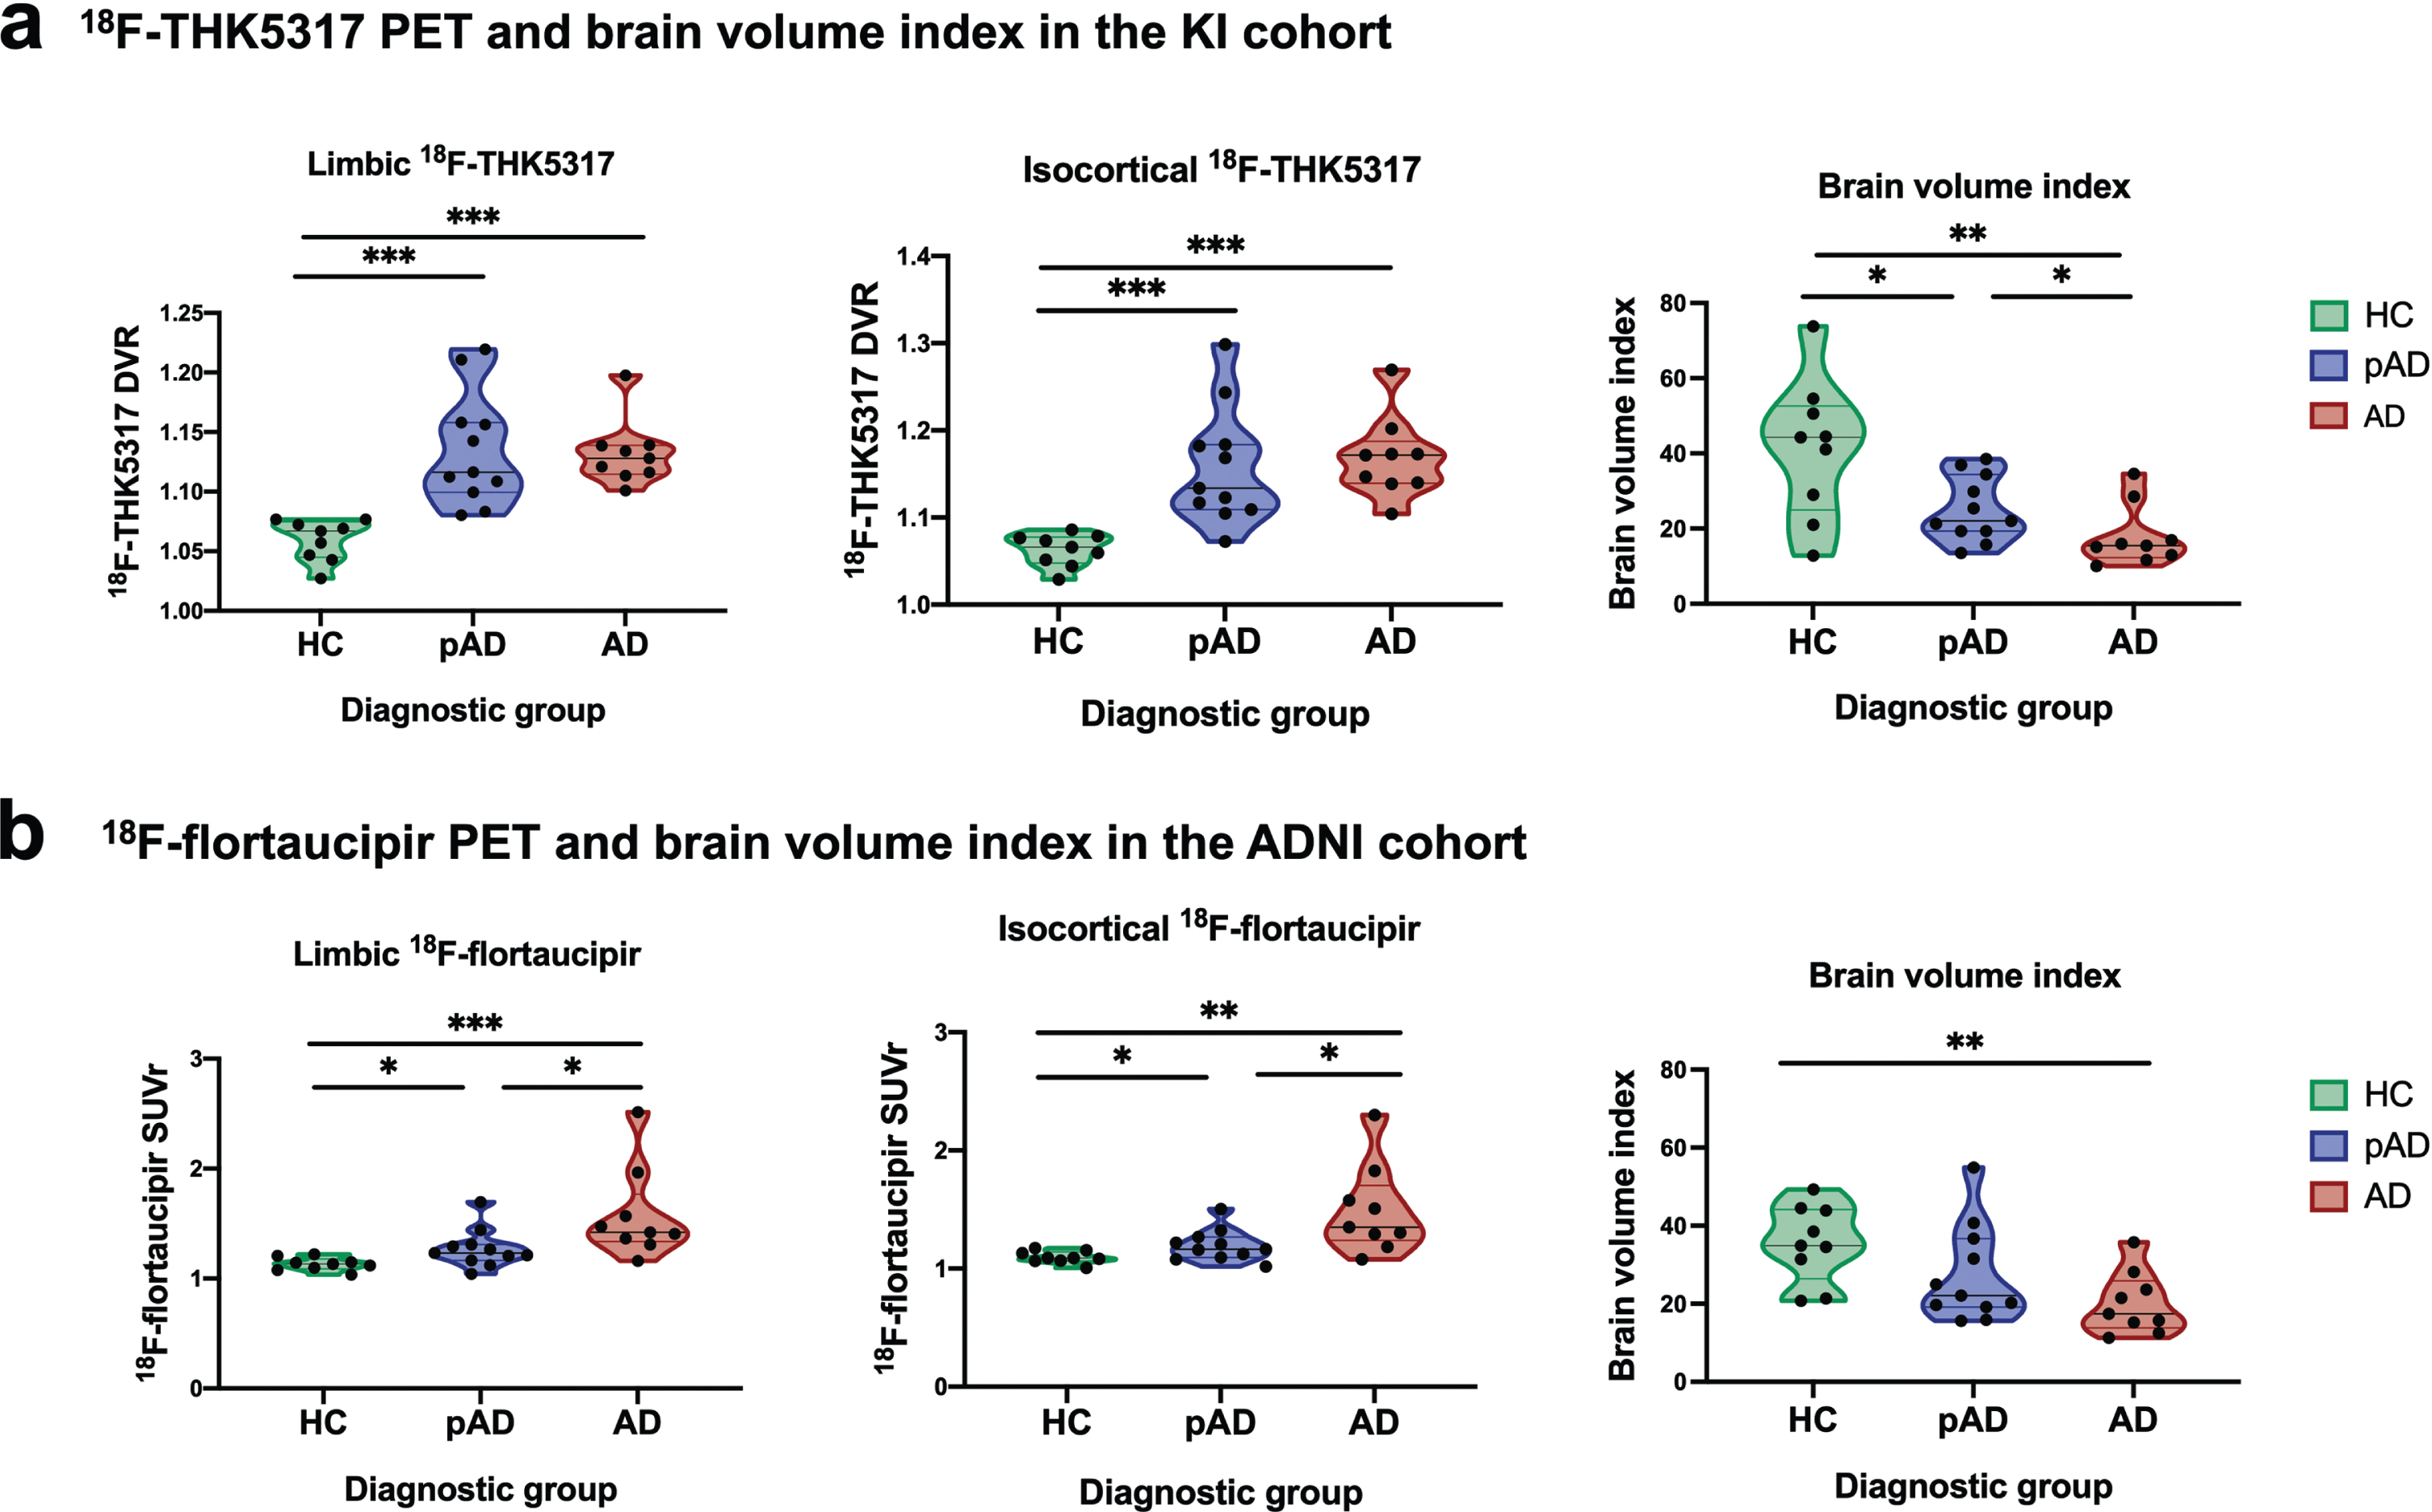
Violin plots (Fig. 2) illustrate the discriminative ability of 18F-THK5317 DVR and 18F-flortaucipir SUVr in the limbic and isocortical composite regions, and of the brain volume index for each diagnostic group in the KI cohort (Fig. 2a) and in the ADNI cohort (Fig. 2b); significant results are indicated (*p < 0.05; **p < 0.01; ***p < 0.001). In the KI cohort, both limbic and composite 18F-THK5317 had high discriminative ability between HC and both pAD and AD dementia groups but were not able to discriminate between pAD and AD dementia groups, while the brain volume index could discriminate pair-wise among all diagnostic groups (Fig. 2a). These findings were confirmed when the KI cohort was restricted to the subset of older HCs (Supplementary Fig. 1). In the ADNI cohort, isocortical 18F-flortaucipir could discriminate pair-wise among all diagnostic groups, while the brain volume index could only discriminate between the HCs and patients with AD dementia (Fig. 2b).
Fig. 2
Violin plots illustrating patterns of tau PET uptake as measured by 18F-THK5317 and 18F-flortaucipir in the limbic and iscortical composite regions, as well as brain volume index across healthy controls, prodromal AD and AD dementia groups in the KI (a) and ADNI (b) cohorts. AD, Alzheimer’s disease dementia; DVR, distribution volume ratio; pAD, prodromal Alzheimer’s disease; SUVr, standardized uptake volume ratio. Statistical significance of discriminative ability as measured by receiver operating characteristic (ROC) area under the curve (AUC) analyses is indicated: *p < 0.05, **p < 0.01, ***p < 0.001.
Compared with the brain volume index, isocortical 18F-THK5317 and 18F-flortaucipir were better able to discriminate between pAD and HC (AUC = 0.96 and AUC = 0.78, respectively). Regarding their ability to discriminate between the prodromal and the dementia stages of AD, 18F-flortaucipir provided significant accuracy (isocortical AUC = 0.80), which was higher than that of brain volume index (AUC = 0.71) (Table 2).
Ability of regional tau PET (18F-THK5317 or 18F-flortaucipir) and brain volume index to predict cognitive performance in AD patients
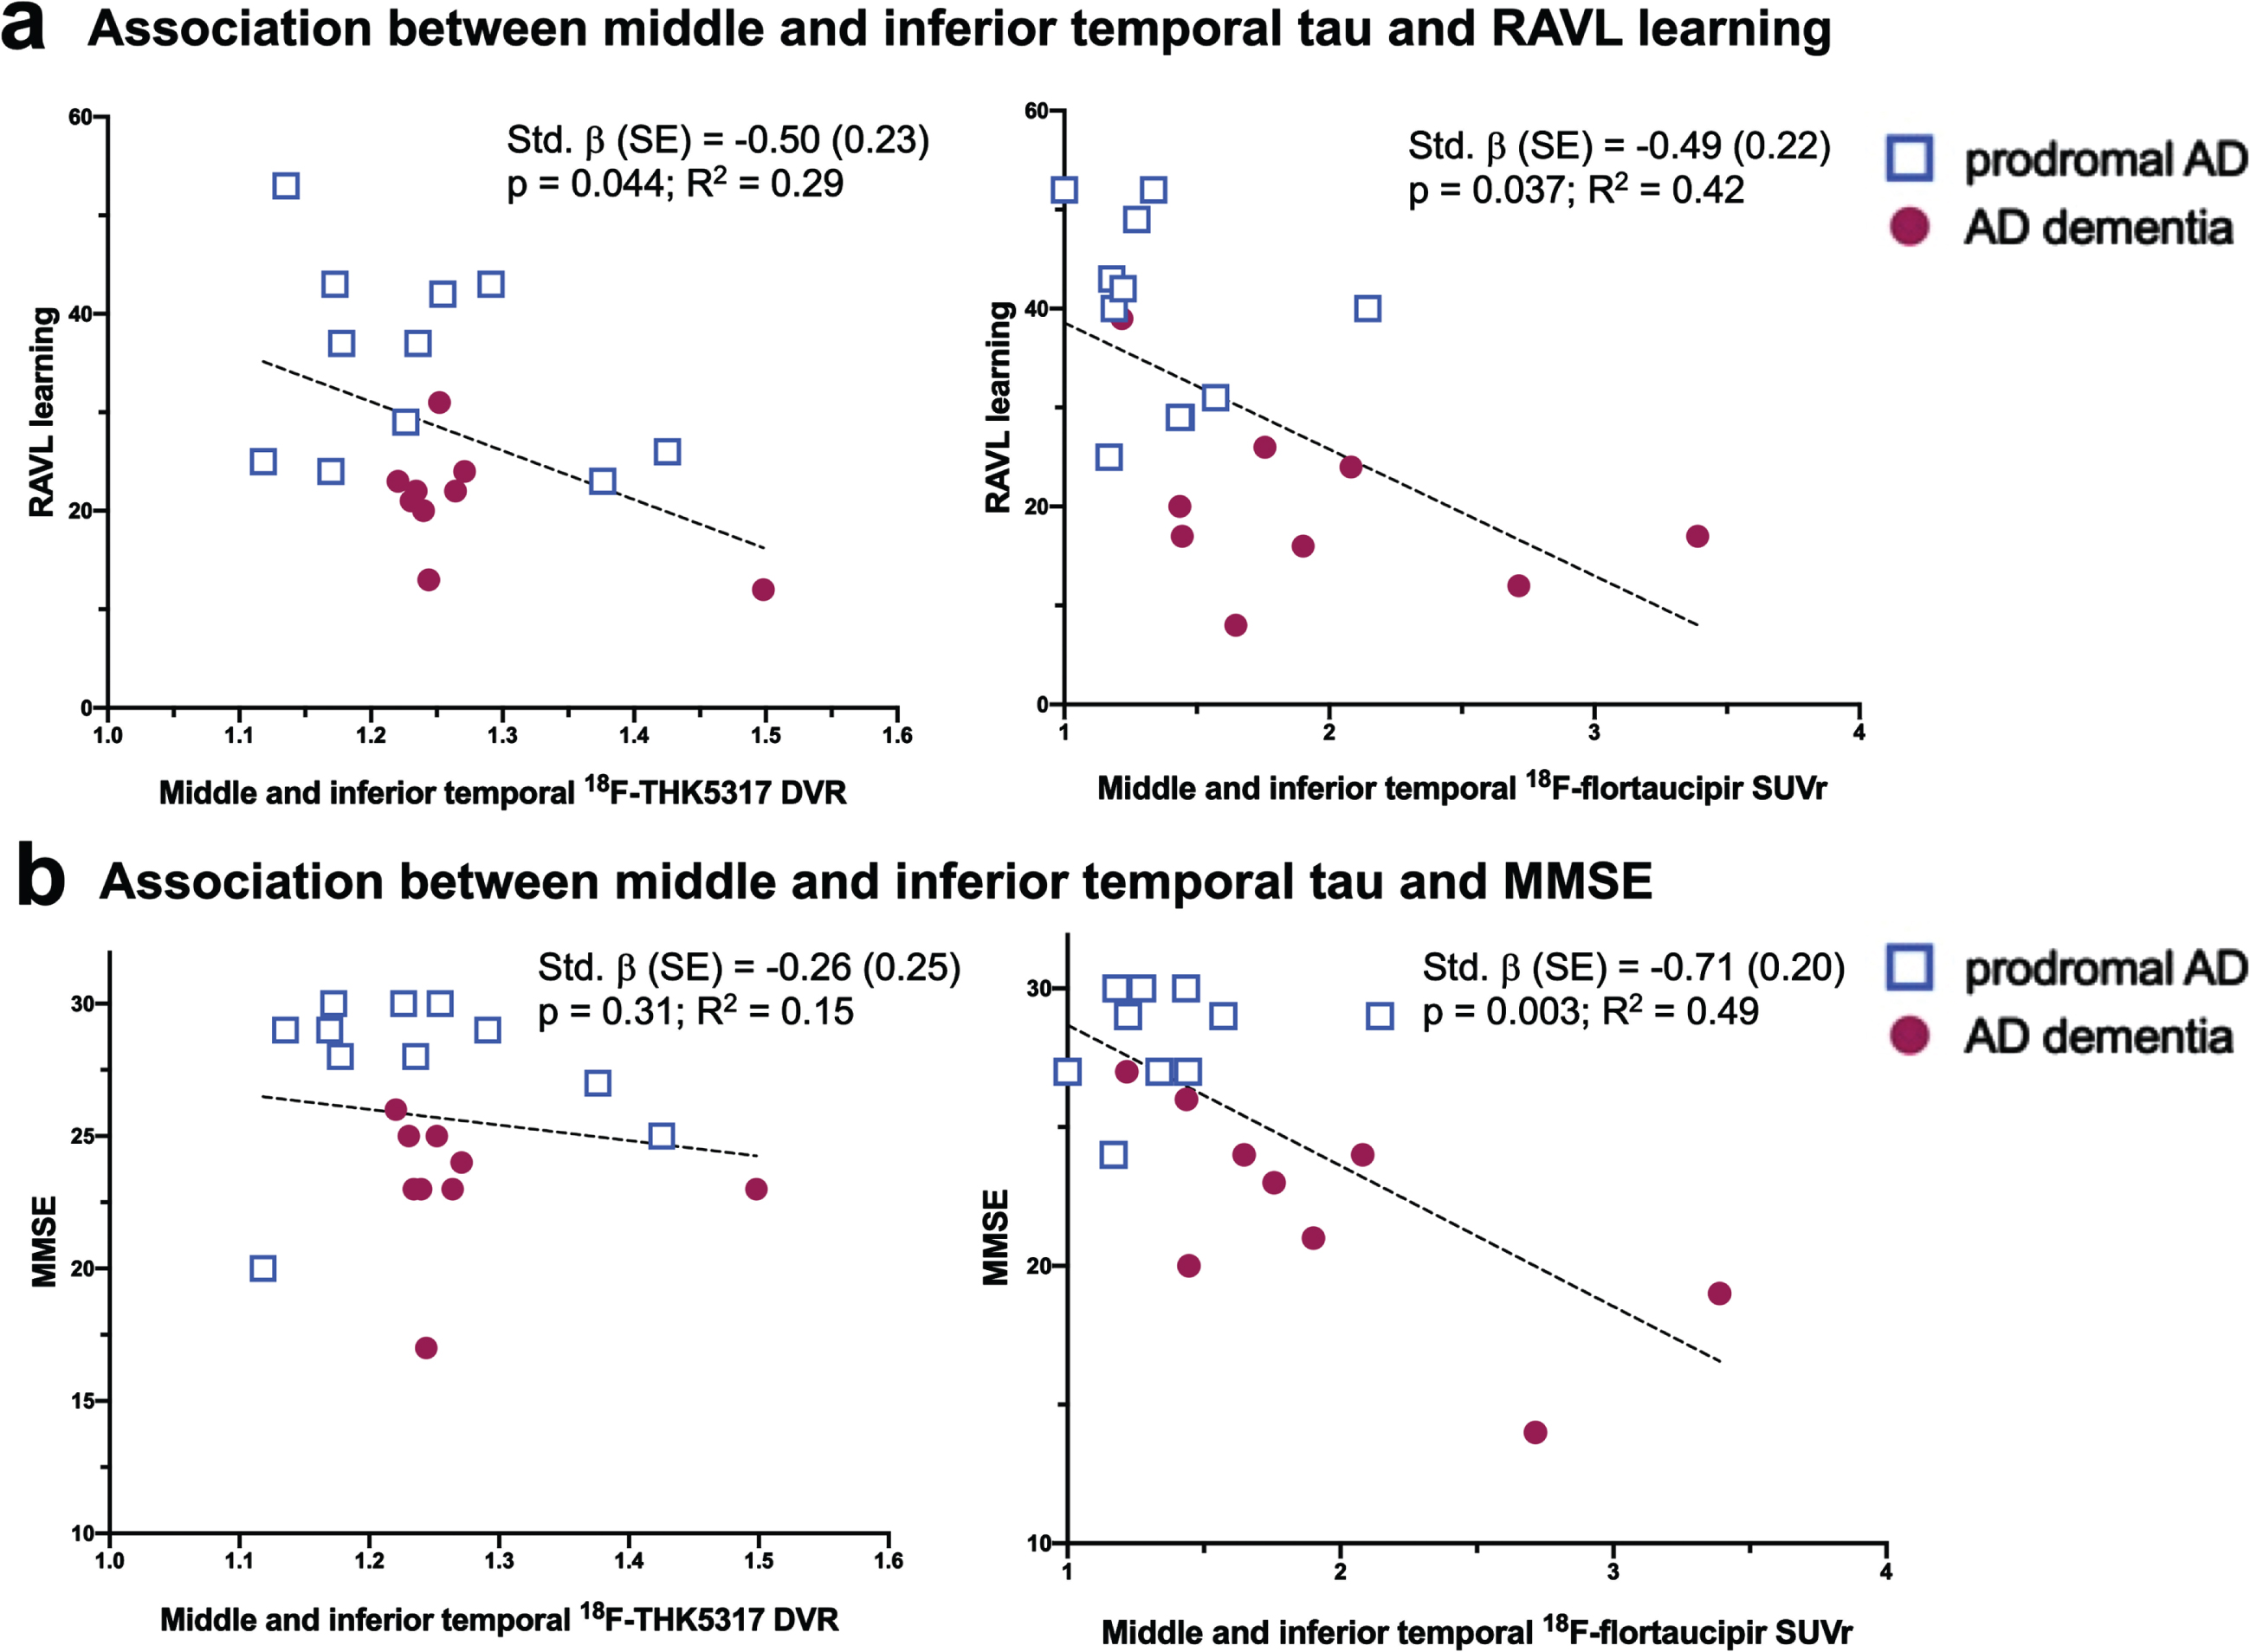
Within the combined group of pAD and AD dementia patients, the brain volume index did not significantly predict global cognition (MMSE) nor episodic memory (RAVL learning) in the KI or ADNI cohorts, separately. In contrast, both regional 18F-THK5317 and 18F-flortaucipir were predictive of lower episodic memory. In particular, 18F-THK5317 uptake in the parahippocampal gyrus (std. β [SE] = –0.53 [0.22], p = 0.027) and middle and inferior temporal gyrus (std. β [SE] = –0.50 [0.23], p = 0.044) were predictive of lower RAVL learning scores, with the respective models accounting for 33% and 29% of the variance in RAVL learning (Table 3, Fig. 3). Regional 18F-flortaucipir uptake was predictive of episodic memory deficits involving more widespread regions. In particular, regional 18F-flortaucipir was predictive of lower RAVL learning scores in all ROIs except for the limbic composite, with std. β ranging between –0.48 and –0.56; the regression models accounted for up to 41–45% of the total variance in RAVL learning. 18F-THK5317 was not predictive of global cognition as measured by MMSE in any of the assessed ROI. 18F-flortaucipir was strongly predictive of MMSE in all ROIs, with the best performance reported in the middle and inferior temporal gyrus (std. β [SE] = –0.71 [0.20], p = 0.003), and in the isocortical composite (std. β [SE] = –0.70 [0.20], p = 0.003), with regression models accounting for nearly 50% of the variance in MMSE (Table 3, Fig. 3). Finally, we found that neither 18F-THK5317 nor 18F-flortaucipir uptake in any ROI was predictive of the brain volume index, where age and sex were used as covariates.
Table 3
Results of linear regression models of cognitive performance (RAVL learning, MMSE) as predicted by regional tau uptake (18F-THK5317 DVR, 18F-flortaucipir SUVr) across the AD continuum including prodromal AD and AD dementia patients
| RAVL learning | MMSE | ||||
| 18F-THK5317 (KI cohort) | 18F-flortaucipir (ADNI cohort) | 18F-THK5317 (KI cohort) | 18F-flortaucipir (ADNI cohort) | ||
| Fusiform gyrus tau | Std. β (SE) | –0.23 (0.26) | –0.51 (0.22) | 0.16 (0.26) | –0.69 (0.22) |
| p-value | p = 0.40 | p = 0.036* | p = 0.54 | p = 0.007** | |
| R2 | 0.11 | 0.42 | 0.11 | 0.44 | |
| Parahippocampal gyrus tau | Std. β (SE) | –0.53 (0.22) | –0.56 (0.25) | –0.23 (0.25) | –0.79 (0.24) |
| p-value | p = 0.027* | p = 0.039* | p = 0.37 | p = 0.005** | |
| R2 | 0.33 | 0.42 | 0.14 | 0.45 | |
| Middle and inferior temporal gyrus tau | Std. β (SE) | –0.50 (0.23) | –0.49 (0.22) | –0.26 (0.25) | –0.71 (0.20) |
| p-value | p = 0.044* | p = 0.037* | p = 0.31 | p = 0.003** | |
| R2 | 0.29 | 0.42 | 0.15 | 0.49 | |
| Posterior cingulate cortex tau | Std. β (SE) | –0.45 (0.23) | –0.53 (0.21) | –0.21 (0.25) | –0.70 (0.20) |
| p-value | p = 0.073 | p = 0.023* | p = 0.42 | p = 0.004** | |
| R2 | 0.25 | 0.45 | 0.13 | 0.48 | |
| Limbic composite tau | Std. β (SE) | –0.43 (0.24) | –0.44 (0.23) | 0.08 (0.26) | –0.69 (0.22) |
| p-value | p = 0.092 | p = 0.076 | p = 0.75 | p = 0.006** | |
| R2 | 0.23 | 0.37 | 0.09 | 0.44 | |
| Isocortical composite tau | Std. β (SE) | –0.46 (0.22) | –0.48 (0.21) | –0.14 (0.25) | –0.70 (0.20) |
| p-value | p = 0.056 | p = 0.042* | p = 0.58 | p = 0.003** | |
| R2 | 0.27 | 0.41 | 0.11 | 0.49 | |
All regression models included age, sex and education as covariates. *p < 0.05; **p < 0.01; ***p < 0.001. AD, Alzheimer’s disease; ADNI, Alzheimer’s Disease Neuroimaging Initiative; DVR, distribution volume ratio; KI, Karolinska Institutet; MMSE, Mini-Mental State Examination; RAVL, Rey Auditory Verbal Learning; SE, standard error; SUVr, standardized uptake value ratio.
Fig. 3
Scatterplot diagrams illustrating the relationship between tau PET uptake as measured by 18F-THK5317 and 18F-flortaucipir and the RAVL learning test of episodic memory (a) and the MMSE as a measure of global cognition (b). AD, Alzheimer’s disease; DVR, distribution volume ratio; SUVr, standardized uptake volume ratio.
DISCUSSION
In this study, we assessed the discriminative ability of 18F-THK5317 and 18F-flortaucipir—two first-generation tau PET tracers—and the brain volume index, as well as their respective associations with cognitive performance in two demographically and clinically matched cohorts, each including HCs, prodromal AD, and AD dementia patients. Our study provides evidence that, compared to global brain atrophy, tau pathology as measured by either tau tracer results in an improved ability for discriminating between HC and both pAD and AD dementia groups. 18F-THK5317 performed best at discriminating between the HC and pAD groups. Both tau tracers were predictive of episodic memory deficits across patients diagnosed with prodromal or AD dementia; 18F-flortaucipir also predicted global cognition. Tau deposition as measured by 18F-THK5317 or 18F-flortaucipir was significantly associated with worse cognitive performance, while the brain volume index was not associated with cognition. Our results are consistent with previous studies reporting that 18F-flortaucipir is more strongly correlated to cognition than structural MRI measures in AD patients [35–38]. The heterogeneous MRI acquisition protocols in our study precluded quantification of cortical thickness, which would have allowed a more fair comparison between tau PET and MRI biomarkers than using the relatively simpler brain volume index method. For 18F-THK5317, a previous study found that episodic memory was better predicted by tau deposition than by hypometabolism as measured by 18F-FDG PET, a well-established marker of synaptic dysfunction and neurodegeneration [30]. Compared with 18F-THK5317, 18F-FDG PET was more strongly predictive of global cognition; also, 18F-FDG mediated the effect of 18F-THK5317 on global cognition, meaning that high tau may be present in the brain without affecting global cognitive performance, but when hypometabolism is present then a deficit in global cognition is observed [30]. Together with those previous findings, our results support the concept that tau deposits are predictive of cognitive performance in AD, adding distinct and complementary information to that given by biomarkers of neurodegeneration such as hypometabolism or brain atrophy.
18F-THK5317 and 18F-flortaucipir were differentially related to cognition. Regional 18F-THK5317 in the middle and inferior temporal gyrus and the parahippocampal gyrus was predictive of episodic memory, while none of the regional uptake values of 18F-THK5317 were predictive of global cognitive performance. A recent study reported that 18F-THK5317 was more closely correlated to subsequent change in global cognitive performance over a 4-year follow-up than to baseline global cognition (MMSE) [29]. Also, the prognostic ability of 18F-THK5317 outperformed that of hypometabolism (18F-FDG PET) and structural markers of atrophy [29], supporting the concept that 18F-THK5317 is a promising early marker of pathology that precedes overt cognitive decline with high prognostic accuracy in AD. Consistent with previous studies [39], the regional widespread uptake of 18F-flortaucipir was predictive of both episodic memory and global cognition, with a stronger relationship to global cognition. We can speculate that 18F-THK5317 is most sensitive in prodromal stages of AD where patients present with a cognitive impairment that is not severe enough to interfere with daily activities and thus cause dementia. Contrarily,18F-flortaucipir displays a strong tracer uptake especially in the most severe stages of AD dementia. This is in keeping with previous studies reporting that tau deposition measured by 18F-flortaucipir emerges as a continuum from normal aging to patients with AD dementia [40]. We can further hypothesize that the two tracers have different affinities to earlier versus later types of tau deposits, with 18F-THK5317 being more sensitive to the early types of tau deposits, and 18F-flortaucipir having greater affinity toward more mature tangles. In this regard, we speculate that the early types of tau deposits might cause deficits in selective cognitive domains such as episodic memory that is known to be related to early medial temporal lobe pathology, while the presence of more mature and widespread tangles would lead to more global cognitive impairment. However, antemortem/postmortem studies would be needed to ascertain whether this observation is verified with neuropathological data. Autoradiography work with 18F-flortaucipir has shown that it preferentially binds to mature tau deposits compared to pretangles or ghost tangles [13] and studies with other tracers are ongoing [20]. These types of studies are particularly lacking for the 18F-THK5317 tracer; therefore, a possible influence of the level of maturity of the tau tangles on tracer uptake remains speculative.
In our study, we did not find a significant association between tau PET uptake and brain structure as assessed with the brain volume index. Other studies have reported a significant local correlation between tau and cortical thinning in patients with AD [36, 37, 41, 42]. Structural MRI data for the KI cohort were acquired using multiple scanners with different field strengths (i.e., 1.5 T and 3 T), which precluded extracting regional cortical thickness measures. Instead, the brain volume index is a simple measure of global brain atrophy but has the advantage of being robust to different MRI acquisition parameters, and thus good applicability in clinical practice [34]. Since previous studies have found that tau PET is better correlated to subsequent rather than concurrent atrophy [43, 44], future longitudinal studies would be needed to investigate whether baseline measures of tau would be significantly associated to subsequent brain atrophy.
This study has some limitations. Data for the two tracers were obtained from two independent cohorts. Although this study was not aimed at directly comparing the two tracers, the KI and ADNI cohorts were well matched in terms of disease severity as given by the global brain volume index, episodic memory (RAVL learning), and global cognition (MMSE). Furthermore, PET data from both cohorts have been quantified using the same atlas, in order to ensure a good reliability in the regional uptake values. While a comparison using a more comprehensive cognitive battery spanning multiple cognitive domains would have been interesting, we opted to restrict the analyses of cognitive performance to MMSE and RAVL learning as these were the two tests available in both the KI and the ADNI cohorts, to make results across cohorts more comparable. The HC group in the KI cohort was younger than in the ADNI cohort, and the pAD group in the ADNI cohort had a higher education level than the pAD group in the KI cohort. To account for the potential confounding influence of age, sex, and education, these variables were used as covariates in the linear regression models predicting cognitive performance. In addition, a replication of the study by restricting the HCs in the KI cohort to four age-matched older individuals showed that the overall results remained the same.
The sample sizes in both cohorts were limited, and larger samples are needed for robust estimates of the discriminative ability and to perform statistical analyses correcting for multiple comparisons. However, having used unique and original data in the KI cohort (18F-THK5317) we were limited by the existing pilot study sample, and we selected the same sample size from the ADNI database to ensure a comparable statistical power across cohorts.
Finally, first-generation tau PET tracers have shown different degrees of off-target binding affinity that could confound the results [32]. For example, in vitro studies using tracers from the THK family reported that THK5351 binds to MAO-B especially in the basal ganglia [18]; flortaucipir showed a weaker off-target binding to MAO-B compared to THK5351, but moderate levels of off-target binding to monoamine oxidase-A (MAO-A) and neuromelanin, especially involving the basal ganglia and the choroid plexus [18, 45, 46]. Furthermore, our previous study combining in silico and in vivo data of 18F-THK5317 and MAO-B tracer 11C-deuterium-L-deprenyl [33] reported that about 11-18% of the 18F-THK5317 binding in low MAO-B enzyme brain regions such as the isocortex could be due to off-target binding to MAO-B, while in sub-cortical regions characterized by high MAO-B enzyme concentration this fraction could increase up to 25–84%. To minimize the possible confounding effect of off-target binding, we selected ROIs that were previously reported to be minimally affected by off-target binding for both tau PET tracers. This well-known limitation of first-generation tau tracers has stimulated research toward reducing off-target binding effects. For example, the binding of 18F-PM-PBB3/APN-1607 was recently reported to be minimally displaced in the presence of the MAO-A inhibitor clorgiline or the MAO-B inhibitor selegiline, in AD frontal cortex homogenates, suggesting that 18F-PM-PBB3/APN-1607 has only minimal cross-reactivity with off-target binding sites on monoamine oxidases [47]. These new developments will enable tau PET tracers with enhanced accuracy to quantify tau in AD.
CONCLUSIONS
In conclusion, tau PET imaging is a promising imaging tool as a diagnostic biomarker in AD, with both 18F-THK5317 and 18F-flortaucipir tracers providing a stronger ability than a measure of global brain atrophy to discriminate between AD patient groups and HCs. Our study also showed that 18F-flortaucipir is a potential biomarker for AD disease staging, whereas 18F-THK5317 holds promise at the earliest stages of the disease to discriminate between patients with prodromal AD and healthy individuals. Our results warrant further in vivo head-to-head and antemortem-postmortem evaluations to elucidate what types of tau deposits the tracers are binding to, and whether different tau tracers may preferentially bind to early versus late conformations of tau aggregates in AD. Additional validation studies are thus needed to evaluate and select those tracers with clinical validity as promising biomarkers for early diagnosis, prognosis and disease staging, which is expected to facilitate their incorporation in clinical practice and therapeutic trials.
ACKNOWLEDGMENTS
The authors would like to express their sincere gratitude to all of the participants at the Karolinska Institutet study. We would also like to thank the staff at the Karolinska University Hospital Memory Clinic, and at the Uppsala PET Center. ER-V receives funding from the Swedish Alzheimer Foundation (Alzheimerfonden), the Swedish Dementia Association (Demensfonden), the Gun & Bertil Stohne’s Foundation, and the Gamla Tjänarinnor Foundation. AN receives funding from the Swedish Research Council [grant numbers 05817, 2017-02965, 2017-06086], the Swedish Foundation for Strategic Research (SSF) [grant number RB13-0192], the Swedish Alzheimer Foundation (Alzheimerfonden), the Swedish Brain Foundation (Hjärnfonden), the Regional Agreement on Medical Training and Clinical Research (ALF) between the Stockholm County Council, and from the Karolinska Institutet Center for Innovative Medicine KI (CIMED). Funding sources had no role in study design, collection, analysis and interpretation of data, writing of the report or decision to submit the article for publication.
Part of the data used in preparation of this article were obtained from the Alzheimer’s Disease Neuroimaging Initiative (ADNI) database (http://adni.loni.usc.edu). As such, the investigators within the ADNI contributed to the design and implementation of ADNI and/or provided data but did not participate in analysis or writing of this report. A complete listing of ADNI investigators can be found at: http://adni.loni.usc.edu/wp-content/uploads/how_to_apply/ADNI_Acknowledgement_List.pdf. Data collection and sharing for this project was funded by ADNI (National Institutes of Health Grant U01 AG024904) and DOD ADNI (Department of Defense award number W81XWH-12-2-0012). ADNI is funded by the National Institute on Aging, the National Institute of Biomedical Imaging and Bioengineering, and through generous contributions from the following: AbbVie, Alzheimer’s Association; Alzheimer’s Drug Discovery Foundation; Araclon Biotech; BioClinica, Inc.; Biogen; Bristol-Myers Squibb Company; CereSpir, Inc.; Cogstate; Eisai Inc.; Elan Pharmaceuticals, Inc.; Eli Lilly and Company; EuroImmun; F. Hoffmann-La Roche Ltd and its affiliated company Genentech, Inc.; Fujirebio; GE Healthcare; IXICO Ltd.; Janssen Alzheimer Immunotherapy Research & Development, LLC.; Johnson & Johnson Pharmaceutical Research & Development LLC.; Lumosity; Lundbeck; Merck & Co., Inc.; Meso Scale Diagnostics, LLC.; NeuroRx Research; Neurotrack Technologies; Novartis Pharmaceuticals Corporation; Pfizer Inc.; Piramal Imaging; Servier; Takeda Pharmaceutical Company; and Transition Therapeutics. The Canadian Institutes of Health Research is providing funds to support ADNI clinical sites in Canada. Private sector contributions are facilitated by the Foundation for the National Institutes of Health (http://www.fnih.org). The grantee organization is the Northern California Institute for Research and Education, and the study is coordinated by the Alzheimer’s Therapeutic Research Institute at the University of Southern California. ADNI data are disseminated by the Laboratory for Neuro Imaging at the University of Southern California.
Authors’ disclosures available online (https://www.j-alz.com/manuscript-disclosures/21-0614r1).
SUPPLEMENTARY MATERIAL
[1] The supplementary material is available in the electronic version of this article: https://dx.doi.org/10.3233/JAD-210614.
REFERENCES
[1] | Braak H , Braak E ((1991) ) Neuropathological stageing of Alzheimer-related changes. Acta Neuropathol 82: , 239–259. |
[2] | Arriagada PV , Growdon JH , Hedley-Whyte ET , Hyman BT ((1992) ) Neurofibrillary tangles but not senile plaques parallel duration and severity of Alzheimer’s disease. Neurology 42: , 631–631. |
[3] | Bierer LM , Hof PR , Purohit DP , Carlin L , Schmeidler J , Davis KL , Perl DP ((1995) ) Neocortical neurofibrillary tangles correlate with dementia severity in Alzheimer’s disease. Arch Neurol 52: , 81–88. |
[4] | Giannakopoulos P , Herrmann FR , Bussière T , Bouras C , Kövari E , Perl DP , Morrison JH , Gold G , Hof PR ((2003) ) Tangle and neuron numbers, but not amyloid load, predict cognitive status in Alzheimer’s disease. Neurology 60: , 1495–1500. |
[5] | Nelson PT , Alafuzoff I , Bigio EH , Bouras C , Braak H , Cairns NJ , Castellani RJ , Crain BJ , Davies P , Del Tredici K , Duyckaerts C , Frosch MP , Haroutunian V , Hof PR , Hulette CM , Hyman BT , Iwatsubo T , Jellinger KA , Jicha GA , Kövari E , Kukull WA , Leverenz JB , Love S , Mackenzie IR , Mann DM , Masliah E , McKee AC , Montine TJ , Morris JC , Schneider JA , Sonnen JA , Thal DR , Trojanowski JQ , Troncoso JC , Wisniewski T , Woltjer RL , Beach TG ((2012) ) Correlation of Alzheimer disease neuropathologic changes with cognitive status: A review of the literature. J Neuropathol Exp Neurol 71: , 362–381. |
[6] | Leuzy A , Chiotis K , Lemoine L , Gillberg P-G , Almkvist O , Rodriguez-Vieitez E , Nordberg A ((2019) ) Tau PET imaging in neurodegenerative tauopathies-still a challenge. Mol Psychiatry 24: , 1112–1134. |
[7] | Okamura N , Harada R , Furukawa K , Furumoto S , Tago T , Yanai K , Arai H , Kudo Y ((2016) ) Advances in the development of tau PET radiotracers and their clinical applications. Ageing Res Rev 30: , 107–113. |
[8] | Nordberg A ((2015) ) Dementia in 2014. Towards early diagnosis in Alzheimer disease. Nat Rev Neurol 11: , 69–70. |
[9] | Beyer L , Brendel M ((2020) ) Imaging of tau pathology in neurodegenerative diseases: An update. Semin Nucl Med 51: , 253–263. |
[10] | Okamura N , Furumoto S , Harada R , Tago T , Yoshikawa T , Fodero-Tavoletti M , Mulligan RS , Villemagne VL , Akatsu H , Yamamoto T , Arai H , Iwata R , Yanai K , Kudo Y ((2013) ) Novel 18F-labeled arylquinoline derivatives for noninvasive imaging of tau pathology in Alzheimer disease. J Nucl Med 54: , 1420–1427. |
[11] | Chien DT , Bahri S , Szardenings AK , Walsh JC , Mu F , Su M-Y , Shankle WR , Elizarov A , Kolb HC ((2013) ) Early clinical PET imaging results with the novel PHF-tau radioligand [F-18]-T807. J Alzheimers Dis 34: , 457–468. |
[12] | Lemoine L , Saint-Aubert L , Marutle A , Antoni G , Eriksson JP , Ghetti B , Okamura N , Nennesmo I , Gillberg P-G , Nordberg A ((2015) ) Visualization of regional tau deposits using 3H-THK5117 in Alzheimer brain tissue. Acta Neuropathol Commun 3: , 40. |
[13] | Lowe VJ , Curran G , Fang P , Liesinger AM , Josephs KA , Parisi JE , Kantarci K , Boeve BF , Pandey MK , Bruinsma T , Knopman DS , Jones DT , Petrucelli L , Cook CN , Graff-Radford NR , Dickson DW , Petersen RC , Jack CR , Murray ME ((2016) ) An autoradiographic evaluation of AV-1451 Tau PET in dementia. Acta Neuropathol Commun 4: , 58. |
[14] | Marquié M , Siao Tick Chong M , Antón-Fernández A , Verwer EE , Sáez-Calveras N , Meltzer AC , Ramanan P , Amaral AC , Gonzalez J , Normandin MD , Frosch MP , Gómez-Isla T ((2017) ) [F-18]-AV-1451 binding correlates with postmortem neurofibrillary tangle Braak staging. Acta Neuropathol 134: , 619–628. |
[15] | Marquié M , Normandin MD , Vanderburg CR , Costantino IM , Bien EA , Rycyna LG , Klunk WE , Mathis CA , Ikonomovic MD , Debnath ML , Vasdev N , Dickerson BC , Gomperts SN , Growdon JH , Johnson KA , Frosch MP , Hyman BT , Gómez-Isla T ((2015) ) Validating novel tau positron emission tomography tracer [F-18]-AV-1451 (T807) on postmortem brain tissue. Ann Neurol 78: , 787–800. |
[16] | Fleisher AS , Pontecorvo MJ , Devous MD , Lu M , Arora AK , Truocchio SP , Aldea P , Flitter M , Locascio T , Devine M , Siderowf A , Beach TG , Montine TJ , Serrano GE , Curtis C , Perrin A , Salloway S , Daniel M , Wellman C , Joshi AD , Irwin DJ , Lowe VJ , Seeley WW , Ikonomovic MD , Masdeu JC , Kennedy I , Harris T , Navitsky M , Southekal S , Mintun MA , A16 Study Investigators ((2020) ) Positron emission tomography imaging with [18F]flortaucipir and postmortem assessment of Alzheimer disease neuropathologic changes. JAMA Neurol 77: , 829–839. |
[17] | Lowe VJ , Lundt ES , Albertson SM , Min H-K , Fang P , Przybelski SA , Senjem ML , Schwarz CG , Kantarci K , Boeve B , Jones DT , Reichard RR , Tranovich JF , Hanna Al-Shaikh FS , Knopman DS , Jack CR , Dickson DW , Petersen RC , Murray ME ((2020) ) Tau-positron emission tomography correlates with neuropathology findings. Alzheimers Dement 16: , 561–571. |
[18] | Lemoine L , Gillberg P-G , Svedberg M , Stepanov V , Jia Z , Huang J , Nag S , Tian H , Ghetti B , Okamura N , Higuchi M , Halldin C , Nordberg A ((2017) ) Comparative binding properties of the tau PET tracers THK5117, THK5351, PBB3, and T807 in postmortem Alzheimer brains. Alzheimers Res Ther 9: , 96. |
[19] | Saint-Aubert L , Lemoine L , Chiotis K , Leuzy A , Rodriguez-Vieitez E , Nordberg A ((2017) ) Tau PET imaging: Present and future directions. Mol Neurodegener 12: , 19. |
[20] | Moloney CM , Lowe VJ , Murray ME ((2021) ) Visualization of neurofibrillary tangle maturity in Alzheimer’s disease: A clinicopathologic perspective for biomarker research. Alzheimers Dement, doi: 10.1002/alz.12321. |
[21] | Kim JS ((2020) ) Tau imaging: New era of neuroimaging for Alzheimer’s disease. Nucl Med Mol Imaging 54: , 161–162. |
[22] | Jack CR , Bennett DA , Blennow K , Carrillo MC , Dunn B , Haeberlein SB , Holtzman DM , Jagust W , Jessen F , Karlawish J , Liu E , Molinuevo JL , Montine T , Phelps C , Rankin KP , Rowe CC , Scheltens P , Siemers E , Snyder HM , Sperling R , Elliott C , Masliah E , Ryan L , Silverberg N ((2018) ) NIA-AA Research Framework: Toward a biological definition of Alzheimer’s disease. Alzheimers Dement 14: , 535–562. |
[23] | Malpetti M , Kievit RA , Passamonti L , Jones PS , Tsvetanov KA , Rittman T , Mak E , Nicastro N , Bevan-Jones WR , Su L , Hong YT , Fryer TD , Aigbirhio FI , O’Brien JT , Rowe JB ((2020) ) Microglial activation and tau burden predict cognitive decline in Alzheimer’s disease. Brain 143: , 1588–1602. |
[24] | Chiotis K , Saint-Aubert L , Savitcheva I , Jelic V , Andersen P , Jonasson M , Eriksson J , Lubberink M , Almkvist O , Wall A , Antoni G , Nordberg A ((2016) ) Imaging in-vivo tau pathology in Alzheimer’s disease with THK5317 PET in a multimodal paradigm. Eur J Nucl Med Mol Imaging 43: , 1686–1699. |
[25] | Nordberg A , Carter SF , Rinne J , Drzezga A , Brooks DJ , Vandenberghe R , Perani D , Forsberg A , Långström B , Scheinin N , Karrasch M , Någren K , Grimmer T , Miederer I , Edison P , Okello A , Van Laere K , Nelissen N , Vandenbulcke M , Garibotto V , Almkvist O , Kalbe E , Hinz R , Herholz K ((2013) ) A European multicentre PET study of fibrillar amyloid in Alzheimer’s disease. Eur J Nucl Med Mol Imaging 40: , 104–114. |
[26] | McKhann G , Drachman D , Folstein M , Katzman R , Price D , Stadlan EM ((1984) ) Clinical diagnosis of Alzheimer’s disease: Report of the NINCDS-ADRDA Work Group under the auspices of Department of Health and Human Services Task Force on Alzheimer’s Disease. Neurology 34: , 939–944. |
[27] | American Psychiatric Association ((1995) ), Diagnostic and statistical manual of mental disorders: DSM-IV. |
[28] | Petersen RC , Smith GE , Waring SC , Ivnik RJ , Tangalos EG , Kokmen E ((1999) ) Mild cognitive impairment: Clinical characterization and outcome. Arch Neurol 56: , 303–308. |
[29] | Chiotis K , Savitcheva I , Poulakis K , Saint-Aubert L , Wall A , Antoni G , Nordberg A ((2020) ) [18F]THK5317 imaging as a tool for predicting prospective cognitive decline in Alzheimer’s disease. Mol Psychiatry, doi: 10.1038/s41380-020-0815-4. |
[30] | Saint-Aubert L , Almkvist O , Chiotis K , Almeida R , Wall A , Nordberg A ((2016) ) Regional tau deposition measured by [18F]THK5317 positron emission tomography is associated to cognition via glucose metabolism in Alzheimer’s disease. Alzheimers Res Ther 8: , 38. |
[31] | Hammers A , Allom R , Koepp MJ , Free SL , Myers R , Lemieux L , Mitchell TN , Brooks DJ , Duncan JS ((2003) ) Three-dimensional maximum probability atlas of the human brain, with particular reference to the temporal lobe. Hum Brain Mapp 19: , 224–247. |
[32] | Lemoine L , Leuzy A , Chiotis K , Rodriguez-Vieitez E , Nordberg A ((2018) ) Tau positron emission tomography imaging in tauopathies: The added hurdle of off-target binding. Alzheimers Dement (Amst) 10: , 232–236. |
[33] | Murugan NA , Chiotis K , Rodriguez-Vieitez E , Lemoine L , Ågren H , Nordberg A ((2019) ) Cross-interaction of tau PET tracers with monoamine oxidase B: Evidence from in silico modelling and in vivo imaging. Eur J Nucl Med Mol Imaging 46: , 1369–1382. |
[34] | Orellana C , Ferreira D , Muehlboeck J-S , Mecocci P , Vellas B , Tsolaki M , Kłoszewska I , Soininen H , Lovestone S , Simmons A , Wahlund L-O , Westman E , for the AddNeuronMed consortium and for the Alzheimer’s Disease Neuroimaging Initiative ((2016) ) Measuring global brain atrophy with the brain volume/cerebrospinal fluid index: Normative values, cut-offs and clinical associations. Neurodegener Dis 16: , 77–86. |
[35] | Digma LA , Madsen JR , Reas ET , Dale AM , Brewer JB , Banks SJ ((2019) ) Tau and atrophy: Domain-specific relationships with cognition. Alzheimers Res Ther 11: , 65. |
[36] | Ossenkoppele R , Smith R , Ohlsson T , Strandberg O , Mattsson N , Insel PS , Palmqvist S , Hansson O ((2019) ) Associations between tau, Aβ, and cortical thickness with cognition in Alzheimer disease. Neurology 92: , e601–e612. |
[37] | Maass A , Landau S , Baker SL , Horng A , Lockhart SN , La Joie R , Rabinovici GD , Jagust WJ ((2017) ) Comparison of multiple tau-PET measures as biomarkers in aging and Alzheimer’s disease. NeuroImage 157: , 448–463. |
[38] | Bejanin A , Schonhaut DR , La Joie R , Kramer JH , Baker SL , Sosa N , Ayakta N , Cantwell A , Janabi M , Lauriola M , O’Neil JP , Gorno-Tempini ML , Miller ZA , Rosen HJ , Miller BL , Jagust WJ , Rabinovici GD ((2017) ) Tau pathology and neurodegeneration contribute to cognitive impairment in Alzheimer’s disease. Brain 140: , 3286–3300. |
[39] | Pontecorvo MJ , Devous MD , Navitsky M , Lu M , Salloway S , Schaerf FW , Jennings D , Arora AK , McGeehan A , Lim NC , Xiong H , Joshi AD , Siderowf A , Mintun MA , for the 18F-AV-1451-A05 investigators ((2017) ) Relationships between flortaucipir PET tau binding and amyloid burden, clinical diagnosis, age and cognition. Brain 140: , 748–763. |
[40] | Schöll M , Maass A , Mattsson N , Ashton NJ , Blennow K , Zetterberg H , Jagust W ((2019) ) Biomarkers for tau pathology. Mol Cell Neurosci 97: , 18–33. |
[41] | Mattsson N , Insel PS , Donohue M , Jögi J , Ossenkoppele R , Olsson T , Schöll M , Smith R , Hansson O ((2019) ) Predicting diagnosis and cognition with 18 F-AV-1451 tau PET and structural MRI in Alzheimer’s disease. Alzheimers Dement 15: , 570–580. |
[42] | Cho H , Choi JY , Hwang MS , Lee JH , Kim YJ , Lee HM , Lyoo CH , Ryu YH , Lee MS ((2016) ) Tau PET in Alzheimer disease and mild cognitive impairment. Neurology 87: , 375–383. |
[43] | Das SR , Xie L , Wisse LEM , Ittyerah R , Tustison NJ , Dickerson BC , Yushkevich PA , Wolk DA , Alzheimer’s Disease Neuroimaging Initiative ((2018) ) Longitudinal and cross-sectional structural magnetic resonance imaging correlates of AV-1451 uptake. Neurobiol Aging 66: , 49–58. |
[44] | La Joie R , Visani AV , Baker SL , Brown JA , Bourakova V , Cha J , Chaudhary K , Edwards L , Iaccarino L , Janabi M , Lesman-Segev OH , Miller ZA , Perry DC , O’Neil JP , Pham J , Rojas JC , Rosen HJ , Seeley WW , Tsai RM , Miller BL , Jagust WJ , Rabinovici GD ((2020) ) Prospective longitudinal atrophy in Alzheimer’s disease correlates with the intensity and topography of baseline tau-PET. Sci Transl Med 12: , eaau5732. |
[45] | Drake LR , Pham JM , Desmond TJ , Mossine AV , Lee SJ , Kilbourn MR , Koeppe RA , Brooks AF , Scott PJH ((2019) ) Identification of AV-1451 as a weak, nonselective inhibitor of monoamine oxidase. ACS Chem Neurosci 10: , 3839–3846. |
[46] | Vermeiren C , Motte P , Viot D , Mairet-Coello G , Courade J-P , Citron M , Mercier J , Hannestad J , Gillard M ((2018) ) The tau positron-emission tomography tracer AV-1451 binds with similar affinities to tau fibrils and monoamine oxidases. Mov Disord 33: , 273–281. |
[47] | Tagai K , Ono M , Kubota M , Kitamura S , Takahata K , Seki C , Takado Y , Shinotoh H , Sano Y , Yamamoto Y , Matsuoka K , Takuwa H , Shimojo M , Takahashi M , Kawamura K , Kikuchi T , Okada M , Akiyama H , Suzuki H , Onaya M , Takeda T , Arai K , Arai N , Araki N , Saito Y , Trojanowski JQ , Lee VMY , Mishra SK , Yamaguchi Y , Kimura Y , Ichise M , Tomita Y , Zhang M-R , Suhara T , Shigeta M , Sahara N , Higuchi M , Shimada H ((2021) ) High-contrast in vivo imaging of tau pathologies in Alzheimer’s and non-Alzheimer’s disease tauopathies. Neuron 109: , 42–58.e8. |


