
Chronic Kidney Disease Associated with Worsening White Matter Disease and Ventricular Enlargement
Abstract
Background:
Chronic kidney disease (CKD), a growing public health issue in the elderly, is associated with increased risk of cognitive impairment.
Objective:
To investigate the mechanisms through which CKD impacts brain health using longitudinal imaging.
Methods:
We identified 97 participants (74 CKD and 23 non-CKD) from the BRINK (BRain IN Kidney Disease), a longitudinal study of CKD with two MRI scans (baseline and 3-year follow-up). We measured the associations between baseline and change in kidney disease biomarkers of estimated glomerular filtration rate (eGFR) and urinary albumin to creatinine ratio (UACR), considered a measure of microvascular inflammation, and imaging outcomes of cortical thickness and ventricular volume from structural MRI, white matter hyperintensities (WMH) volume from FLAIR images, and fractional anisotropy of the corpus callosum (FACC).
Results:
There were white matter-specific changes as observed by increased WMH volume and decreased FACC in CKD participants, as well as ventricular volume increase in both CKD and non-CKD groups reflective of aging-related changes. Decline in eGFR was associated with decrease in the FACC, suggesting that subtle early white matter changes due to kidney disease can be captured using DTI. An increase in UACR was associated with increase in ventricular volume.
Conclusion:
Our results support the role of eGFR as a measure of kidney microvascular disease which is associated with concurrent white matter damage in CKD. Future work is needed to investigate the possible link between endothelial microvascular inflammation (as measured by an increased UACR) and ventricular volume increase.
INTRODUCTION
It is increasingly recognized that chronic kidney disease (CKD), a growing public health issue in the elderly, has a significant impact on brain health. Associations between kidney function and brain structural abnormalities have been found in several cross-sectional studies [1–10]. In our recent cross-sectional analysis in participants of the BRINK (BRain IN Kidney Disease) [11], a longitudinal study of cognitive impairment and stroke in CKD and non-CKD in participants, we found that biomarkers of kidney disease (estimated glomerular filtration rate [eGFR] and urinary albumin to creatinine ratio [UACR]) were associated with cerebrovascular and neurodegenerative MRI brain changes, even after accounting for vascular risk factors at baseline. However, longitudinal studies are important to confirm or discern the pathological underpinnings of the brain changes observed in cross-sectional studies and will aid in understanding the impact of change in kidney biomarkers on the brain changes.
In this work, our goal was to examine the association of CKD with longitudinal brain changes. We focused on two main analyses in BRINK participants with longitudinal images: 1) change in MRI outcomes by CKD status (no CKD [eGFR≥60 ml/min/1.73m2 and CKD [eGFR < 60 ml/min/1.73 m2]) and 2) association of baseline and change in kidney biomarkers with change in MRI outcomes. Since the brain and kidneys are end organs on parallel trajectories, subject to shared cardiovascular risk factors, with microvascular pathologic processes [12], we hypothesized that participants with CKD would experience significant worsening of MRI biomarkers indicative of cerebrovascular disease (CVD). We assessed longitudinal changes in structural MRI in temporal lobe meta region of interest (ROI) which are typically observed in the elderly due to aging and pathology, and white matter hyperintensities (WMH) from FLAIR and fractional anisotropy of the corpus callosum (FACC) using diffusion tensor imaging (DTI) as markers of white matter disease indicative of vascular damage. DTI is a sensitive marker of microstructural changes in the brain and has been shown to be associated with worsening cerebrovascular disease [13]. We chose the FACC as we previously found that FACC is a useful biomarker of CVD. Specifically, the loss of microstructural integrity in the corpus callosum was associated with worsening of systemic vascular health and cerebrovascular injury even after accounting for Alzheimer’s disease pathologies (which are common in elderly) [14]. More recently, we reported that FACC is a significant predictor of cognitive decline [15]. In addition, we included ventricular volume as a non-specific marker of aging and neurodegeneration. We limited the sMRI cortical thickness regions to temporal lobe meta ROI because this has been widely used to investigate neurodegeneration in the context of aging and dementia and also our cross-sectional analyses confirmed that the primary region associated with worsening kidney disease markers was temporal lobe thickness [11].
METHODS
MRI cohort in the BRINK study
BRINK is a longitudinal observational cohort study of the epidemiology of cognitive impairment and stroke in patients with CKD and an eGFR < 60 ml/min per 1.73 m2 [15]. The primary goals of BRINK are to gain further knowledge regarding the epidemiology, natural history, and pathophysiology of cognitive impairment in people with CKD (eGFR < 60 ml/min per 1.73 m2) who have not yet transitioned to dialysis and have not received a kidney transplant. BRINK participants were recruited from four healthcare institutions in Minneapolis: Hennepin HealthCare, the University of Minnesota Medical Center, the Department of Veterans Affairs Medical Center, and HealthPartners Institute for Education and Research. To establish participants’ CKD status, we screened the electronic medical records of potential participants at each of institution for at least one eGFR < 60 (minimal or no CKD) ml/min/1.73 m2 during the previous year. Participants were then classified into CKD groups using serum creatinine collected at their baseline BRINK visit and the CKD-EPI creatinine equation [13].
The Institutional Review Boards of collaborating institutions approved the study (Hennepin HealthCare approval #: 11-3393, U of M: 1203M11122, VA: 4364-B, and HealthPartners: A12-282). Informed consent for the BRINK study and BRINK MRI was obtained from all participants at the time of the baseline BRINK visit. The inclusion and exclusion criteria as well as assessments are discussed in detail in the Supplementary Material.
Definition of renal biomarkers and longitudinal change
eGFR
Prior to August 2020, eGFR for BRINK participants was calculated using the Chronic Kidney Disease Epidemiology Collaboration (CKD-EPI) equation with serum creatinine, age, a sex coefficient, and a race coefficient for Blacks [16]. The race coefficient has the result of increasing eGFR by 14–16% over eGFR calculated without the race coefficient for Black participants [17]. Researchers at several medical schools no longer report estimated GFR with adjustment for race to prevent systemic assignment of higher eGFR values for Blacks than for non-Blacks with the same age, sex, and creatinine values (https://medicine.uw.edu/news/uw-medicine-exclude-race-calculation-egfr-measure-kidney-function). Recent studies have described the potential effects of removing the race coefficient, including increased estimated prevalence of CKD in US Black cohorts, and decreased eligibility for kidney transplants due to higher estimated eGFRs in Black CKD patients [18]. To minimize potential bias due to the race coefficient [19], eGFR for BRINK participants was calculated using the CKD-EPI equation without the race coefficient at both baseline and 3-year follow up. Although this will result in a lower eGFR estimate for Blacks in the study, as we are measuring change in eGFR using the same eGFR measure, it is likely to have minimal effect on the results of our analyses of the relation between change in eGFR and MRI outcomes.
UACR
Urinary albumin creatinine ratio was calculated from urinary albumin and creatinine collected at baseline and year 3 study visits using a single spot urine sample. Prior to Ln transformation of UACR, the constant 1 was added to UACR values to allow for Ln transformation of UACR = 0 values [20].
Longitudinal change in eGFR
Three-year within-participant longitudinal change in eGFR was defined as change in eGFR from baseline on the natural log (Ln) scale. For adjusted models, change in eGFR was calculated as baseline Ln eGFR minus year 3 Ln eGFR so that a positive difference represented a decrease from baseline; for unadjusted analyses and graphical representation, change in eGFR was calculated as year 3 eGFR minus baseline eGFR. A binary measure of eGFR change (not Ln transformed) was defined as a 3 ml/min/1.73 m2 or greater annualized decrease in eGFR versus less than a 3 ml/min/1.73 m2 annualized decrease or an increase in eGFR over 3 years. Change in eGFR measures were missing for 3 in the overall BRINK MRI longitudinal cohort who did not have year 3 creatinine values.
Longitudinal change in UACR
Three-year within-participant longitudinal change in UACR was defined as change in UACR from baseline on the Ln scale. Change in UACR was calculated as year 3 Ln UACR minus baseline Ln UACR so that a positive difference represented an increase from baseline. A binary measure of UACR change was defined as a 30% or greater increase from baseline in UACR (not Ln transformed) versus less than a 30% increase or a decrease in UACR over 3 years where percent increase was defined as [year 3 UACR – baseline UACR]/baseline UACR. Change in UACR measures were missing for 7 in the overall BRINK MRI longitudinal cohort who did not have year 3 UACR values.
Imaging changes on MRI
All participants were scanned on a single 1.5T Phillips Ingenia MRI scanner at baseline and follow-up. The image acquisition and processing details are provided in the Supplementary Material.
Cortical thickness in temporal lobe meta-ROI and ventricular volume
Cortical thickness and ventricular volume using MPRAGE images were estimated using longitudinal FreeSurfer version 5.3 [21]. The average of fusiform, middle temporal, inferior temporal, and entorhinal thicknesses was computed and used as a composite temporal ROI to evaluate neurodegeneration related to aging and pathology seen in the elderly [22].
White matter hyperintensities
White matter hyperintensities (WMH) volume on FLAIR images were segmented using a semi-automated method and then were edited for segmentation errors by a trained image analyst (SMZ). We used total intracranial volume (TIV) estimated using SPM to account for head size. The details on the estimation of WMH volume and TIV can be found in Graff-Radford et al. [23, 24].
Diffusion tensor imaging
The pre-processing details can be found in Vemuri et al. [14]. Briefly, Advanced Normalization Tools (typically known as ANTS) [25] was used to nonlinearly register an in-house atlas to each participant’s FA image to compute regional median FA and mean diffusivity values in the atlas regions (where the entire corpus callosum was delineated). We considered fractional anisotropy in the corpus callosum (FACC) as the primary DTI measure because corpus callosum is the largest commissural fiber pathway important for cognitive performance and is significantly influenced by worsening vascular health [14]. Mean diffusivity has been widely shown to be non-specific. Therefore, we considered FA as an indicator of early white matter changes.
Definition of longitudinal change in MRI outcomes
Three-year within-participant changes in temporal ROI thickness, FA corpus callosum, and WMH volume were defined as year-3 value minus baseline value so that a positive difference represented an increase from baseline for all MRI outcomes. Prior to Ln transformation of WMH values, the constant 1 was added to WMH values to allow for Ln transformation of WMH values = 0 [20].
Data availability
Data from BRINK, including data from this study, are available upon reasonable request.
Statistical analysis
Descriptive statistics for study participant baseline characteristics, biomarkers, and MRI outcomes include Mean (SD), Median [IQR] for continuous variables and frequency (%) for categorical variables. Chi-square, Fisher’s exact, Wilcoxon rank-sum, and two sample t-tests were used to evaluate baseline characteristic differences between CKD and control groups. Paired t-tests were used to assess unadjusted change from baseline to year 3 in MRI outcomes, Ln eGFR, and Ln UACR for the overall longitudinal MRI cohort as well as for CKD and Control groups.
Linear regression models evaluated associations in the overall cohort and in the CKD group between: 1) baseline eGFR, 2) baseline Ln UACR, 3) change in Ln eGFR over 3 years, 4) change in Ln UACR over 3 years and change in MRI outcomes. Models for change in MRI outcomes were adjusted for relevant variables from the literature (also described in the literature)—sex, Black race, age, years of education, baseline smoker or alcohol use/abuse, baseline cerebrovascular risk factor score (ranges from 0–6), and baseline pulse pressure. In addition, models of the association between either baseline eGFR or baseline UACR and change in MRI outcomes also included both baseline eGFR and baseline Ln UACR. Similarly, models of change in Ln eGFR or Ln UACR included both baseline eGFR and Ln UACR, as well as change in Ln eGFR and Ln UACR. In this way the MRI outcome models mirrored those of the baseline BRINK MRI publication, in which joint models were used to include the effect of, e.g., eGFR on the MRI outcome, adjusted for UACR [11]. Models for WMH volume and ventricular volume were also adjusted for TIV. Penalized maximum likelihood regression models evaluated the associations in the overall cohort between baseline eGFR, baseline Ln UACR, change in Ln eGFR, change in Ln UACR, and incident infarctions and microhemorrhages (MCH). To fully adjust for several potentially important confounders and address possible issues with sparse data bias, we used penalized maximum likelihood models. With only two time points (baseline and 3-year), the linear regression of the delta (change in predictors and outcomes) was appropriate to model the associations between change in MRI outcomes and change in eGFR and UACR [26].
An alpha significance level of 0.05 identified statistically significant results. No adjustments for multiple comparisons were applied in order to reduce interpretation errors [27]. All statistical analyses were conducted using SAS software, v9.4, copyright © 2016, by SAS Institute, Inc. Cary, NC, USA.
RESULTS
There were 242 BRINK participants with valid baseline MRI scans (240 were included in the 2017 BRINK baseline MRI paper [11] plus 2 for whom baseline MRIs were completed after that analysis). Baseline demographic characteristics and biomarkers for the overall longitudinal MRI cohort, CKD, and control groups (total n = 97) are included in Table 1 along with p-values for group-wise comparisons. Mean age of the cohort was 67 years; those with CKD were about 5 years older (p = 0.02), on average, than the control group. Just over half of the cohort was male, and 7% were Black. Mean eGFR was 36.7 (8.8) ml/min/1.73 m2 in the CKD group and 80.8 (12.7) ml/min/1.73 m2 in the control group; median UACR in the CKD group was 42.3 [0.0, 264.1], and 0 in controls. There was significantly greater prevalence of hypertension, hyperlipidemia, and overall cerebrovascular risk factor score but not diabetes in the CKD group compared to controls. About 10% of the cohort carried a history of stroke or TIA, and its prevalence did not vary substantially by CKD status. Mean (SD) time elapsed between baseline and year 3 MRI was 3.0 (0.1) years, with a range of 2.7 to 3.4 years. Potential participation bias in this study is addressed in detail in the Supplementary Material.
Table 1
Baseline characteristics for MRI cohort
| MRI cohort N = 97 | All CKD (eGFR < 60) N = 74 | Control (eGFR≥60) N = 23 | p1 | |
| Age Mean (SD) | 66.7 (9.1) | 67.9 (8.6) | 62.8 (9.9) | 0.020 |
| Years of education Mean (SD) | 15.0 (2.4) | 14.7 (2.6) | 15.7 (1.8) | 0.091 |
| Male N (%) | 55 (56.7) | 43 (58.1) | 12 (52.2) | 0.616 |
| AA race N (%) | 7 (7.2) | 3 (4.1) | 4 (17.4) | 0.052 |
| SBP mm Hg2 Mean (SD) | 128.9 (15.3) | 130.2 (15.3) | 124.7 (14.7) | 0.128 |
| DBP mm Hg3 Mean (SD) | 67.9 (9.5) | 67.6 (9.7) | 68.8 (8.9) | 0.612 |
| Pulse Pressure mm Hg4 Mean (SD) | 61.0 (14.9) | 62.6 (15.3) | 55.9 (12.8) | 0.059 |
| Cholesterol mg/dL Mean (SD) | 183.1 (43.8) | 178.2 (45.0) | 198.7 (36.4) | 0.051 |
| HTN5 N (%) | 82 (84.5) | 69 (93.2) | 13 (56.5) | < 0.001 |
| Diabetes6 | 42 (43.3) | 34 (46.0) | 8 (34.8) | 0.345 |
| Hyperlipidemia7 N (%) | 69 (71.9) | 58 (79.5) | 11 (47.8) | 0.003 |
| Cardiovascular disease8 N (%) | 33 (34.0) | 29 (39.2) | 4 (17.4) | 0.054 |
| Stroke/TIA9 N (%) | 10 (10.3) | 8 (10.8) | 2 (8.7) | 1.00 |
| Afib10 N (%) | 6 (6.2) | 6 (8.1) | 0 (0.0) | 0.331 |
| CV RF score11 N (%) | < 0.001 | |||
| 0 | 9 (9.3) | 3 (4.1) | 6 (26.1) | |
| 1 | 17 (17.5) | 9 (12.2) | 8 (34.8) | |
| 2 | 21 (21.7) | 19 (25.7) | 2 (8.7) | |
| 3 | 24 (24.7) | 20 (27.0) | 4 (17.4) | |
| 4 | 19 (19.6) | 18 (24.3) | 1 (4.4) | |
| 5 | 7 (7.2) | 5 (6.8) | 2 (8.7) | |
| CV RF score10 Mean (SD) | 2.5 (1.4) | 2.8 (1.3) | 1.7 (1.6) | < 0.001 |
| Smoker12 N (%) | 5 (5.2) | 3 (4.1) | 2 (8.7) | 0.589 |
| Alcohol use/abuse13 N (%) | 14 (14.4) | 11 (14.9) | 3 (13.0) | 1.00 |
| UACR14 mg/g Median [IQR] | 21.7 [0.0, 129.4] | 42.3 [0.0, 264.1] | 0.0 [0.0, 0.0] | < 0.001 |
| LN (UACR14 + 1) Mean (SD) | 2.8 (2.6) | 3.5 (2.5) | 0.8 (1.7) | < 0.001 |
| eGFR15 Mean (SD) | 47.1 (21.3) | 36.7 (8.8) | 80.8 (12.7) | < 0.001 |
| LN eGFR15 Mean (SD) | 3.8 (0.4) | 3.6 (0.3) | 4.4 (0.2) | < 0.001 |
1Chi-square test or Fisher’s exact test (AA race, HTN, Stroke/TIA, Afib, CV RF score, smoker, alcohol use) for categorical variables and two-sample t-test or Wilcoxon rank sum test (baseline UACR) for continuous variables; 2Average of up to 3 SBP readings; 3Average of up to 3 DBP readings; 4Pulse Pressure = SBP – DBP; 5Hypertension (HTN) defined as SBP≥140 or DBP≥90 or HTN meds or self-report; 6Diabetes defined as Glucose≥200 or A1c≥6.5 or DM meds or self-report; 7Hyperlipidemia defined as cholesterol > 240 or on lipid lowering meds; 8Cardiovascular disease defined as history of MI, angina, CHF, or peripheral vascular disease; 9History of Stroke or TIA from QVSFS; 10History of A fibrillation (Afib); 11Cerebrovascular risk factor score (CV RF) defined as the sum of HTN, diabetes, hyperlipidemia, CVD, stroke or TIA, Afib; 12Smoker defined as any cigarettes in past month; 13Alcohol use/abuse defined as history of alcoholism or more than 1 drink per day; 14Urinary albumin/creatinine ratio; 15CKD-EPI equation for eGFR without race factor. LN, natural log scale; eGFR, estimated glomerular filtration rate; UACR, urinary albumin to creatinine ratio.
Change in eGFR and UACR over three years
The 3-year change (decline) in eGFR was significant in both the CKD and control groups (p < 0.001) (Table 2). Mean decline in eGFR among the CKD participants was 3.4 (7.8) ml/min/1.73 m2, going from a mean of 36.4 (8.5) to 33.0 (10.9) ml/min/1.73 m2, compared with a larger mean decline in eGFR of 7.7 (8.5) ml/min/1.73 m2 in controls, going from a mean of 80.8 (12.7) to 73.1 (14.5 ml/min/1.73 m2. A higher percentage of controls (43.5%) also declined≥3 ml/min/1.73 m2 in eGFR/year compared with CKD participants (23.9%). However, the prevalence of diabetes in the control group was 36%, as they were preferentially recruited to seek to approximate the prevalence of diabetes among the CKD group (46%); thus, diabetes may have contributed to their greater than anticipated eGFR decline. In addition, the higher baseline eGFR in the control group meant they had more potential to decrease their eGFR and still fall within the control group category of eGFR > 60.
Table 2
Three-year change from baseline in eGFR and UACR
| MRI cohort | All CKD (eGFR < 60) | Control (eGFR≥60) | |
| eGFR | |||
| N for change1 | N = 94 | N = 71 | N = 23 |
| Baseline Mean (SD) | 47.3 (21.5) | 36.4 (8.5) | 80.8 (12.7) |
| Year 3 Mean (SD) | 42.8 (21.0) | 33.0 (10.9) | 73.1 (14.5) |
| Year 3 – baseline change Mean (SE) | –4.42 (8.12) | –3.4 (7.8) | –7.7 (8.5) |
| LN (Baseline) Mean (SD) | 3.76 (0.43) | 3.56 (0.26) | 4.38 (0.16) |
| LN (Year 3) Mean (SD) | 3.64 (0.48) | 3.44 (0.35) | 4.27 (0.21) |
| Difference2 on LN scale Mean (SE) | –0.12 (0.22) | –0.12 (0.25) | –0.11 (0.12) |
| p-value3 for mean LN change | < 0.001 | < 0.001 | 0.0003 |
| ≥3 unit5 decrease/year N (%) | 27 (28.7%) | 17 (23.9%) | 10 (43.5%) |
| UACR | |||
| N for change1 | N = 90 | N = 69 | N = 21 |
| Baseline Mean (SD) | 169.2 (356.5) | 213.8 (395.3) | 22.6 (70.8) |
| Year 3 Mean (SD) | 328.8 (785.8) | 420.4 (877.4) | 27.8 (81.3) |
| Year 3 – baseline change Mean (SE) | 159.6 (522.5) | 206.6 (589.6) | 5.15 (25.0) |
| LN (Baseline) Mean (SD)4 | 2.81 (2.57) | 3.40 (2.50) | 0.87 (1.74) |
| LN (Year 3) Mean (SD)4 | 2.95 (2.84) | 3.60 (2.78) | 0.83 (1.86) |
| Difference2 on LN scale Mean (SE) | 0.14 (1.65) | 0.20 (1.74) | –0.05 (1.33) |
| p3 for mean LN change | 0.415 | 0.343 | 0.873 |
| > 30% increase5 in 3 years N (%) | 31 (34.4%) | 30 (43.5%) | 1 (4.8%) |
1Baseline data limited to those with 3-year eGFR/UACR data; 2LN (Year 3) – LN (baseline); 3p-value for paired t-test of mean change; 41 added to baseline and year 3 UACR prior to LN transformation; 5eGFR annualized decrease and UACR 30% increase calculated from non-LN transformed values. LN, natural log scale; eGFR, estimated glomerular filtration rate; UACR, urinary albumin to creatinine ratio.
UACR increased over 3 years in the overall cohort, but none of the Ln UACR increases were significant in either the overall cohort CKD or control groups. For the CKD group, the mean increase in UACR was 206.6 (589.6) mg/g from 213.8 (395.3) to 420.4 (877.4) mg/g, compared with controls at 5.15 (25.0) mg/g. In addition, approximately 43.5% of the CKD experienced > 30% increase in UACR over 3 years, compared with only 5% (1 person) in the control group.
Change in MRI outcomes over three years
Baseline and change in the MRI outcomes of temporal lobe thickness, WMH volume, ventricular volume, and FACC are shown in Table 3. There was no significant change in temporal lobe thickness over 3 years in the overall cohort or in either the CKD or control groups. Among both the total MRI cohort and CKD group but not controls, mean Ln WMH volume increased from baseline to year 3 (p < 0.001 for both) and mean FACC decreased from baseline to year 3 (p < 0.001 for both). Ventricular volume increased in all groups (p < 0.0001), capturing age related shrinkage of the brain across all participants. In sensitivity analyses, we did not find any significant change in frontal lobe thickness over 3 years in either the CKD or control groups.
Table 3
MRI Outcomes: baseline, 3 years, and change over 3 years
| BRINK longitudinal MRI cohorts | |||
| MRI outcome | Overall | All CKD (eGFR < 60) | Control (eGFR≥60) |
| Temporal lobe meta-ROI, μm, Mean (SD) | |||
| N for change | N = 96 | N = 74 | N = 22 |
| Baseline | 2,876 (195.0) | 2,850 (205.9) | 2,964 (119.3) |
| Year 3 | 2,879 (212.6) | 2,843 (218.9) | 3,003 (131.0) |
| Difference (Year 3 – Base) | 3.26 (126.8) | –7.29 (119.7) | 38.73 (145.9) |
| p1 for mean change | 0.802 | 0.602 | 0.227 |
| WMH volume, cc Mean (SD) | |||
| N for change | N = 95 | N = 72 | N = 23 |
| Baseline | 21.2 (18.2) | 23.1 (19.8) | 15.1 (9.7) |
| Year 3 | 25.3 (23.0) | 28.0 (25.1) | 16.8 (11.7) |
| Difference (Year 3 – base) | 3.88 (7.16) | 4.58 (7.75) | 1.67 (4.33) |
| Difference on Ln scale2 | 0.15 (0.24) | 0.17 (0.24) | 0.09 (0.22) |
| p1 for mean LN change | < 0.001 | < 0.001 | 0.078 |
| Ventricular volume, cc Mean (SD) | |||
| N for change | N = 96 | N = 74 | N = 22 |
| Baseline | 29.8 (15.7) | 31.8 (16.6) | 23.0 (9.6) |
| Year 3 | 32.5 (17.3) | 34.8 (18.3) | 24.8 (10.2) |
| Difference (Year 3 – base) | 2.72(2.70) | 2.98 (2.98) | 1.85 (1.08) |
| Difference on Ln scale | 0.085 (0.067) | 0.087 (0.073) | 0.079 (0.042) |
| p1 for mean LN change | < 0.0001 | < 0.0001 | < 0.0001 |
| FA corpus callosum Mean (SD) | |||
| N for baseline, year 3, change | N = 94 | N = 71 | N = 23 |
| Baseline | 0.633 (0.044) | 0.628 (0.045) | 0.649 (0.034) |
| Year 3 | 0.624 (0.049) | 0.616 (0.050) | 0.647 (0.038) |
| Difference (Year 3 – Base) | –0.0095 (0.015) | –0.0117 (0.014) | –0.0027 (0.015) |
| p1 for mean change | < 0.001 | < 0.001 | 0.403 |
1p from paired t-test of mean change; 2Difference on LN scale calculated from WMH+1: LN (year 3 WMH+1) – LN (baseline WMH+1); LN, natural log scale; eGFR, estimated glomerular filtration rate; UACR, urinary albumin to creatinine ratio; WMH, white matter hyperintensity; FA, fractional anisotropy.
In the overall MRI cohort, three CKD participants incurred a new infarction and seven participants had incident MCHs; 5 were CKD and 2 were control participants (noting that one 3-year CKD MRI was excluded from the study analyses due to a new large cortical infarct). Even though these numbers were small, there were higher odds of incident infarctions with increase in Ln UACR over three years in the unadjusted penalized maximum likelihood model [OR (95% CI) was 2.13 (1.14, 3.95) with p = 0.017], but this association was no longer statistically significant in the adjusted model. There were no other significant associations between kidney measures (at baseline or change over 3 years) and infarctions or MCHs (data not shown).
Associations between kidney biomarkers and change in MRI outcomes
The linear regression adjusted associations between baseline and change in kidney biomarkers and 3-year change in MRI outcomes are shown in Table 4. Both UACR and eGFR were included in the models together. These identified no statistically significant associations between the predictors of either baseline eGFR or UACR or change in eGFR or UACR from baseline and 3-year change in temporal lobe thickness or WMH volume, in the overall cohort or in the CKD group (even though WMH volume increased in both groups). The only significant eGFR associations were seen with FACC as the outcome, where 3-year change (decline) in Ln eGFR was associated with decline in FACC in both the overall cohort (p = 0.035) and in the CKD cohort (p = 0.016); annualized decrease in eGFR≥3 ml/min/1.73 m2 was also significantly associated with decrease in FACC in the CKD cohort, but not in the overall cohort. The only significant Ln UACR associations were found for Ln UACR increase > 30% and increase in ventricular volume, in both the overall cohort (p = 0.002) and in the CKD group (p = 0.005).
Table 4
Linear regression adjusted1 associations between 3-year change in MRI outcomes2 and eGFR and UACR (baseline and change): Overall and All CKD MRI cohorts
| Temporal lobe meta-ROI 3-year change | WMH (Ln) 3-year change | Ventricular volume (Ln) 3-year change | FA corpus callosum 3-year change | |||||
| B (SE) | p | B (SE) | p | B (SE) | p | B (SE) | p | |
| Overall MRI cohort | ||||||||
| Baseline model3 (N) | 96 | 94 | 96 | 94 | ||||
| Baseline eGFR4 | –0.77 (0.76) | 0.316 | 0.0021 (0.0015) | 0.169 | 0.0001 (0.0004) | 0.894 | –0.0001 (0.0001) | 0.118 |
| Baseline Ln UACR5 | –1.78 (6.44) | 0.782 | –0.0034 (0.0125) | 0.788 | –0.0006 (0.0037) | 0.880 | –0.0006 (0.0007) | 0.404 |
| 3-year change model6 (N) | 89 | 87 | 89 | 87 | ||||
| Ln eGFR 3-year change4 | 120.79 (66.29) | 0.072 | 0.074 (0.127) | 0.562 | 0.015 (0.036) | 0.677 | –0.016 (0.0076) | 0.035 |
| Ln UACR 3-year change5 | –8.46 (8.84) | 0.342 | 0.023 (0.017) | 0.185 | 0.009 (0.005) | 0.076 | –0.0003 (0.001) | 0.773 |
| Threshold change model7 (N) | 89 | 87 | 89 | 87 | ||||
| eGFR annualized decrease≥3 units | 18.59 (34.57) | 0.592 | 0.096 (0.064) | 0.139 | 0.027 (0.017) | 0.114 | –0.0027 (0.0039) | 0.482 |
| UACR increase > 30% | –27.16 (32.21) | 0.402 | 0.080 (0.062) | 0.199 | 0.054 (0.016) | 0.002 | –0.0016 (0.0037) | 0.664 |
| CKD cohort | ||||||||
| Baseline model3 (N) | 74 | 72 | 74 | 71 | ||||
| Baseline eGFR4 | –1.22 (1.71) | 0.481 | 0.003 (0.004) | 0.359 | –0.0002 (0.0011) | 0.852 | 0.0001 (0.0002) | 0.713 |
| Baseline Ln UACR5 | –1.73 (6.89) | 0.803 | –0.010 (0.014) | 0.463 | –0.0004 (0.0044) | 0.932 | –0.0011 (0.0008) | 0.180 |
| 3-year change model6 (N) | 69 | 67 | 69 | 66 | ||||
| Ln eGFR 3-year change4 | 112.0 (67.52) | 0.103 | 0.058 (0.137) | 0.676 | 0.004 (0.041) | 0.922 | –0.0188 (0.0075) | 0.016 |
| Ln UACR 3-year change5 | –7.55 (9.41) | 0.426 | 0.024 (0.019) | 0.220 | 0.011 (0.006) | 0.060 | –0.0007 (0.0011) | 0.512 |
| Threshold change model7 (N) | 69 | 67 | 69 | 66 | ||||
| eGFR annualized decrease≥3 units | –19.10 (39.58) | 0.631 | 0.103 (0.077) | 0.190 | 0.037 (0.022) | 0.096 | –0.0096 (0.0044) | 0.033 |
| UACR increase > 30% | –26.0 (32.83) | 0.432 | 0.081 (0.066) | 0.222 | 0.055 (0.019) | 0.005 | –0.0019 (0.0037) | 0.604 |
1All models were adjusted for covariates: age, gender, AA race, years of education, baseline CV risk factor score, pulse pressure, smoker/alcohol use; models for WMH and ventricular volume were also adjusted for TIV; 2MRI outcome change defined as Year 3 minus baseline; 3Baseline models include both baseline eGFR and baseline Ln UACR adjusted for covariates listed above; 4Baseline eGFR and change in Ln eGFR were modeled so that positive covariates reflect an increase in MRI outcome associated with 1 unit lower eGFR at baseline or 1 unit decrease in Ln eGFR over 3 years; 5Baseline Ln UACR and change in Ln UACR were modeled so that positive covariates reflect an increase in MRI outcome associated with 1 unit higher Ln UACR at baseline or 1 unit increase in Ln UACR over 3 years; 63-year change models include 3-year change in Ln eGFR, 3-year change in Ln UACR, baseline eGFR, baseline Ln UACR, and covariates listed above; 7Threshold change models include eGFR annualized decrease≥3 units, UACR increase > 30%, baseline eGFR, baseline Ln UACR, and covariates listed above. LN, natural log scale; eGFR, estimated glomerular filtration rate; UACR, urinary albumin to creatinine ratio; WMH, white matter hyperintensity; FA, fractional anisotropy.
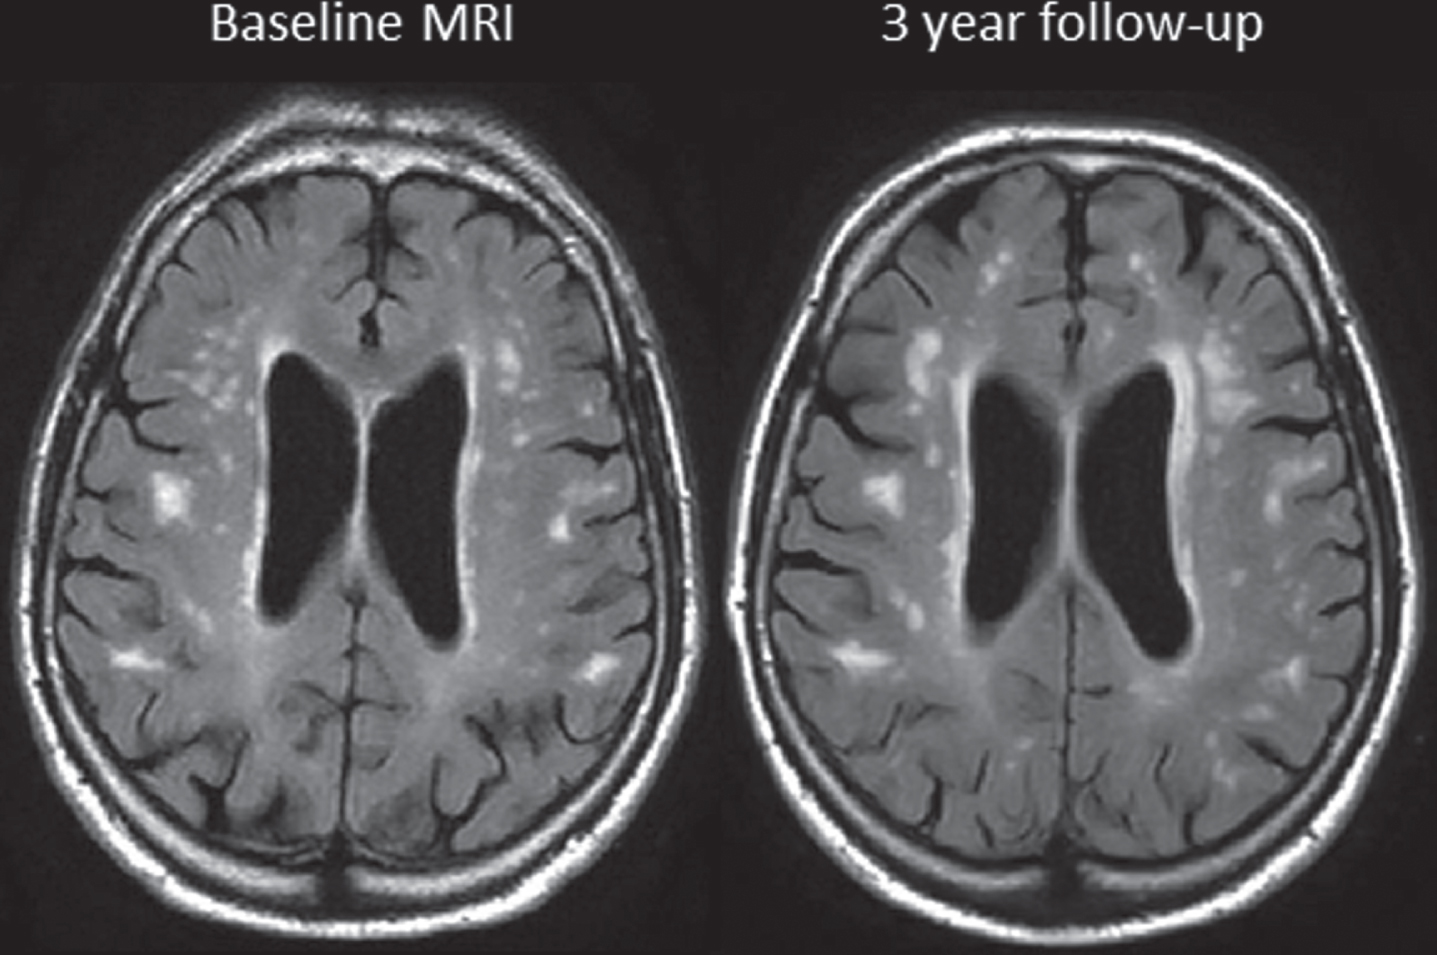
Change in FACC by change in Ln eGFR over 3 years in the overall MRI cohort as well as change in ventricular volume by change in UACR over 3 years in the overall MRI cohort is shown in Fig. 1, demonstrating the associations found in the regression models. Figure 2 illustrates the increase in WMH volume on FLAIR images between baseline and 3 years in a BRINK CKD participant. The increases were seen in both periventricular and diffuse WMH volume over time.
Fig. 1
In full MRI cohort: (Left) Change in fractional anisotropy of corpus callosum (FACC) by change in Ln eGFR over 3 years. (Right) Change in ventricular volume by change in UACR (not log transformed) over 3 years. CKD are represented by black triangles, Non-CKD are represented as grey circles. All changes were defined as 3-year minus baseline so that positive values represent an increase and negative values represent a decrease.
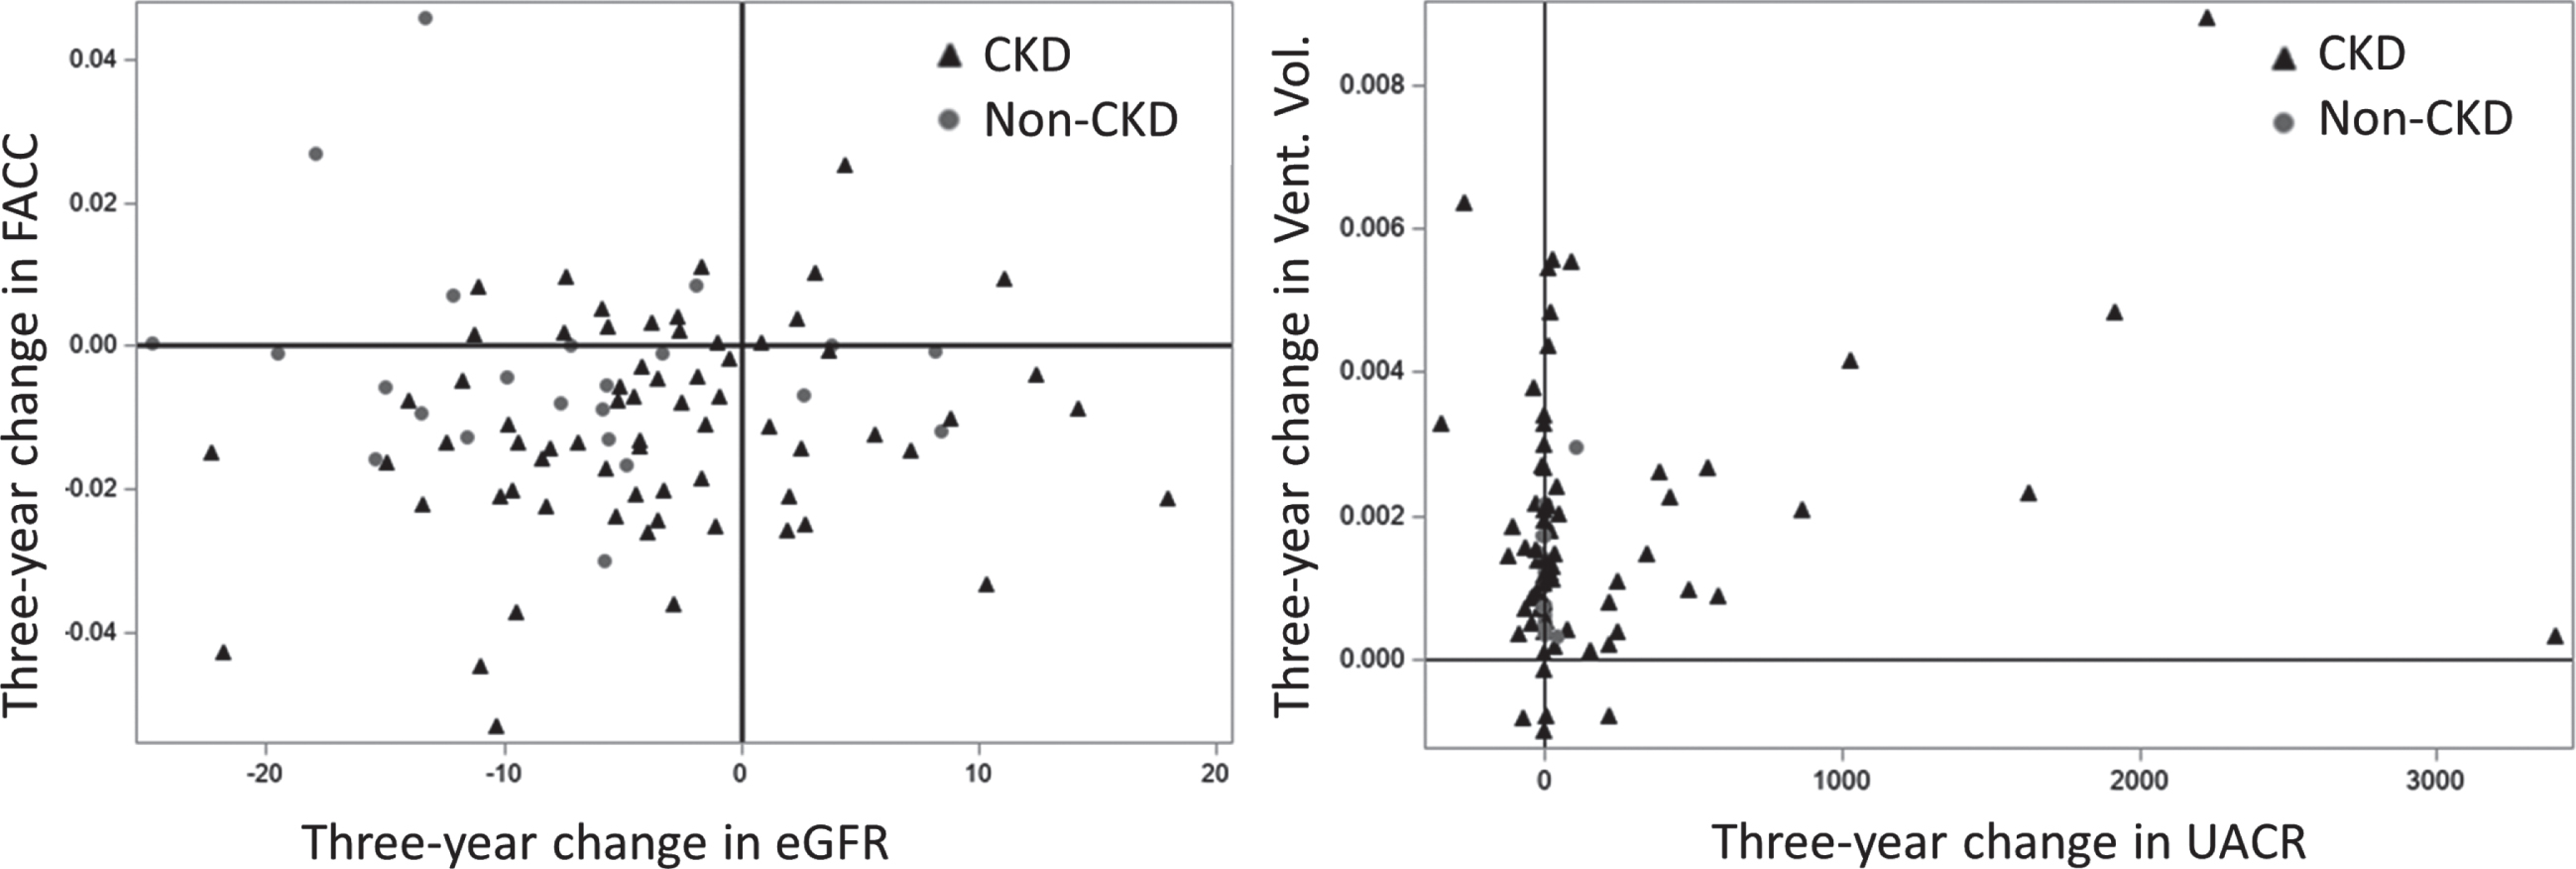
Fig. 2
FLAIR MRI scans at baseline and 3 years in a CKD subject whose eGFR decreased from 38.1 to 34.8 units.
DISCUSSION
In this longitudinal study of brain changes related to kidney disease, we found: 1) WM-specific changes as observed by WMH volume increase and microstructural integrity decrease in participants with CKD; 2) greater decline in eGFR was associated with significant decline in the WM microstructural integrity of the FACC, suggesting that subtle early brain changes due to kidney disease can be captured using DTI; and 3) increase in UACR was associated with increase in ventricular volume across all participants.
Brain changes may be specific to WM in CKD patients
These results support our hypothesis that CKD progression exerts its influence on cognitive function in part through small vessel disease mechanisms resulting in measurable WM changes. WM changes seen in aging and dementia are linked to progressive small vessel disease in the elderly. There are several causes that include hypoperfusion, altered water content, blood-brain barrier dysfunction, myelin damage, and axonal disruption [28]. While WMH are the most commonly studied CVD related MRI changes, there is recent evidence that diffusion MRI can capture changes even in normal appearing WM associated with myelin damage, axonal loss, and gliosis that have been shown to be predictive of cognitive performance [13, 29]. We and others have found that DTI related changes in tissue microstructure can be reflective of progressive WM damage above and beyond the information provided by WMH [15, 30, 31].
In group-wise differences of change in structural MRI outcomes (Table 3), we found that mean WMH volume significantly increased and mean FACC significantly declined in participants with CKD, but not in controls. Although there was no significant association of baseline eGFR or UACR or change in these biomarkers with WMH volume, decline in eGFR was significantly associated with change (decline) in FACC (Table 4 and Fig. 1), suggesting the utility of DTI in capturing kidney biomarker-related early brain changes in patients with CKD. Importantly, in our baseline BRINK MRI study cross-sectional analyses, eGFR was also strongly associated with FA in the frontal, temporal, and parietal lobes in models unadjusted for UACR, but these associations were no longer significant after adjusting for UACR.
The lack of significant associations between baseline UACR or change in UACR with any WM outcome was likely attributable in large part to lack of substantial change from baseline in UACR, coupled with wide UACR ranges and standard deviations in both the overall cohort and CKD group. However, we found a strong association between increase in ventricular volume and increase in UACR. Figure 1 illustrates that except for one participant, most CKD participants with increase in UACR also had significant increase in ventricular volume over three years suggesting that change in UACR reflected concurrent brain changes, specifically ventricular volume increase.
We were surprised to find no significant temporal lobe changes over three years (Table 3). These results differed from the baseline paper [11] where we found significant cortical thickness differences between CKD and controls. Therefore, the lack of sufficient sample size cannot be ruled out. However, ventricular volume increased in all groups, suggesting there was age-related non-specific degeneration throughout the brain in all groups. Many of the previous studies examining the relation between kidney function and structural MRI changes were done in diabetic cohorts, although it has recently been reported that metabolic syndrome has little impact on increase in WMH [24]. Findings from the ACCORD MIND study in 502 older persons with type 2 diabetes were consistent with ours in that baseline and persistent albuminuria were not independently associated with significant changes in global or regional gray matter volumes or WMH [32]. However, albuminuria was associated with brain atrophy and WMH in a cohort of hypertensive sibships [33].
The high attrition rate reflects the malignancy of severe CKD for those missing 3-year MRI in the ‘other reasons’ group. However, the attrition limitation also lends important insights to understanding the biology underlying the temporal competition between study-ending complications of CKD and ongoing participation in the longitudinal study. Thus, the observed longitudinal imaging outcomes likely represent the less-affected survivors overall and underestimate the brain imaging consequences of CKD. In turn, participants with less severe CKD have measurable brain consequences because they survived long enough to develop them.
Change in eGFR may be reflective of early WM changes
In this longitudinal study, there was a clear increase in WMH in participants with CKD in parallel with a consistent decrease in FACC in CKD participants over time. Though we did not have sufficient power to determine the odds of infarctions and MCHs in adjusted models for CKD, the worsening of WMH and FACC supports their role as early measures of WM changes, reflective of declining kidney function and worsening CVD. We previously found that the FACC was a predictor of cognitive decline even after adjusting for WMH and was a robust marker of CVD [14]. Further, the finding of an association between change in eGFR and change in FACC further support our hypothesis that CKD participants have greater CVD structural MRI changes in comparison to temporal lobe cortical thinning due to other aging and pathological processes.
UACR, ventricular volume, and inflammation
As kidney function declines systemic inflammatory burden increases, UACR is considered a biomarker for endothelial vascular and systemic inflammation [34, 35]. There is evidence of an association between midlife systemic inflammation and greater ventricular volume in late-life [36]. Therefore, the additional association of a > 30% increase in UACR with increased ventricular volume may suggest links between high levels of inflammation seen in CKD and reflected by elevated UACR levels and the concurrent diffuse atrophy measured by ventricular volume.
In sensitivity analyses (not shown here), we found that the 10 subjects with > 400 units increase in UACR had slightly elevated baseline interleukin-6 (IL-6) serum marker, which is an indicator of systemic inflammation (1.99 versus 1.25; p = 0.108). Our results suggest that further investigations on the longitudinal changes in systemic and brain markers may shed light on the role of inflammation along the CKD-brain axis.
Limitations
We anticipated that we might observe an association between change in eGFR or UCAR and MCH or infarcts, given the vascular pathophysiology and high rate of micro- and macrovascular outcomes commonly described in CKD cohorts. However, the unexpectedly small number of participants with an incident MCH and infarcts prevented analysis of these relations, perhaps due to a healthy survivor effect of the remaining CKD participants and lower prevalence of atrial fibrillation in the MRI cohort compared to those missing 3-year MRI. Even though the mortality rate at 3 years in the CKD group was high at 12%, we had predicted a higher rate of approximately 18%, based on projections from the United Stated Renal Data System [37]. Moreover, the baseline MRI prevalence of cortical stroke was 12% in the CKD group compared with 4% in the controls (p = 0.05), and the odds of a cortical infarct were 1.23 higher for a 10% decrease in eGFR (95% CI 1.06 to 1.43; p = 0.008) in joint models adjusted for UACR [11], again suggesting selective dropout due to infarcts.
The low retention rate of 40% in the MRI cohort limited power for comparisons between CKD and Controls. This was due in part to loss to follow up and study withdrawal due to high comorbidity burden commonly observed in CKD cohorts, transition to dialysis (8% of baseline participants), and the 12% mortality rate, but also to the halt in study operations associated with funding limitations between BRINK 1 and BRINK 2. The higher mortality in the group of interest (in our case CKD) has been a problem in longitudinal epidemiological studies of aging and dementia because we likely underestimate the observed brain changes based on less severe participants who remain in the study. Although all analyses were adjusted for diabetes, and diabetes was reasonably matched for (46% versus 35% of the controls), the microvascular effects of diabetes are difficult to dissect from those of progressive CKD. Though we had decreased power due to smaller sample size in this BRINK longitudinal study, the confirmation of our results through two different analyses (group comparison and association with kidney biomarkers) lends support to our findings.
CONCLUSION
In a longitudinal MRI cohort of CKD and control participants, decline in eGFR over 3 years was strongly associated with decreased WM microstructural integrity, specifically by FACC, and a 30% increase in UACR was strongly associated with ventricular volume. Our results support the role of eGFR as a measure of kidney microvascular disease and predictor of FACC changes which may be a possible early marker of microvascular brain damage in CKD. Further studies in larger samples of moderate CKD populations over a longer period are needed to elucidate the structural brain pathology underlying cognitive changes in CKD.
DISCLOSURE STATEMENT
Authors’ disclosures available online (https://www.j-alz.com/manuscript-disclosures/21-0604r1).
SUPPLEMENTARY MATERIAL
[1] The supplementary material is available in the electronic version of this article: https://dx.doi.org/10.3233/JAD-210604.
REFERENCES
[1] | Wada M , Nagasawa H , Iseki C , Takahashi Y , Sato H , Arawaka S , Kawanami T , Kurita K , Daimon M , Kato T ((2008) ) Cerebral small vessel disease and chronic kidney disease (CKD): Results of a cross-sectional study in community-based Japanese elderly. J Neurol Sci 272: , 36–42. |
[2] | Otani H , Kikuya M , Hara A , Terata S , Ohkubo T , Kondo T , Hirose T , Obara T , Metoki H , Inoue R , Asayama K , Kanno A , Terawaki H , Nakayama M , Totsune K , Hoshi H , Satoh H , Izumi S , Imai Y ((2010) ) Association of kidney dysfunction with silent lacunar infarcts and white matter hyperintensity in the general population: The Ohasama study. Cerebrovasc Dis 30: , 43–50. |
[3] | Vogels SC , Emmelot-Vonk MH , Verhaar HJ , Koek HL ((2012) ) The association of chronic kidney disease with brain lesions on MRI or CT: A systematic review. Maturitas 71: , 331–336. |
[4] | Drew DA , Bhadelia R , Tighiouart H , Novak V , Scott TM , Lou KV , Shaffi K , Weiner DE , Sarnak MJ ((2013) ) Anatomic brain disease in hemodialysis patients: A cross-sectional study. Am J Kidney Dis 61: , 271–278. |
[5] | Khatri M , Wright CB , Nickolas TL , Yoshita M , Paik MC , Kranwinkel G , Sacco RL , DeCarli C ((2007) ) Chronic kidney disease is associated with white matter hyperintensity volume: The Northern Manhattan Study (NOMAS). Stroke 38: , 3121–3126. |
[6] | Cho AH , Lee SB , Han SJ , Shon YM , Yang DW , Kim BS ((2009) ) Impaired kidney function and cerebral microbleeds in patients with acute ischemic stroke. Neurology 73: , 1645–1648. |
[7] | Akoudad S , Sedaghat S , Hofman A , Koudstaal PJ , van der Lugt A , Ikram MA , Vernooij MW ((2015) ) Kidney function and cerebral small vessel disease in the general population. Int J Stroke 10: , 603–608. |
[8] | Cho EB , Seo SW , Kim H , Lee JM , Yoon U , Im K , Kim GH , Noh Y , Cho H , Yoon CW , Kim HJ , Na DL ((2013) ) Effect of kidney dysfunction on cortical thinning in patients with probable Alzheimer’s disease dementia. J Alzheimers Dis 33: , 961–968. |
[9] | Makin SD , Cook FA , Dennis MS , Wardlaw JM ((2015) ) Cerebral small vessel disease and renal function: Systematic review and meta-analysis. Cerebrovasc Dis 39: , 39–52. |
[10] | Nagai M , Hoshide S , Takahashi M , Shimpo M , Kario K ((2015) ) Sleep duration, kidney function, and their effects on cerebral small vessel disease in elderly hypertensive patients. Am J Hypertens 28: , 884–893. |
[11] | Vemuri P , Knopman DS , Jack CR Jr. , Lundt ES , Weigand SD , Zuk SM , Thostenson KB , Reid RI , Kantarci K , Slinin Y , Lakshminarayan K , Davey CS , Murray A ((2017) ) Association of kidney function biomarkers with brain MRI findings: The BRINK Study. J Alzheimers Dis 55: , 1069–1082. |
[12] | Seliger SL , Longstreth WT Jr ((2008) ) Lessons about brain vascular disease from another pulsating organ, the kidney. Stroke 39: , 5–6. |
[13] | Croall ID , Lohner V , Moynihan B , Khan U , Hassan A , O’Brien JT , Morris RG , Tozer DJ , Cambridge VC , Harkness K , Werring DJ , Blamire AM , Ford GA , Barrick TR , Markus HS ((2017) ) Using DTI to assess white matter microstructure in cerebral small vessel disease (SVD) in multicentre studies. Clin Sci (Lond) 131: , 1361–1373. |
[14] | Vemuri P , Lesnick TG , Przybelski SA , Graff-Radford J , Reid RI , Lowe VJ , Zuk SM , Senjem ML , Schwarz CG , Gunter JL , Kantarci K , Machulda MM , Mielke MM , Petersen RC , Knopman DS , Jack CR Jr. ((2018) ) Development of a cerebrovascular magnetic resonance imaging biomarker for cognitive aging. Ann Neurol 84: , 705–716. |
[15] | Raghavan S , Przybelski SA , Reid RI , Graff-Radford J , Lesnick TG , Zuk SM , Knopman DS , Machulda MM , Mielke MM , Petersen RC , Jack CR Jr. , Vemuri P ((2020) ) Reduced fractional anisotropy of the genu of the corpus callosum as a cerebrovascular disease marker and predictor of longitudinal cognition in MCI. Neurobiol Aging 96: , 176–183. |
[16] | Levey AS , Stevens LA , Schmid CH , Zhang YL , Castro AF 3rd , Feldman HI , Kusek JW , Eggers P , Van Lente F , Greene T , Coresh J ((2009) ) A new equation to estimate glomerular filtration rate. Ann Intern Med 150: , 604–612. |
[17] | Bragg-Gresham J , Zhang X , Le D , Heung M , Shahinian V , Morgenstern H , Saran R ((2021) ) Prevalence of chronic kidney disease among black individuals in the US after removal of the black race coefficient from a glomerular filtration rate estimating equation. JAMA Network Open 4: , e2035636. |
[18] | Duggal V , Thomas I-c , Montez-Rath ME , Chertow GM , Kurella Tamura M ((2021) ) National estimates of CKD prevalence and potential impact of estimating glomerular filtration rate without race. J Am Soc Nephrol 32: , 1454–1463. |
[19] | Ahmed S , Nutt CT , Eneanya ND , Reese PP , Sivashanker K , Morse M , Sequist T , Mendu ML ((2021) ) Examining the potential impact of race multiplier utilization in estimated glomerular filtration rate calculation on African-American care outcomes. J Gen Intern Med 36: , 464–471. |
[20] | Birdsill AC , Koscik RL , Jonaitis EM , Johnson SC , Okonkwo OC , Hermann BP , Larue A , Sager MA , Bendlin BB ((2014) ) Regional white matter hyperintensities: Aging, Alzheimer’s disease risk, and cognitive function. Neurobiol Aging 35: , 769–776. |
[21] | Reuter M , Schmansky NJ , Rosas HD , Fischl B ((2012) ) Within-subject template estimation for unbiased longitudinal image analysis. Neuroimage 61: , 1402–1418. |
[22] | Jack CR Jr , Wiste HJ , Weigand SD , Therneau TM , Lowe VJ , Knopman DS , Gunter JL , Senjem ML , Jones DT , Kantarci K , Machulda MM , Mielke MM , Roberts RO , Vemuri P , Reyes DA , Petersen RC ((2017) ) Defining imaging biomarker cut points for brain aging and Alzheimer’s disease. Alzheimers Dement 13: , 205–216. |
[23] | Graff-Radford J , Arenaza-Urquijo EM , Knopman DS , Schwarz CG , Brown RD , Rabinstein AA , Gunter JL , Senjem ML , Przybelski SA , Lesnick T , Ward C , Mielke MM , Lowe VJ , Petersen RC , Kremers WK , Kantarci K , Jack CR , Vemuri P ((2019) ) White matter hyperintensities: Relationship to amyloid and tau burden. Brain 142: , 2483–2491. |
[24] | Scharf EL , Graff-Radford J , Przybelski SA , Lesnick TG , Mielke MM , Knopman DS , Preboske GM , Schwarz CG , Senjem ML , Gunter JL , Machulda M , Kantarci K , Petersen RC , Jack CR Jr. , Vemuri P ((2019) ) Cardiometabolic health and longitudinal progression of white matter hyperintensity: The Mayo Clinic Study of Aging. Stroke 50: , 3037–3044. |
[25] | Avants BB , Epstein CL , Grossman M , Gee JC ((2008) ) Symmetric diffeomorphic image registration with cross-correlation: Evaluating automated labeling of elderly and neurodegenerative brain. Med Image Anal 12: , 26–41. |
[26] | Streja E , Goldstein L , Soohoo M , Obi Y , Kalantar-Zadeh K , Rhee CM ((2017) ) Modeling longitudinal data and its impact on survival in observational nephrology studies: Tools and considerations. Nephrol Dial Transplant 32: , ii77–ii83. |
[27] | Rothman KJ ((1990) ) No adjustments are needed for multiple comparisons. Epidemiology 1: , 43–46. |
[28] | Alber J , Alladi S , Bae HJ , Barton DA , Beckett LA , Bell JM , Berman SE , Biessels GJ , Black SE , Bos I , Bowman GL , Brai E , Brickman AM , Callahan BL , Corriveau RA , Fossati S , Gottesman RF , Gustafson DR , Hachinski V , Hayden KM , Helman AM , Hughes TM , Isaacs JD , Jefferson AL , Johnson SC , Kapasi A , Kern S , Kwon JC , Kukolja J , Lee A , Lockhart SN , Murray A , Osborn KE , Power MC , Price BR , Rhodius-Meester HFM , Rondeau JA , Rosen AC , Rosene DL , Schneider JA , Scholtzova H , Shaaban CE , Silva N , Snyder HM , Swardfager W , Troen AM , van Veluw SJ , Vemuri P , Wallin A , Wellington C , Wilcock DM , Xie SX , Hainsworth AH ((2019) ) White matter hyperintensities in vascular contributions to cognitive impairment and dementia (VCID): Knowledge gaps and opportunities. Alzheimers Dement (N Y) 5: , 107–117. |
[29] | Low A , Mak E , Stefaniak JD , Malpetti M , Nicastro N , Savulich G , Chouliaras L , Markus HS , Rowe JB , O’Brien JT ((2020) ) Peak width of skeletonized mean diffusivity as a marker of diffuse cerebrovascular damage. Front Neurosci 14: , 238. |
[30] | Maniega SM , Valdes Hernandez MC , Clayden JD , Royle NA , Murray C , Morris Z , Aribisala BS , Gow AJ , Starr JM , Bastin ME , Deary IJ , Wardlaw JM ((2015) ) White matter hyperintensities and normal-appearing white matter integrity in the aging brain. Neurobiol Aging 36: , 909–918. |
[31] | Maillard P , Carmichael O , Harvey D , Fletcher E , Reed B , Mungas D , DeCarli C ((2013) ) FLAIR and diffusion MRI signals are independent predictors of white matter hyperintensities. AJNR Am J Neuroradiol 34: , 54–61. |
[32] | Murray AM , Hsu FC , Williamson JD , Bryan RN , Gerstein HC , Sullivan MD , Miller ME , Leng I , Lovato LL , Launer LJ ((2017) ) ACCORDION MIND: Results of the observational extension of the ACCORD MIND randomised trial. Diabetologia 60: , 69–80. |
[33] | Knopman DS , Mosley TH Jr. , Bailey KR , Jack CR Jr. , Schwartz GL , Turner ST ((2008) ) Associations of microalbuminuria with brain atrophy and white matter hyperintensities in hypertensive sibships. J Neurol Sci 271: , 53–60. |
[34] | Gupta J , Mitra N , Kanetsky PA , Devaney J , Wing MR , Reilly M , Shah VO , Balakrishnan VS , Guzman NJ , Girndt M , Periera BG , Feldman HI , Kusek JW , Joffe MM , Raj DS ((2012) ) Association between albuminuria, kidney function, and inflammatory biomarker profile in CKD in CRIC. Clin J Am Soc Nephrol 7: , 1938–1946. |
[35] | Bartz SK , Caldas MC , Tomsa A , Krishnamurthy R , Bacha F ((2015) ) Urine albumin-to-creatinine ratio: A marker of early endothelial dysfunction in youth. J Clin Endocrinol Metab 100: , 3393–3399. |
[36] | Walker KA , Hoogeveen RC , Folsom AR , Ballantyne CM , Knopman DS , Windham BG , Jack CR Jr. , Gottesman RF ((2017) ) Midlife systemic inflammatory markers are associated with late-life brain volume: The ARIC study. Neurology 89: , 2262–2270. |
[37] | ((2010) ) National Institutes of Health, National Institute of Diabetes and Digestive and Kidney Diseases, Bethesda, MD. |


