
Red Cell Distribution Width and Dementia Among Rural-Dwelling Older Adults: The MIND-China Study
Abstract
Background:
Evidence has emerged that anemia is associated with dementia, but data on the relationships of red blood cell distribution width (RDW) with dementia and cognitive function in older adults are sparse.
Objective:
We sought to investigate the associations of RDW with dementia and global cognitive performance among rural-dwelling Chinese older adults and further to examine their associations by anemia status.
Methods:
This population-based cross-sectional study included 5,115 participants (age≥65 years, 57.0%women) in the baseline examination (March-September 2018) of the Multimodal Interventions to Delay Dementia and Disability in rural China (MIND-CHINA). We collected data through face-to-face interviews, clinical examinations, and laboratory tests. Global cognitive function was evaluated using the Mini-Mental State Examination (MMSE). We defined dementia, Alzheimer’s disease (AD), and vascular dementia (VaD) following the respective international criteria. Data were analyzed using multinomial logistic and general linear regression models.
Results:
Of all participants, 300 were diagnosed with dementia, including 195 with AD and 95 VaD. The multiple-adjusted odds ratio of dementia associated with quartiles of RDW were 1.45 (95%CI: 0.87–2.44), 1.00 (reference), 1.77 (1.07–2.93), and 2.28 (1.40–3.72). Similar J-shaped patterns existed for the association of RDW with odds ratio of AD and VaD. Anemia was not significantly associated with dementia. The J-shaped associations of RDW with dementia and subtypes were statistically evident only among participants without anemia. There was an inverted J-shaped relationship between RDW quartiles and β-coefficients of MMSE score.
Conclusion:
There is a J-shaped association between RDW level and likelihood of dementias among rural-dwelling Chinese older adults, especially among people without anemia.
INTRODUCTION
Dementia affects over 50 million people worldwide, and nearly 60%of all dementia patients live in low- and middle-income countries (LMICs) [1]. Notably, the number of people with dementia is projected to increase faster in LMICs than in high-income countries in the coming decades [1, 2]. Since the 1990s the prevalence of dementia in China has increased steadily in all age groups from 60 years of age [3]. The total annual expenditure for dementia in China was estimated at US$168 billion [4]. The prevalence of dementia was notably higher in the rural than urban communities [5]. Given that there is currently no curative therapy available for dementia, identifying modifiable risk factors is crucial for preventive and therapeutic interventions to delay the onset of dementia and slow cognitive decline.
The red blood cell distribution width (RDW) is a simple parameter that reflects the heterogeneity of circulating erythrocyte volume [6]. It is routinely calculated by the overwhelming majority of hematologic analyzers according to red blood cell (RBC) volume and mean corpuscular volume (MCV). A normal RDW suggests homogeneous RBC size, whereas an elevated RDW indicates heterogeneous RBC size, known as anisocytosis. RDW in combination with MCV can used for differential diagnosis of anemia [7]. An elevated RDW is often related to anemia due to nutrient deficiency (e.g., iron, vitamin B12, and folic acid) and sideroblastic anemia, and a normal RDW is often related to anemia from chronic disease, thalassemia heterozygosity, and aplastic anemia [8]. Studies have shown that an increased RDW is associated with mortality [9], diabetes [10], cardiovascular disease [11], stroke [12], and other chronic health conditions [13]. The association of RDW with adverse health outcomes may depend on anemia or hemoglobin levels [14]. Of note, the cross-sectional data from the Chicago Health and Aging Project found that elevated RDW was associated with dementia, especially among non-anemic participants [15]. In addition, evidence has been accumulating over the last decade that anemia or low hemoglobin is related to cognitive impairment and dementia among older adults [16, 17]. However, most population-based studies of anemia and dementia have been conducted among high-income countries. In particular, the relationship of abnormal RDW with dementia and cognitive function as well as the interplay of increased RDW and anemia in cognitive aging has yet to be explored among LMICs.
Therefore, in this population-based cross-sectional study of older adults living in the rural communities in China, we sought 1) to evaluate the associations of RDW and anemia with dementia and global cognitive function; and 2) to explore whether their association varied by anemia status.
MATERIALS AND METHODS
Study design and participants
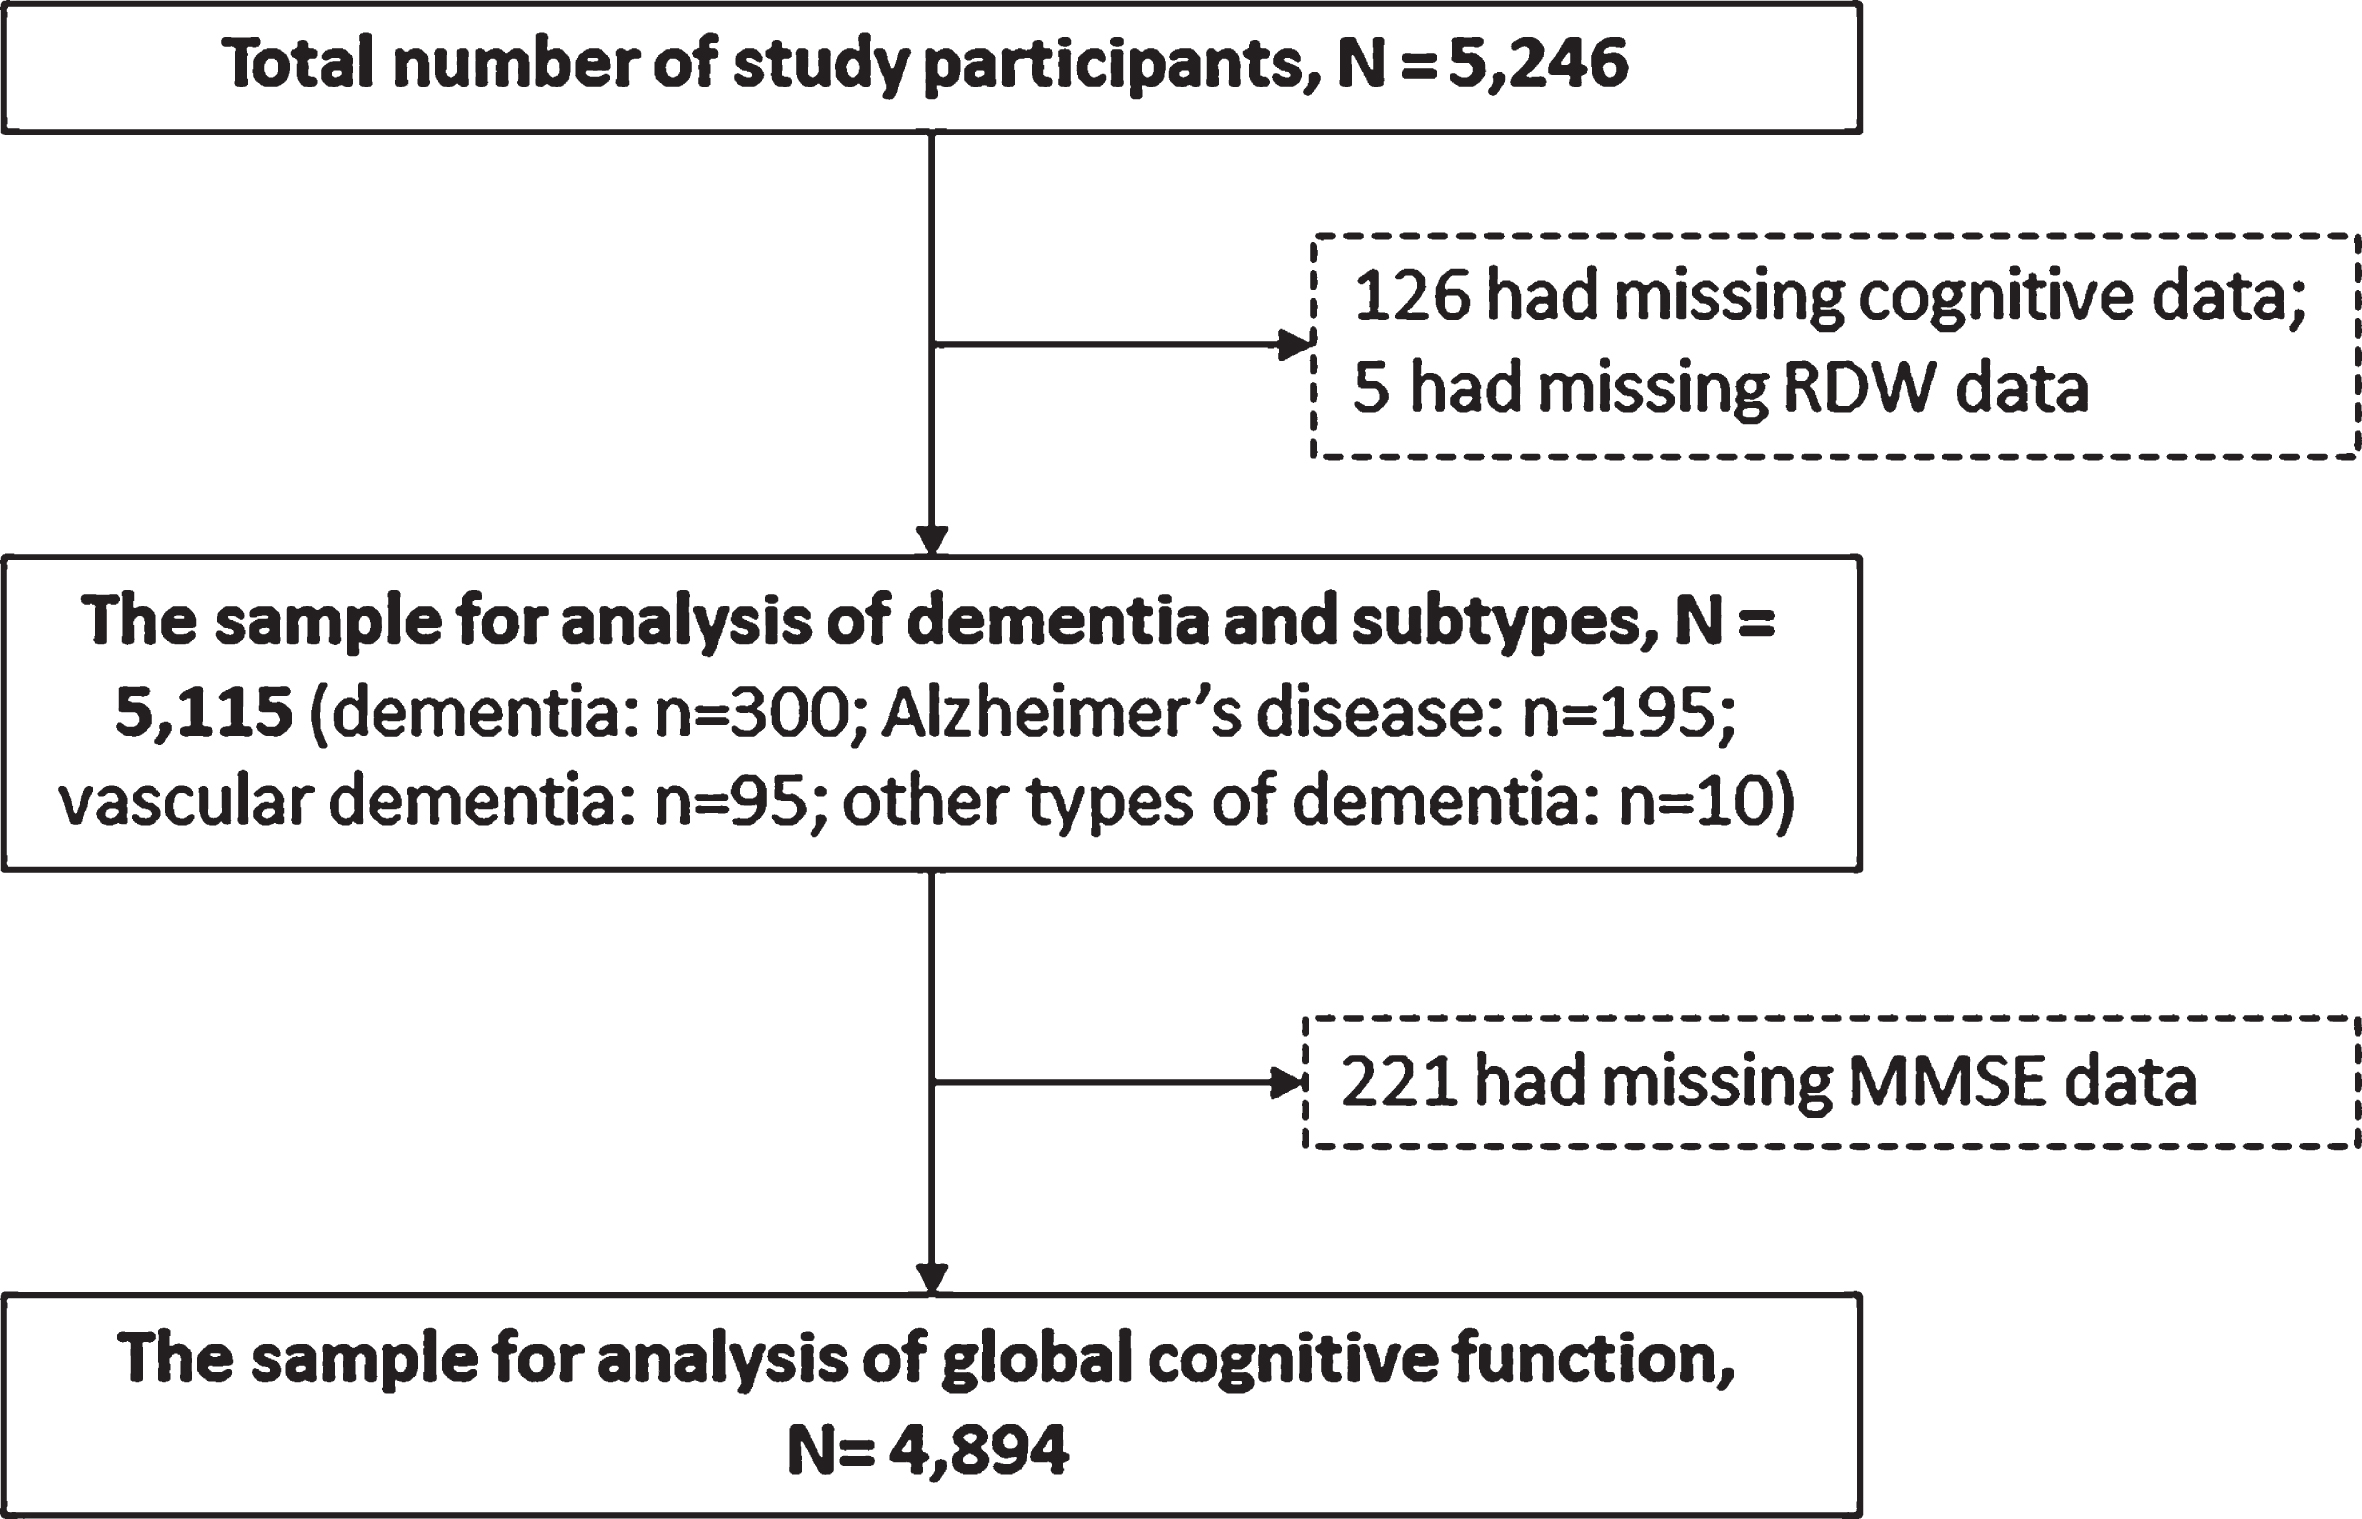
This is a cross-sectional population-based study. The participants were derived from the Multimodal Interventions to Delay Dementia and Disability in rural China (MIND-CHINA), an ongoing project within the World-Wide FINGERS Network [18]. MIND-CHINA aims to test the effects of multidomain interventions on cognitive decline, onset of dementia, and disability among rural-dwelling elderly people. In March-September 2018, we performed the baseline assessments that targeted adults who were aged 60 years or older and living in the rural communities of Yanlou Town, Yanggu County in western Shandong province, China [19]. In this study, we excluded people who were aged 60–64 years because our study focused on late-onset dementia. There were 5,246 participants aged ≥65 years completed the baseline survey. Of these, 131 were excluded due to missing data on the diagnoses of dementia status (n = 126) and RDW (n = 5), leaving 5,115 (97.5%) participants for the current analysis. For the analysis involving global cognitive performance, we further excluded 221 persons who had missing information on the Mini-Mental State Examination (MMSE) score, leaving 4,894 participants in the analytical sample (Fig. 1). There were no significant differences between participants in the analytical sample (n = 5,115) and those who were excluded (n = 131) with regard to age (mean age 71.8 versus 71.4 years, p = 0.483), sex (women 57.0%versus 62.6%, p = 0.204), and education (illiteracy 40.5%versus 48.9%, p = 0.054).
Fig. 1
Flowchart of the study participants. RDW, red cell distribution width; DSM-IV, Diagnostic and Statistical Manual of Mental Disorders, 4th Edition; MMSE, Mini-Mental State Examination; AD, Alzheimer’s disease; VaD, vascular dementia.
The MIND-CHINA Study was conducted in accordance with the Declaration of Helsinki and approved by the Ethics Committee at Shandong Provincial Hospital in Jinan, Shandong. Written informed consents were obtained from all participants, or in the case of cognitively impaired persons, from informants (usually a family member).
Data collection
Data were collected by trained medical staff through face-to-face interviews, clinical examinations, neuropsychological tests, and laboratory tests in the local township health center, following the structured questionnaire [19]. We collected data on socio-demographics (sex, age, and education), health-related behavioral factors (e.g., alcohol use and smoking), medical history (e.g., stroke, coronary heart disease (CHD), hypertension, diabetes, and dyslipidemia), use of medications, and functional assessments. Height and weight were measured in light clothes without shoes. Body mass index (BMI) was calculated as weight (kilograms) divided by height (meters) squared (kg/m2). We measured arterial blood pressure on the right upper arm twice after a 5-min rest in a sitting position with an electronic sphygmomanometer (Omron HEM-7127J; Omron Corporation, Kyoto, Japan). Peripheral blood samples were collected after an overnight fast by experienced nurses. Serum glucose, total cholesterol, triglycerides, creatine, and other biochemical markers were measured with an automatic biochemical analyzer in the clinical laboratory of Yanlou Town Hospital using the enzymatic methods. Genomic DNA was extracted from peripheral blood leukocytes and APOE genotype was determined by multiplex polymerase chain reaction assay.
Measurements of RDW and hemoglobin and definition of anemia
Fasting peripheral venous blood samples were collected in a tube with 2 mL ethylenediaminetetraacetic acid (EDTA). Complete blood count (CBC) parameters, including MCV, RDW, and hemoglobin concentrations, were assayed with a Mindray BC-6800 automated hematology analyzer (Mindray Medical International Ltd, Shenzhen, CHN) in the laboratory of Yanlou Town Hospital. MCV was a measure of the average size of circulatory RBCs [20]. RDW was calculated by dividing the standard deviation (SD) of RBC volume by the MCV [21]. The normal calibration reference of RDW in the laboratory was 11.0%–14.5%and the cut-off value for abnormal RDW was set at 14.5%. However, the normal reference might slightly vary by different ethnical groups and geographical areas. Anemia was defined as hemoglobin < 13 g/dl for men and < 12 g/dl for women according to the World Health Organization (WHO) criteria [22].
Assessment of cognitive function and diagnosis of dementia and subtypes
Cognitive function was assessed by trained medical staff from the Department of Neurology, Shandong Provincial Hospital. A neuropsychological test battery was used to assess cognitive function, including subjective cognitive complaints, global cognitive function, and cognitive subdomains (e.g., memory, information-processing speed, executive function, and language). The main neurocognitive assessment battery included AD8, MMSE, auditory verbal learning test, the Digit Span test, Category Verbal Fluency Test, Trail Making Test, and the clock drawing task. We used the MMSE test to evaluate global cognitive function [23].
A 3-step procedure was followed for the diagnosis of clinical dementia and main subtypes of dementia. In brief, clinicians and trained junior interviewers conducted routine clinical examination and comprehensive assessments for each participant following the structured questionnaires. The assessments included health-related factors, medical history, a neurocognitive assessment battery, Activities of Daily Living (ADLs), and the Clinical Dementia Rating Scale (CDR) from participants or participant’s informants. Then, the neurologists specialized in dementia diagnosis and care reviewed all of the data collected from the clinical examination, questionnaire survey, and neurocognitive testing, and made a preliminary diagnosis for participants who were suspected to have dementia based on the survey, clinical examination, MMSE test, and ADLs. Out of the 5,115 participants, around 5.5%were suspected to have dementia by the neurologists through carefully reviewing all the records, and additionally around 9.5%had incomplete data for the assessment of dementia status. Finally, these persons were contacted by neurologists to conduct the second interview and reassess their medical history, cognitive status, ADLs, and whenever available, neuroimaging data. If the participants were not able to take the interview due to severe cognitive impairment or not available for the face-to-face interviews (about 13%), the neurologists interviewed their family members, neighbors, or village doctors (who provide primary care services to local residents). Based on all the assessments, a diagnosis of dementia was made according to the criteria outlined in the Diagnostic and Statistical Manual of Mental Disorders, 4th Edition (DSM-IV) [24]. In case of uncertainty, a senior neurologist was consulted and discussed, and a consensus diagnosis of dementia was reached. The diagnosis of dementia was further categorized into different subtypes according to the respective diagnostic criteria. Alzheimer’s disease (AD) was diagnosed according to the National Institute on Aging-Alzheimer’s Association (NIA-AA) criteria for probable AD [25]. Vascular dementia (VaD) was diagnosed using the National Institute of Neurological Disorders and Stroke and the Association Internationale pour la Recherche et l’Enseignement en Neurosciences (NINDS-AIREN) criteria [26].
Assessment of covariates
We considered demographic features, lifestyle factors, and health conditions as potential confounders. All variables were assessed, defined, and categorized following the standard approaches, as previously described [19]. In brief, education was categorized into illiteracy (no formal schooling), primary school (1–5 years), and middle school or above (≥6 years). Smoking status was categorized into current, former, or never smoking. Alcohol consumption was defined as drinking alcoholic beverage at least once a month in the past 12 months based on participants’ response to the question “In the past 12 months, have you had any alcoholic drinks?” and “How often did you drink alcohol?”.
Hypertension was defined as systolic blood pressure (SBP) ≥140 mm Hg or diastolic blood pressure (DBP) ≥90 mm Hg or current use of antihypertensive drugs. Diabetes was defined as a fasting blood glucose ≥7.0 mmol/L, having a self-reported history of physician’s diagnosis of diabetes or current use of blood glucose-lowering agents or insulin injection. Dyslipidemia was defined as having one of the following criteria: 1) serum total cholesterol level ≥6.22 mmol/l, 2) serum LDL-C level ≥4.14 mmol/l, 3) serum triglycerides level ≥2.27 mmol/l, 4) serum HDL-C level < 1.04 mmol/l, or 5) current use of lipid-regulating medications [27]. The estimated glomerular filtration rate (eGFR) was calculated with the CKD-EPI creatinine equation. Impaired renal function was defined as eGFR < 60 ml/min/1.73 m2 [28]. Coronary heart disease and stroke were ascertained by a self-reported physician’s diagnosis of stroke and clinical and neurological examination. The 15-item Geriatric Depressive Scale (GDS-15) was used to assess depressive symptoms [29]. The presence of depressive symptoms was defined as having a GDS-15 score ≥5 [30].
Statistical analysis
We reported frequencies (%) for categorical variables and mean (SD) for continuous variables. Characteristics of study participants by quartiles of RDW were compared by using chi-squared test for categorical variables and one-way analysis of variance (ANOVA) for continuous variables. Multiple binary and multinomial logistic regression analyses were performed to estimate the odds ratio and 95%confidence interval (CI) of dementia and subtype dementias associated with RDW and anemia. RDW was categorized into quartiles, with the second quartile being used as the reference group, because the restricted cubic Spline regression analysis suggested a nonlinear (J-shaped) relationship between RDW levels and odds ratio of dementia. We performed multivariable general linear regression analyses to estimate β-coefficient and 95%CI of MMSE score associated with RDW among participants. We reported the main results from two models: model 1 was adjusted for age, sex, and education; and model 2 was additionally adjusted for alcohol use, smoking, BMI, hypertension, diabetes, dyslipidemia, impaired renal function, APOE ɛ4 allele, history of coronary heart disease and stroke, and the presence of depressive symptoms. However, because a previous study suggested that the association of RDW with dementia was evident mainly among people without anemia [15], we also performed stratified analysis by anemia. IBM SPSS Statistics for Windows, Version 22.0 (IBM Corp, Armonk, NY, USA) was used for all the analyses, except the restricted cubic spline regression analysis where the R package for Windows (version 4.0.2, R Foundation for Statistical Computing, Vienna, Austria) was used. A two-tailed p < 0.05 was considered to be statistically significant.
RESULTS
Characteristics of study participants
Table 1 summarizes the characteristics of the study participants by quartiles of RDW. The mean age of the 5,115 participants was 71.7 (SD = 5.5; range, 65–99) years, 40.5%were illiteracy, and 56.9%were women. Of those, 300 (5.9%) were diagnosed with dementia, including 195 (3.8%) with AD and 95 (1.9%) with VaD. The mean RDW was 13.6%(SD = 0.9; range, 11.0%–29.5%). 492 participants (9.6%) had abnormal RDW (RDW > 14.5%).
Table 1
Characteristics of the study participants by quartiles of red cell distribution width
| Characteristics | Total sample (n = 5,115) | Red cell distribution width, quartiles | ||||
| Lowest (< 13.1%) | Second (13.1%–13.5%) | Third (13.6%–14.0%) | Highest (> 14.0%) | pa | ||
| No. of participants | 1,309 | 1,386 | 1,248 | 1,172 | ||
| Socio-demographic factors | ||||||
| Female, n (%) | 2,917 (57.0) | 772 (59.0) | 786 (56.7) | 733 (58.7) | 626 (53.4) | 0.020 |
| Age (y), mean (SD) | 71.8 (5.5) | 71.1 (5.0) | 71.4 (5.3) | 71.7 (5.5) | 73.0 (6.0) | < 0.001 |
| Education, n (%) | 0.910 | |||||
| Illiteracy | 2,070 (40.5) | 524 (40.0) | 550 (39.7) | 507 (40.6) | 489 (41.7) | |
| Primary school | 2,221 (43.4) | 565 (43.2) | 616 (44.4) | 537 (43.0) | 503 (42.9) | |
| Middle school or above | 824 (16.1) | 220 (16.8) | 220 (15.9) | 204 (16.3) | 180 (15.4) | |
| Lifestyle factors | ||||||
| Alcohol consumptionb, n (%) | 1,886 (37.3) | 466 (36.1) | 510 (37.4) | 456 (36.8) | 454 (39.0) | 0.499 |
| Smokingb, n (%) | 0.426 | |||||
| Never | 3,503 (68.6) | 919 (70.3) | 935 (67.6) | 870 (69.8) | 779 (66.6) | |
| Former | 567 (11.1) | 134 (10.2) | 156 (11.3) | 133 (10.7) | 144 (12.3) | |
| Current | 1,039 (20.3) | 255 (19.5) | 293 (21.2) | 244 (19.6) | 247 (21.1) | |
| Genetic factors | ||||||
| APOE ɛ4 alleleb, n (%) | 784 (16.1) | 203 (16.4) | 214 (16.1) | 172 (14.4) | 195 (17.3) | 0.270 |
| Clinical factors | ||||||
| Body mass indexb (kg/m2), mean (SD) | 24.8 (3.8) | 24.7 (3.6) | 25.0 (3.6) | 25.0 (3.9) | 24.6 (4.2) | 0.010 |
| Coronary heart disease, n (%) | 1,121 (21.9) | 282 (21.5) | 277 (20.0) | 296 (23.7) | 266 (22.7) | 0.116 |
| Strokeb, n (%) | 847 (16.6) | 200 (15.3) | 243 (17.6) | 205 (16.4) | 199 (17.0) | 0.433 |
| Hypertensionb, n (%) | 3,409 (67.2) | 928 (71.5) | 932 (67.8) | 817 (66.0) | 732 (63.0) | < 0.001 |
| Diabetes mellitus, n (%) | 725 (14.2) | 207 (15.8) | 203 (14.6) | 164 (13.1) | 151 (12.9) | 0.119 |
| Dyslipidemia, n (%) | 1,216 (23.8) | 326 (24.9) | 350 (25.3) | 284 (22.8) | 256 (21.8) | 0.126 |
| Impaired kidney function, n (%) | 514 (10.0) | 96 (7.3) | 135 (9.7) | 129 (10.3) | 154 (13.1) | < 0.001 |
| Anemia, n (%) | 1,038 (20.3) | 168 (12.8) | 208 (15.0) | 262 (21.0) | 400 (34.1) | < 0.001 |
| GDS-15 score≥5b, n (%) | 463 (9.9) | 137 (11.3) | 117 (9.1) | 121 (10.5) | 88 (8.6) | 0.127 |
| ADLs disabilityb, n (%) | 531 (10.8) | 129 (10.3) | 144 (10.7) | 129 (10.8) | 129 (11.7) | 0.743 |
| CDR score≥0.5b, n (%) | 2,515 (49.2) | 620 (47.4) | 653 (47.1) | 616 (49.4) | 626 (53.4) | 0.006 |
| MMSE scoreb, mean (SD) | 20.6 (6.2) | 20.9 (6.0) | 20.9 (6.1) | 20.6 (6.0) | 19.7 (6.7) | < 0.001 |
| Dementia, n (%) | 300 (5.9) | 63 (4.8) | 63 (4.5) | 70 (5.6) | 104 (8.9) | < 0.001 |
| Alzheimer’s disease | 195 (3.8) | 43 (3.3) | 41 (3.0) | 47 (3.8) | 64 (5.5) | |
| Vascular dementia | 95 (1.9) | 18 (1.4) | 20 (1.4) | 20 (1.6) | 37 (3.2) | |
ADLs, Activities of Daily Living; CDR, Clinical Dementia Rating Scale; GDS-15, 15-item Geriatric Depressive Scale; MMSE, Mini-Mental State Examination; SD, standard deviation. ap value was for the test of differences among the quartile groups of RDW. bThe numbers of people with missing values were 57 in alcohol consumption, 6 in smoking, 232 in APOE ɛ4 allele, 30 in body mass index, 44 in hypertension, 6 in stroke, 447 in GDS-15 score, 214 in ADLs, 254 in CDR score, and 221 in MMSE score.
As RDW quartile increased, prevalence of anemia progressively increased from 12.8%in the first quartile and 15.0%in the second quartile to 34.1%in the fourth quartile (p for trend < 0.001). Overall, participants in the higher quartiles of RDW were older, more likely to be male and have a lower BMI, less likely to have hypertension, and more likely to have impaired renal function compared to those with lower quartiles of RDW (p < 0.05). With increase in RDW quartile, the mean MMSE score decreased, CDR score increased, and the prevalence of dementia, AD, and VaD increased (p < 0.05) (Table 1).
Associations of anemia and red cell distribution width with dementia and subtypes
Of all 5,115 participants, 1,038 were defined with anemia, resulting in the overall prevalence of anemia being 20.3%in the total sample. Anemia was not significantly associated with the odds ratio of dementia, AD, and VaD (Table 2).
Table 2
Associations of anemia and red cell distribution width with dementia, Alzheimer’s disease, and vascular dementia: binary and multinomial logistic regression models
| Anemia and RDW | No. of subjects | Dementia | Alzheimer’s disease | Vascular dementia | ||||||
| No. of cases | OR (95%confidence interval) | No. of cases | OR (95%confidence interval) | No. of cases | OR (95%confidence interval) | |||||
| Model 1a | Model 2a | Model 1a | Model 2a | Model 1a | Model 2a | |||||
| Anemia | ||||||||||
| No | 4,077 | 221 | 1.00 (Ref.) | 1.00 (Ref.) | 137 | 1.00 (Ref.) | 1.00 (Ref.) | 77 | 1.00 (Ref.) | 1.00 (Ref.) |
| Yes | 1,038 | 79 | 1.02 (0.77, 1.34) | 1.25 (0.86, 1.81) | 58 | 1.13 (0.81, 1.57) | 1.41 (0.92, 2.16) | 18 | 0.75 (0.44, 1.27) | 0.78 (0.35, 1.74) |
| RDW, quartilesb | ||||||||||
| Q1 | 1,309 | 63 | 1.18 (0.82, 1.70) | 1.45 (0.87, 2.44) | 43 | 1.27 (0.81, 1.99) | 1.41 (0.76, 2.62) | 18 | 1.02 (0.54, 1.95) | 1.72 (0.64, 4.60) |
| Q2 | 1,386 | 63 | 1.00 (Ref.) | 1.00 (Ref.) | 41 | 1.00 (Ref.) | 1.00 (Ref.) | 20 | 1.00 (Ref.) | 1.00 (Ref.) |
| Q3 | 1,248 | 70 | 1.22 (0.85, 1.75) | 1.77 (1.07, 2.93) | 47 | 1.26 (0.81, 1.96) | 1.75 (0.97, 3.17) | 20 | 1.10 (0.59, 2.07) | 2.01 (0.76, 5.32) |
| Q4 | 1,172 | 104 | 1.73 (1.24, 2.42) | 2.28 (1.40, 3.72) | 64 | 1.62 (1.07, 2.45) | 2.29 (1.29, 4.08) | 37 | 1.98 (1.14, 3.45) | 2.32 (0.90, 6.00) |
OR, odds ratio; RDW, red cell distribution width. aModel 1 was adjusted for age, sex, and education; Model 2 was additionally adjusted for alcohol use, smoking, APOE ɛ4 allele, body mass index, hypertension, diabetes mellitus, dyslipidemia, coronary heart disease, stroke, impaired renal function, and depressive symptoms. bThe cut-offs of RDW quartiles were < 13.1%(Q1), 13.1%–13.5%(Q2), 13.6%–14.0%(Q3), and > 14.0%(Q4).
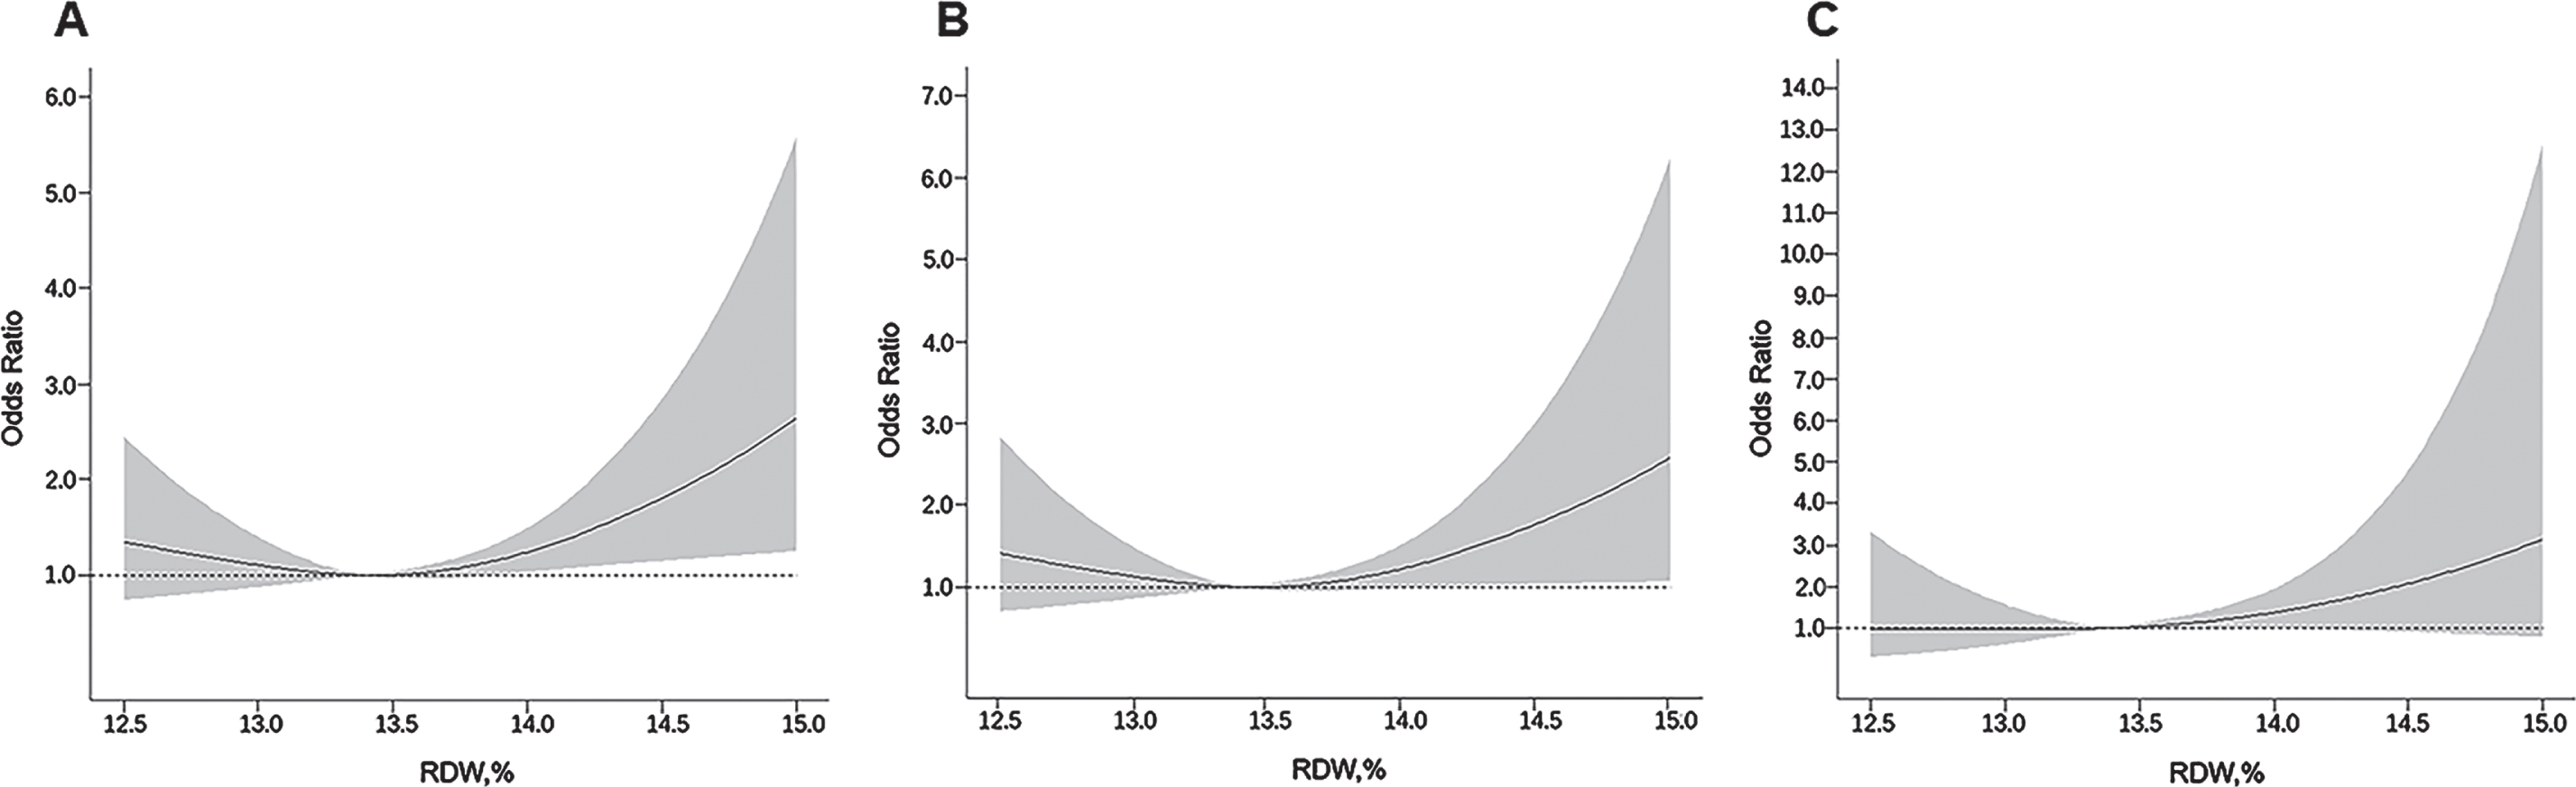
The restricted cubic spline regression analysis suggested a nonlinear (J-shaped) association between RDW levels and the likelihood of dementia (pnon-linearity < 0.05). The nadir for the likelihood of dementia estimated from the piecewise linear models was at the RDW level of 13.4%(Fig. 2A). Similarly, there was a J-shaped pattern of associations between RDW level and odds ratio of AD and VaD (Fig. 2B, C). We further analyzed RDW level by quartiles, with the second quartile being the reference group. When adjusting for multiple confounders, the odds ratio of having dementia associated with the quartiles of RDW were 1.45 (95%CI 0.87, 2.44), 1.00 (reference), 1.77 (1.07, 2.93), and 2.28 (1.40, 3.72), respectively (Table 2, Model 2). There was a similar pattern of associations between RDW quartiles and the odds ratio of AD and VaD, although the association of the fourth quartile RDW with VaD was not significant (Table 2).
Fig. 2
Associations of red cell distribution width (RDW) with dementia (A), Alzheimer’s disease (B), and vascular dementia (C), allowing for nonlinear relationships. The model was adjusted for age, sex, education, alcohol use, smoking, APOE ɛ4 allele, body mass index, hypertension, diabetes mellitus, dyslipidemia, coronary heart disease, stroke, impaired renal function, and depressive symptoms. The solid line shows odds ratio, and the shaded area shows 95%confidence interval.
There were no statistical interactions of RDW quartiles with anemia on the likelihood of dementia and subtypes (p for all interactions > 0.05). However, the results from the stratifying analysis by anemia showed that the J-shaped association between RDW levels and odds ratio of dementia, AD, and VaD was statistically significant among participants without anemia, but not among those with anemia (Table 3).
Table 3
Associations of red cell distribution width with dementia, Alzheimer’s disease, and vascular dementia stratified by anemia: binary and multinomial logistic regression models
| RDW (%) | No. of subjects | Dementia | Alzheimer’s disease | Vascular dementia | ||||||
| No. of cases | OR (95%confidence interval) | No. of cases | OR (95%confidence interval) | No. of cases | OR (95%confidence interval) | |||||
| Model 1a | Model 2a | Model 1a | Model 2a | Model 1a | Model 2a | |||||
| Anemia, no | ||||||||||
| RDW, quartilesb | ||||||||||
| Q1 | 1141 | 50 | 1.10 (0.73, 1.65) | 1.32 (0.73, 2.38) | 33 | 1.18 (0.71, 1.96) | 1.27 (0.62, 2.59) | 16 | 0.98 (0.50, 1.94) | 1.31 (0.46, 3.69) |
| Q2 | 1178 | 52 | 1.00 (Ref.) | 1.00 (Ref.) | 33 | 1.00 (Ref.) | 1.00 (Ref.) | 18 | 1.00 (Ref.) | 1.00 (Ref.) |
| Q3 | 780 | 39 | 1.08 (0.70, 1.67) | 1.63 (0.88, 3.03) | 24 | 1.03 (0.60,1.79) | 1.70 (0.81, 3.59) | 12 | 0.97 (0.46, 2.04) | 1.23 (0.40, 3.86) |
| Q4 | 978 | 80 | 1.81 (1.25, 2.63) | 2.12 (1.21, 3.72) | 47 | 1.68 (1.05, 2.69) | 2.10 (1.06, 4.16) | 31 | 2.03 (1.12, 3.67) | 2.08 (0.78, 5.53) |
| Anemia, yes | ||||||||||
| RDW, quartilesc | ||||||||||
| Q1 | 279 | 18 | 0.81 (0.41, 1.57) | 1.25 (0.50, 3.13) | 14 | 0.78 (0.37, 1.63) | 1.04 (0.39, 2.82) | 2 | 0.47 (0.09, 2.63) | 1.85 (0.14, 25.28) |
| Q2 | 252 | 22 | 1.00 (Ref.) | 1.00 (Ref.) | 18 | 1.00 (Ref.) | 1.00 (Ref.) | 4 | 1.00 (Ref.) | 1.00 (Ref.) |
| Q3 | 258 | 15 | 0.64 (0.32, 1.29) | 1.32 (0.54, 3.22) | 10 | 0.53 (0.24, 1.20) | 1.03 (0.38, 2.77) | 5 | 1.07 (0.28, 4.10) | 3.99 (0.36, 43.67) |
| Q4 | 249 | 24 | 1.04 (0.55, 1.97) | 1.83 (0.75, 4.48) | 16 | 0.89 (0.43, 1.85) | 1.57 (0.60, 4.12) | 7 | 1.41 (0.40, 5.03) | 2.27 (0.17, 30.08) |
RDW, red cell distribution width; OR, odds ratio. aModel 1 was adjusted for age, sex, and education; Model 2 was additionally adjusted for alcohol use, smoking, APOE ɛ4 allele, body mass index, hypertension, diabetes mellitus, dyslipidemia, coronary heart disease, stroke, impaired renal function, and depressive symptoms. bThe cut-offs of RDW quartiles were < 13.1%(Q1), 13.1%–13.5%(Q2), 13.6%–13.8%(Q3), and > 13.8%(Q4). cThe cut-offs of RDW quartiles were < 13.3%(Q1), 13.3%–13.7%(Q2), 13.8%–14.3%(Q3), and > 14.3%(Q4).
Associations of anemia and red cell distribution width with global cognitive performance
Anemia was significantly associated with a lower MMSE score, even in model 2 when controlling for multiple potential confounders (Table 4).
Table 4
Associations of the Mini-Mental State Examination test score with anemia and red cell distribution width: the general linear regression model
| Anemia and RDW | No. of participants | β-coefficient (95%confidence interval), MMSE score | |
| Model 1a | Model 2a | ||
| Anemia | |||
| No | 3,914 | 0.00 (Ref.) | 0.00 (Ref.) |
| Yes | 980 | –0.65 (–0.99, –0.32) | –0.55 (–0.89, –0.21) |
| RDW, quartilesb | |||
| Q1 | 1,259 | –0.04 (–0.40, 0.32) | –0.05 (–0.42, 0.31) |
| Q2 | 1,337 | 0.00 (Ref.) | 0.00 (Ref.) |
| Q3 | 1,207 | –0.19 (–0.56, 0.17) | –0.26 (–0.63, 0.11) |
| Q4 | 1,091 | –0.93 (–1.31, –0.55) | –0.92 (–1.30, –0.54) |
MMSE, Mini-Mental State Examination; RDW, red cell distribution width. aModel 1 was adjusted for age, sex, and education; Model 2 was additionally adjusted for alcohol use, smoking, APOE ɛ4 allele, body mass index, hypertension, diabetes mellitus, dyslipidemia, coronary heart disease, stroke, impaired renal function, and depressive symptoms. bThe cut-offs of RDW quartiles were < 13.1%(Q1), 13.1%–13.5%(Q2), 13.6%–14.0%(Q3), and > 14.0%(Q4).
There was an inverted J-shaped association between RDW level and MMSE score, even in model 2 when controlling for multiple potential confounders (Table 4). The multivariable-adjusted β-coefficients (95%CI) of MMSE score associated with quartile of RDW were –0.05 (95%CI –0.42, 0.31), 0.00 (reference), –0.26 (–0.63, 0.11), and –0.92 (–1.30, –0.54), respectively. Further stratified analysis by anemia suggested that the associations between RDW levels and MMSE score were similar (data not shown).
DISCUSSION
This large-scale population-based cross-sectional study targets the rural community-dwelling older people who have received no or limited education in China. This study shows a J-shaped association between RDW levels and the likelihood of dementia and AD. Although anemia was not associated with dementia in this population, we found that the J-shaped association between RDW and the likelihood of dementia and AD was evident mainly among people without anemia. This implies that RDW could reflect additional pathological processes in dementia than being captured by anemia. Finally, we found that anemia and elevated RDW were associated with poorer global cognitive performance.
Anemia affected one-fifth of our study population, which is consistent with previous reports [31]. We found that anemia was associated with poor global cognitive performance assessed by MMSE, which is consistent with previous reports from population-based cross-sectional studies [32]. Previous studies have yielded conflicting results with regard to the relationship between anemia and dementia among older adults. The Sao Paulo Ageing & Health Study found no cross-sectional association between anemia and dementia among people aged over 65 years with very low income [33], which is in a good agreement with our cross-sectional study. Given the cross-sectional nature of these studies and the facts that anemia or low hemoglobin is associated with increased morbidity and mortality in older adults [34, 35], there is a potential that selective survival related to both anemia and dementia might, at least partly, contribute to the null association. Indeed, longitudinal population-based cohort studies do show an association between anemia and an elevated risk of dementia. For instance, the Rush Memory and Aging Project of community-dwelling elders in the US found that people with anemia had a 60%increased hazard for AD dementia [17]. Thus, prospective cohort studies are warranted to illuminate the relationship between anemia and risk of dementia in elderly people.
Very few population-based studies have so far examined the associations of RDW with cognitive function and dementia among older adults. A cross-sectional data of the Chicago Health and Aging Project (age≥65 years) found that a higher RDW concentration was associated with a greater likelihood of dementia, notably among people without anemia [15]. The community-based Osteoporotic Fractures in Men study (age≥65 years) in the US showed that an elevated RDW was associated with poorer cognitive function [36]. We revealed a J-shaped association between RDW levels and the odds ratio of dementia. The J-shaped pattern of RDW-dementia association was in line with some observational studies that examined the relationships between RDW and adverse health outcomes (e.g., neurological diseases and mortality) among Asian populations. For instance, the cross-sectional population-based study of people aged≥45 years in South Korea demonstrated a J-shaped relationship between RDW and severity of leukoaraiosis [14]. In addition, a J-shaped association between RDW and all-cause mortality among patients with cardiovascular disease or stroke was reported in two large-scale studies from mainland China [37] and Taiwan [38]. Our study extends the previous findings by showing a J-shaped association of RDW with the likelihood of cognitive aging among rural-dwelling Chinese older adults. Of note, we found that the J-shaped relationship was more evident among older adults with no anemia than those with anemia. This is consistent with the findings from a recent report of community-dwelling, middle-aged, urban adults in Baltimore, US, in which an elevated RDW was cross-sectionally associated with poor cognitive performance mainly among non-anemic individuals [39].
To the best of our knowledge, the relationship between RDW and VaD has not been investigated previously. Our study showed an overall J-shaped association between RDW and odds ratio of VaD, although the association of the fourth quartile of RDW (versus the second quartile) with an increased odds ratio of VaD was diluted and became statistically non-significant when further controlling for multiple potential confounders, possibly owing to limited statistical power. Indeed, the association of greater RDW with an increased odds ratio of VaD was in accordance with the findings from the previous studies that showed an association of high RDW with cerebrovascular disease [12, 38]. Future large-scale prospective cohort studies are imperative to clarify the relationship between RDW and VaD.
The mechanisms underlying the cross-sectional association of RDW with dementia is not fully understood and can only be speculated. Firstly, a high RDW may cause hypoxia due to decreased deformability of red blood cells [40]. Deficient oxygen transport may trigger changes of cerebral blood flow, hypoperfusion [41], and glucose hypometabolism [42]. These conditions are subject to cerebrovascular lesions, accelerated amyloid-β protein deposition, and blood-brain barrier disruption [43]. Secondly, as an inflammatory biomarker, RDW is known to be correlated with neuroinflammation and oxidative stress [44], pathways that play an important role in the pathogenesis of dementia and AD [45, 46]. Systemic inflammation contributes to hypertension, diabetes, cardiovascular disease, and stroke, which are regarded as risk factors of dementia and AD. Thirdly, an elevated RDW tends to be closely related to iron deficiency anemia, which may facilitate cognitive decline through affecting the synthesis of neurotransmitters and catecholamine metabolism [47, 48]. Finally, an elevated RDW could be an indicator of megaloblastic anemia caused by diet and nutrient deficiencies, such as vitamin B12 and folic acid. Vitamin and folic acid deficiencies may lead to homocysteine levels rising, which is considered as an independent risk factor of cardiovascular diseases and dementia [49].
It is unclear why the association between RDW and dementia was evident, especially among people without anemia. At the beginning of abnormal hematopoiesis, there is a mixture of normal erythrocytes and variable-sized erythrocytes in circulation. A substantial increase in RDW levels may be prior to decline in hemoglobin and the development of anemia [50]. This means that an elevated RDW could capture additional information about risk beyond what anemia and hemoglobin may capture [9]. However, the association of greater RDW levels with dementia was attenuated among older adults with anemia, which is similar to the well-established relationships between RDW and mortality [51]. RDW and anemia may share the same underlying mechanisms of dementia, such as hypoxia, folic acid and vitamin deficiencies, iron deficiency, and oxidative stress [15]. Hence, the association of RDW with cognitive aging can be diluted when developing anemia.
Our study was the first community-based study to explore the relationship between RDW and anemia and cognitive aging in rural-dwelling Chinese older adults, in which comprehensive data were collected following standard protocols. However, our study has limitations. Firstly, we could not determine the causal relationship of RDW with cognitive outcomes due to the cross-sectional design. However, our findings imply that elevated RDW may be a biochemical marker for the dementias. Secondly, we were unable to explore in-depth the potential neuropathological mechanisms underlying the relationship between RDW and cognitive outcomes owing to lack of relevant data (e.g., plasma inflammatory markers, amyloid-β, and tau proteins). Furthermore, RDW is associated with nutritional anemia, and the lack of nutritional markers, such as serum vitamin B12, folate, and iron parameters (e.g., serum iron, ferritin, binding capacity, and percentage saturation), prevents us from comprehensively exploring the relationships between RDW, anemia, and dementia. Finally, our study sample was selected from one rural area of western Shandong province where participants had no or limited education and relatively low income. This should be kept in mind when generalizing our research findings to other populations.
CONCLUSION
In summary, this population-based cross-sectional study reveals a J-shaped association of RDW with the likelihood of dementia and AD among older people living in rural China, especially in people without anemia. We also show that anemia or greater RDW is associated with poorer global cognitive performance. However, we found no cross-sectional association of anemia with dementia and subtypes of dementia. Further longitudinal studies are required to clarify the potential causal relationship of RDW to dementia and poor cognitive performance as well as to explore the underlying biological mechanisms.
ACKNOWLEDGMENTS
We would like to thank all the participants of the MIND-CHINA project as well all staff in the MIND-CHINA Research Group for their collaboration in data collection and management. MIND-China is part of the World-Wide FINGERS Network.
MIND-CHINA was supported by the National Key R&D Program of China from the China Ministry of Science and Technology (grant no.: 2017YFC1310100) and by the grants from the National Natural Science Foundation of China (grants no.: 81772448, 81501099, 81861138008, and 8191101618), the Key R&D Program of Shandong Province (grant no.: 2016ZDJS07A11), and the Taishan Scholar Program of Shandong Province, China. T Ngandu received grants from Academy of Finland (project no.: 334804) for the EU Joint Program—Neurodegenerative Disease Research (JPND), Finland. M Kivipelto received grants from Academy of Finland (project no.: 317465), Finland, the Swedish Research Council (project no.: 2019-02226) for JPND, and the Knut and Alice Wallenberg Foundation, Stockholm, Sweden. LJ Launer is supported by the Intramural Program, NIA, NIH, USA. C Qiu received grants from Karolinska Institutet, the Swedish Research Council (grants no.: 2017-00740, 2017-05819, and 2020-01574), and the Swedish Foundation for International Cooperation in Research and Higher Education (STINT, grant no.: CH2019-8320), Stockholm, Sweden for research projects, the Sino-Sweden Joint Research Network and Projects, and the China-Sweden Mobility Program.
Author’s disclosures available online (https://www.j-alz.com/manuscript-disclosures/21-0517r1).
REFERENCES
[1] | Wimo A , Guerchet M , Ali GC , Wu YT , Prina AM , Winblad B , Jonsson L , Liu Z , Prince M ((2017) ) The worldwide costs of dementia 2015 and comparisons with 2010. Alzheimers Dement 13: , 1–7. |
[2] | Prince M , Bryce R , Albanese E , Wimo A , Ribeiro W , Ferri CP ((2013) ) The global prevalence of dementia: A systematic review and metaanalysis. Alzheimers Dement 9: , 63–75 e62. |
[3] | Chan KY , Wang W , Wu JJ , Liu L , Theodoratou E , Car J , Middleton L , Russ TC , Deary IJ , Campbell H , Wang W , Rudan I ((2013) ) Epidemiology of Alzheimer’s disease and other forms of dementia in China, 1990–2010: A systematic review and analysis. Lancet 381: , 2016–2023. |
[4] | Jia J , Wei C , Chen S , Li F , Tang Y , Qin W , Zhao L , Jin H , Xu H , Wang F , Zhou A , Zuo X , Wu L , Han Y , Han Y , Huang L , Wang Q , Li D , Chu C , Shi L , Gong M , Du Y , Zhang J , Zhang J , Zhou C , Lv J , Lv Y , Xie H , Ji Y , Li F , Yu E , Luo B , Wang Y , Yang S , Qu Q , Guo Q , Liang F , Zhang J , Tan L , Shen L , Zhang K , Zhang J , Peng D , Tang M , Lv P , Fang B , Chu L , Jia L , Gauthier S ((2018) ) The cost of Alzheimer’s disease in China and re-estimation of costs worldwide. Alzheimers Dement 14: , 483–491. |
[5] | Jia J , Wang F , Wei C , Zhou A , Jia X , Li F , Tang M , Chu L , Zhou Y , Zhou C , Cui Y , Wang Q , Wang W , Yin P , Hu N , Zuo X , Song H , Qin W , Wu L , Li D , Jia L , Song J , Han Y , Xing Y , Yang P , Li Y , Qiao Y , Tang Y , Lv J , Dong X ((2014) ) The prevalence of dementia in urban and rural areas of China. Alzheimers Dement 10: , 1–9. |
[6] | Salvagno GL , Sanchis-Gomar F , Picanza A , Lippi G ((2015) ) Red blood cell distribution width: A simple parameter with multiple clinical applications. Crit Rev Clin Lab Sci 52: , 86–105. |
[7] | Bessman JD , Gilmer PR Jr , Gardner FH ((1983) ) Improved classification of anemias by MCV and RDW. Am J Clin Pathol 80: , 322–326. |
[8] | Buttarello M ((2016) ) Laboratory diagnosis of anemia: Are the old and new red cell parameters useful in classification and treatment, how? Int J Lab Hematol 38: , 123–132. |
[9] | Patel KV , Semba RD , Ferrucci L , Newman AB , Fried LP , Wallace RB , Bandinelli S , Phillips CS , Yu B , Connelly S , Shlipak MG , Chaves PHM , Launer LJ , Ershler WB , Harris TB , Longo DL , Guralnik JM ((2010) ) Red cell distribution width and mortality in older adults: A meta-analysis. J Gerontol A Biol Sci Med Sci 65A: , 258–265. |
[10] | Gang L , Lifang W ((2016) ) Association of the elevated red blood cell distribution width with the risk of developing diabetes mellitus. Intern Med 55: , 1959–1965. |
[11] | Dabbah S , Hammerman H , Markiewicz W , Aronson D ((2010) ) Relation between red cell distribution width and clinical outcomes after acute myocardial infarction. Am J Cardiol 105: , 312–317. |
[12] | Wang C , Wang L , Zhong D , Deng L , Qiu S , Li Y , Liu M , Wu B ((2019) ) Association between red blood cell distribution width and hemorrhagic transformation in acute ischemic stroke patients. Cerebrovasc Dis 48: , 193–199. |
[13] | Karagöz E , Tanoglu A ((2014) ) Red blood cell distribution width is a potential prognostic index for liver disease. Clin Chem Lab Med 52: , e201. |
[14] | Lee HB , Kim J , Oh SH , Kim SH , Kim HS , Kim WC , Kim S , Kim OJ ((2016) ) Red blood cell distribution width is associated with severity of leukoaraiosis. PLoS One 11: , e0150308. |
[15] | Weuve J , Mendes de Leon CF , Bennett DA , Dong X , Evans DA ((2014) ) The red cell distribution width and anemia in association with prevalent dementia. Alzheimer Dis Assoc Disord 28: , 99–105. |
[16] | Schneider AL , Jonassaint C , Sharrett AR , Mosley TH , Astor BC , Selvin E , Coresh J , Gottesman RF ((2016) ) Hemoglobin, anemia, and cognitive function: The Atherosclerosis Risk in Communities Study. J Gerontol A Biol Sci Med Sci 71: , 772–779. |
[17] | Shah RC , Buchman AS , Wilson RS , Leurgans SE , Bennett DA ((2011) ) Hemoglobin level in older persons and incident Alzheimer disease:Prospective cohort analysis. Neurology 77: , 219–226. |
[18] | Kivipelto M , Mangialasche F , Snyder HM , Allegri R , Andrieu S , Arai H , Baker L , Belleville S , Brodaty H , Brucki SM , Calandri I , Caramelli P , Chen C , Chertkow H , Chew E , Choi SH , Chowdhary N , Crivelli L , Torre R , Du Y , Dua T , Espeland M , Feldman HH , Hartmanis M , Hartmann T , Heffernan M , Henry CJ , Hong CH , Hakansson K , Iwatsubo T , Jeong JH , Jimenez-Maggiora G , Koo EH , Launer LJ , Lehtisalo J , Lopera F , Martinez-Lage P , Martins R , Middleton L , Molinuevo JL , Montero-Odasso M , Moon SY , Morales-Perez K , Nitrini R , Nygaard HB , Park YK , Peltonen M , Qiu C , Quiroz YT , Raman R , Rao N , Ravindranath V , Rosenberg A , Sakurai T , Salinas RM , Scheltens P , Sevlever G , Soininen H , Sosa AL , Suemoto CK , Tainta-Cuezva M , Velilla L , Wang Y , Whitmer R , Xu X , Bain LJ , Solomon A , Ngandu T , Carrillo MC ((2020) ) World-Wide FINGERS Network: A global approach to risk reduction and prevention of dementia. Alzheimers Dement 16: , 1078–1094. |
[19] | Han X , Jiang Z , Li Y , Wang Y , Liang Y , Dong Y , Tang S , Du Y , Qiu C ((2021) ) Sex disparities in cardiovascular health metrics among rural-dwelling older adults in China: A population-based study. BMC Geriatr 21: , 158. |
[20] | Yoshida N , Kosumi K , Tokunaga R , Baba Y , Nagai Y , Miyamoto Y , Iwagami S , Iwatsuki M , Hiyoshi Y , Ishimoto T , Eto K , Imamura Y , Watanabe M , Baba H ((2020) ) Clinical importance of mean corpuscular volume as a prognostic marker after esophagectomy for esophageal cancer: A retrospective study. Ann Surg 271: , 494–501. |
[21] | Lippi G , Plebani M ((2014) ) Red blood cell distribution width (RDW) and human pathology. One size fits all. Clin Chem Lab Med 52: , 1247–1249. |
[22] | World Healrh Organization (2011) Haemoglobin concentrations for the diagnosis of anaemia and assessment of severity. https://www.who.int/health-topics/anaemia#tab=tab_1, Accessed on June 1, 2021. |
[23] | Zhang M , Katzman R , Salmon D , Jin H , Cai G , Wang Z ((1990) ) The prevalence of dementia and Alzheimer s disease in Shanghai, China: Impact of age, gender, and education. Ann Neurol 27: , 428–437. |
[24] | American Psychiatric Association ((1994) ) The Diagnostic and Statistical Manual of Mental Disorders, Fourth Edition (DSM-IV). American Psychiatric Association, Washington, DC. |
[25] | McKhann GM , Knopman DS , Chertkow H , Hyman BT , Jack CR Jr , Kawas CH , Klunk WE , Koroshetz WJ , Manly JJ , Mayeux R , Mohs RC , Morris JC , Rossor MN , Scheltens P , Carrillo MC , Thies B , Weintraub S , Phelps CH ((2011) ) The diagnosis of dementia due to Alzheimer’s disease: Recommendations from the National Institute on Aging-Alzheimer’s Association workgroups on diagnostic guidelines for Alzheimer’s disease. Alzheimers Dement 7: , 263–269. |
[26] | Román GC , Tatemichi TK , Erkinjuntti T , Cummings JL , Masdeu JC , Garcia JH , Amaducci L , Orgogozo JM , Brun A , Hofman A ((1993) ) Vascular dementia: Diagnostic criteria for research studies. Report of the NINDS-AIREN International Workshop. Neurology 43: , 250–260. |
[27] | Xing L , Jing L , Tian Y , Liu S , Lin M , Du Z , Ren G , Sun Q , Shi L , Dai D , Liu S ((2020) ) High prevalence of stroke and uncontrolled associated risk factors are major public health challenges in rural northeast China: A population-based study. Int J Stroke 15: , 399–411. |
[28] | Yang F , Yi X , Guo J , Xu S , Xiao Y , Huang X , Duan Y , Luo D , Xiao S , Huang Z , Yuan H , He M , Shen M , Chen X ((2019) ) Association of plasma and urine metals levels with kidney function: A population-based cross-sectional study in China. Chemosphere 226: , 321–328. |
[29] | Burke. WJ , Roccaforte. WH , Wengel SP ((1991) ) The short form of the Geriatric Depression Scale: A comparison with the 30-item form.. J. Geriatr Psychiatry Neurol 4: , 173–178. |
[30] | Wu L , Yan Z , Jiang H , Xing H , Li H , Qiu C ((2018) ) Serum cystatin C, impaired kidney function, and geriatric depressive symptoms among older people living in a rural area: A population-based study. BMC Geriatr 18: , 265. |
[31] | Li M , Hu Y , Mao D , Wang R , Chen J , Li W , Yang X , Piao J , Yang L ((2017) ) Prevalence of anemia among Chinese rural residents. Nutrients 9: , 192. |
[32] | Terekeci HM , Kucukardali Y , Onem Y , Erikci AA , Kucukardali B , Sahan B , Sayan O , Celik S , Gulec M , Sanisoglu YS , Nalbant S , Top C , Oktenli C ((2010) ) Relationship between anaemia and cognitive functions in elderly people. Eur J Intern Med 21: , 87–90. |
[33] | Santos IS , Scazufca M , Lotufo PA , Menezes PR , Bensenor IM ((2012) ) Anemia and dementia among the elderly: The Sao Paulo Ageing & Health Study. Int Psychogeriatr 24: , 74–81. |
[34] | Zakai NA , French B , Arnold AM , Newman AB , Fried LF , Robbins J , Chaves P , Cushman M ((2013) ) Hemoglobin decline, function, and mortality in the elderly: The cardiovascular health study. Am J Hematol 88: , 5–9. |
[35] | Payne CF , Davies JI , Gomez-Olive FX , Hands KJ , Kahn K , Kobayashi LC , Tipping B , Tollman SM , Wade A , Witham MD ((2018) ) Cross-sectional relationship between haemoglobin concentration and measures of physical and cognitive function in an older rural South African population. J Epidemiol Community Health 72: , 796–802. |
[36] | Kim KM , Lui LY , Browner WS , Cauley JA , Ensrud KE , Kado DM , Orwoll ES , Schousboe JT , Cummings SR , Osteoporotic Fractures in Men Study Research Group ((2021) ) Association between variation in red cell size and multiple aging-related outcomes. J Gerontol A Biol Sci Med Sci 76: , 1288–1294. |
[37] | Yu SB CH , Qin M , Liu T , Kong B , Zhao QY , Huang H , Huang CX ((2012) ) Impact of red cell distribution width on outcome of 16 681 patients with chronic systolic heart failure (in Chinese). Zhonghua Xin Xue Guan Bing Za Zhi 40: , 237–242. |
[38] | Chen CM , Lee M , Yang YH , Huang SS , Lin C-H ((2019) ) Association between clinical and laboratory markers and 5-year mortality among patients with stroke. Sci Rep 9: , 11521. |
[39] | Beydoun MA , Hossain S , Beydoun HA , Shaked D , Weiss J , Evans MK , Zonderman AB ((2020) ) Red cell distribution width is directly associated with poor cognitive performance among nonanemic, middle-aged, urban adults. J Nutr 150: , 128–139. |
[40] | Patel KV , Mohanty JG , Kanapuru B , Hesdorffer C , Ershler WB , Rifkind JM ((2013) ) Association of the red cell distribution width with red blood cell deformability. Adv Exp Med Biol 765: , 211–216. |
[41] | Bush AM , Borzage MT , Choi S , Vaclavu L , Tamrazi B , Nederveen AJ , Coates TD , Wood JC ((2016) ) Determinants of resting cerebral blood flow in sickle cell disease. Am J Hematol 91: , 912–917. |
[42] | Daulatzai MA ((2017) ) Cerebral hypoperfusion and glucose hypometabolism: Key pathophysiological modulators promote neurodegeneration, cognitive impairment, and Alzheimer’s disease. J Neurosci Res 95: , 943–972. |
[43] | Zhang X , Le W ((2010) ) Pathological role of hypoxia in Alzheimer’s disease. Exp Neurol 223: , 299–303. |
[44] | Fornal M , Wizner B , Cwynar M , Krolczyk J , Kwater A , Korbut RA , Grodzicki T ((2014) ) Association of red blood cell distribution width, inflammation markers and morphological as well as rheological erythrocyte parameters with target organ damage in hypertension. Clin Hemorheol Microcirc 56: , 325–335. |
[45] | Simone MJ , Tan ZS ((2011) ) The role of inflammation in the pathogenesis of delirium and dementia in older adults: A review. CNS Neurosci Ther 17: , 506–513. |
[46] | Järemo P , Milovanovic M , Buller C , Nilsson S , Winblad B ((2013) ) Alzheimer’s disease and granulocyte density diversity. Eur J Clin Invest 43: , 545–548. |
[47] | Petranovic D , Batinac T , Petranovic D , Ruzic A , Ruzic T ((2008) ) Iron deficiency anaemia influences cognitive functions. Med Hypotheses 70: , 70–72. |
[48] | Yavuz BB , Cankurtaran M , Haznedaroglu IC , Halil M , Ulger Z , Altun B , Ariogul S ((2012) ) Iron deficiency can cause cognitive impairment in geriatric patients. J Nutr Health Aging 16: , 220–224. |
[49] | Baroni L BC , Rizzo G , Bertola C , Caberlotto L , Bazzerla G ((2019) ) Association between cognitive impairment and vitamin B12, folate, and homocysteine status in elderly adults: A retrospective study. J Alzheimers Dis 70: , 443–453. |
[50] | Dugdale AE ((2006) ) Predicting iron and folate deficiency anaemias from standard blood testing: The mechanism and implications for clinical medicine and public health in developing countries. Theor Biol Med Model 3: , 34. |
[51] | Lv H , Zhang L , Long A , Mao Z , Shen J , Yin P , Li M , Zeng C , Zhang L , Tang P ((2016) ) Red cell distribution width as an independent predictor of long-term mortality in hip fracture patients: A prospective cohort study. J Bone Miner Res 31: , 223–233. |


