
Quantitative Gradient Echo MRI Identifies Dark Matter as a New Imaging Biomarker of Neurodegeneration that Precedes Tissue Atrophy in Early Alzheimer’s Disease
Abstract
Background:
Currently, brain tissue atrophy serves as an in vivo MRI biomarker of neurodegeneration in Alzheimer’s disease (AD). However, postmortem histopathological studies show that neuronal loss in AD exceeds volumetric loss of tissue and that loss of memory in AD begins when neurons and synapses are lost. Therefore, in vivo detection of neuronal loss prior to detectable atrophy in MRI is essential for early AD diagnosis.
Objective:
To apply a recently developed quantitative Gradient Recalled Echo (qGRE) MRI technique for in vivo evaluation of neuronal loss in human hippocampus.
Methods:
Seventy participants were recruited from the Knight Alzheimer Disease Research Center, representing three groups: Healthy controls [Clinical Dementia Rating® (CDR®) = 0, amyloid β (Aβ)-negative, n = 34]; Preclinical AD (CDR = 0, Aβ-positive, n = 19); and mild AD (CDR = 0.5 or 1, Aβ-positive, n = 17).
Results:
In hippocampal tissue, qGRE identified two types of regions: one, practically devoid of neurons, we designate as “Dark Matter”, and the other, with relatively preserved neurons, “Viable Tissue”. Data showed a greater loss of neurons than defined by atrophy in the mild AD group compared with the healthy control group; neuronal loss ranged between 31% and 43%, while volume loss ranged only between 10% and 19%. The concept of Dark Matter was confirmed with histopathological study of one participant who underwent in vivo qGRE 14 months prior to expiration.
Conclusion:
In vivo qGRE method identifies neuronal loss that is associated with impaired AD-related cognition but is not recognized by MRI measurements of tissue atrophy, therefore providing new biomarkers for early AD detection.
INTRODUCTION
Alzheimer’s disease (AD) is a progressive neuro-degenerative disorder with typical clinical symptoms of memory loss, global cognitive decline, and behavioral changes, which eventually impact daily living activities [1]. It is well known that pathological changes in the human brain begin decades before the appearance of clinical AD symptoms [2–6]. Magnetic resonance imaging (MRI) studies indicate that hippocampal atrophy (loss of tissue) is one of the earliest indications of AD pathology that can be detected through morphological studies [7–10]. The hippocampus is a complex structure that consists of several subregions that include dentate gyrus (DG), cornu ammonis (CA1, CA2, CA3, and CA4), subiculum, and molecular layer (ML) [11]. Importantly, neurofibrillary tangles (NFT), a hallmark of AD, typically demonstrate a characteristic pattern of evolution across hippocampal subfields—first appearing in CA1 and then spreading to other subfields [12, 13]. The hippocampal subfields have different functions and network connections [11, 14, 15] and show different vulnerabilities to neuropathologic insults (e.g., CA4 and CA1 to hypoxic/ischemic injury and excitotoxicity). Reports have shown that different hippocampal subfields exhibit differential vulnerability to various neurodegenerative disease pathologies and variable involvement at different stages of these diseases [16, 17]. In AD, however, morphometric alterations have been detected in multiple hippocampal subfields [15, 18–20] and were associated with mild cognitive impairment [21, 22].
While volumetric MRI-based measurement of atrophy is usually assumed to serve as an in vivo biomarker of neuronal loss [23], histopathological studies demonstrate that neuronal loss in the hippocampus actually exceeds loss of tissue volume [24]. This result is consistent with the finding of a widespread reduction of synapses that were more extensive than decreases in gray matter volume [25]. Importantly, symptoms of AD appear after sufficient neuronal [24, 26] and synaptic [27, 28] losses have occurred. Additionally, studies demonstrate that the extent of neuronal loss varies across hippocampal subfields, e.g., severe neuronal loss is observed in CA1 with less severe loss in subiculum regions [29]. Hence, in vivo assessment of neuronal loss in hippocampal subfields may serve as a more effective biomarker for disease progression than will measures of atrophy.
Our approach to assessing neuronal damage in vivo is based on: 1) the quantitative Gradient Recalled Echo (qGRE) MRI technique [30] and 2) genetically-informed quantitative relationships between qGRE metrics and major components of brain tissue cellular structure (neurons/neurites and glia) [31]. The qGRE technique provides quantitative, non-invasive, in vivo, high-resolution 3D measurements of several brain-tissue-specific relaxation properties (qGRE metrics) of the gradient recalled echo (GRE) MRI signal that depend on brain cellular structure and functioning. Specifically, qGRE separates the GRE MRI signal decay R2* (= 1/T2*) into its two main components, R2t* (t stands for tissue) and R2′. The R2t* relaxation parameter depends solely on the cellular and subcellular microstructure [31], whereas R2′ relates to the GRE signal loss due to the presence of paramagnetic deoxyhemoglobin in venous blood and adjacent to it part of the capillary bed (BOLD effect) [32, 33]. The basis of R2* disentanglement into R2t* and R2’ is grounded in our previously developed theoretical model of BOLD signal [33] validated in phantom [34] and animal [35] studies. By introducing a concept of cells as an endogenous contrast agent, a quantitative relationship between the R2t* qGRE metric and Neuronal Density Index (NDI)—a parameter that represents a proxy for the neuronal density—was established in [31] (see further details below in the Methods section).
In this study, we demonstrate that the qGRE R2t* metric identifies two different types of tissues in the hippocampal subfields of people with preclinical and mild AD dementia: one type, tissue with markedly lower neuronal content (which we term “Dark Matter” as it appears dark on R2t* images), and another type, tissue with a relatively preserved concentration of neurons (which we term “Viable Tissue”). We demonstrate that the qGRE-measured volumes of Viable Tissue and Dark Matter account for more significant differentiation between healthy participants and people with preclinical and mild AD than the total volume measurements by morphometric MRI. Likewise, the volumes of Viable Tissue and Dark Matter have stronger association with memory scores as compared with total volume. Finally, our preliminary data show that premortem in vivo R2t*-based measurement of neuronal content in hippocampal subfields correspond to postmortem neuronal counts in an individual investigated by histo-pathology.
MATERIALS AND METHODS
Participants
Seventy (70) participants, ages between 60 and 90 years (73.5±6.6), 31 females and 39 males (sex observed by the investigator) were recruited through the Knight Alzheimer Disease Research Center (ADRC) and signed the informed consent document. Demographic information available on this cohort is presented in Table 1. Combined MRI and histopathology data from one more additional participant were used for cross-correlation analysis. This study was approved by the Institutional Review Board (IRB) of Washington University School of Medicine.
Table 1
Participants’ demographic information and the mean and standard deviation of age and neuropsychometric scores of three groups that are classified based on the CDR and Aβ42 status
| Total | HC CDR = 0 & Aβ status =Negative | PC CDR = 0 & Aβ status =Positive | Mild AD CDR = 0.5, 1 & Aβ status =Positive | |
| N | 70 | 34 | 19 | 17 |
| Gender (Female/Male) | 31/39 | 19/15 | 8/11 | 4/13 |
| Age | 73.5±6.6 | 72.2±6.1 | 74.7±7.3 | 74.6±6.8 |
| Global†‡ | 0.0±0.8 | 0.4±0.6 | 0.1±0.8 | -0.8±0.7 |
| FcSRT†‡ | 27.1±9.2 | 31.9±6.4 | 27.5±8.3 | 17.7±7.7 |
| TMA† | 35.8±15.7 | 30.9±10.4 | 36.2±18.4 | 44.6±17.9 |
| TMB†‡ | 91.2±39.6 | 80.0±30.7 | 85.0±36.4 | 114.8±46.4 |
| Animals†‡ | 20.0±6.0 | 21.9±5.7 | 20.2±5.6 | 16.2±5.6 |
| Letter Number sequencing†‡ | 8.9±2.8 | 10.0±2.5 | 9.1±2.3 | 6.8±2.6 |
‡indicates a significant (p < 0.05) group difference between HC and mild AD groups, †indicates a significant (p < 0.05) group difference between PC and mild AD groups, and ‡indicates a significant (p < 0.05) group differences between HC and PC groups. The Global test is presented as a z-score of combined Animals, Free and Cued Selective Reminding free recall score, Trail Making A and B, and letter number tests. The rest of the tests are presented as actual individual scores. Note that gender in this paper is defined as “sex observed by the investigator”.
Cognitive assessment
All participants of the Knight ADRC complete comprehensive clinical and cognitive assessments. The presence and severity of dementia symptoms was determined using the Clinical Dementia Rating® (CDR®) scale [36, 37]. A CDR score of 0 represents no dementia, and scores of 0.5, 1, 2, and 3 represent very mild, mild, moderate, and severe dementia, respectively, based on exam and collateral source interview. Tests given in the neuropsychological evaluation vary slightly depending on the participant’s age upon entry into the study and include the Free and Cued Selective Reminding Test (FcSRT) [38], Trail Making Part A and B [39], Category Fluency [40] for Animals, and Letter Number Sequencing [41] from the Wechsler Adult Intelligence Scale-III. A global cognitive score was formed as a z-scored composite of Category Fluency, FcSRT, Trail Making A and B, and letter number sequencing. An episodic memory was represented by the FcSRT. Global cognition test scores were available on 68 participants except the FcSRT scores that were available for 62 participants.
Amyloid and tau measurements
Amyloid cerebrospinal fluid (CSF) and brain positron emission tomography (PET) measurements were available to assess amyloid status of study participants. The CSF biomarker Aβ42 test (INNOTEST, Fujirebio, Gent, Belgeium) was performed with a standardized protocol via lumbar puncture in 50 cases. Using the abnormal Aβ42 cutoff value, participants were separated into Aβ positive and negative groups [42]. For the remaining 20 cases, assessment was done based on brain PET results (17 with PiB and 3 with AV45), using cutoff standardized uptake value ratio (SUVR) values—1.42 and 1.19 correspondingly [43, 44]. Tau PET measurements based on 18F-flortaucipir (AV-1451) tracer were available from 43 participants (age ranges between 60 to 90 years) out of 70 participants. The global measure of tau (i.e., tauopathy) was calculated by averaging partial volume corrected SUVRs of amygdala, entorhinal cortex, inferior temporal, and lateral occipital cortex regions which were defined by Freesurfer segmentation. The tauopathy SUVR cutoff value of 1.25 referenced to cerebellum was used to classify participants as Tau positive (Tau+) with global SUVR > 1.25 and Tau negative (Tau–) with SUVR < 1.25 values [45].
Group classification based on amyloidosis and CDR
Seventy participants were classified into three groups based on CDR score and Aβ42 status (as shown in Table 1): 1) Healthy control (HC) (CDR = 0; Aβ42 = negative; n = 34); 2) Preclinical AD (PC) (CDR = 0; Aβ42 = positive; n = 19); and 3) mild AD (CDR > 0 [CDR = 0.5 for 14 participants and CDR = 1 for 3 participants] & Aβ42 = positive; n = 17). Note that in our consideration we use the term “Preclinical AD” generally accepted in the field as reflecting abnormal biomarkers of Aβ and tau (or the postmortem presence of AD neuropathology) in asymptomatic persons. This in part because we and others have demonstrated that preclinical AD is associated with progression to symptomatic AD, whether preclinical AD was detected by amyloid PET [46] or by abnormal CSF concentrations of Aβ42 or tau [47]. This classification corresponds to “Alzheimer’s pathologic change” in the recent NIA-AA framework research criteria [23, 48].
The mean and standard deviation values of cognitive test scores and participants’ ages in HC, PC, and mild AD groups are presented in Table 1. There was no difference between groups based on age (p = 0.4 between HC and PC, p = 0.99 between AD and PC, and p = 0.46 between AD and HC). All cognitive tests (except TMA test) exhibit group differences (p < 0.05) between HC and mild AD but no group differences were found between the HC and PC groups (p > 0.05).
Group classification based on tauopathy and CDR
Participants were classified into three groups based on CDR score and PET tauopathy: 1) Tau–, CDR– (n = 21, age = 72.24±7.2); 2) Tau+, CDR– (n = 11, age = 74.0±7.4); and 3) Tau+, CDR+ (n = 10, age = 74.4±6.5). One participant having Tau– (SUVR = 1.12) and CDR+ status was excluded from the analysis. Herein, CDR– represents the CDR = 0 and CDR+ represents CDR > 0.
Postmortem study
In this study we used data from an 81-year-old male who was diagnosed with dementia (CDR = 1) and whose CSF Aβ42 concentration was in the normal range. The participant underwent in vivo qGRE MRI measurements 14 months prior to expiration. Neuropathological analysis was performed by a highly experienced board-certified neuropathologist, blinded to any neuroimaging data or formal neuropathologic diagnosis at the time of cell counting. Brain-only autopsy yielded the following neuropathologic findings: hippocampal sclerosis with neocortical and limbic TDP-43 proteinopathy (consistent with ‘Limbic-predominant age-related TDP-43 encephalopathy’-neuropathologic change [LATE-NC] stage 2 to 3 and also consistent with stage 5–6 within the ‘updated TDP-43 in Alzheimer’s disease staging scheme’ of Josephs et al. [49, 50]); low AD neuropathologic change (A2, B1, C1 by NIA-AA criteria [51]); mild aging-related tau astrogliopathy (ARTAG); and mild vasculopathy (arteriolosclerosis, cerebral amyloid angiopathy, and atherosclerosis). For this study, neuronal counts were performed on a six-micron-thick coronal section of formalin-fixed, paraffin-embedded tissue from the left hippocampal formation, sampled at the level of the lateral geniculate nucleus, and stained with hematoxylin and eosin (H&E) histochemistry. Three 40x objective fields (each 0.55 mm diameter) selected for counting were evenly spaced but otherwise randomly chosen within each area of interest based on boundaries borrowed from FreeSurfer. Neurons were identified by morphology on H&E stained slides.
MRI data acquisition
Brain MRI data were acquired at Washington University in Saint Louis. The imaging protocol included the 3D multi gradient-recalled echo sequence and magnetization-prepared rapid gradient-echo imaging (MPRAGE) [52]. Since data were collected over 4 years, four Siemens 3T MRI scanners were used (Siemens, Erlangen, Germany). The Fisher-Freeman-Halton test demonstrated that the three categories of participants (HC, PC, and mild AD) were independent (p = 0.2096) of the four different MRI scanners (PET-MR, Prisma, Trio, and VIDA). Details of the statistical analysis are presented in Supplementary Table 1, therein. Details of qGRE data acquisition are provided in [30]. In brief, sequence parameters were: field of view (FOV) 256×192 mm, resolution 1×1×2 mm3 (read, phase, and slab directions), 10 gradient echoes with first echo time 4 ms, echo spacing 4 ms, repetition time TR = 50 ms, and flip angle 30°. A phase stabilization echo (navigator) was collected for each line in k-space to correct for image artifacts due to the physiological fluctuations [53]. Standard clinical T1-weighted MPRAGE images (FOV = 256×256 mm, T1/TE/TR = 1100/3.37/2000 ms, flip angle = 10°, acquisition time = 6 min, and resolution 1×1×1 mm3) were acquired for image segmentation.
qGRE data analysis
The qGRE MRI method [30, 31] is based on a multi-echo gradient echo sequence theoretical model of GRE signal decay [33, 34] and the relationships between GRE signal decay rate parameters and major elements of brain cellular structure (neurons/neurites and glia cells) [31]. Phase stabilization navigator pulses designed to reduce effects of physiological fluctuations are also incorporated in the sequence [53]. Data analysis was performed with a stand-alone computer with in-house developed programs written in MatLab (MathWorks Inc., Natick, MA, USA). After phase correction, k-space data from each radio frequency (RF) channel were converted to the spatial domain, and the 3D spatial Hanning filter was applied to reduce Gibbs ringing artifacts and signal noise. To achieve optimal model parameter estimations, the multi-channel data (ch = 1, 2, . . . , M) were combined according to the following algorithm allowing the most accurate model parameters evaluation [54, 55]:
(1)
Where
A theoretical model of BOLD (blood oxygen level dependent) contrast [33] was used to differentiate the contribution of tissue-cellular-specific relaxation (R2t*) and BOLD contributions to the total R2* relaxation [30, 33, 34]:
(2)
where S0 is the signal amplitude; δω is the characteristic frequency determined by the susceptibility difference between deoxygenated blood and surrounding tissue; ζ is the volume fraction of deoxygenated blood; nonlinear function fs (δω · TE) accounts for the BOLD effect [33]; and Δf is the local frequency shift, and the function F(TE) describes the effect of macroscopic magnetic field inhomogeneities with respect to gradient echo time TE [34]. Herein, F(TE) was calculated by a voxel spread function method [56] using a library-driven approach [57].
Hippocampal segmentation and co-registration
The hippocampal segmentation was performed on T1-weighted MPRAGE images using Freesurfer6.0 software (Laboratory for Computational Neuroimaging Martinos Center for Biomedical Imaging) [58]. The software provides 12 hippocampal volumes in each hemisphere: parasubiculum, presubiculum, subiculum, cornu ammonis (CA1, CA2/3, and CA4), molecular layer, granule cell layer of the dentate gyrus (GC-DG), hippocampus–amygdala transition area (HATA), fimbria, hippocampal tail (HP tail), and hippocampal fissure. The hippocampal white matter subfields and subfields with lower volumes (HATA, fimbria, hippocampal fissure, and parasubiculum) were excluded from the analysis [20]. The masks of hippocampal subfields in MPRAGE space were registered to the S0 qGRE images (that are T1-weighted images) by using FMRIB’s Linear Image Registration tool in FSL software [59, 60]. The resultant transformation matrices were inverted and applied to maps of R2t* that are naturally co-registered with S0 images.
qGRE metrics generation
The parameters S0, R2t*, Δf, ζ, and in each voxel were estimated by fitting Eq. [2] to the complex MR signal in each voxel using a nonlinear least square curve fitting algorithm. The stability of the fitting procedure is described in previous publications [30, 61].
In a recent publication [31], gene expression profiles available from the Allen Human Brain Atlas were used to demonstrate that the network of genes related to neuronal brain structure has an expression profile similar to the R2t* relaxations profile across multiple regions in a human brain cortex. Based on the genetic data from 6 human brains available from the Allen Human Brain Atlas and age-matched R2t* data from 26 healthy control volunteers using 3T MRI, the authors deduced a quantitative relationship between the R2t* metric and an index that can serve as a proxy for neuronal density (herein called the Neuronal Density Index, NDI):
(3)
R2t* is measured in s–1, and parameter NDI is dimensionless, which varies from 0 (index for tissue devoid of neurons) to 1 (index for tissue with 100% neurons). While this relationship was derived for cortical grey matter in healthy human brains, we hypothesize that it can also provide estimation of reduced neuronal density in cases where pathology is mainly associated with the loss of neurons. This hypothesis is based on another result obtained in reference [31] which suggests that the neurons are a 4 times stronger endogenous contrast agent than the glia cells. This hypothesis is in agreement with our postmortem study results (see below in the Results section).
The value of NDI in a healthy adult human brain varies approximately between 0.3–0.7 which correspond to R2t* approximately in the range between 12 s–1 and 20 s–1; however, data in our study revealed the presence of tissue with R2t* even smaller than 5.8 s–1, especially in people with AD. Since NDI > 0, regions of the brain with R2t* smaller than 5.8 s–1 represent tissue practically devoid of neurons. Accordingly, with further analysis, we separated brain regions with R2t* smaller than 5.8 s–1 from regions with positive NDI (R2t* greater than 5.8 s–1). Tissue with R2t* < 5.8 s–1 is referred to as “Dark Matter” as it is seen as dark in R2t* images. Correspondingly, the volume fraction of Dark Matter in a region of interest (ROI) is characterized by a ratio of Dark Matter volume to the total volume of the selected ROI. The neuron-containing tissue (R2t* > 5.8 s–1) is referred to as “Viable Tissue”. Importantly, for all three groups, the R2t* distributions are significantly different between Dark Matter and Viable Tissue as shown in Supplementary Table 2. Note that mean R2t* values in the hippocampal viable tissue are in the range 14.3–15.2 s–1 (more than twice bigger than 5.8 s–1 threshold) corresponding to NDI index in the range of healthy tissue (as in Fig. 1). At the same time, mean R2t* values in the Dark Matter more than twice smaller than 5.8 s–1 threshold. The choice of the R2t* threshold (5.8 s–1) that separates Dark Matter and Viable Tissue is further justified in Supplementary Figure 1. Schematic representation of separating Dark Matter and Viable Tissue is illustrated in Fig. 1 along with examples of hippocampal Viable and Dark Matter Tissue images for three participants belonging to different groups: HC, PC, and mild AD.
Fig. 1
A) Schematic representation of qGRE biomarkers. Total tissue volume identified on MRI images (e.g., T1-weighted MPRAGE) is separated into two volumes based on qGRE R2t* measurement: Dark Matter –tissue devoid of neurons (R2t* < 5.8 s–1) and Viable Tissue –tissue with relatively preserved neurons (R2t* > 5.8 s–1). B) 3D surface views (created by using Slicer 4.5.0 software) of the hippocampus structure of three representative participants from HC, PC, and mild AD groups. Viable Tissue is marked with grey color and Dark Matter is marked with black color. While this figure shows left/right differences in the dark matter distribution in these particular examples, the group analysis shows no statistical left/right differences in any group (HC, PC, and AD).
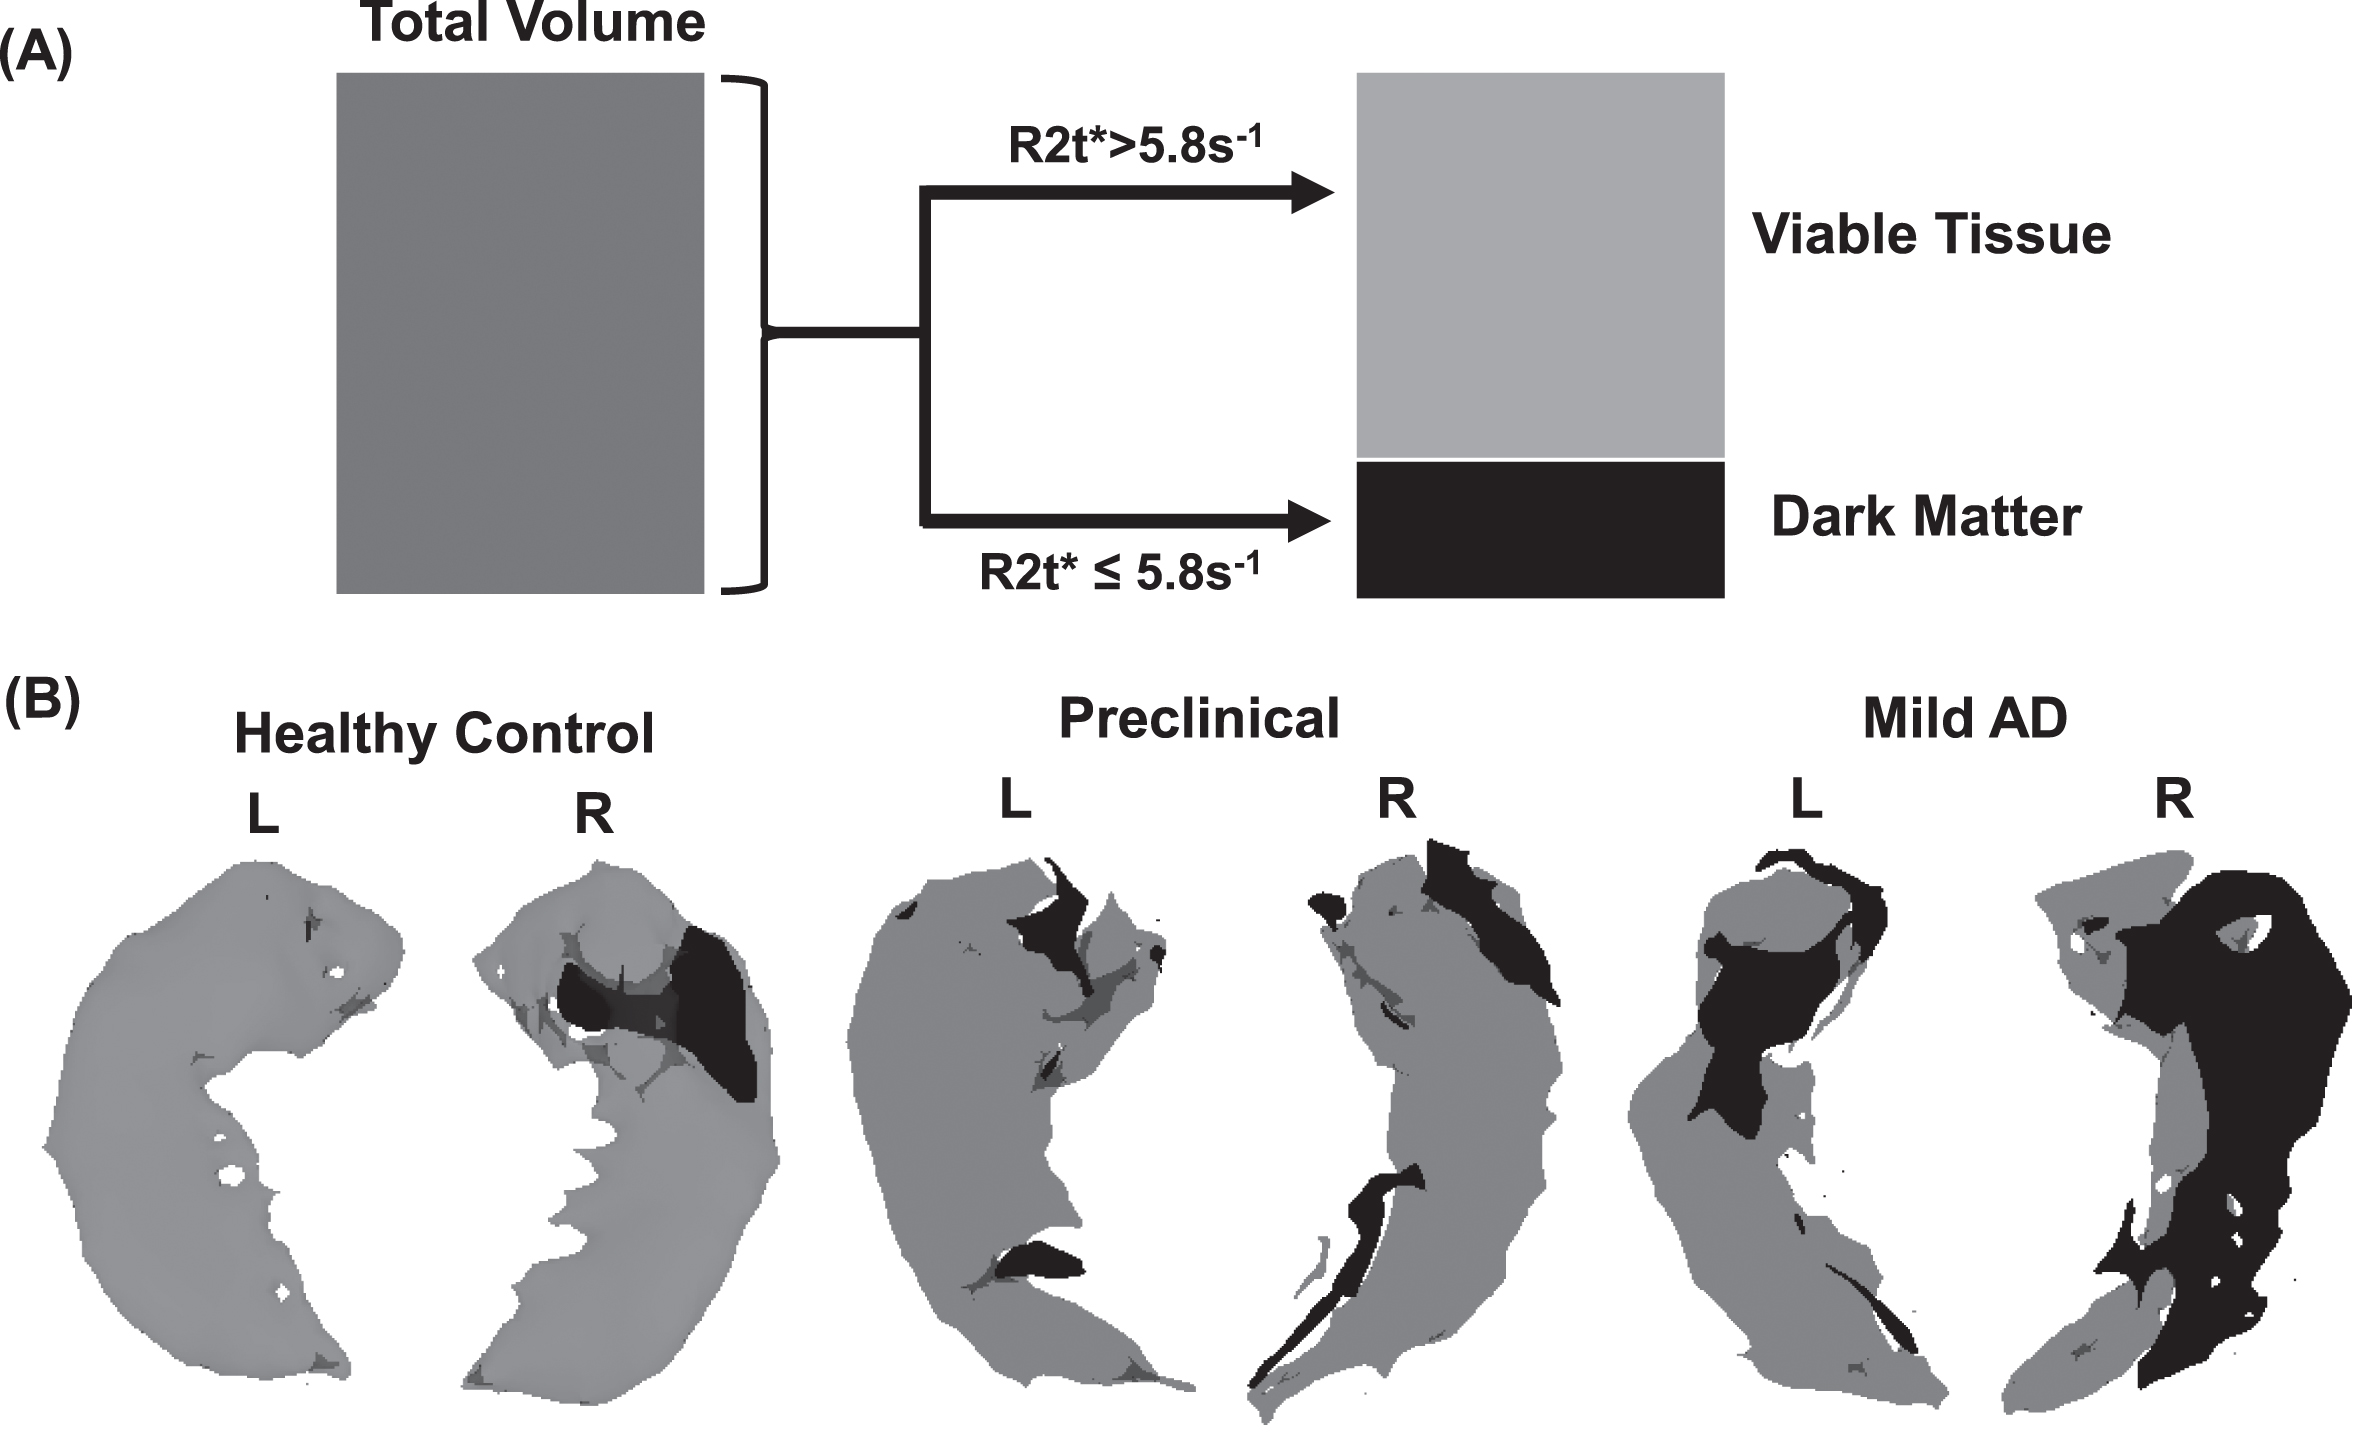
Note that Fig. 1 shows left/right asymmetry, but this result did not reach significance at the group levels, most likely due to insufficient sample sizes. Hence, in all our considerations, we analyzed data by combining left and right hippocampal subfields into single objects before calculating their total, viable and dark matter volumes, and NDIs.
Statistical analyses
For this study, two separate and independent statistical analyses of the collected data were performed. For the first set of analyses, the differences between Viable Tissue and Dark Matter volumes in the individual hippocampal subfields were assessed. For the second set of analyses, global hippocampal measures were used to assess how well the new qGRE metrics (Dark Matter and Viable Tissue volumes) represent clinically important differences between groups as compared with difference based on the hippocampal atrophy (reduction of hippocampal volume).
The first set of statistical analyses was performed using R software (version 22.0, Armonk, NY, United States) and MATLAB (MathWorks Inc., Natick, MA, United States). One-way analysis of variance (ANOVA) with multiple comparisons (using Tukey’s honest significant difference criterion) was performed to assess group differences between HC, PC, and mild AD groups based on qGRE metrics obtained from hippocampal subfields and global cognitive test scores. The associations between qGRE metrics and all cognitive scores were performed using linear regression analysis. From the regression analysis, the correlation coefficient (r) and significance (p) were calculated. Because these analyses were considered preliminary and investigational, a p value less than 0.05 was considered a statistically significant difference and an r value greater than 0.3 was considered a clinically important association between measurements.
For the second set of analyses, differences among groups were assessed with a generalized linear model, and classification tree analyses were used to calculate each participant’s probabilities of being a member of each of the three groups. For the classification-tree analyses, receiver operating characteristic (ROC) curves were created, the areas under the curves (AUCs) were determined for each group and differences between groups determined. In addition, the values for Dark Matter and Viable Tissue volume were assessed for differences from those for Total Volume. For these analyses, the alpha level was set at 0.05. For each ROC curve, it was determined the point at which sensitivity and specificity were maximized. These analyses were performed with JMP Pro Statistical Software Release 15.1.0 (SAS Institute, Inc., Cary, NC) and MedCalc Statistical Software version 19.6 (MedCalc Software Ltd, Ostend, Belgium; https://www.medcalc.org; 2020).
RESULTS
AD-related neurodegeneration (neuronal damage) affects all hippocampal subfields
The group comparisons of Dark Matter fraction, total volume, and Viable Tissue volume measurements between HC, PC, and mild AD groups in the hippocampal subfields are presented in Fig. 2. We found no significant differences (p > 0.05) between the HC and PC groups in total volume, which is in good agreement with previous histological [24] and longitudinal MRI [62] studies; however, a small (but not significant) trend toward increased volume from HC to PC group of CA1 and CA2/3 subfields seen in Fig. 2 is also in agreement with previous measurements [63]. Consistent with previous reports [20, 64, 65], we also found decreased volume in all hippocampal subfields in the mild AD group compared with the PC and HC groups though in some subfields (e.g., CA1) these differences did not reach the significance threshold (most likely due to the small sample sizes). This result is consistent with both 3T [64] and 7T MRI studies of hippocampal subfield volumes [66]. The significant volume differences between the mild AD and HC groups in our data are seen in all subfields except in CA1 and CA2/3 regions. Further, group differences (p < 0.05) between mild AD and PC are seen in all subfields except in CA1. Compared with total tissue volume, Viable Tissue, and Dark Matter volumes show stronger group separation in most hippocampal subfields (Fig. 2). Unlike total volume measurements, the Viable Tissue volumes in all hippocampal subfields in the mild AD group differ from those of the HC group and PC group (p < 0.05). The Dark Matter fraction exhibits group differences between mild AD and HC (p < 0.01) in all subfields and exhibits differences between PC and mild AD (p < 0.05) in CA1, CA2/3, CA4, GC-DG, and ML regions. Importantly, statistically significant group differences in Dark Matter fraction were found between HC and PC (p < 0.05) in the parasubiculum, subiculum, CA1, and ML regions.
Fig. 2
Total volume, Viable Tissue volume, Dark Matter fraction, and Neuronal Density Index of the viable tissue in hippocampal subfields. Bars represent mean group values and whiskers show standard deviations. Green bars represent the HC group (n = 34), blue bars represent PC group (n = 19), and red bars represent mild AD (n = 17) group. *p < 0.05, **p < 0.01, ***p < 0.001. Tukey’s honest significant difference criterion is used to correct for multiple comparisons.
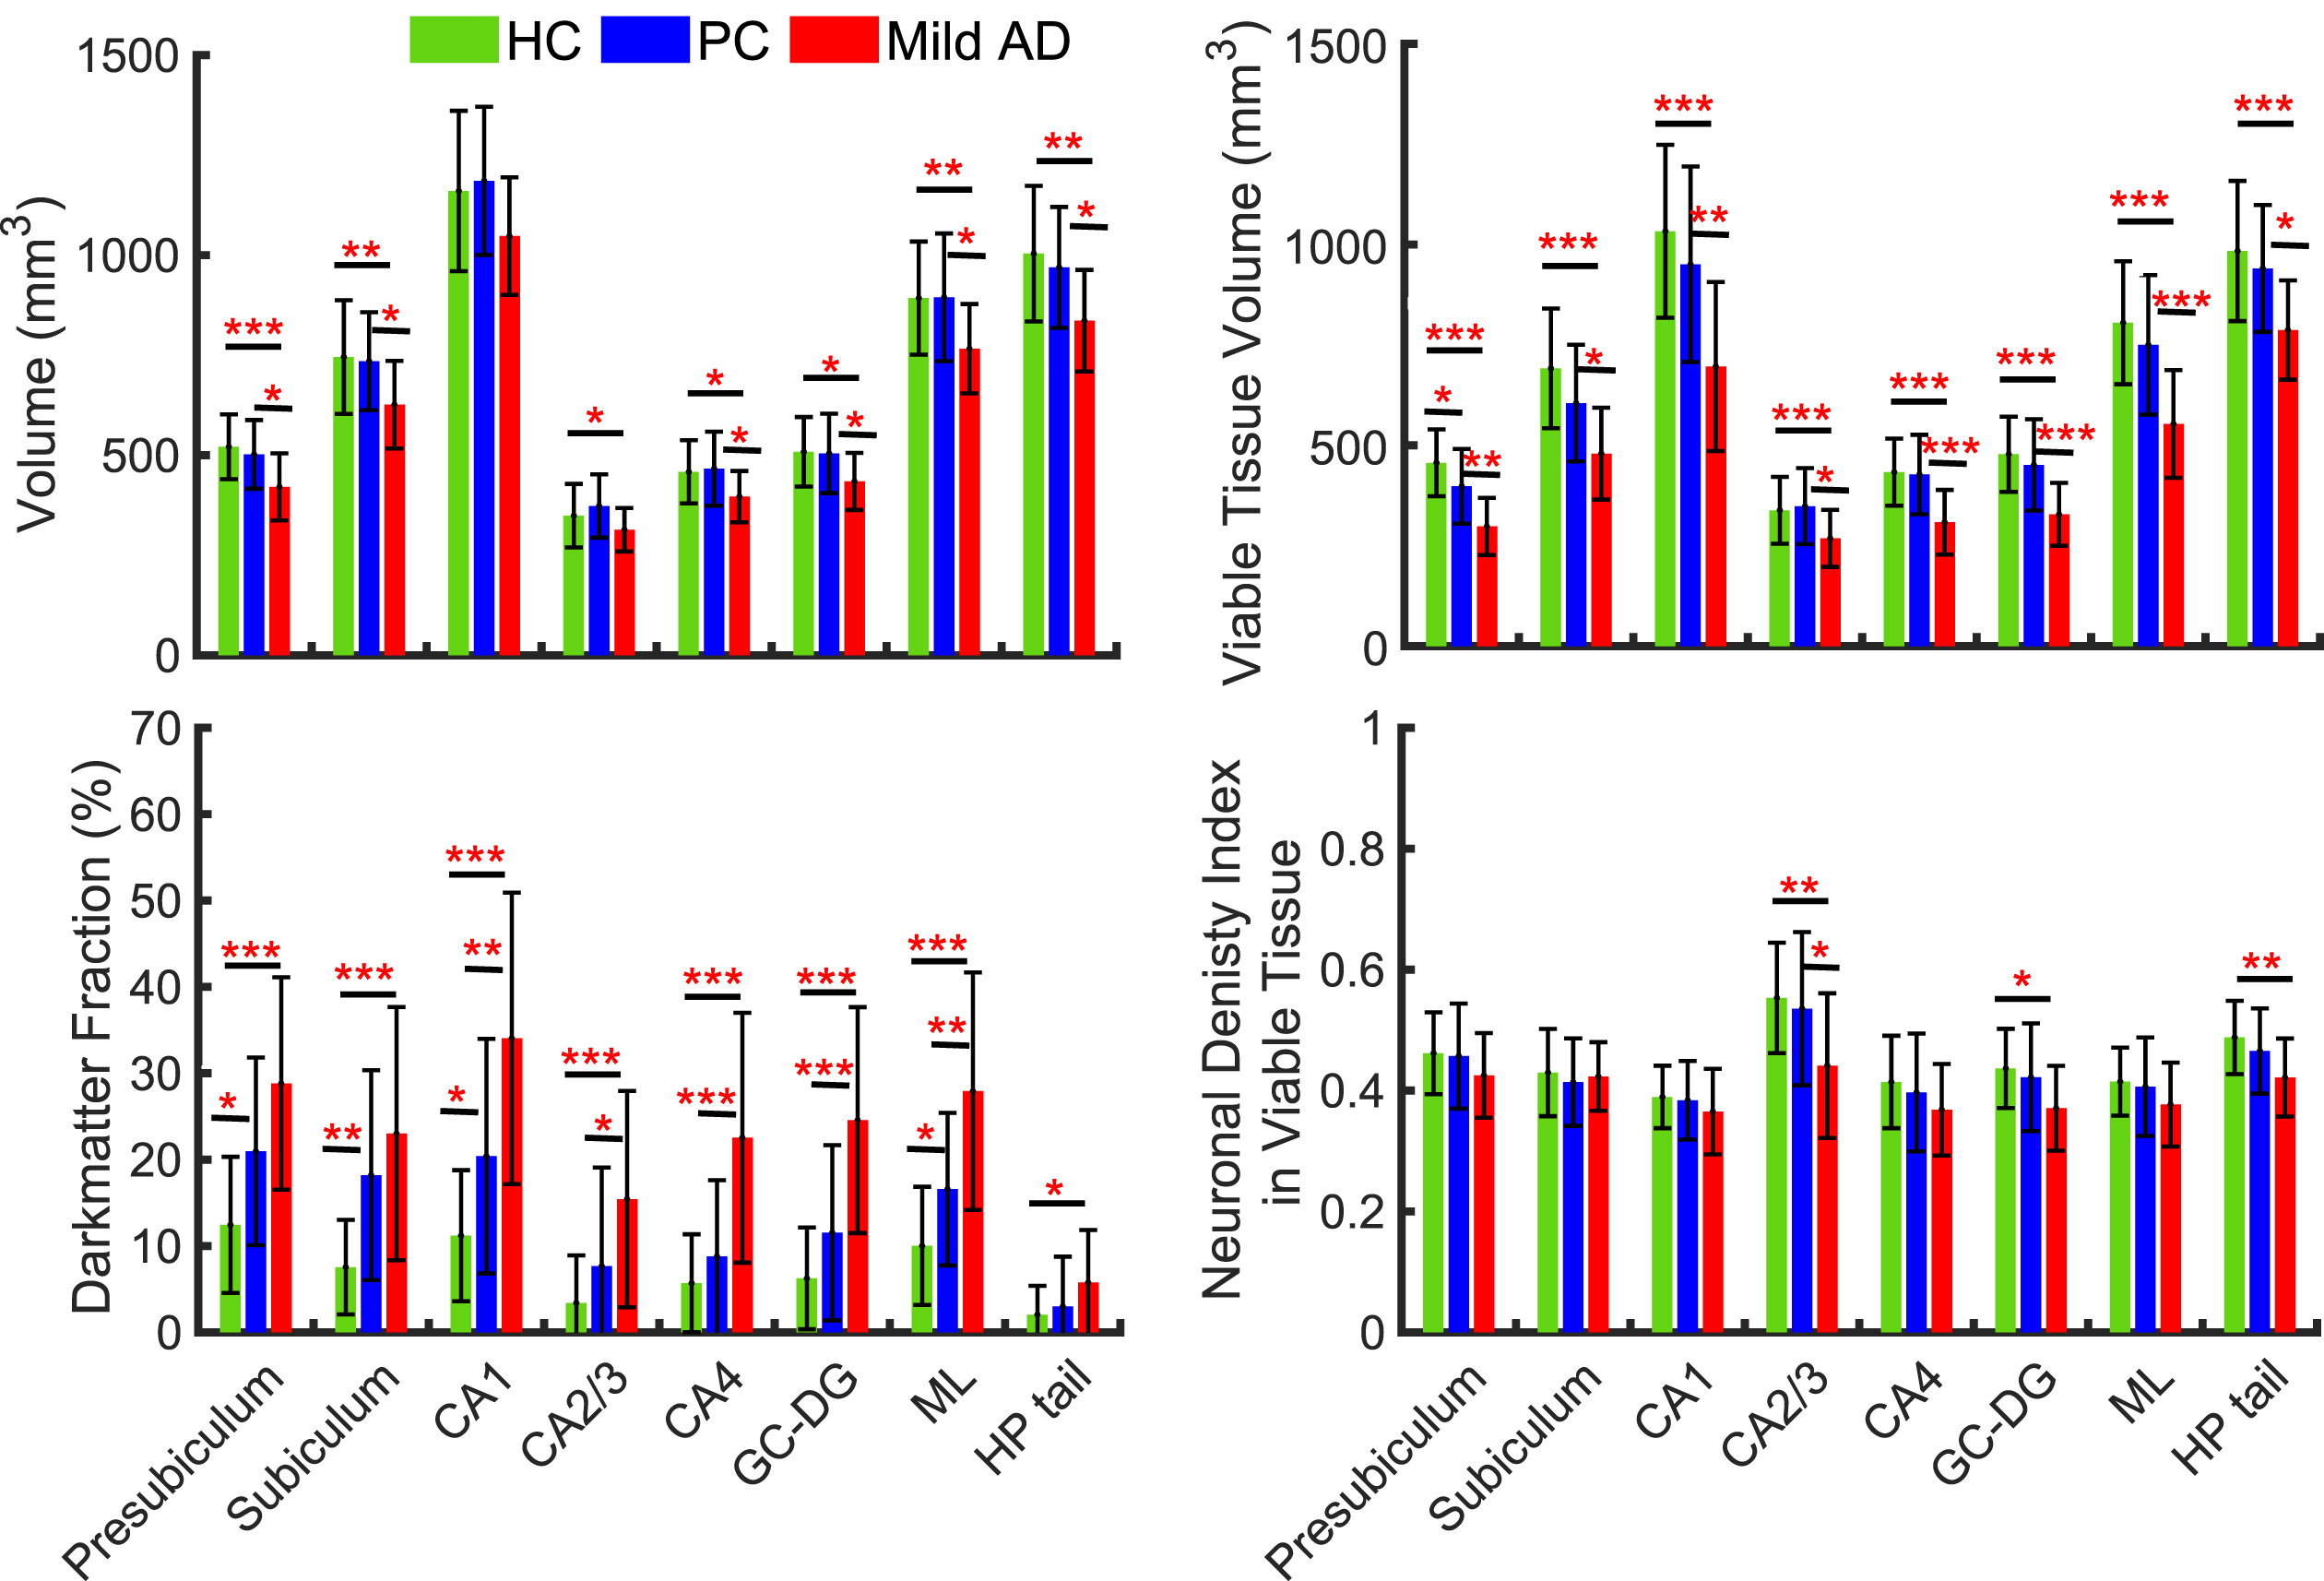
The last panel in Fig. 2 represents measurements of neuronal density in the Viable Tissue of all hippocampal subfields. It is evident that mean value of NDI of the Viable Tissue in mild AD is decreased as compared with HC or PC. However, the one-way ANOVA multi comparison identified significant differences between HC and mild AD only in specific subfields, such as CA2/3, GC-DG, and HP tail regions, and significant group differences between PC and mild AD was observed only in CA2/3 region. This finding remarkably indicates that neurons are only marginally decreased in the Viable Tissue while major neuronal loss is related to the presence of Dark Matter.
Neuronal loss exceeds volumetric loss of tissue in hippocampal subfields
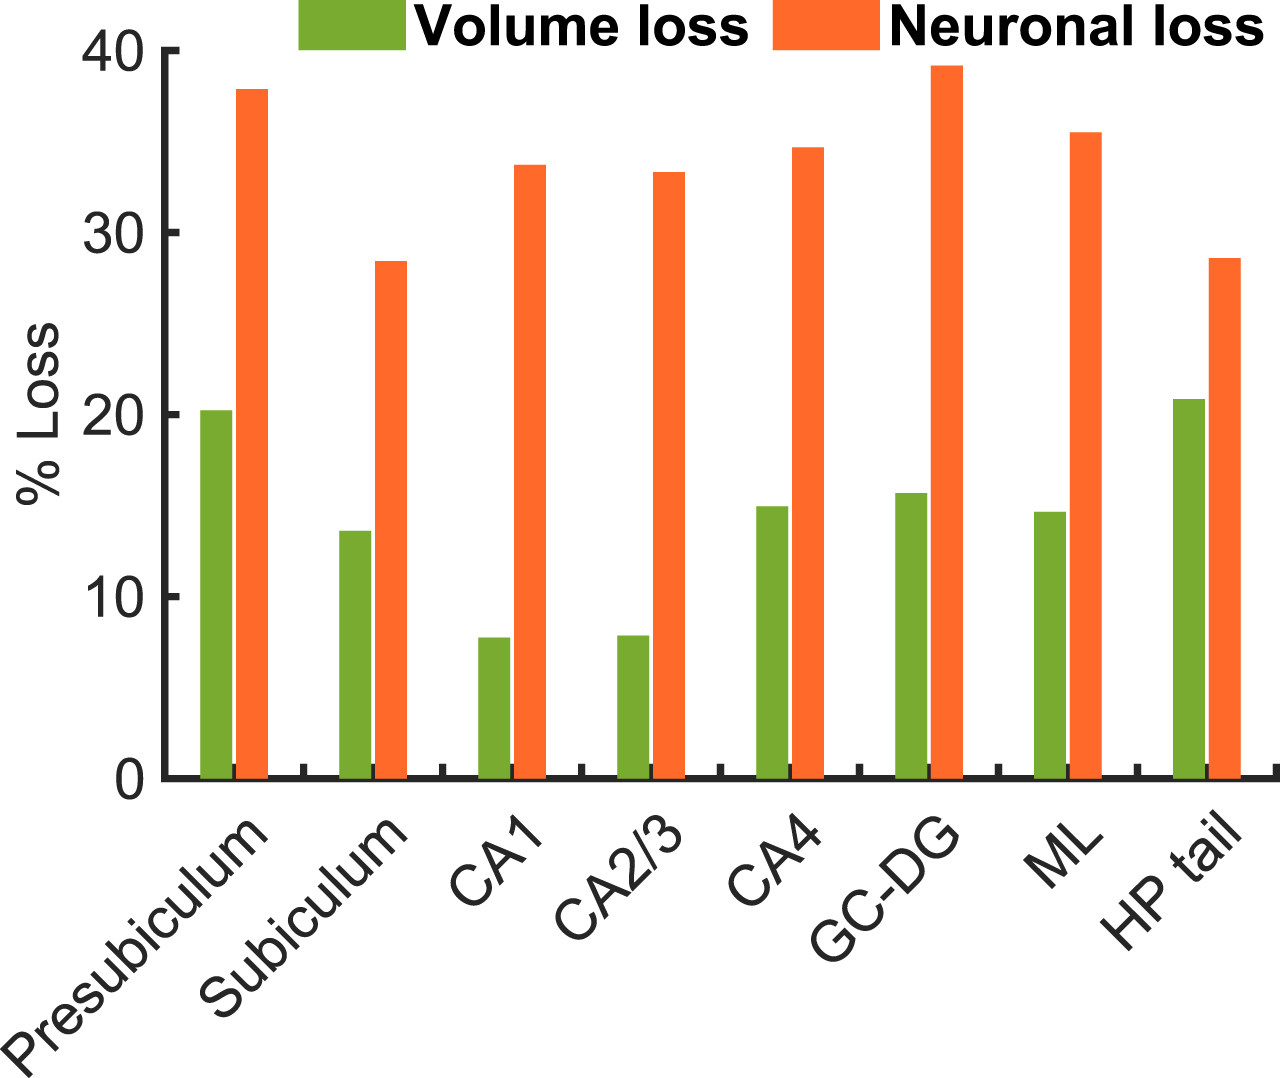
Data in Fig. 3 shows loss of neurons and tissue volume in the mild AD group relative to the HC group. The mean volume loss fraction of the mild AD group is about 19% in presubiculum, 16% in subiculum, 10% in CA1, 10% in CA2/3, 14% in CA4, 15% in GC-DG, 14% ML, and 17% in HP tail with respect to the HC group. Previous studies have reported that the overall hippocampal volume was lower by 15–30% in mild AD compared with HC [67]. In our findings, a volume reduction was about 10–19% in the mild AD group compared with the HC group, which is consistent with previous findings. The mean neuronal loss fraction in the mild AD group is about 40% in presubiculum, 32% in subiculum, 37% in CA1, 37% in CA2/3, 38% in CA4, 43% in GC-DG, 38% ML, and 31% in HP tail. These data show significantly higher neuronal loss as compared with volume loss in the mild AD group. This result is consistent with previous findings [24] that reported about 46% of neuronal loss and 29% of volumetric loss (about 1.6 times lower than neuronal loss) in the CA1 region in the AD postmortem brains compared with cognitively normal brains.
Fig. 3
Percent of volume and neuronal losses in mild AD group in hippocampal subfields evaluated with respect to the group mean values of HC group.
Dark Matter fraction and the Viable Tissue volume exhibit stronger associations with neurocognitive scores than volumetric measurements
The outcomes of linear regression analyses be-tween the Global Memory composite and Free and Cued Selective Reminding Test, FcSRT (as a representative of Episodic Memory), cognitive test scores, and qGRE biomarkers (Viable Tissue volume and Dark Matter fraction) along with the Total Volume measurements in global hippocampus are presented in Fig. 4, while all individual cognitive data are presented in Supplementary Figure 2. The Dark Matter fraction is negatively associated with episodic memory (R = –0.47; p = 0.0001), meaning that higher Dark Matter fraction correlates with worse memory performance, while the Total Volume exhibits a positive but much weaker association (R = 0.23; p = 0.07), i.e., lower the volume lower the episodic memory scores. A similar trend is seen for the Global Cognition test, though in this case, the Dark Matter Fraction and the Total Volume shows similar correlations, while the strongest association is seen with the Viable Tissue Volume (R = 0.53, p < 0.0001).
Fig. 4
Correlation of the Episodic Memory test (represented by the z-score of the Free and Cued Selective Reminding Test) with the fraction of Dark Matter, volume of Viable Tissue, and Total Volume of the hippocampus. Each point represents an individual participant, solid lines represent linear regression, and shaded areas are 95% confidence intervals. Additionally, individual cognitive data are presented in Supplementary Figure 2.
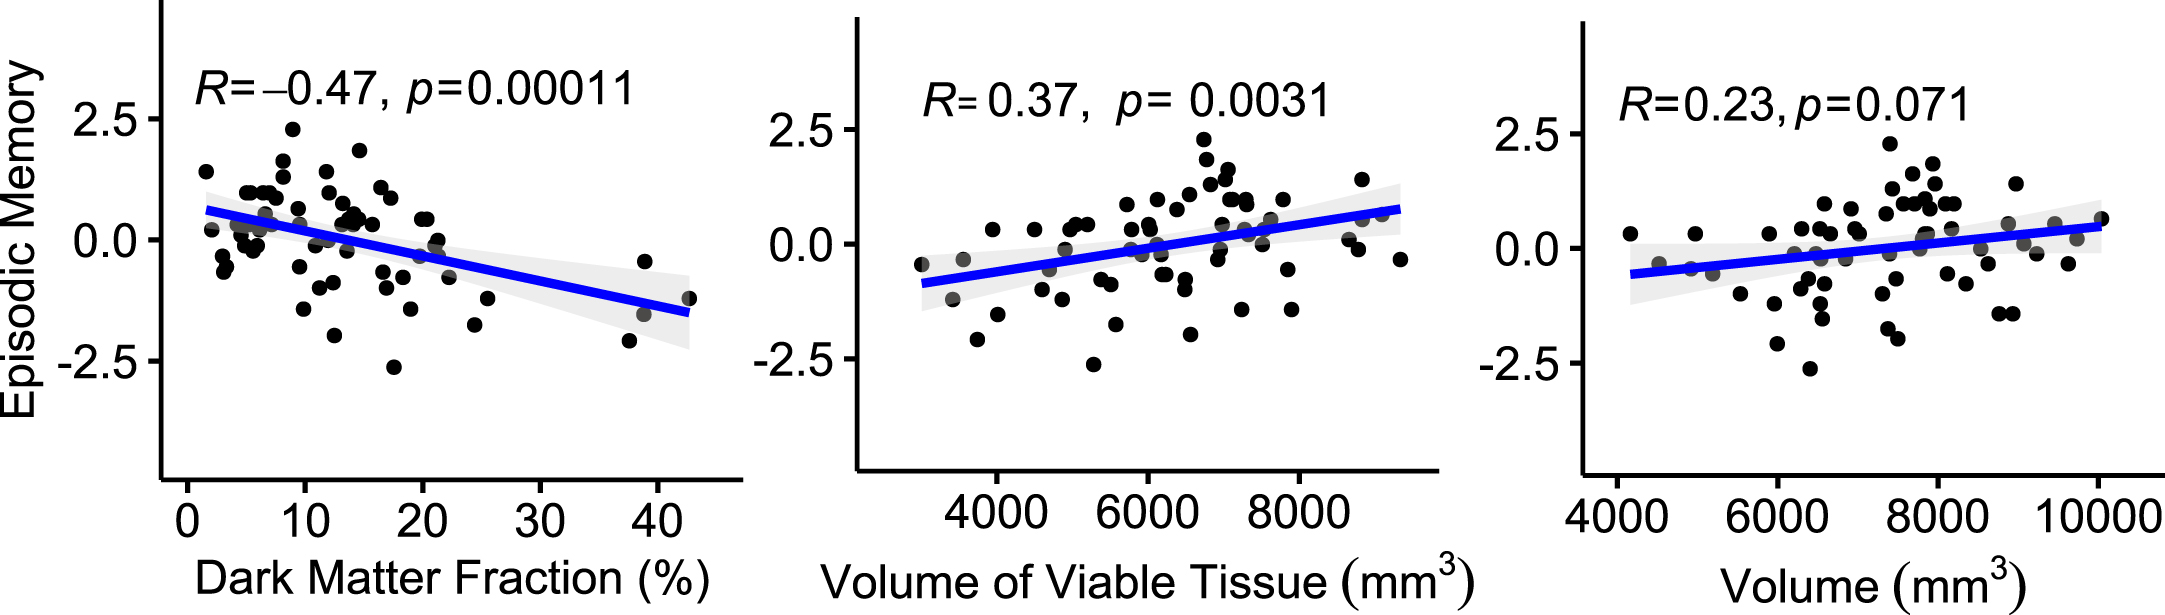
Our results for the Total Volume measurements indicate that the smaller hippocampal volume is associated with the worst cognitive performance and are consistent with the previous studies [68, 69]. Plots in Fig. 4 and Supplementary Figure 2 show a positive association with FcSRT, global cognition, letter number sequencing, animals and category fluency and negative associations (as expected) with the Trail Making A and B Tests.
Volumes of Hippocampal Dark Matter and Viable Tissue provide new biomarkers for classification of HC, PC, and mild AD groups
In this section, we present the results of our second set of data analyses that are based on global hippocampal measures and use these biomarkers to demonstrate that the new qGRE metrics (Dark Matter and Viable Tissue volumes) represent clinically important differences between groups as compared with differences based on hippocampal atrophy (reduction of hippocampal volume). Results based on the values of the individual biomarkers are shown in Fig. 5. The box plots illustrate the clinical importance of differences among the values for the HC, PC, and mild AD groups in the hippocampus. These differences among groups were assessed with a generalized linear model with a normal distribution and an identity link function. As part of this analysis, to assess differences between groups, contrast analyses were performed. Although the use of a generalized linear model does not require the assumptions of data normality or equality of variances, for each model a studentized deviance residual plot was created and examined to detect trends that were not captured by the model. For these analyses, the data distributions in the studentized deviance residual plots were judged acceptable. To partially control for these multiple assessments, alpha was set at 0.01.
Fig. 5
Group differences (A-D) and ROC classifications (E, F) based on qGRE metrics and volumetric measurements in the hippocampus. (A) Dark Matter volume (mm3), (B) Viable Tissue volume (mm3), (C) Relative Neuronal Index (total number of neurons normalized by the mean value of the total number of neurons in the HC group), and (D) Total Volume (mm3). The middle lines of the box plots represent median, ends of the boxes are the 25th and 75th quantiles (quartiles), and interquartile range is the difference between the quartiles. The lines (whiskers) extend from the boxes to the outermost points that fall within the distance computed as 1.5 (interquartile range). All generalized linear models for A, B, C, and D indicated differences among the HC, PC, and AD groups (p≤0.0004) and the p values that resulted from assessing differences between groups are indicated above the horizontal connectors between groups. (E) Result of a classification-tree that was produced using global hippocampal Dark Matter volume and Viable Tissue volume variables as predictors. (F) Result of a classification-tree that was produced using Total Hippocampal Volume as predictor. Receiver operating characteristic (ROC) curves, areas under the curves (AUCs), and a confusion matrix are presented. The confusion matrix presents the numbers of correct and incorrect classifications. ROC analysis is performed by constructing a graph of true and false positive rates (sensitivity and 1 minus specificity, respectively) for a series of cutoff points for a test (in our case, MRI metrics). The ROC curve yields a measure of diagnostic accuracy, independent of the decision criterion. It characterizes the inherent accuracy of the technique. The AUC value represents the probability that a randomly chosen abnormal case is (correctly) rated or ranked with greater suspicion than a randomly chosen normal case.
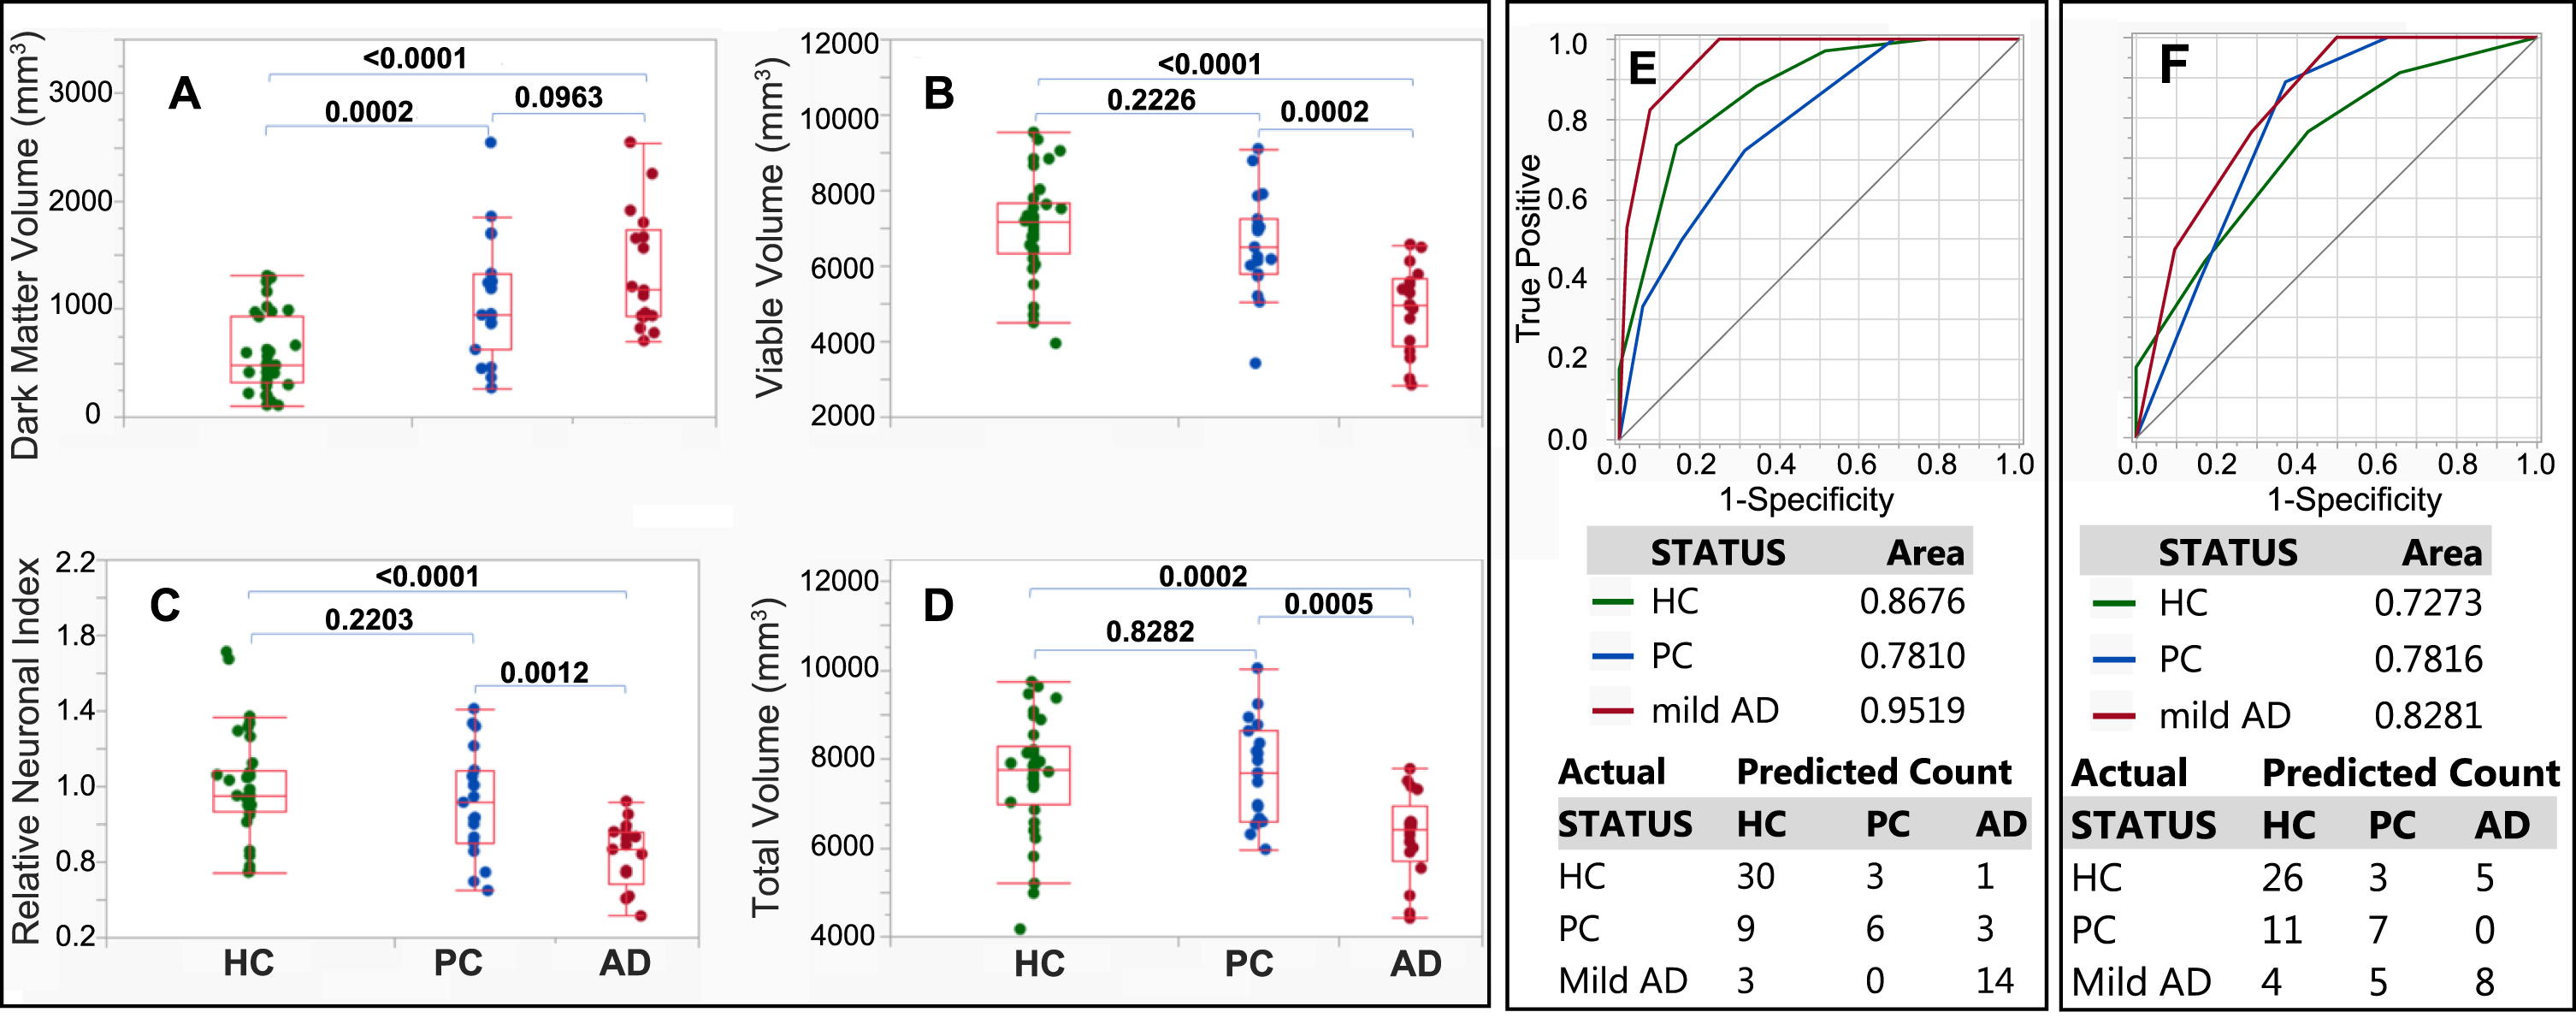
The findings demonstrate that while total hippocampal volume results in statistically significant differences between the mild AD group and the HC and PC groups, it does not result in a statistically significant difference between the PC and HC groups. At the same time, the Dark Matter volume is significantly elevated in PC group as compared with the HC group and may, thus, serve as a biomarker for early AD pathology. Note that, even after excluding the outlier with unusually high Dark Matter Volume (2542 mm3 –higher than any other participant in our study, including participants with AD) from the PC group (Fig. 5A), the difference between the HC and PC groups remains highly significant (p = 0.0008), and the p value for the difference between the PC and mild AD groups decreases (p = 0.0218 versus 0.0963 in Fig. 5A). Though, the outlier participant (89-year-old female) is cognitively normal, her very high Dark Matter volume is consistent with elevated tauopathy standard uptake value ratio (1.77) and the mean cognitive score, which is close to the mean cognitive score of the mild AD group (mean FcSRT score of mild AD group was about 16.5, and the FcSRT score for this participant was 16). Presumably, this participant might progress to symptomatic AD very soon, or might have unknown factors conferring cognitive resilience. This outlier was further excluded from classification tree analysis.
Results for the neuronal content show similar values in the HC and PC groups but an impressively lower number of neurons in the mild AD participants. These assessments were performed to estimate population parameters. Furthermore, we consider the results presented in Fig. 5A to represent clinically important differences between PC and HC groups; therefore, as an assessment of the analyses performed on the data represented in Fig. 5A, a power analysis was performed with alpha set at 0.01, which used to partially control for multiple assessments. The resulting adjusted power [70] was 0.9943 (0.4252–1.0000, 95% confidence interval), with the power for HC versus PC being 0.8736 (0.1071–1.0000). Note that unadjusted powers were respectfully 0.9973 and 0.9106.
In addition, models were used to calculate each participant’s probability of being a member of each of the three groups, and each participant was classified to the group for which the participant had the highest probability of group membership. Based upon these probabilities, ROC curves were created for the classifications for each group, with the goal being to determine how accurately classification-tree models classified all of the participants. The classification tree’s success in classifying participants to each group is illustrated with each group’s ROC curve, which is a plot of sensitivity against the false-positive rate (that is, 1 minus the specificity). The AUC is an indication of the model’s diagnostic performance. For the target classification (for instance HC), an AUC value is equal to the probability that a randomly chosen HC participant is (correctly) rated or ranked with greater suspicion than a randomly chosen PC or mild AD participant. An area of 0.5 represents chance performance. In building a classification tree model, because of the relatively small sample sizes, k-fold cross validation (with 5 folds) was used. To prevent overfitting, the model, the k-fold cross validation stopping rule was used to terminate stepping when improvement in the cross validation RSquare was minimal. The use of classification trees requires no implicit assumption that the underlying relationships between the predictor variables and the dependent variables are linear, follow some specific nonlinear link function (as with generalized linear and nonlinear models) or are even monotonic in nature—that is, they are non-parametric and nonlinear. They are also easy to interpret in that they are based on a series of nested if-then statements.
The qGRE biomarkers in the hippocampus (Dark Matter and Viable Tissue volumes) were used as predictors to build a classification tree, and the results are shown in Fig. 5E and Supplementary Figures 3–5). Results of a classification tree with the Total Volume as a predictor are shown in Supplementary Figure 6. As indicated in the classification tree (Supplementary Figure 3, the majority (25 of 34) of HC participants had low Dark Matter volume (less than 704 mm3). Of the remaining 9 HCs with Dark Matter volume larger than 704 mm3, 8 had high “compensating” Viable Tissue volume > 5782 mm3. On the other hand, the majority of participants from the PC group (13 of 18) had Dark Matter volume larger than 704 mm3 with 6 having high Viable Tissue volume (> 6,922 mm3), 4 participants with Viable Tissue volume between 5,782 mm3 and 6,922 mm3, and 3 below 5,782 mm3. All 17 participants with mild AD had Dark Matter volume greater than 704 mm3 with the majority (9) having low Viable Tissue volume of less than 5,044 mm3; 5 having Viable Tissue volumes between 5,044 mm3 and 5,782 mm3, and only 3 having Viable Tissue volumes larger than 5,782 mm3 (though less than 6,922 mm3). Thus, Dark Matter volume was an important biomarker separating participants belonging to HC and PC groups, while Viable Tissue volume played an important role in separating the HC and PC groups from the mild AD group.
ROC-based comparisons of classification results based qGRE metrics versus commonly used tissue atrophy are shown in Fig. 5 and Supplementary Figure 7. Significant differences in the AUC values for the ROC curves were found for HC (p = 0.0304) and mild AD (p = 0.0016). For Dark Matter and Viable Tissue volumes AUC was 0.8676 (0.7662 –0.9291, 95% confidence interval (CI)) and for Total Volume the AUC value was 0.7273 (0.5989 –0.8265, 95% CI) with p = 0.0304. The corresponding results for PC were 0.7810 (0.6496 –0.8729, 95% CI) and 0.7816 (0.6636 –0.8665, 95% CI), p = 0.9940, and for mild AD, 0. 9519 (0.8838 –0.8910, 95% CI) and 0.8281 (0.7129 –0.9033, 95% CI), p = 0.0016.
Data demonstrate that all AUC values for the ROC curves for Dark Matter and Viable Tissue volumes and for Total volumes had p values < 0.0001. For further comparison, for each ROC curve, the Youden Index was used to select the point at which the sensitivity and specificity were optimized. Results using Volumes of Dark Matter and Viable tissue are: for HC, the optimal sensitivity and specificity were 73.53 (55.6–87.1, 95% confidence interval (CI)) and 85.71 (69.7–95.20, 95% CI), for PC, the optimal sensitivity and specificity were 72.22 (46.5–90.3, 95% CI) and 68.63 (54.1–80.9, 95% CI), and for mild AD, the optimal sensitivity and specificity values were 100.00 (80.5–100.0) and 75.00 (61.1–86.0). Difference between these independent ROC curves were assessed using the AUC values their standard errors. The resulting p values were: 0.2143 for HC versus PC, 0.0698 for HC versus mild AD, and 0.0053 for PC versus mild AD.
Corresponding values were calculated for Total Tissue volumes. For HC, the optimal sensitivity and specificity were 76.47 (58.8–89.3, 95% CI) and 57.14 (39.4–73.7, 95% CI). For PC, the optimal sensitivity and specificity values were 88.89 (65.3–98.6, 95% CI) and 62.75 (48.1–75.9, 95% CI). For mild AD, the optimal sensitivity and specificity values of 100.00 (80.5–100.0, 95% CI) and 50.00 (35.8–64.2, 95% CI) were found. Difference between these independent ROC curves were assessed using the AUC values their standard errors. The results were not significant as p values were: 0.4883 for HC versus PC, 0.1841 for HC versus mild AD, and 0.5111 for PC versus mild AD.
The classification results presented in Fig. 5E can be further improved by including two biological variables (age or gender) in two different classification trees (Supplementary Figures 4 and 5). By including age, the AUC increased to 0.8312 for PC but remained practically the same for HC and mild AD. Including gender also increased the area under the ROC curve for PC to 0.8115, but the areas under the ROC curves remained practically the same for the HC and mild AD groups. The confusion matrices show that the combination of the Viable Tissue volume and Dark Matter volume with either age or gender improves identification of participants in the PC group. Our assessments demonstrate that volumes of Hippocampal Dark Matter and Viable Tissue provide useful biomarkers for group classification (HC, PC, and mild AD). There are many additional brain areas that could be included in building classification trees, and our expectation is that the inclusion of these additional ROIs will result in improved classification results.
Association between PET tau pathology, CDR, and qGRE biomarkers
Since tau pathology is closely related to neurodegeneration, herein we investigate the relationships between qGRE biomarkers and PET-defined tau pathology in AD-asymptomatic (CDR = 0) versus symptomatic (CDR > 0) study participants. Results are presented in Fig. 6. Results for Total Volume measurements are also shown.
Fig. 6
Associations between PET Tau pathology and qGRE biomarkers in asymptomatic (CDR = 0) and symptomatic (CDR > 0) study participants. Results for Total Volume measurements are also shown. Data represent mean and standard deviation of Dark Matter fraction (%) (top left panel), Viable Tissue volume (top right panel), relative neuronal density index (bottom left panel), and Total volume (bottom right panel) measurements in Tau–, CDR–(green box plot, n = 21); Tau+, CDR–(blue box plot, n = 11); Tau+, CDR+ (red box plot, n = 10) groups. Each dot in the box plot represents single participant. *p < 0.05, **p < 0.01, ***p < 0.001. Tukey’s honest significant difference criterion is used to correct for multiple comparisons.
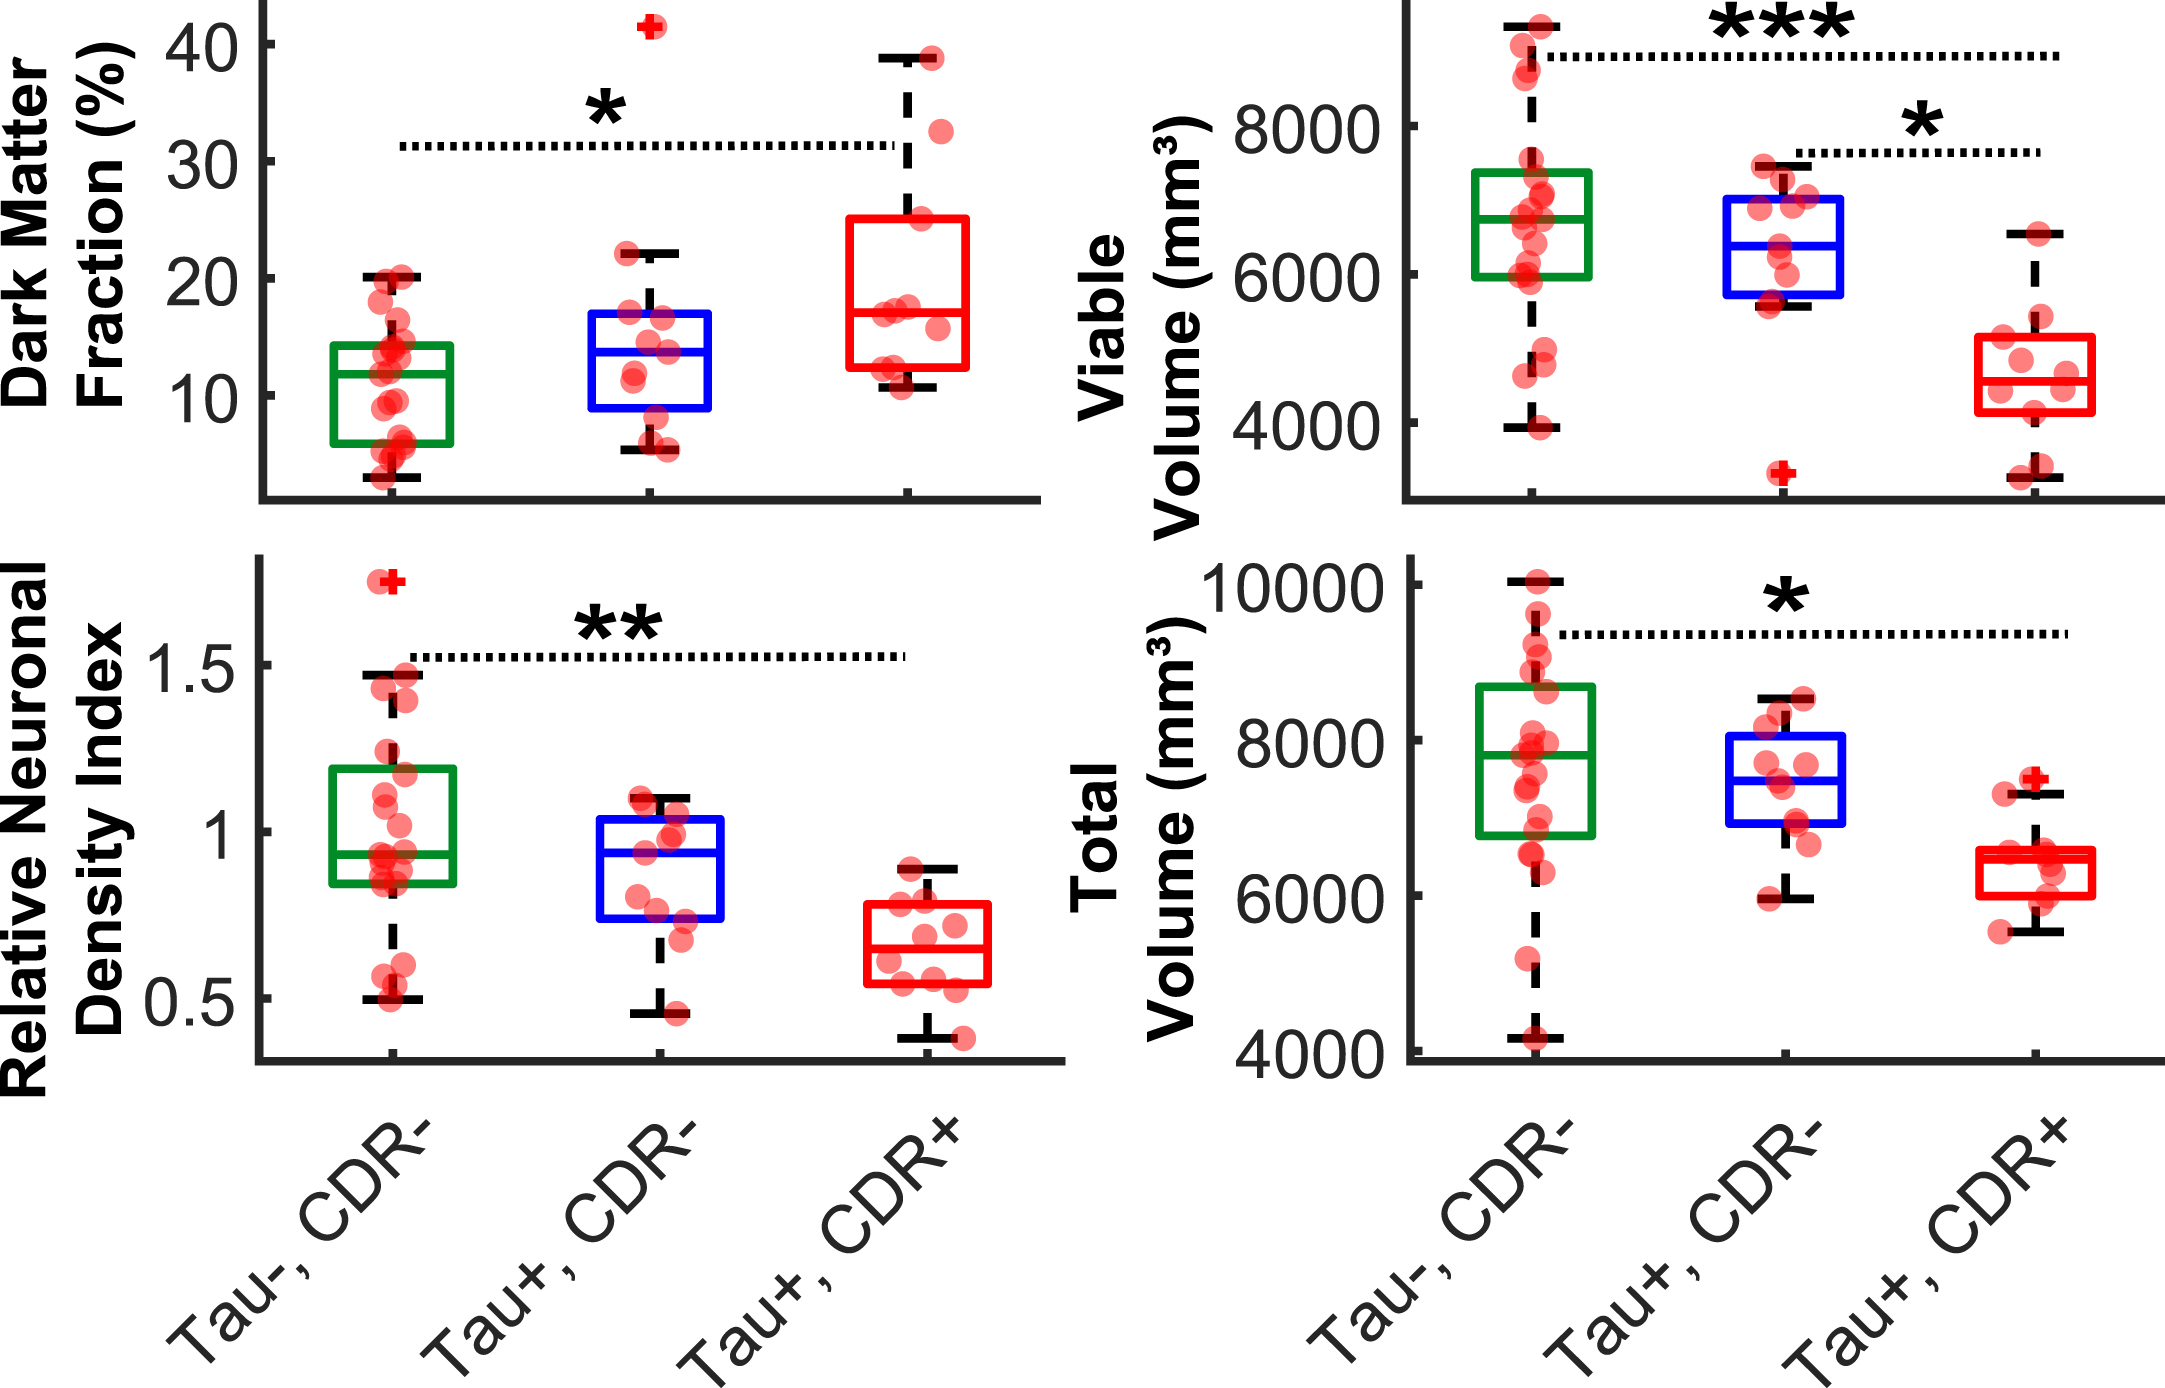
As shown in the Fig. 6, significantly higher Dark Matter fraction (19.9 % ±9.3 %), lower viable volume (46316 mm3±961 mm3), lower relative neuronal density index (0.6 ± 0.2), and lower total volume (64586 mm3±601 mm3) observed in Tau+, CDR+ group as compared with Tau+, CDR– group (15.2 % ±10.0 %; 6246 mm3 ± 1163 mm3; 0.87 ± 0.20; and 7436 mm3±774 mm3) and Tau–, CDR– group (10.9 % ±5.2 %; 6694 mm3±1460 mm3; 1.0±0.32; and 7618 mm3 ± 1427 mm3). No significant group differences (p > 0.05) were found in all measurements between Tau–, CDR– group and Tau+, CDR– group. Also, only viable tissue volume exhibits significant group difference between Tau+, CDR– and Tau+, CDR+ groups. These results suggest that no significant group differences based on qGRE and total volume measurements exist due to the tau related pathology in participants with negative CDR. Only one of 43 participants did not fit in any of three groups shown in Fig. 6, forming a (Tau–, CDR+) single-participant group. This participant, with PET tau SUVR = 1.12, had the following qGRE and Total Volume measurements: Dark Matter Fraction (21 %), Viable Volume (5750 mm3), Relative Neuronal Density Index (0.7), and total volume (7772 mm3).
Association between Dark Matter and direct neuronal count: Preliminary data
For one participant who expired and underwent postmortem neuropathologic examination 14 months after undergoing qGRE MRI, subjective assessment by an experienced neuropathologist found severe loss of neurons in the parasubiculum, the subiculum, and CA1, and modest losses in CA2/CA3 and CA4. Exemplar photomicrographs from CA1 and CA2/CA3 hippocampal subfields are presented in Fig. 7). These relative neuronal densities align with qGRE measurements that showed a large portion of Dark Matter around the head of the hippocampus (first row in Fig. 7)—in parasubiculum (25% of Dark Matter), subiculum (18% of Dark Matter), and CA1 (23% of Dark Matter) regions. We found relatively low Dark Matter fraction in CA2/CA3 (3%) and CA4 (10%) regions, which exhibit relative neuronal preservation, as assessed histologically. We also found strong inter-regional association (R2 = 0.78) between in vivo qGRE measurements of Dark Matter fraction and an average neuronal count (N) in 40x objective fields (N = 8 in parasubiculum, N = 1 in subiculum, N = 3 in CA1, N = 59 in CA2/CA3, and N = 21 in CA4) in the postmortem study (presented in Supplementary Table 3).
Fig. 7
Data obtained from an 81-year-old male study participant with a clinical diagnosis of dementia (CDR 1) who underwent qGRE MRI 14 months prior to expiration (upper panel). qGRE R2t* in the hippocampus (outlined in yellow with hippocampal subfields shown in colors, segmented based on FreeSurfer) shows Dark Matter (hypointense lesions with lower R2t* values) in parts of subiculum, parasubiculum and CA1, indicating the loss of neurons. This is confirmed by direct neuropathological examination shown in the lower panel obtained from the postmortem studies from this participant. Severe neuronal loss in CA1 (hematoxylin and eosin stain) is reflected by the presence of only one remaining definitively identifiable neuron (indicated by the arrow) within this representative image; relative neuronal preservation is shown in a representative photomicrograph from CA2/CA3. Unlike qGRE R2t*, T1-weighted MPRAGE imaging finds the hippocampal region to be practically homogeneous without any obvious intensity contrast. Hence, the data demonstrate a higher sensitivity of qGRE R2t* measurements to tissue neuronal loss as compared with standard volumetric measurements. Scale bars are 50 micrometers.
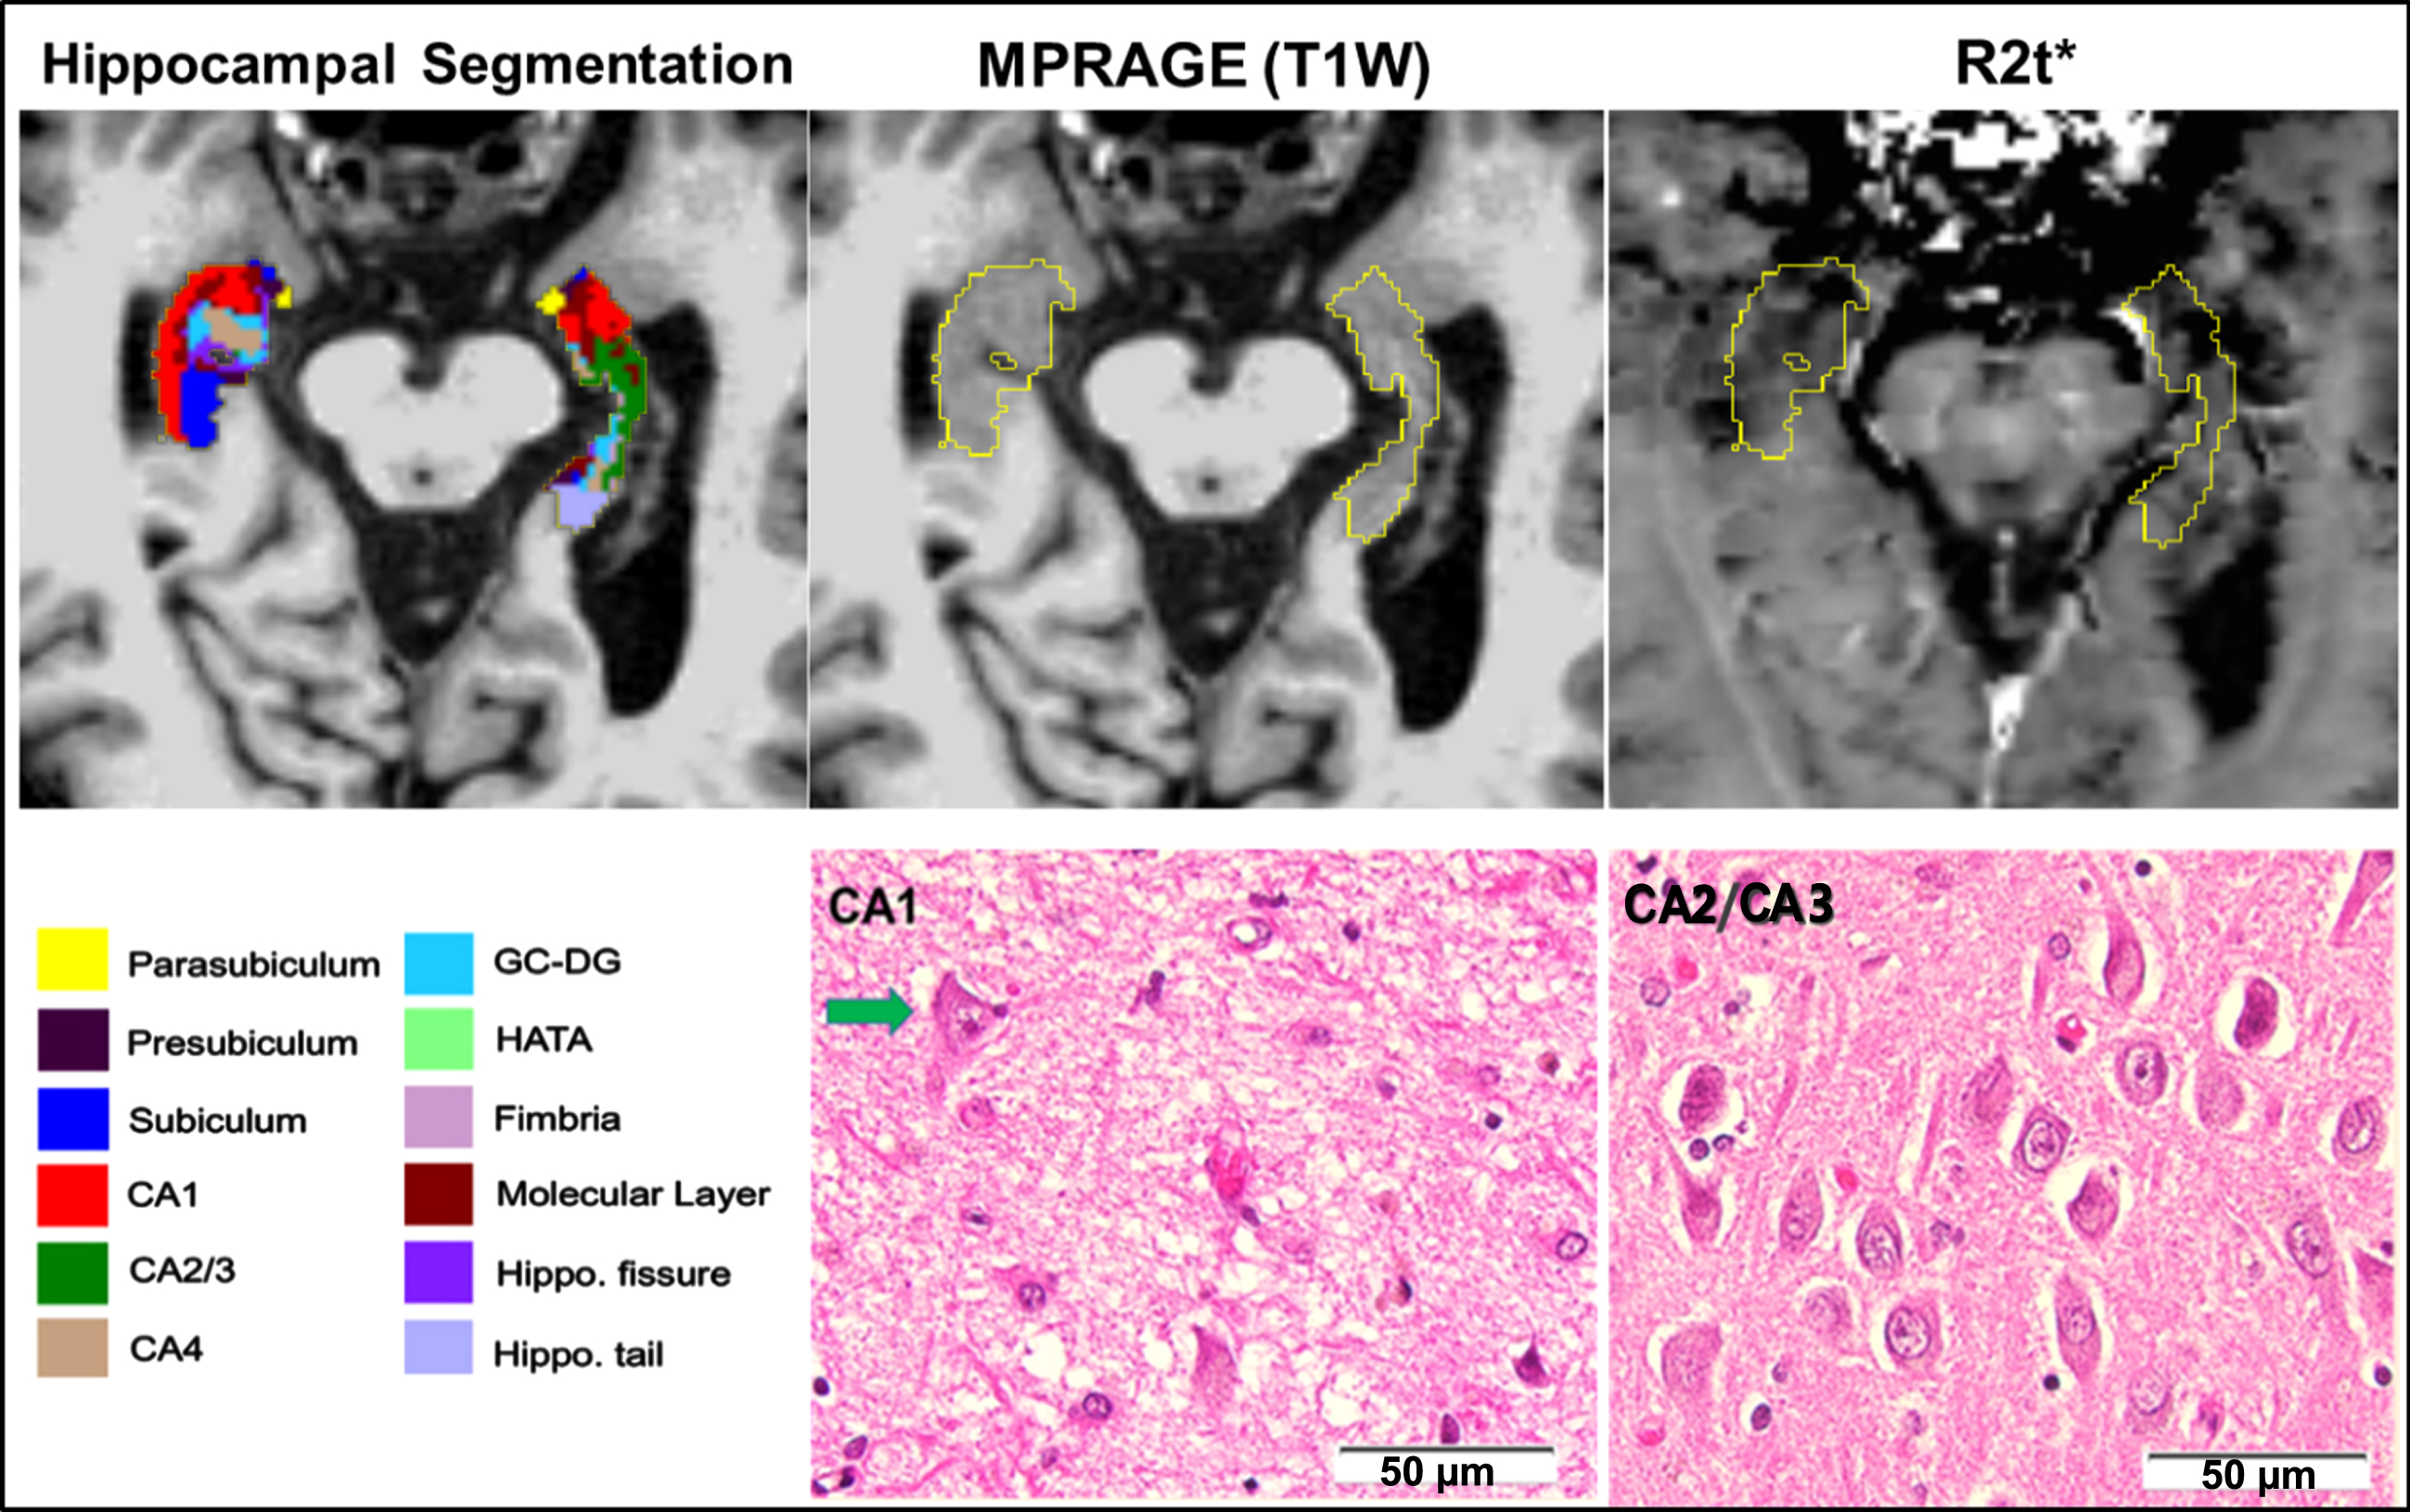
Our preliminary data provide direct validation of the Dark Matter concept, using qGRE to accurately identify brain regions with substantial neuron losses that are not readily detectable on T1-weighted images. This further indicates that in vivo qGRE measurement is sensitive for detecting neuronal loss as compared with T1-weighted based volumetric approach.
DISCUSSION
This study demonstrates that the qGRE method identifies neuronal loss within hippocampal subfields that is associated with impaired cognition but is not recognized by MRI measurements of tissue atrophy. The onset of AD-related pathology is known to start several years prior to detectable clinical symptoms [2–6] but usually cannot be appreciated, using conventional neuroimaging techniques (i.e., volumetric measurements of tissue atrophy) [6]. A recently proposed A/T/N framework describes a classification system based on the pathological changes accompanying AD progression [23]. With this approach, A refers to amyloidosis, T refers to neurofibrillary tangles, and N refers to neurodegeneration or neuronal injury. Biomarkers for A or T classification include PET and/or CSF measurements, which are well correlated with Braak stages [71]. Losses of neuronal structure or function are defined as neuro-degeneration (N) with relevant biomarkers including CSF tau, FDG-PET hypometabolism, and structural MRI (measurement of tissue atrophy). Compared with other techniques, structural MRI (usually T1-weighted MPRAGE) offers high resolution 3D images with good gray/white matter contrast that allow accurate measurement of brain regional volumes and their changes in AD (see recent review [72]). In particular, hippocampal atrophy has been connected to age-related pathology [73] and cognitive impairment [74]; however, as was demonstrated in patients with AD [63], hippocampal regions that have almost isointense contrast on structural MRI might have important variations in measurements of R2t*, reflecting variation in tissue cellular integrity. This is because T1-weighted imaging only provides the information on global tissue atrophy but is not sensitive to the microstructural changes at the cellular level (i.e., inflammation, loss of neurons, synapses, etc.) in the existing not-atrophied tissue. Several other MRI methods (e.g., diffusion tensor imaging [75], quantitative susceptible mapping [76], arterial spin labeling measurements of the cerebral blood flow [77], magnetic resonance spectroscopy [78]) also reported AD-related changes in brain tissue structure and functioning.
Our approach for evaluation of AD-related tissue cellular damage is based on qGRE MRI [30] that allows direct mapping of biomarkers related to human brain cellular composition [31]. qGRE technique is based on a high resolution gradient recalled echo MRI sequence with multiple gradient echoes (available from most MRI manufacturers), the method for separation of cellular specific (R2t*) and BOLD contributions to the R2* decay of the GRE signal [30], and a quantitative relationship between qGRE R2t* metric and tissue neuronal density that was derived in [31] by analyzing an association between maps of R2t* and maps of gene expression profiles obtained from the Allen Human Brain Atlas. This relationship is in concert with a proposed hypothesis [61] that the R2t* parameter can be used as a correlate of cellular structure in healthy brain as well as cellular integrity changes in mild AD [79].
In our study, we used qGRE R2t* mapping to introduce two new quantitative MRI biomarkers to better characterize AD-related, brain-tissue pathology especially at early, preclinical stages of AD: Dark Matter (brain tissue practically devoid of neurons), and Viable Tissue (tissue with a relatively preserved concentration of neurons). The key finding of this study demonstrates that the changes in hippocampal volumes of Viable Tissue and Dark Matter are more sensitive than changes in global hippocampal volume (atrophy) for differentiating healthy control participants from preclinical and mild AD participants, thus providing early biomarkers of neurodegeneration in preclinical AD. Our data also show that the hippocampal volumes of Dark Matter (increased even in preclinical AD stages) and Viable Tissue (decreased with AD progression) are more sensitive correlates of cognitive performance than the global volume of the hippocampus (decreased only in AD stages).
One of the significant consequences of the presence of Dark Matter (and relative preservation of neuronal concentration in the Viable Tissue) is a faster rate of neuronal loss as compared with tissue atrophy. This finding is important due to early observations that the neuron number in layer II of entorhinal cortex determines whether individuals with the neuropathology of AD manifest symptoms: there is little or no neuronal loss in individuals who did not have symptoms of AD during life, whereas individuals with even the earliest symptomatic stages of the disease already had substantial neuronal loss [24, 26]. Hence, it is critical to get in vivo information on loss of neuronal cells prior to their detection by standard volumetric measurements. Our data demonstrate greater changes in Dark Matter and Viable Tissue (reflecting higher neuronal loss; 31–43% in different hippocampal subfields) as compared with volume loss (10–19% in these subfields) in the mild AD group, relative to HC. This result is consistent with previous findings [24] that reported about 46% of neuronal loss and 29% of volumetric loss (about 1.6x lower than neuronal loss) in CA1 region in the AD postmortem brains compared with brains from those who died with normal cognition.
We can also compare our qGRE results with the results of brain tau measurements that are also associated with neurodegeneration. In our study, qGRE measurements showed that Dark Matter constitutes approximately 8% of total hippocampal tissue even in healthy elderly individuals (age 72±6 years) who are cognitively normal and without amyloid pathology. Furthermore, the Dark Matter volume was increased about 2.9x in the hippocampus of mild AD group compared with the normal control group, which is similar with findings of an autopsy study [80] that reported a ∼2.7x higher concentration of NFTs in the entorhinal cortex of the participants with mild cognitive impairment (MCI) as compared with cognitively normal individuals.
Our data in Fig. 6 show no significant group differences (p > 0.05) in all measurements between Tau–, CDR– and Tau+, CDR– groups, which is consistent with no significant group differences found between cognitive composite scores regardless of PET tau status (Tau+ and Tau–) in cognitively normal participants (CDR = 0) [81]. At the same time, significantly higher Dark Matter fraction, lower viable volume, lower relative neuronal density index, and lower total volume were observed in Tau+, CDR+ group as compared with Tau+, CDR– group and Tau–, CDR– group (Fig. 6), which is also consistent with the strong correlation between accumulation of PET tau tracer and cognitive scores when CDR+ group was included [81].
Of note, the preclinical designation in our study is not the same as MCI in [80], as our ‘preclinical ‘designation is assigned to participants without cognitive impairment but with amyloid pathology, whereas the term ‘MCI’ classification is based on the presence of cognitive impairment only.
Results shown in Fig. 5 and Supplementary Figure 7 demonstrate advantages of using new qGRE metrics versus commonly used tissue atrophy for participants’ classification between Healthy Control, Preclinical, and Mild AD groups. Detail statistical analysis showed that the AUC values resulting from the ROC curves for Dark Matter and Viable Tissue volumes and for Total volume were all significant (p < 0.0001). However, for Total volume, none of the AUC values were different from one another (p≥0.1841), while for Dark Matter and Viable Tissue volumes, the AUC value for mild AD was significantly higher than that for PC (p = 0.0053) and approached being significantly different from HC (p = 0.0698). In addition, for mild AD, the AUC value for Dark Matter and Viable Tissue volumes was significantly higher than the AUC value for Total volume (p = 0.0016), and the same was true for HC (p = 0.0340). The AUC values for Dark Matter and Viable Tissue volumes and Total volumes were highest for mild AD (respectively, 0.9519 and 0.8281, for which the optimal sensitivities for both methods were 100%; however, the optimal specificities were respectively 75% and 50%, with the optimal specificity for Total Volume being equivalent to a flip of a coin.
In this study, all hippocampal subfields had lower volume (atrophy) in mild AD when compared with HC group, with the maximum volume loss in the presubiculum, followed by smaller volume reductions in the ML and HP tail regions. These results are consistent with the literature on hippocampal subfields volumetric studies that report lower volumes in different hippocampal subfields in patients with AD compared with cognitive normal individuals [20, 65, 82, 83]. Several imaging [58, 84, 85], autopsy [24, 29, 86, 87], and animal [88] studies demonstrate the early involvement of the CA1 region in AD-related neurodegeneration. While our analysis also showed volume reduction in CA1, it did not reach our statistical threshold for our sample of participants, most likely due to insufficient sample size. However, our Viable Tissue volume measurements that consider microstructural neuronal damage, demonstrated differences in the CA1 region between mild AD and HC. In addition, our findings suggest that the volumes of Viable Tissue and Dark Matter can be better candidates than volumetric measurements for predicting cognitive performance. For example, FcSRT has been widely used to distinguish AD-related dementia from non-AD-related dementia [89, 90], and this neuropsychological test is considered to be the best candidate for episodic memory [91] assessment. A previous study reported a positive but rather weak (r∼0.3) association between hippocampal volume and the FcSRT test in a population between 65–80 years [92]. In our participants, the volumetric data also show a positive but weak association between total hippocampal volume and the FcSRT test (r∼0.23) but relatively stronger associations with qGRE hippocampal metrics –volume of Viable Tissue (r∼0.37) and Dark Matter fraction (r∼–0.47).
Our study has several limitations. First, the association between R2t* and NDI was derived in [31] for healthy control brains, and this relation might not directly translate for diseased brains. Hence, NDI in AD brain can be treated as an apparent proxy for neuronal density. Other concomitant with neuronal loss pathological changes in tissue microstructure (e.g., axonal demyelination, depletion of ferritin iron, etc.) can also potentially lead to reduced R2t*. Further neuropathological studies are required for establishing more detailed information on the relationship between R2t* and tissue cellular composition. In this study, we deduced an NDI only for viable tissue and used a 5.8 s–1 threshold for Dark Matter separation from Viable Tissue for all study participants. Additional analysis presented in Supplementary Figure 1 shows that our main conclusions are quite stable and the R2t*= 5.8 s–1 threshold for Dark Matter separation used in our study is also a reasonable criterion for assessment in AD-related participants. Our study had relatively small numbers of participants in each group—a larger study is underway that will further improve the statistical power of our findings. While further validation of the relationship between qGRE metrics and microstructural neurodegeneration is underway, our results are consistent with the qGRE measurements being associated with the measurements of neuronal density:
• Previously we have established a genetically-informed quantitative relationships between R2t* qGRE metric and healthy brain tissue neuronal structure [31].
• The presence of DM is consistent with early histopathological studies demonstrating that the neuronal loss in the hippocampus actually exceeds the loss of tissue volume [24].
• Herein we presented a single case of direct histopathological validation of Dark Matter representation as a tissue with significantly lower neuronal content not readily detectable with traditional volumetric measurements. A larger study is also underway to further validate this concept.
While in this study we used hippocampal segmentation based on FreeSurfer software, new tools [93] can be more sensitive for specific AD pathology in the hippocampus.
In summary, the key finding of this study is demonstrating that the changes in hippocampal volumes of Viable Tissue and Dark Matter are more sensitive than the changes in global hippocampal Tissue Volume (atrophy) for differentiating healthy control participants from preclinical and mild AD groups, thus providing early biomarkers of preclinical AD pathology. Our data also show that the hippocampal volumes of Dark Matter (increased even in preclinical AD stages) and Viable Tissue (decreased with AD progression) are more sensitive correlates of cognitive performance than the global volume of the hippocampus (decreased only in symptomatic AD stages).
Our approach is based on the qGRE method utilizing a multi-gradient-echo MRI sequence available from most MRI manufacturers and required only about 6 minutes of MRI scanning time. Data analysis can be significantly accelerated with aid of the deep learning method [94], thus opening opportunity for broad research and clinical applications. Combining in vivo qGRE biomarkers of neuronal injury with the current in vivo PET and CSF biomarkers would allow for better understanding and detection of the early pathology in AD and other dementias.
ACKNOWLEDGMENTS
The authors would like to thank Brian Gordon for helpful discussion and Erin Franklin for facilitating and coordinating histopathological evaluations.
This study was supported by the NIH grants R01 AG054513, P50 AG0581, P01 AG03991, P01 AG026276, and The Clinical Core of the Knight Alzheimer Disease Research Center for participant characterization.
Authors’ disclosures available online (https://www.j-alz.com/manuscript-disclosures/21-0503r3).
SUPPLEMENTARY MATERIAL
[1] The supplementary material is available in the electronic version of this article: https://dx.doi.org/10.3233/JAD-210503.
REFERENCES
[1] | Alzheimer’s Association ((2018) ) 2018 Alzheimer’s disease facts and figures. Alzheimers Dement 14: , 367–429. |
[2] | Jack CR Jr., Knopman DS , Jagust WJ , Shaw LM , Aisen PS , Weiner MW , Petersen RC , Trojanowski JQ ((2010) ) Hypothetical model of dynamic biomarkers of the Alzheimer’s pathological cascades. Lancet Neurol 9: , 119–128. |
[3] | Bateman RJ , Xiong C , Benzinger TL , Fagan AM , Goate A , Fox NC , Marcus DS , Cairns NJ , Xie X , Blazey TM , Holtzman DM , Santacruz A , Buckles V , Oliver A , Moulder K , Aisen PS , Ghetti B , Klunk WE , McDade E , Martins RN , Masters CL , Mayeux R , Ringman JM , Rossor MN , Schofield PR , Sperling RA , Salloway S , Morris JC , Dominantly Inherited Alzheimer N ((2012) ) Clinical and biomarker changes in dominantly inherited Alzheimer’s disease. N Engl J Med 367: , 795–804. |
[4] | Benzinger TL , Blazey T , Jack CR Jr., Koeppe RA , Su Y , Xiong C , Raichle ME , Snyder AZ , Ances BM , Bateman RJ , Cairns NJ , Fagan AM , Goate A , Marcus DS , Aisen PS , Christensen JJ , Ercole L , Hornbeck RC , Farrar AM , Aldea P , Jasielec MS , Owen CJ , Xie X , Mayeux R , Brickman A , McDade E , Klunk W , Mathis CA , Ringman J , Thompson PM , Ghetti B , Saykin AJ , Sperling RA , Johnson KA , Salloway S , Correia S , Schofield PR , Masters CL , Rowe C , Villemagne VL , Martins R , Ourselin S , Rossor MN , Fox NC , Cash DM , Weiner MW , Holtzman DM , Buckles VD , Moulder K , Morris JC ((2013) ) Regional variability of imaging biomarkers in autosomal dominant Alzheimer’s disease. Proc Natl Acad Sci U S A 110: , E4502–4509. |
[5] | Sperling RA , Aisen PS , Beckett LA , Bennett DA , Craft S , Fagan AM , Iwatsubo T , Jack CR Jr., Kaye J , Montine TJ , Park DC , Reiman EM , Rowe CC , Siemers E , Stern Y , Yaffe K , Carrillo MC , Thies B , Morrison-Bogorad M , Wagster MV , Phelps CH ((2011) ) Toward defining the preclinical stages of Alzheimer’s disease: Recommendations from the National Institute on Aging-Alzheimer’s Association workgroups on diagnostic guidelines for Alzheimer’s disease. Alzheimers Dement 7: , 280–292. |
[6] | Long JM , Holtzman DM ((2019) ) Alzheimer disease: An update on pathobiology and treatment strategies. Cell 179: , 312–339. |
[7] | Jack CR , Petersen RC , Xu YC , O’Brien PC , Smith GE , Ivnik RJ , Boeve BF , Waring SC , Tangalos EG , Kokmen E ((1999) ) Prediction of AD with MRI-based hippocampal volume in mild cognitive impairment. Neurology 52: , 1397–1397. |
[8] | Jack CR , Petersen RC , O’brien PC , Tangalos EG ((1992) ) MR-basedhippocampal volumetry in the diagnosis of Alzheimer’s disease. Neurology 42: , 183–183. |
[9] | Jack C , Petersen RC , Xu Y , O’brien P , Smith G , Ivnik R , Boeve BF , Tangalos EG , Kokmen E ((2000) ) Rates of hippocampal atrophy correlate with change in clinical status in aging and AD. Neurology 55: , 484–490. |
[10] | Kesslak JP , Nalcioglu O , Cotman CW ((1991) ) Quantification of magnetic resonance scans for hippocampal and parahippocampal atrophy in Alzheimer’s disease. Neurology 41: , 51–51. |
[11] | Duvernoy HM (2005) The human hippocampus: Functional anatomy, vascularization and serial sections with MRI, Springer Science & Business Media. |
[12] | Braak H , Braak E ((1991) ) Neuropathological stageing of Alzheimer-related changes. Acta Neuropathol 82: , 239–259. |
[13] | Bobinski M , Wegiel J , Tarnawski M , Bobinski M , Reisberg B , De Leon MJ , Miller DC , Wisniewski HM ((1997) ) Relationships between regional neuronal loss and neurofibrillary changes in the hippocampal formation and duration and severity of Alzheimer disease. J Neuropathol Exp Neurol 56: , 414–420. |
[14] | Maruszak A , Thuret S ((2014) ) Why looking at the whole hippocampus is not enough—a critical role for anteroposterior axis, subfield and activation analyses to enhance predictive value of hippocampal changes for Alzheimer’s disease diagnosis. Front Cell Neurosci 8: , 95. |
[15] | Mueller SG , Weiner MW ((2009) ) Selective effect of age, Apo e4, and Alzheimer’s disease on hippocampal subfields. Hippocampus 19: , 558–564. |
[16] | La C , Linortner P , Bernstein JD , Cruadhlaoich MAU , Fenesy M , Deutsch GK , Rutt BK , Tian L , Wagner AD , Zeineh M ((2019) ) Hippocampal CA1 subfield predicts episodic memory impairment in Parkinson’s disease. Neuroimage Clin 23: , 101824. |
[17] | Haukvik UK , Tamnes CK , Söderman E , Agartz I ((2018) ) Neuroimaging hippocampal subfields in schizophrenia and bipolar disorder: A systematic review and meta-analysis. J Psychiatr Res 104: , 217–226. |
[18] | Wisse LE , Biessels GJ , Heringa SM , Kuijf HJ , Luijten PR , Geerlings MI , Group UVCIVS ((2014) ) Hippocampal subfield volumes at 7T in early Alzheimer’s disease and normal aging. Neurobiol Aging 35: , 2039–2045. |
[19] | Zheng F , Cui D , Zhang L , Zhang S , Zhao Y , Liu X , Liu C , Li Z , Zhang D , Shi L ((2018) ) The volume of hippocampal subfields in relation to decline of memory recall across the adult lifespan. Front Aging Neurosci 10: , 320. |
[20] | Parker TD , Slattery CF , Yong KX , Nicholas JM , Paterson RW , Foulkes AJ , Malone IB , Thomas DL , Cash DM , Crutch SJ ((2019) ) Differences in hippocampal subfield volume are seen in phenotypic variants of early onset Alzheimer’s disease. Neuroimage Clin 21: , 101632. |
[21] | La Joie R , Perrotin A , De La Sayette V , Egret S , Doeuvre L , Belliard S , Eustache F , Desgranges B , Chételat G ((2013) ) Hippocampal subfield volumetry in mild cognitive impairment, Alzheimer’s disease and semantic dementia. Neuroimage Clin 3: , 155–162. |
[22] | Bastos-Leite An J , van der Flier WM , van Straaten EC , Staekenborg SS , Scheltens P , Barkhof F ((2007) ) The contribution of medial temporal lobe atrophy and vascular pathology to cognitive impairment in vascular dementia. Stroke 38: , 3182–3185. |
[23] | Jack CR , Bennett DA , Blennow K , Carrillo MC , Feldman HH , Frisoni GB , Hampel H , Jagust WJ , Johnson KA , Knopman DS , Petersen RC , Scheltens P , Sperling RA , Dubois B ((2016) ) A/T/N: An unbiased descriptive classification scheme for Alzheimer disease biomarkers. Neurology 87: , 539–547. |
[24] | Price JL , Ko AI , Wade MJ , Tsou SK , McKeel DW , Morris JC ((2001) ) Neuron number in the entorhinal cortex and CA1 in preclinical Alzheimer disease. Arch Neurol 58: , 1395–1402. |
[25] | Mecca AP , Chen M-K , O’Dell RS , Naganawa M , Toyonaga T , Godek TA , Harris JE , Bartlett HH , Zhao W , Nabulsi NB , Wyk BCV , Varma P , Arnsten AFT , Huang Y , Carson RE , van Dyck CH ((2020) ) In vivo measurement of widespread synaptic loss in Alzheimer’s disease with SV2A PET. Alzheimers Dement 16: , 974–982. |
[26] | Gomez-Isla T , Price JL , McKeel DW Jr., Morris JC , Growdon JH , Hyman BT ((1996) ) Profound loss of layer II entorhinal cortex neurons occurs in very mild Alzheimer’s disease. J Neurosci 16: , 4491–4500. |
[27] | Terry RD , Masliah E , Salmon DP , Butters N , DeTeresa R , Hill R , Hansen LA , Katzman R ((1991) ) Physical basis of cognitive alterations in Alzheimer’s disease: Synapse loss is the major correlate of cognitive impairment. Ann Neurol 30: , 572–580. |
[28] | Selkoe DJ ((2002) ) Alzheimer’s disease is a synaptic failure. Science 298: , 789–791. |
[29] | West MJ , Coleman PD , Flood DG , Troncoso JC ((1994) ) Differences in the pattern of hippocampal neuronal loss in normal ageing and Alzheimer’s disease. Lancet 344: , 769–772. |
[30] | Ulrich X , Yablonskiy DA ((2016) ) Separation of cellular and BOLD contributions to T2* signal relaxation. Magn Reson Med 75: , 606–615. |
[31] | Wen J , Goyal MS , Astafiev SV , Raichle ME , Yablonskiy DA ((2018) ) Genetically defined cellular correlates of the baseline brain MRI signal. Proc Natl Acad Sci U S A 115: , E9727–E9736. |
[32] | Ogawa S , Lee TM , Kay AR , Tank DW ((1990) ) Brain magnetic resonance imaging with contrast dependent on blood oxygenation. Proc Natl Acad Sci U S A 87: , 9868–9872. |
[33] | Yablonskiy DA , Haacke EM ((1994) ) Theory of NMR signal behavior in magnetically inhomogeneous tissues: The static dephasing regime. Magn Reson Med 32: , 749–763. |
[34] | Yablonskiy DA ((1998) ) Quantitation of intrinsic magnetic susceptibility-related effects in a tissue matrix. Phantom study. Magn Reson Med 39: , 417–428. |
[35] | He X , Zhu M , Yablonskiy DA ((2008) ) Validation of oxygen extraction fraction measurement by qBOLD technique. Magn Reson Med 60: , 882–888. |
[36] | Morris JC ((1997) ) Clinical dementia rating: A reliable and valid diagnostic and staging measure for dementia of the Alzheimer type. Int Psychogeriatr 9: , 173–176. |
[37] | Morris JC ((1993) ) The Clinical Dementia Rating (CDR): Current version and scoring rules. Neurology 43: , 2412–2414. |
[38] | Grober E , Buschke H , Crystal H , Bang S , Dresner R ((1988) ) Screening for dementia by memory testing. Neurology 38: , 900–900. |
[39] | Armitage SG ((1946) ) An analysis of certain psychological tests used for the evaluation of brain injury. Psychol Monogr 60: , i. |
[40] | Goodglass H , Kaplan E (1983) Boston diagnostic aphasia examination booklet, Lea & Febiger. |
[41] | Wechsler D ((1997) ) WAIS-III: Administration and scoring manual: Wechsler adult intelligence scale–third edition. The Psychological Corporation, San Antonio, TX. |
[42] | Schindler SE , Sutphen CL , Teunissen C , McCue LM , Morris JC , Holtzman DM , Mulder SD , Scheltens P , Xiong C , Fagan AM ((2018) ) Upward drift incerebrospinal fluid amyloid β 42 assay values for more than10 & years. Alzheimers Dement 14: , 62–70. |
[43] | Su Y , Flores S , Wang G , Hornbeck RC , Speidel B , Joseph-Mathurin N , Vlassenko AG , Gordon BA , Koeppe RA , Klunk WE , Jack CR Jr., Farlow MR , Salloway S , Snider BJ , Berman SB , Roberson ED , Brosch J , Jimenez-Velazques I , van Dyck CH , Galasko D , Yuan SH , Jayadev S , Honig LS , Gauthier S , Hsiung GR , Masellis M , Brooks WS , Fulham M , Clarnette R , Masters CL , Wallon D , Hannequin D , Dubois B , Pariente J , Sanchez-Valle R , Mummery C , Ringman JM , Bottlaender M , Klein G , Milosavljevic-Ristic S , McDade E , Xiong C , Morris JC , Bateman RJ , Benzinger TLS ((2019) ) Comparison of Pittsburgh compound B and florbetapir in cross-sectional and longitudinal studies. Alzheimers Dement (Amst) 11: , 180–190. |
[44] | Su Y , D’Angelo GM , Vlassenko AG , Zhou G , Snyder AZ , Marcus DS , Blazey TM , Christensen JJ , Vora S , Morris JC , Mintun MA , Benzinger TLS ((2013) ) Quantitative Analysis of PiB-PET with FreeSurfer ROIs. PLoS One 8: , e73377. |
[45] | Mishra S , Gordon BA , Su Y , Christensen J , Friedrichsen K , Jackson K , Hornbeck R , Balota DA , Cairns NJ , Morris JC , Ances BM , Benzinger TLS ((2017) ) AV-1451 PET imaging of tau pathology in preclinical Alzheimer disease: Defining a summary measure. Neuroimage 161: , 171–178. |
[46] | Morris JC , Roe CM , Grant EA , Head D , Storandt M , Goate AM , Fagan AM , Holtzman DM , Mintun MA ((2009) ) Pittsburgh compound B imaging and prediction of progression from cognitive normality to symptomatic Alzheimer disease. Arch Neurol 66: , 1469–1475. |
[47] | Fagan AM , Roe CM , Xiong C , Mintun MA , Morris JC , Holtzman DM ((2007) ) Cerebrospinal fluid tau/beta-amyloid(42) ratio as a prediction of cognitive decline in nondemented older adults. Arch Neurol 64: , 343–349. |
[48] | Jack CR Jr. ((2020) ) Preclinical Alzheimer’s disease: A valid concept. Lancet Neurol 19: , 31. |
[49] | Nelson PT , Dickson DW , Trojanowski JQ , Jack CR , Boyle PA , Arfanakis K , Rademakers R , Alafuzoff I , Attems J , Brayne C , Coyle-Gilchrist ITS , Chui HC , Fardo DW , Flanagan ME , Halliday G , Hokkanen SRK , Hunter S , Jicha GA , Katsumata Y , Kawas CH , Keene CD , Kovacs GG , Kukull WA , Levey AI , Makkinejad N , Montine TJ , Murayama S , Murray ME , Nag S , Rissman RA , Seeley WW , Sperling RA , White III CL , Yu L , Schneider JA ((2019) ) Limbic-predominant age-related TDP-43encephalopathy (LATE): Consensus working group report. Brain 142: , 1503–1527. |
[50] | Josephs KA , Murray ME , Whitwell JL , Tosakulwong N , Weigand SD , Petrucelli L , Liesinger AM , Petersen RC , Parisi JE , Dickson DW ((2016) ) Updated TDP-43 in Alzheimer’s disease staging scheme. Acta Neuropathol 131: , 571–585. |
[51] | Montine TJ , Phelps CH , Beach TG , Bigio EH , Cairns NJ , Dickson DW , Duyckaerts C , Frosch MP , Masliah E , Mirra SS , Nelson PT , Schneider JA , Thal DR , Trojanowski JQ , Vinters HV , Hyman BT ((2012) ) National Institute on Aging-Alzheimer’s Association guidelines for the neuropathologic assessment of Alzheimer’s disease: A practical approach. Acta Neuropathol 123: , 1–11. |
[52] | Mugler III JP , Brookeman JR ((1990) ) Three-dimensionalmagnetization-prepared rapid gradient-echo imaging (3D MP RAGE). Magn Reson Med 15: , 152–157. |
[53] | Wen J , Cross AH , Yablonskiy DA ((2015) ) On the role of physiological fluctuations in quantitative gradient echo MRI: Implications for GEPCI, QSM, and SWI. Magn Reson Med 73: , 195–203. |
[54] | Quirk JD , Sukstanskii AL , Bretthorst GL , Yablonskiy DA ((2009) ) Optimal decay rate constant estimates from phased array data utilizing joint Bayesian analysis. J Magn Reson 198: , 49–56. |
[55] | Luo J , Jagadeesan BD , Cross AH , Yablonskiy DA ((2012) ) Gradient echo plural contrast imaging—signal model and derived contrasts: T2*, T1, phase, SWI, T1f, FST2* and T2*-SWI. Neuroimage 60: , 1073–1082. |
[56] | Yablonskiy DA , Sukstanskii AL , Luo J , Wang X ((2013) ) Voxel spreadfunction method for correction of magnetic field inhomogeneityeffects in quantitative gradient-echo-based MRI. Magn ResonMed 70: , 1283–1292. |
[57] | Wen J , Zeng F , Yablonskiy D , Sukstansky A , Liu Y , Cai B , Zhang Y , Lv W (2020) Fast library-driven approach for implementation of the voxel spread function technique for correcting magnetic field inhomogeneity artifacts. arXiv:2001.09400 [q-bio.QM] |
[58] | Iglesias JE , Augustinack JC , Nguyen K , Player CM , Player A , Wright M , Roy N , Frosch MP , McKee AC , Wald LL ((2015) ) A computational atlas of the hippocampal formation using ex vivo, ultra-high resolution MRI: Application to adaptive segmentation of in vivo MRI. Neuroimage 115: , 117–137. |
[59] | Jenkinson M , Smith S ((2001) ) A global optimisation method for robust affine registration of brain images. Med Image Anal 5: , 143–156. |
[60] | Jenkinson M , Bannister P , Brady M , Smith S ((2002) ) Improved optimization for the robust and accurate linear registration and motion correction of brain images. Neuroimage 17: , 825–841. |
[61] | Zhao Y , Wen J , Cross AH , Yablonskiy DA ((2016) ) On the relationship between cellular and hemodynamic properties of the human brain cortex throughout adult lifespan. Neuroimage 133: , 417–429. |
[62] | Peng GP , Feng Z , He FP , Chen ZQ , Liu XY , Liu P , Luo BY ((2015) ) Correlation of hippocampal volume and cognitive performances in patients with either mild cognitive impairment or Alzheimer’s disease. CNS Neurosci Ther 21: , 15–22. |
[63] | Parker TD , Cash DM , Lane CAS , Lu K , Malone IB , Nicholas JM , James S-N , Keshavan A , Murray-Smith H , Wong A , Buchanan SM , Keuss SE , Sudre CH , Modat M , Thomas DL , Crutch SJ , Richards M , Fox NC , Schott JM ((2019) ) Hippocampal subfield volumes and pre-clinical Alzheimer’s disease in 408 cognitively normal adults born in 1946. PLoS One 14: , e0224030. |
[64] | Carlesimo GA , Piras F , Orfei MD , Iorio M , Caltagirone C , Spalletta G ((2015) ) Atrophy of presubiculum and subiculum is the earliest hippocampal anatomical marker of Alzheimer’s disease. Alzheimers Dement (Amst) 1: , 24–32. |
[65] | Izzo J , Andreassen OA , Westlye LT , van der Meer D ((2020) ) The association between hippocampal subfield volumes in mild cognitive impairment and conversion to Alzheimer’s disease. Brain Res 1728: , 146591. |
[66] | Kerchner G , Hess C , Hammond-Rosenbluth K , Xu D , Rabinovici G , Kelley D , Vigneron D , Nelson S , Miller B ((2010) ) Hippocampal CA1 apical neuropil atrophy in mild Alzheimer disease visualized with 7-T MRI. Neurology 75: , 1381–1387. |
[67] | van der Flier WM , van Straaten EC , Barkhof F , Ferro J , Pantoni L , Basile A-M , Inzitari D , Erkinjuntti T , Wahlund LO , Rostrup E ((2005) ) Medial temporal lobe atrophy and white matter hyperintensities are associated with mild cognitive deficits in non-disabled elderly people: The LADIS study. J Neurol Neurosurg Psychiatry 76: , 1497–1500. |
[68] | Mormino EC , Kluth JT , Madison CM , Rabinovici GD , Baker SL , Miller BL , Koeppe RA , Mathis CA , Weiner MW , Jagust WJ , Alzheimer’s Disease Neuroimaging Initiative ((2008) ) Episodic memory loss is related to hippocampal-mediated β-amyloid deposition in elderly subjects. Brain 132: , 1310–1323. |
[69] | O’Shea A , Cohen R , Porges EC , Nissim NR , Woods AJ ((2016) ) Cognitive aging and the hippocampus in older adults. Front Aging Neurosci 8: , 298. |
[70] | Wright SP , O’Brien RG ((1988) ) Power analysis in an enhanced GLM procedure: What it might look like. Thirteenth Annual SAS Users Group International Conference SAS Institute Inc., Cary, NC, pp. 1097–1102. |
[71] | Braak H , Thal DR , Ghebremedhin E , Del Tredici K ((2011) ) Stages of the pathologic process in Alzheimer disease: Age categories from 1 to 100 years. J Neuropathol Exp Neurol 70: , 960–969. |
[72] | Marquez F , Yassa MA ((2019) ) Neuroimaging biomarkers for Alzheimer’s disease. Mol Neurodegener 14: , 21. |
[73] | Raz N , Lindenberger U , Rodrigue KM , Kennedy KM , Head D , Williamson A , Dahle C , Gerstorf D , Acker JD ((2005) ) Regional brain changes in aging healthy adults: General trends, individual differences and modifiers. Cereb Cortex 15: , 1676–1689. |
[74] | Rosen AC , Prull MW , Gabrieli JD , Stoub T , O’Hara R , Friedman L , Yesavage JA , deToledo-Morrell L ((2003) ) Differential associations between entorhinal and hippocampal volumes and memory performance in older adults. Behav Neurosci 117: , 1150–1160. |
[75] | Vogt NM , Hunt JF , Adluru N , Dean DC , Johnson SC , Asthana S , Yu J-PJ , Alexander AL , Bendlin BB ((2020) ) Cortical microstructural alterations in mild cognitive impairment and Alzheimer’s disease dementia. Cereb Cortex 30: , 2948–2960. |
[76] | Ayton S , Fazlollahi A , Bourgeat P , Raniga P , Ng A , Lim YY , Diouf I , Farquharson S , Fripp J , Ames D ((2017) ) Cerebral quantitative susceptibility mapping predicts amyloid-β-related cognitive decline. Brain 140: , 2112–2119. |
[77] | Schmierer K , McDowell A , Petrova N , Carassiti D , Thomas DL , Miquel ME ((2018) ) Quantifying multiple sclerosis pathology in post mortem spinal cord using MRI. Neuroimage 182: , 251–258. |
[78] | Bittner DM , Heinze H-J , Kaufmann J ((2013) ) Association of 1H-MR spectroscopy and cerebrospinal fluid biomarkers in Alzheimer’s disease: Diverging behavior at three different brain regions. J Alzheimers Dis 36: , 155–163. |
[79] | Zhao Y , Raichle ME , Wen J , Benzinger TL , Fagan AM , Hassenstab J , Vlassenko AG , Luo J , Cairns NJ , Christensen JJ ((2017) ) In vivo detection of microstructural correlates of brain pathology in preclinical and early Alzheimer disease with magnetic resonance imaging. Neuroimage 148: , 296–304. |
[80] | Guillozet AL , Weintraub S , Mash DC , Mesulam MM ((2003) ) Neurofibrillary tangles, amyloid, and memory in aging and mild cognitive impairment. Arch Neurol 60: , 729–736. |
[81] | Aschenbrenner AJ , Gordon BA , Benzinger TLS , Morris JC , Hassenstab JJ ((2018) ) Influence of tau PET, amyloid PET, and hippocampal volume on cognition in Alzheimer disease. Neurology 91: , e859–e866. |
[82] | Chawalparit O , Wontaneeporn N , Muangpaisan W , Thientunyakit T , Charnchaowanish P ((2019) ) MRI hippocampal subfield volume analysis: Comparison between Alzheimer’s disease, mild cognitive impairment, and normal aging subjects in an amyloid PET project. J Alzheimers Dis Parkinsonism 9: , 2161–0460.1000459. |
[83] | Zhao W , Wang X , Yin C , He M , Li S , Han Y ((2019) ) Trajectories of the hippocampal subfields atrophy in the Alzheimer’s disease: A structural imaging study. Front Neuroinform 13: , 13. |
[84] | Apostolova LG , Green AE , Babakchanian S , Hwang KS , Chou Y-Y , Toga AW , Thompson PM ((2012) ) Hippocampal atrophy and ventricular enlargement in normal aging, mild cognitive impairment and Alzheimer’s disease. Alzheimer Dis Assoc Disord 26: , 17. |
[85] | Blanken AE , Hurtz S , Zarow C , Biado K , Honarpisheh H , Somme J , Brook J , Tung S , Kraft E , Lo D ((2017) ) Associations between hippocampal morphometry and neuropathologic markers of Alzheimer’s disease using 7 T MRI. Neuroimage Clin 15: , 56–61. |
[86] | Akram A , Christoffel D , Rocher AB , Bouras C , Kövari E , Perl DP , Morrison JH , Herrmann FR , Haroutunian V , Giannakopoulos P ((2008) ) Stereologic estimates of total spinophilin-immunoreactive spine number in area 9 and the CA1 field: Relationship with the progression of Alzheimer’s disease. Neurobiol Aging 29: , 1296–1307. |
[87] | Scheff S , Price D , Schmitt F , DeKosky S , Mufson E ((2007) ) Synaptic alterations in CA1 in mild Alzheimer disease and mild cognitive impairment. Neurology 68: , 1501–1508. |
[88] | Helboe L , Egebjerg J , Barkholt P , Volbracht C ((2017) ) Early depletion of CA1 neurons and late neurodegeneration in a mouse tauopathy model. Brain Res 1665: , 22–35. |
[89] | Grober E , Hall C , Sanders AE , Lipton RB ((2008) ) Free and cued selective reminding distinguishes Alzheimer’s disease from vascular dementia. J Am Geriatr Soc 56: , 944. |
[90] | Grober E , Sanders AE , Hall C , Lipton RB ((2010) ) Free and cued selective reminding identifies very mild dementia in primary care. Alzheimer Dis Assoc Disord 24: , 284. |
[91] | Grober E , Veroff AE , Lipton RB ((2018) ) Temporal unfolding of declining episodic memory on the Free and Cued Selective Reminding Test in the predementia phase of Alzheimer’s disease: Implications for clinical trials. Alzheimers Dement (Amst) 10: , 161–171. |
[92] | Gorbach T , Pudas S , Lundquist A , Orädd G , Josefsson M , Salami A , de Luna X , Nyberg L ((2017) ) Longitudinal association between hippocampus atrophy and episodic-memory decline. Neurobiol Aging 51: , 167–176. |
[93] | Hett K , Ta V-T , Catheline G , Tourdias T , Manjón JV , Coupé P , Weiner MW , Aisen P , Petersen R , Jack CR , et al. ((2019) ) Multimodal hippocampal subfield grading for Alzheimer’s disease classification. Sci Rep 9: , 13845. |
[94] | Torop M , Kothapalli S , Sun Y , Liu J , Kahali S , Yablonskiy DA , Kamilov US ((2020) ) Deep learning using a biophysical model for robust and accelerated reconstruction of quantitative, artifact-free and denoised R2* images. Magn Reson Med 84: , 2932–2942. |


