
Blood CDKN2A Gene Expression in Aging and Neurodegenerative Diseases
Abstract
Background:
Cyclin-dependent kinase inhibitor 2A (CDKN2A) is an important gene in cellular senescence and aging.
Objective:
This study assessed the utility of blood CDKN2A mRNA expression levels and methylation status as a potential biomarker for aging and the pathogenesis of Alzheimer’s disease (AD).
Methods:
The correlation between CDKN2A mRNA expression levels and age was examined in 45 healthy subjects, after which mRNA expression levels were compared among 46 AD patients, 20 mild cognitive impairment due to AD patients, 21 Parkinson’s disease patients, 21 dementia with Lewy bodies patients, and 55 older healthy controls. The methylation rates of the second exon of the CDKN2A gene, known to influence its expression levels, was also examined.
Results:
A significant correlation between CDKN2A mRNA expression levels and age was found (Spearman’s rank correlation coefficient: r = 0.407, p = 0.005). CDKN2A mRNA expression levels in blood were significantly decreased in AD patients, although those of healthy controls were significantly increased with age. Further, only in AD patients were CDKN2A mRNA expression levels significantly and positively correlated with methylation rates.
Conclusion:
Although further research with a larger sample size is needed to elucidate the relationships between CDKN2A gene expression in blood and the development of other neurodegenerative diseases, CDKN2A mRNA expression in blood may be a biomarker for differentiating AD from normal aging and other neurodegenerative diseases.
INTRODUCTION
Alzheimer’s disease (AD) is the most common cause of dementia; AD is a chronic neurodegenerative disease that results in progressive deterioration in cognitive function and behavior and is pathologically characterized by senile plaques and neurofibrillary tangles [1]. Senile plaques are extracellular accumulations of amyloid-β (Aβ), which is encoded by amyloid precursor protein (APP) on chromosome 21q21 [2]. Neurofibrillary tangles are areas of abnormal intracellular storage of hyperphosphorylated protein tau, which is encoded by microtubule-associated protein tau (MAPT) on chromosome 17q21 [3]. Genome-wide association studies (GWASs) have shown that the e4 allele of apolipoprotein E (APOE) is the strongest genetic risk for the development of late-onset AD, and dozens of other genes related to immunity, lipid metabolism, tau binding proteins, and the AβPP metabolism pathway are also implicated [4]. However, the molecular basis of AD pathogenesis has not yet been completely clarified.
A large body of literature has recently suggested the presence of an association between cellular senescence and age and several neurogenerative diseases, including AD and Parkinson’s disease (PD) [5]. An emerging therapeutic target for age-related diseases is cellular senescence, a biological process that imposes perdurable proliferative arrest on damaged cells in response to various stressors [6]. The increased number of senescent cells in a variety of neurodegenerative diseases reflects the contribution of cellular senescence to the pathophysiology of such diseases [7]. Cyclin-dependent kinase inhibitor 2A (CDKN2A), a major tumor suppressor gene, is located at chromosome 9p21 in a region that has frequent loss of heterozygosity in several types of tumors [8] and encodes the CDKN2A protein. This protein typically blocks abnormal cell proliferation and growth by inhibiting the ability of cyclin-dependent kinases (CDKs) 4 and 6 to accelerate cell cycle G1 phase progression [9]. Because CDKN2A is considered to be an important gene in cellular senescence and aging [10], it is utilized as a molecular marker of cellular senescence [11]. The expression of CDKN2A protein has been shown to be elevated in cultured senescent cells [12, 13], as well as in the brains of patients with AD [14]. CDKN2A gene expression has also been reported to be elevated with age in the brain and lymphocytes of an AD mouse model [15].
Epigenetic changes are potentially heritable changes in gene expression that do not alter the DNA sequence. One epigenetic process that regulates gene expression is DNA methylation [16], which is associated with the pathogenesis of a number of brain diseases [17]. In previous studies, we reported that the DNA methylation and expression of several candidate genes were potential biological markers of neurodegenerative diseases [18–20]. Therefore, we hypothesized that CDKN2A mRNA expression levels in blood and CDKN2A methylation status could be associated with the pathogenesis of AD and may be potential biomarkers. However, notably, the blood methylation and expression levels of CDKN2A have not been examined in patients with AD and other neurodegenerative diseases.
Thus, in this study, the correlation between CDKN2A mRNA expression levels and age was examined in healthy subjects. Then, mRNA expression levels were compared among patients with AD, patients with mild cognitive impairment (MCI) due to AD, patients with PD, patients with dementia with Lewy bodies (DLB), and older healthy controls (HCs). The methylation status of the second exon of the CDKN2A gene, known to influence its expression levels, was also examined.
MATERIALS AND METHODS
Participants
First, to examine the correlation between CDKN2A mRNA expression levels and age, 45 healthy subjects aged 20–69 years old (15 males and 30 females, mean age±standard deviation (SD) = 44.5±14.5 years) who had no cognitive impairment, psychiatric signs, or a past history of mental diseases and who were diagnosed as mentally and cognitively healthy by at least two certified psychiatrists based on clinical interviews were enrolled. The demographic data of the healthy subjects are shown in Table 1.
Table 1
Demographic data of healthy volunteers
| Characteristics | Healthy volunteers |
| Age (y) | 44.53±14.5 |
| Sex (male/female) | 15/30 |
| Number of 20- to 29-year-old subjects | 9 |
| Number of 30- to 39-year-old subjects | 9 |
| Number of 40- to 49-year-old subjects | 9 |
| Number of 50- to 59-year-old subjects | 9 |
| Number of 60- to 69-year-old subjects | 9 |
Values are the means±the standard deviations.
Next, to examine the blood levels of CDKN2A mRNA in neurodegenerative diseases, 46 AD patients (15 males and 31 females, mean age± SD = 77.4±4.40 years), 20 MCI due to AD patients (7 males and 13 females, 81.9±4.93 years), 21 PD patients (7 males and 14 females, 76.0±4.28 years), and 21 DLB patients (7 males and 14 females, 77.8±7.50 years) who were outpatients at Ehime University Hospital and Zaidan Niihama Hospital, Ehime, Japan, were enrolled. All patients met the diagnostic criteria for AD, PD, and DLB according to the National Institute on Aging/Alzheimer’s Association [21], UK Parkinson’s Disease Society Brain Bank [21], and 2017 DLB clinical diagnostic criteria [21], respectively. A diagnosis of amnestic MCI was made for patients who satisfied the following criteria: 1) normal general cognitive function with a Mini-Mental State Examination (MMSE) score≥23; 2) on the delayed recall test of the Wechsler Memory Scale-Revised, the cutoff scores for any cognitive impairment were selected according to the education status as follows:≤8 points for 16 years of education,≤4 points for 8–15 years, and≤2 points for 0–7 years; 3) neuropsychiatric examination: an absence of dementia or depression as determined by geriatric neuropsychiatrists according to the Diagnostic and Statistical Manual of Mental Disorders, 3rd edition, revised (DSM-III R) [22] criteria; 4) no ADL impairment; and 5) hippocampal and parietal lobe atrophy without apparent cerebrovascular disease assessed by brain MRI. AD patients were evaluated with the MMSE and the Alzheimer’s Disease Assessment Scale (ADAS) to assess their cognitive function [21, 23], the Montgomery-Asberg Depression Rating Scale (MADRS) to assess their depression symptoms [24], the Clinical Dementia Rating (CDR) as measured by family caregivers [25], and the Neuropsychiatric Inventory (NPI) to assess their psychological symptoms [26]. The HCs were 55 elderly participants (18 males and 37 females, 77.1±5.61 years) without cognitive impairment, psychiatric signs, or a history of mental disorders who were diagnosed as mentally and cognitively healthy by at least two certified psychiatrists based on clinical interviews.
All participants were unrelated and of Japanese origin and provided written, informed consent using forms approved by the institutional ethics committees of Ehime University Hospital (Approval Number: 31-K8 and R2-5). This study was conducted in accordance with the Declaration of Helsinki. The datasets generated during and/or analyzed during the current study are available from the corresponding author on reasonable request.
Blood sample collection and the processing of complementary DNA (cDNA) and genomic DNA (gDNA)
Total RNA was obtained from whole peripheral blood samples using PaxGene Blood RNA Systems tubes (BD, Tokyo, Japan). The RNA concentration and purity were measured with a NanoDrop-1000 (Thermo Fisher Scientific, Yokohama, Japan), and acceptable 260/280 ratios were within 1.8–2.0. For each 40-μl reaction, 1.0μg RNA was applied as a template to synthesize cDNAs with the High-Capacity cDNA Reverse Transcription Kit (Applied Biosystems, Foster City, CA, USA). The gDNA samples were obtained from peripheral blood samples using EDTA tubes and extracted using the QIAamp DNA Blood Mini Kit (Qiagen, Tokyo, Japan).
PCR procedure
mRNA expression was analyzed by real-time quantitative PCR using a StepOnePlus Real-Time PCR System (Applied Biosystems). The specific Taq-Man probes were Hs00923894 m1 for CDKN2A, Hs00153451_m1 for E2F1, Hs01078066_m1 for RB1 and Hs99999905 m1 for GAPDH (Applied Biosystems). GAPDH was used for the normalization of quantitative RT-PCR and was used as the reference gene in the study [27]. The final volume of each reaction was 20μl and contained TaqMan Universal Master Mix (Applied Biosystems). Expression levels were examined in duplicate. The ΔΔCt method and StepOne software (Applied Biosystems) were used to determine relative expression levels.
Bisulfite conversion and pyrosequencing
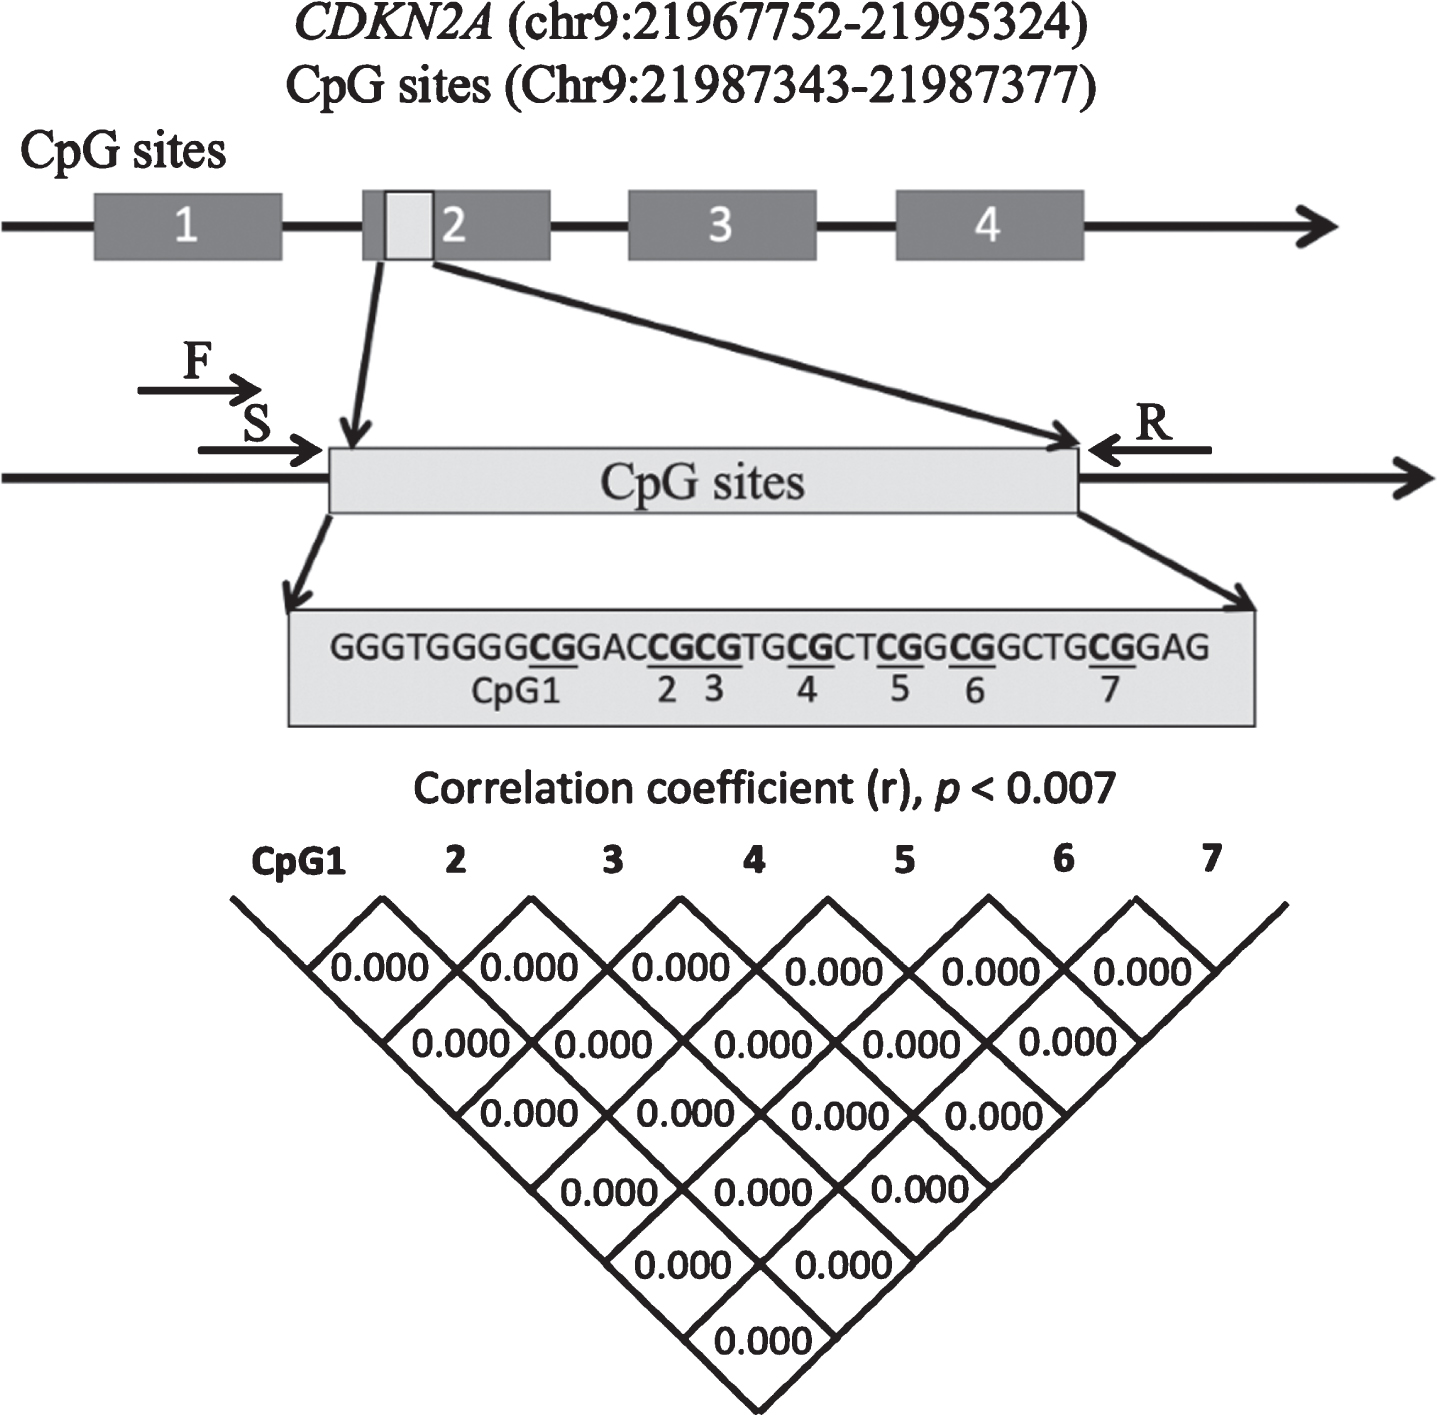
The primers were consistent with previous studies showing a correlation between methylation status and CDKN2A expression [28]. The sequence was localized in the second exon in the CDKN2A gene and contained seven CpG sites (Fig. 1). The EpiTect Plus DNA Bisulfite Kit (Qiagen, Valencia, CA, USA) was used to convert the gDNA (1000 ng/sample) with bisulfate. Converted gDNA was then used as the template for PCR amplification with a forward primer (5-AGGGGTTGGTTGGTTATTAG-3) and a reverse primer (5-[Biotin]-CTACCTACTCTCCCCCTCTC-3). The final volume of each PCR was 25.0μl, and each reaction contained 2.0μl gDNAs, 0.5μM forward and reverse primers, 0.2 U AmpliTaq gold (Applied Biosystems), 10×PCR buffer with 15 mM MgCl2, and 2 mM dNTPs. Cycling settings were as follows: denaturation for 10 min at 95°C; followed by 45 cycles of 95°C for 30 s, 58°C for 30 s, and 72°C for 1 min; and a final extension of 5 min at 72°C. The PCR products were sequenced with PyroMark Q24 Advanced (Qiagen) and the sequencing primer 5-GGTTGGTTATTAGAGGG-3. Methylation rates at each CpG site were quantified in duplicate using PyroMark Q24 Advanced Software (Qiagen).
Fig. 1
Schematic diagram showing the location of the CDKN2A exon 2 region that was analyzed. Correlations between pairs of the 7 CpGs were analyzed with Pearson’s correlation coefficient or Spearman’s rank correlation coefficient. Significance was defined at p = 0.007 after Bonferroni’s correction. CDKN2A, cyclin-dependent kinase inhibitor 2A; F, forward primer; R, reverse primer; S, sequence primer.
Statistical analysis
Statistical analyses were performed with SPSS 22.0 software (IBM Japan, Tokyo, Japan), except for the post hoc Steel’s test, which was conducted with EZR version 1.26 [29]. Normality was tested by the Shapiro-Wilk test. Sex differences were analyzed using Pearson’s chi-squared test. Comparisons of CDKN2A mRNA expression between patients with AD, MCI, PD, and DLB and HCs were performed by the Kruskal-Wallis test with the post hoc Steel’s test. Comparisons of CDKN2A mRNA expression by sex were conducted with the Mann-Whitney U test. To validate the utility of the CDKN2A mRNA expression level for the diagnosis of AD, receiver operating characteristic curve analysis was used. The optimal cutoff value was set using Youden’s index. Comparisons of the methylation rate at each CpG site between AD patients and control subjects were conducted with the Mann-Whitney U test. Correlations of CDKN2A mRNA expression with age, the age of onset, the duration of illness, MMSE score, NPI score, ADAS score, MADRS score, methylation rates at each CpG site, and average total methylation of all sites were conducted using Spearman’s rank correlation coefficient. Correlations between the methylation rate at each of the 7 CpG sites were also examined using Spearman’s rank correlation coefficient. Significance was defined at the 95% level (p = 0.05), and it was set at p = 0.007 after Bonferroni corrections for comparisons of each methylation rate and correlations between each methylation rate at 7 CpG sites.
RESULTS
Correlation between CDKN2A mRNA expression levels and age in healthy volunteers
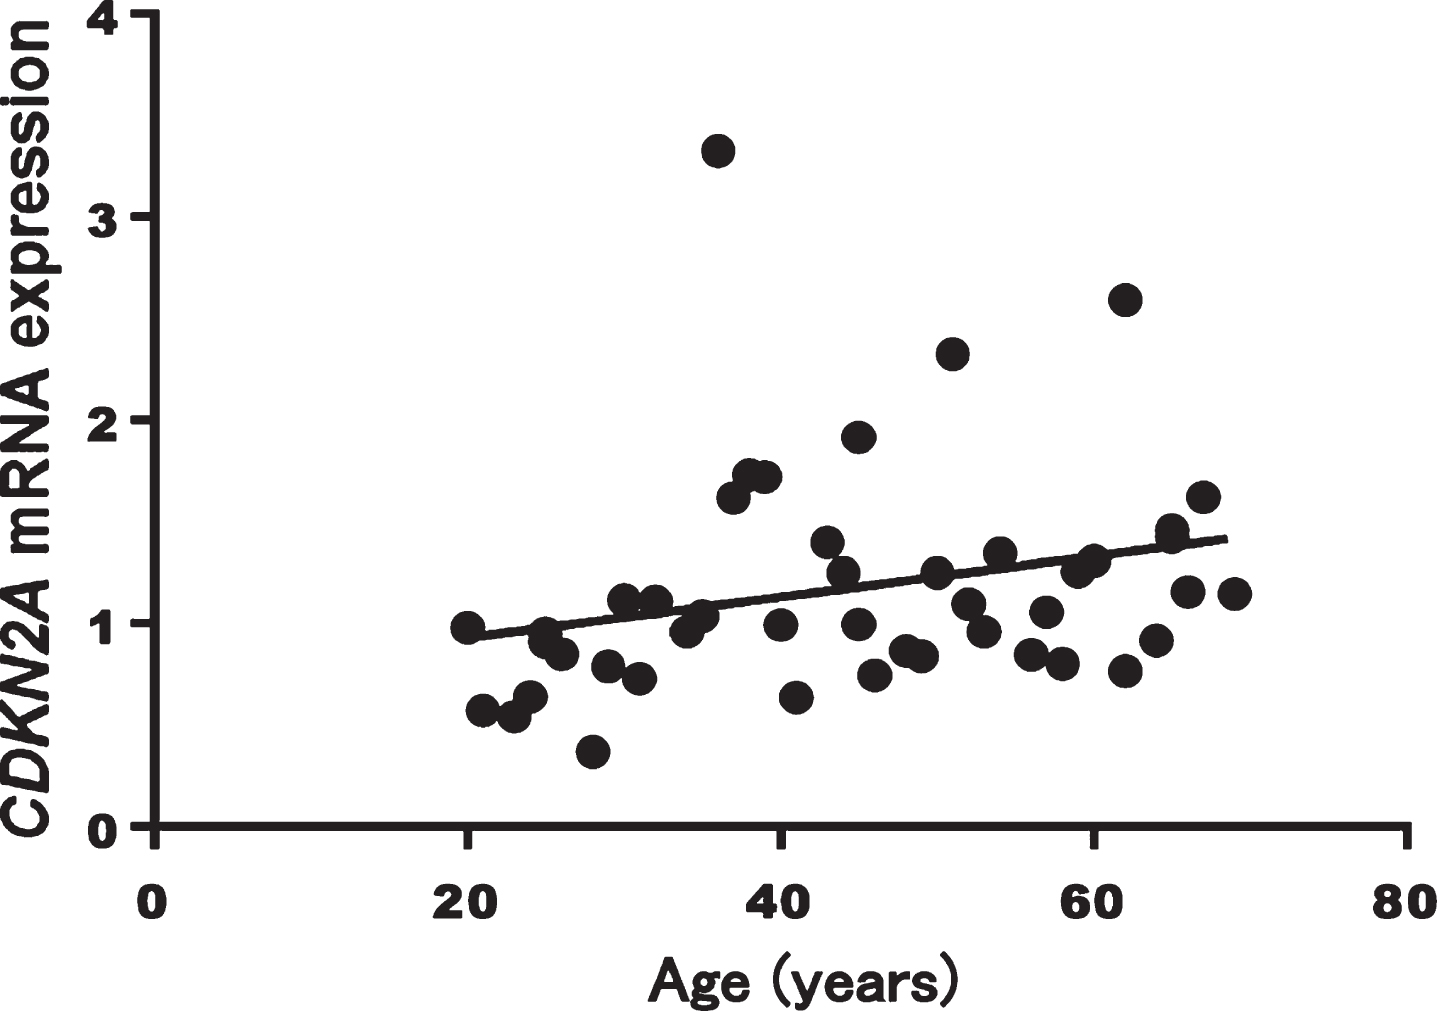
A significant correlation between CDKN2A mRNA expression levels and age was found (Spearman’s rank correlation coefficient: r = 0.407, p = 0.005, Fig. 2). CDKN2A mRNA expression levels did not differ by sex (p = 0.268).
Fig. 2
Correlation between CDKN2A mRNA expression and age in healthy volunteers (p = 0.005, r = 0.407)
Comparison of CDKN2A mRNA expression levels among neurodegenerative diseases
CDKN2A mRNA expression was examined in the blood of patients with AD, MCI, PD, and DLB and in HCs. The demographic data and clinical characteristics of the participants are shown in Table 2. There was no difference by sex (Pearson’s chi-squared test: p = 1.00). The MCI group was significantly older than the other groups (MCI versus HCs: 81.9±4.93 versus 77.1±5.61 years, Kruskal-Wallis p = 0.005, Steel’s test: p = 0.005), whereas the other groups showed no significant differences in age (AD versus HCs: 77.4±4.40 versus 77.1±5.61 years, Steel’s test: p = 0.99, DLB versus HCs: 77.8±7.50 versus 77.1±5.61 years, Steel’s test: p = 0.92, PD versus HCs: 76.0±4.30 versus 177.1±5.61 years, Steel’s test: p = 0.92).
Table 2
Demographic and clinical data of Alzheimer’s disease patients
| Characteristic | HCs | AD | MCI | PD | DLB | p |
| N | 55 | 46 | 20 | 21 | 21 | |
| Age (y) | 77.0±5.6 | 77.4±4.40 | 81.9±4.93* | 76.0±4.3 | 77.8±7.5 | p = 0.005a |
| Sex (male/female) | 18/37 | 15/31 | 7/13 | 7/14 | 7/14 | p = 1.0b |
| MMSE total score | 18.3±5.45 | 25.4±1.88 | ||||
| Duration (y) (n = 39) | 4.2±4.07 | |||||
| NPI-10 total score (n = 44) | 13.8±16.30 | |||||
| MADRS total score (n = 33) | 5.9±4.86 | |||||
| ADAS total score (n = 34) | 19.5±9.0 | |||||
| CDR score (0:0.5:1:2:3) (n = 44) | 1:0:23:18:2 |
Values are the means±the standard deviations. HCs, healthy control subjects; AD, Alzheimer’s disease; MCI, mild cognitive impairment due to AD; PD, Parkinson’s disease; DLB, dementia with Lewy bodies; MMSE, Mini-Mental State Examination; ADAS, Alzheimer’s Disease Assessment Scale; NPI, Neuropsychiatric Inventory; MADRS, Montgomery-Asberg Depression Rating Scale; CDR, Clinical Dementia Rating. *Steel’s test, p = 0.005 (HCs versus MCI). a Kruskal-Wallis p = 0.005. b Pearson’s chi-squared test for independence.
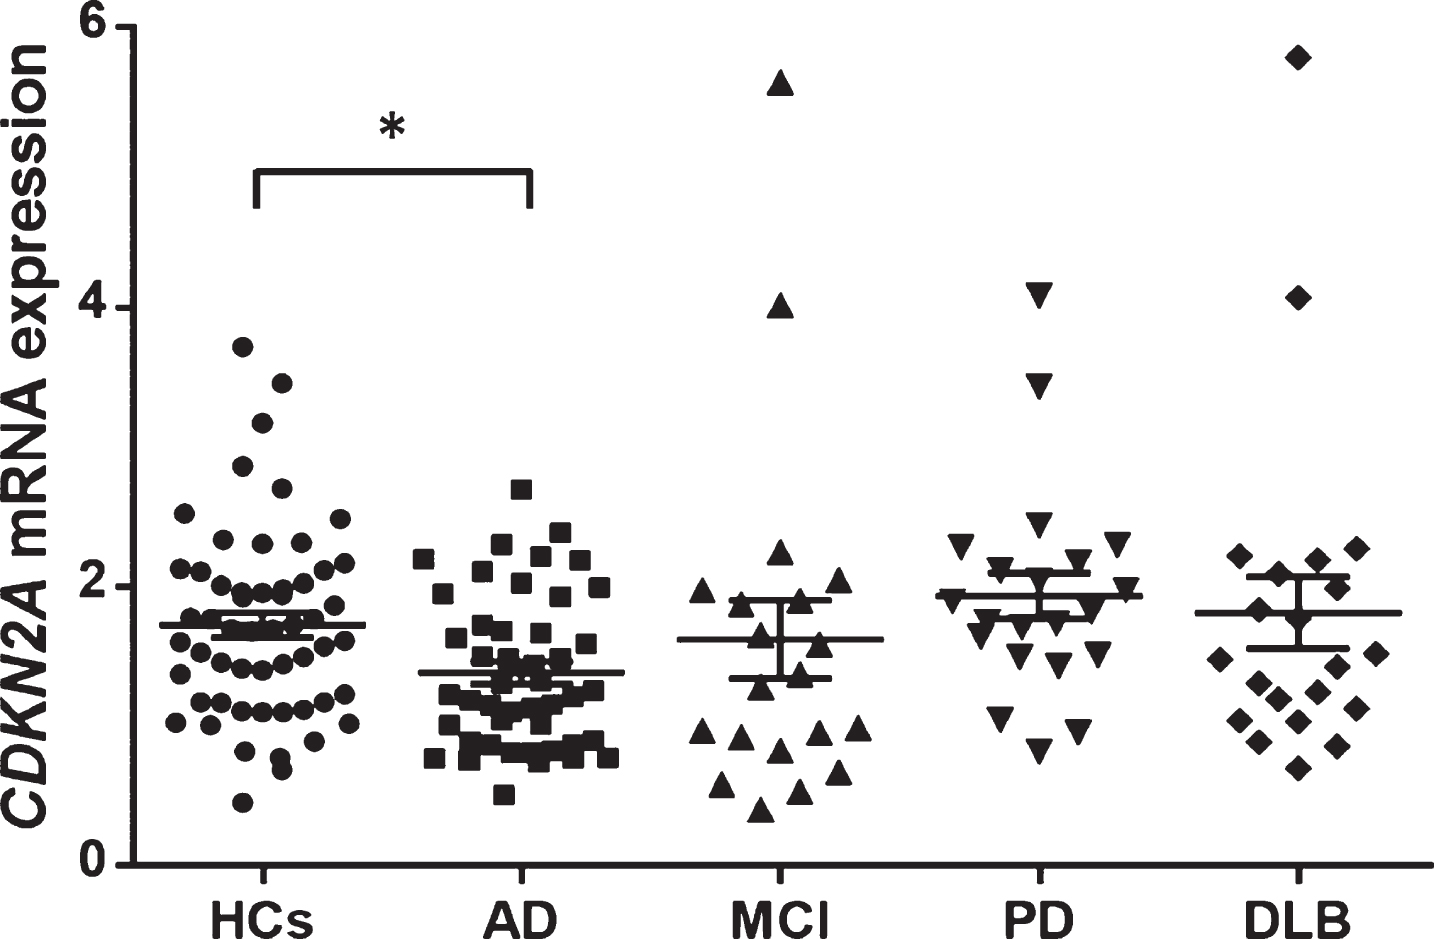
The CDKN2A mRNA expression level was significantly lower in patients with AD than in HCs (AD versus HCs: 1.38±0.55 versus 1.73±0.67, Kruskal-Wallis test: p = 0.014, Steel’s test: p = 0.034, Fig. 3). No significant differences in CDKN2A mRNA expression level were observed between MCI, PD, or DLB patients and HCs (MCI versus HCs: 1.62±1.25 versus 1.73±0.67, Steel’s test: p = 0.31, DLB versus HCs: 1.81±1.17 versus 1.73±0.67, Steel’s test: p = 0.97, PD versus HCs: 1.94±0.75 versus 1.73±0.67, Steel’s test: p = 0.69). CDKN2A mRNA expression levels were not correlated with age in any patients or control subjects (Spearman’s rank correlation coefficient: r = –0.163, p = 0.833).
Fig. 3
CDKN2A mRNA expression levels in each group. The mean expression level was significantly lower in AD patients (average±SD = 1.38±0.55) than in HCs (average±SD = 1.73±0.67) (Kruskal-Wallis test: p = 0.014, Steel’s test p = 0.034). The horizontal line and error bars represent the mean±the standard error. HCs, healthy control subjects; AD, Alzheimer’s disease; MCI, mild cognitive impairment due to AD; PD, Parkinson’s disease; DLB, dementia with Lewy bodies; SD, standard deviation.
Correlations between CDKN2A mRNA expression and clinical parameters
The correlations between CDKN2A mRNA expression and clinical parameters were examined. The MMSE score was not correlated with CDKN2A mRNA expression in AD and MCI patients (Spearman’s rank correlation coefficient: r = –0.003, p = 0.98). Other clinical parameters in patients with AD were not correlated with the CDKN2A mRNA expression level (Spearman’s rank correlation coefficients: duration of illness r = 0.24, p = 0.14; NPI score r = –0.07, p = 0.67; MADRS score r = –0.20, p = 0.26; ADAS score r = 0.46, p = 0.13; CDR score r = 0.09, p = 0.56).
Comparison of the methylation status of CDKN2A between patients with AD and HCs
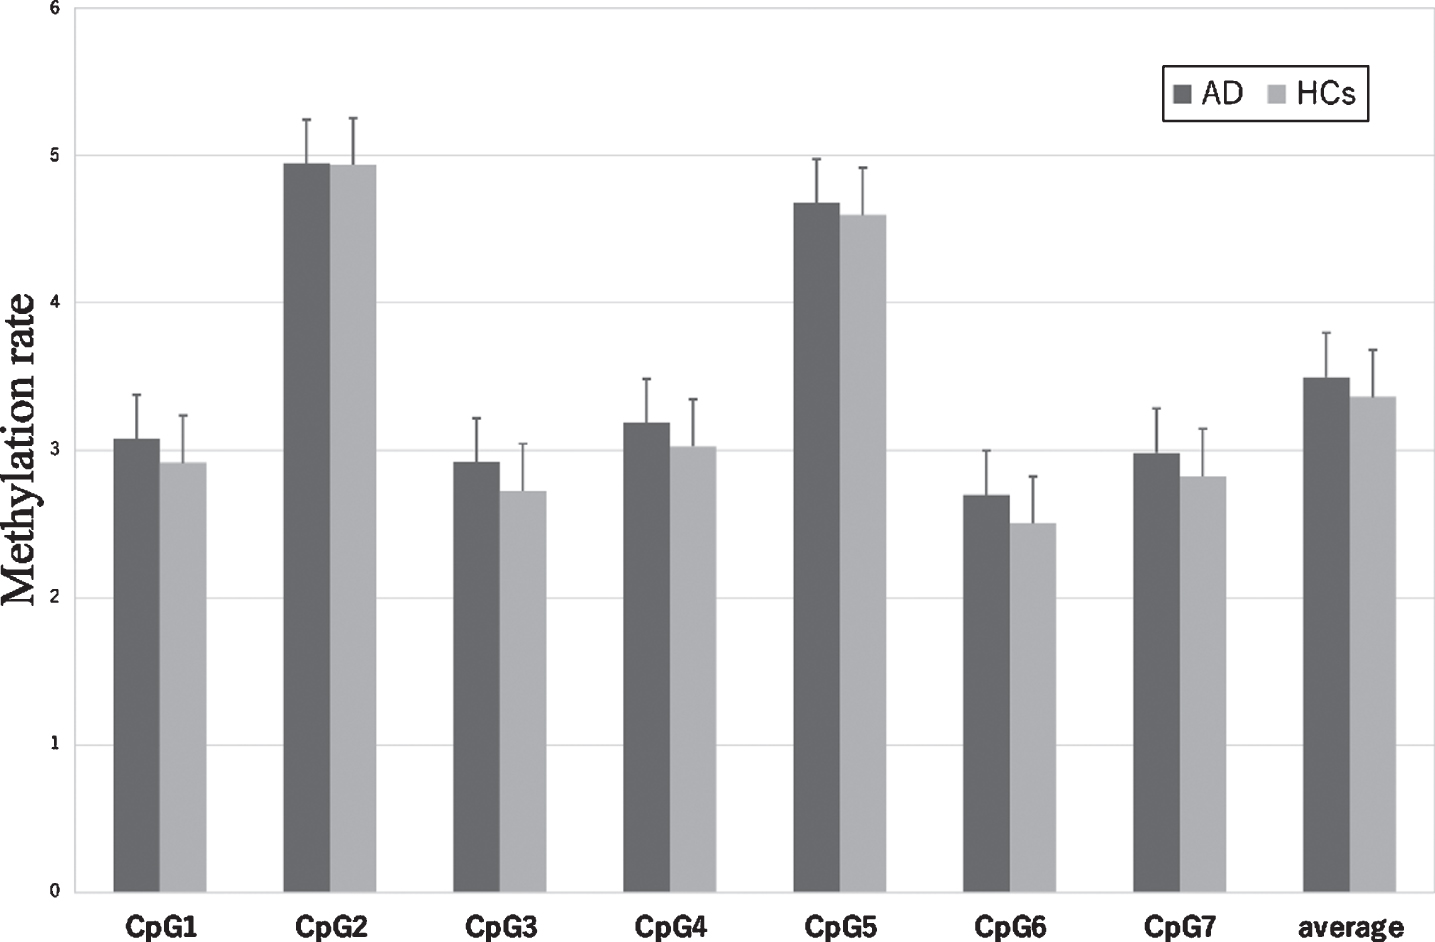
The sequence and position of the 7 CpG sites in CDKN2A exon 2 are shown in Fig. 1. CDKN2A methylation rates at each CpG site in patients with AD and HCs are shown in Fig. 4. Methylation rates at almost all CpG sites were correlated with each other in the AD group and HCs (Fig. 1). The methylation rates of the AD group were not different from those of the control group at CpG1 (AD versus HCs: mean±SD = 3.08±1.35 versus 2.91±1.12, p = 0.77), CpG2 (4.94±2.76 versus 4.93±2.45, p = 0.85), CpG3 (2.92±1.46 versus 2.72±1.23, p = 0.73), CpG4 (3.19±1.67 versus 3.03±1.35, p = 0.87), CpG5 (4.67±2.35 versus 4.59±2.18, p = 0.87), CpG6 (2.70±1.39 versus 2.50±1.17, p = 0.63), or CpG7 (2.98±1.47 versus 2.82±1.18, p = 0.84), nor was the average CpG methylation rate different between the two groups (3.50±1.72 versus 3.36±1.47, p = 0.83).
Fig. 4
CDKN2A methylation rate in AD and HCs at each CpG site and average total methylation of all sites. The values are the mean methylation rates±the SEM. AD, Alzheimer’s disease; HCs, healthy control subjects; SEM, standard error of the man.
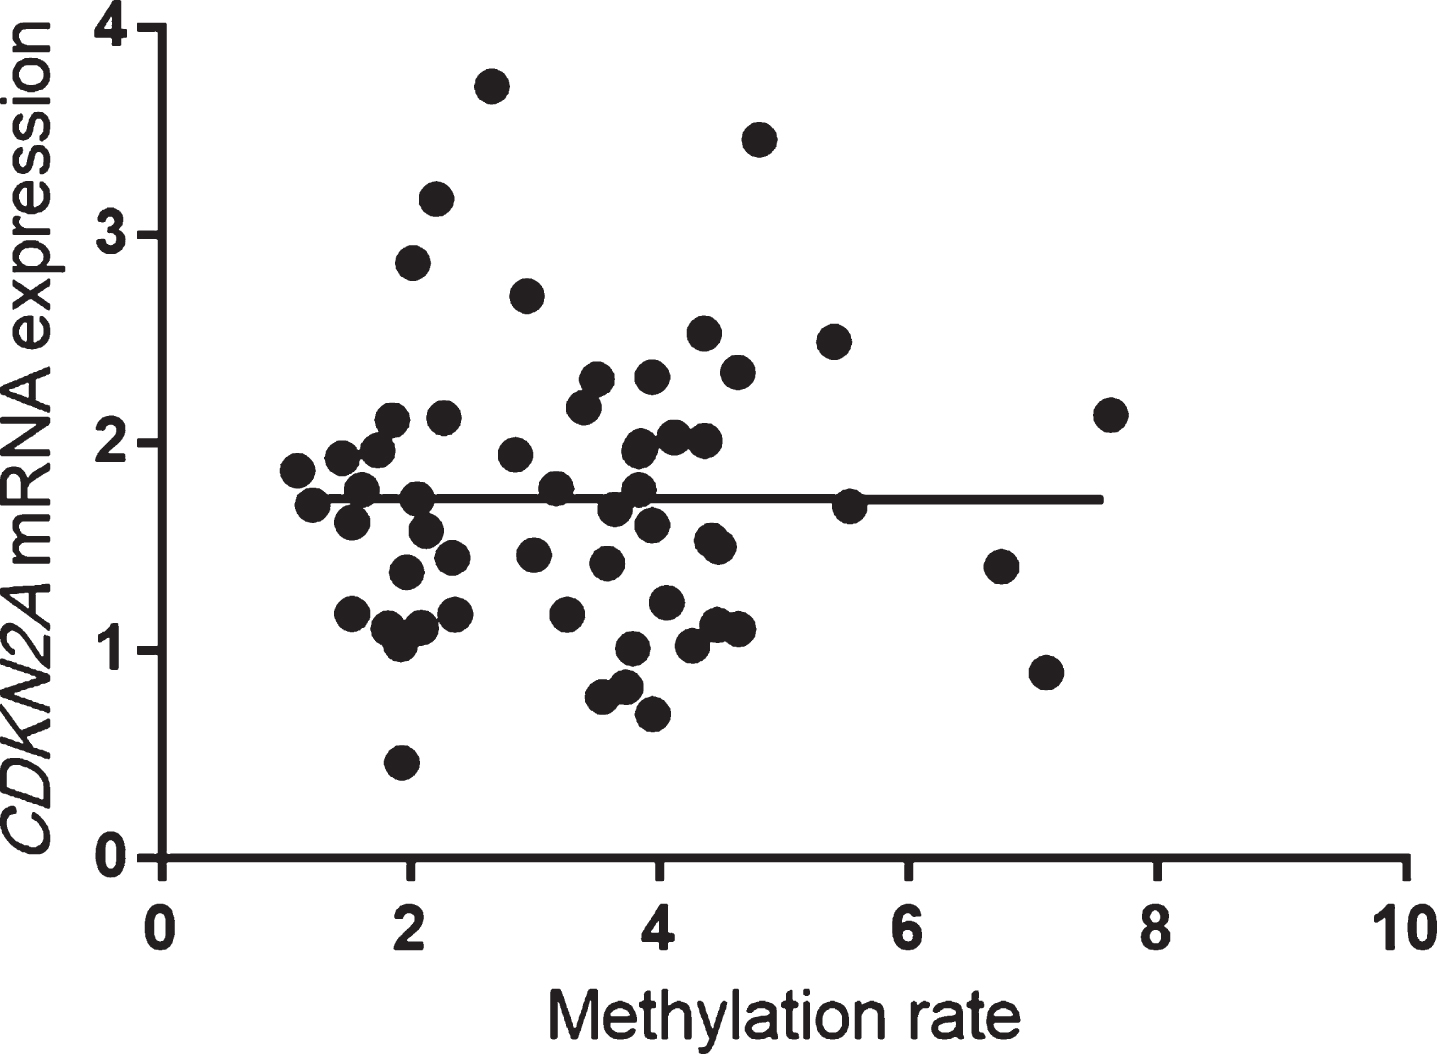
In patients with AD, CDKN2A mRNA expression was significantly correlated with methylation rates at CpG1 (Spearman’s rank correlation coefficient: r = 0.41, p = 0.005), CpG2 (r = 0.40, p = 0.005), CpG3 (r = 0.40, p = 0.005), CpG4 (r = 0.41, p = 0.005), CpG6 (r = 0.42, p = 0.004), and CpG7 (r = 0.41, p = 0.005) and with the average total methylation of all sites (r = 0.42, p = 0.003; Fig. 5). On the other hand, methylation rates at all CpG sites and the average total methylation of all sites were not correlated with CDKN2A mRNA expression in HCs (Spearman’s rank correlation coefficient: r = 0.02, p = 0.87; Fig. 6).
Fig. 5
Mean methylation rates of all sites were significantly correlated with CDKN2A mRNA expression in patients with AD (Spearman’s rank correlation coefficient: r = 0.42, p = 0.003). AD, Alzheimer’s disease.
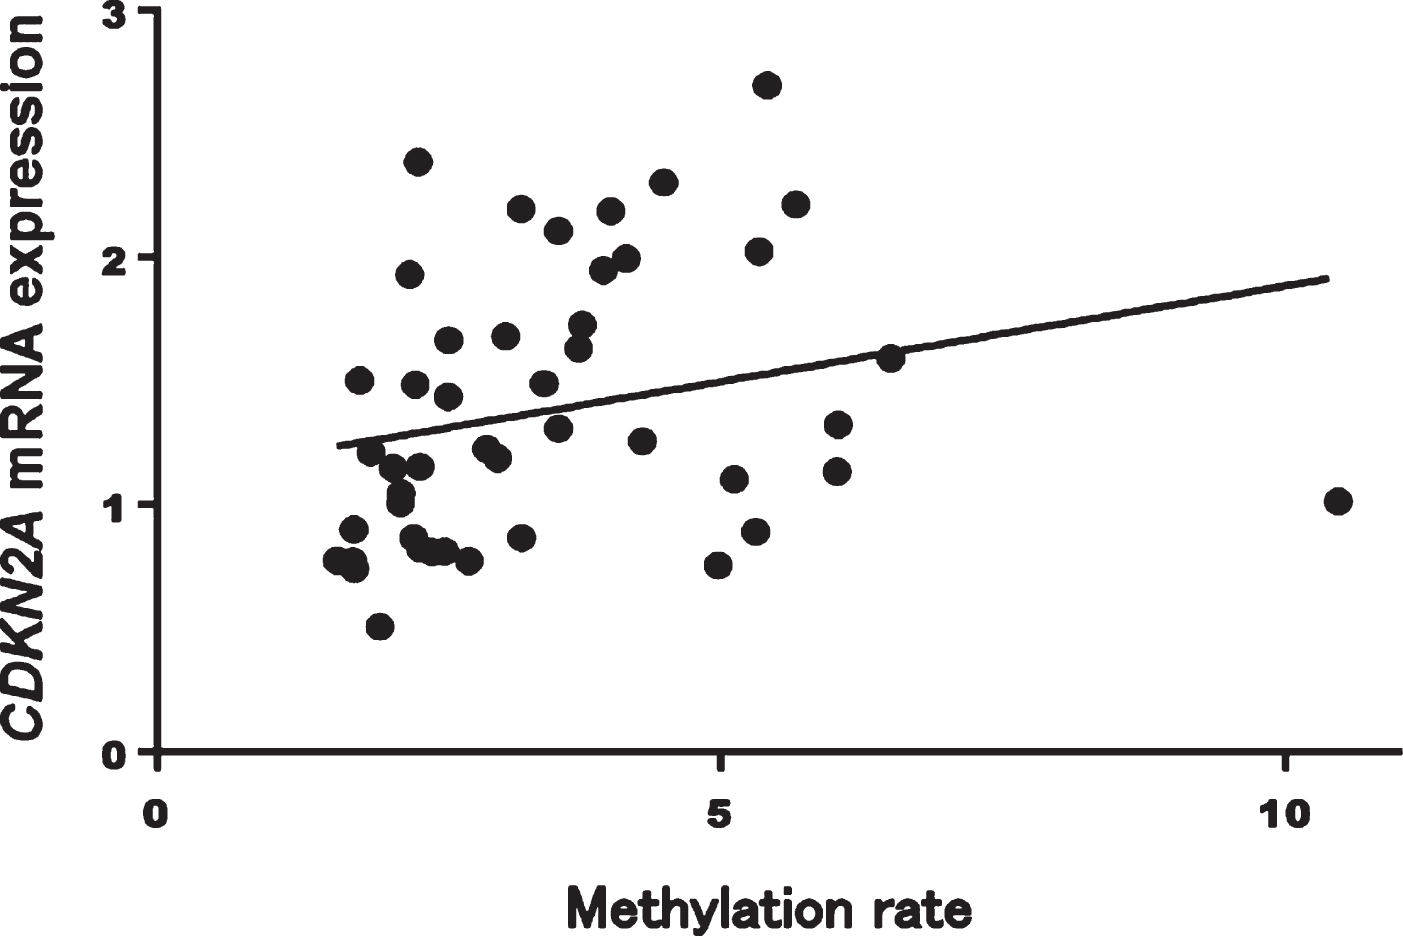
Fig. 6
Mean methylation rates of all sites were not significantly correlated with CDKN2A mRNA expression in HCs (Spearman’s rank correlation coefficient: r = 0.02, p = 0.87). HCs, healthy control subjects.
Comparisons of E2F1 and RB1 mRNA expression levels between patients with AD and HCs
Since CDKN2A gene is capable of inducing cell cycle arrest in G1 and G2 phases, and its functions have been connected with E2F1 and RB1 genes, we conducted their gene expression analyses between patients with AD and HCs. No significant differences in either E2F1 or RB1 mRNA expression levels were observed between patients with AD and HCs (E2F1: AD versus HCs: 0.82±0.33 versus 0.85±0.39, Mann-Whitney test: p = 0.98, RB1: AD versus HCs: 0.88±0.15 versus 0.89±0.17, Mann-Whitney test: p = 0.86, Fig. 3). Interestingly, E2F1 mRNA expression level showed significantly positive associations between both CDKN2A mRNA expression level (Spearman’s rank correlation coefficient: r = 0.27, p = 0.006) and RB1 mRNA expression level (Spearman’s rank correlation coefficient: r = 0.24, p = 0.018).
DISCUSSION
There were three major findings in this study.
First, this is the first study showing significantly increased blood CDKN2A mRNA expression levels with age in healthy persons. Because CDKN2A is a well-known senescence marker and senescent cells accumulate in tissues with age, CDKN2A mRNA expression levels in blood may be a new biomarker for human biological aging. Consistently, in some single-cell gene expression datasets from blood cells, the fraction of cells expressing CDKN2A was reported to increase with age [30]. It has also been reported that elderly people showed a significantly higher level of CDKN2A gene expression in endothelial progenitor cells than younger persons. Because our preceding study showed that the expression in blood was correlated with that in the brain in 3xTg AD mice [31], CDKN2A mRNA expression levels in blood may be correlated with those in the brain in humans.
Second, blood CDKN2A mRNA expression levels were significantly decreased in patients with AD and significantly increased with age in healthy controls. Because the risk of cancer among patients with AD and the risk of AD among patients with cancer have been reported to be lower [32–34], the inverse relationship between AD and cancer is speculated [35]. Although there were significant correlations between E2F1 mRNA expression and both CDKN2A and RB1 mRNA expressions, significant changes were observed only in CDKN2A but not in either E2F1 or RB1 mRNA expressions. CDKN2A is well known to be a major tumor suppressor gene; therefore, the decreased CDKN2A gene expression seen in patients with AD could reflect aberrant cellular senescence and oncogenesis in patients with AD. A similar inverse association with cancer was previously reported for PD [36] and other neurodegenerative diseases, including multiple sclerosis and Huntington’s disease [37], but such an association was not found for MCI, PD, or DLB. Claiming that CDKN2A expression changes may be a “biomarker for AD” is difficult in consideration of the subtle changes (approximately 20%) in CDKN2A expression with numerous control subjects and cases overlapping; however, this could be an element of the panel of biomarkers for AD [27].
Third, only in AD patients were CDKN2A mRNA expression levels significantly and positively correlated with methylation rates. The CpG sites were selected according to preceding studies showing correlations between methylation status and CDKN2A expression [28]. Two studies showed positive correlations between the methylation of these sites and immunoexpression or mRNA levels in cancer cells [28, 38], whereas one study showed a positive correlation between CDKN2A expression and methylation in cancer cells [39]. Although hypermethylation in the promoter region is usually related to transcriptional silencing, CDKN2A mRNA expression was significantly and positively correlated with methylation rates only in AD patients. This result may be associated with aberrant epigenetic changes in the CDKN2A gene in AD.
This study had some limitations. Since few studies reported relationships between CDKN2A and neurodegenerative diseases, patients in various stages should be recruited, and the effects of medication should be considered in future studies. Due to the small sample size and limited power, the negative findings should not be interpreted as showing no associations. Our results should be reproduced in a larger cohort.
CONCLUSIONS
The results of the present study demonstrated that CDKN2A mRNA expression in blood was lower in patients with AD, compared with healthy controls, but it was unchanged in patients with other neurodegenerative diseases. Although CDKN2A mRNA levels in blood may be a biomarker for differentiating AD from other neurodegenerative diseases, further research with a larger sample size is needed to elucidate the relationships between CDKN2A gene expression in blood and the development of other neurodegenerative diseases.
ACKNOWLEDGMENTS
The authors would like to thank Ms. Chiemi Onishi for technical assistance. This study was supported by the Japan Agency for Medical Research and Development (JP20dk0207025 and JP20dk0307076). This work was partially supported by a Health and Labor Science Research Grant from the Japanese Ministry of Health, Labor and Welfare and a Grant-in-Aid for Scientific Research from the Japanese Ministry of Education, Culture, Sports, Science and Technology, JSPS KAKENHI Grant Numbers 18H02752, 18K07564, 19K17113, 20K07971, and 20K16628.
Authors’ disclosures available online (https://www.j-alz.com/manuscript-disclosures/21-0483r1).
REFERENCES
[1] | Masters CL , Bateman R , Blennow K , Rowe CC , Sperling RA , Cummings JL ((2015) ) Alzheimer’s disease. Nat Rev Dis Primers 1: , 15056. |
[2] | Goedert M , Wischik CM , Crowther RA , Walker JE , Klug A ((1988) ) Cloning and sequencing of the cDNA encoding a core protein of the paired helical filament of Alzheimer disease: Identification as the microtubule-associated protein tau. Proc Natl Acad Sci U S A 85: , 4051–4055. |
[3] | Hutton M , Lendon CL , Rizzu P , Baker M , Froelich S , Houlden H , Pickering-Brown S , Chakraverty S , Isaacs A , Grover A , Hackett J , Adamson J , Lincoln S , Dickson D , Davies P , Petersen RC , Stevens M , de Graaff E , Wauters E , van Baren J , Hillebrand M , Joosse M , Kwon JM , Nowotny P , Che LK , Norton J , Morris JC , Reed LA , Trojanowski J , Basun H , Lannfelt L , Neystat M , Fahn S , Dark F , Tannenberg T , Dodd PR , Hayward N , Kwok JB , Schofield PR , Andreadis A , Snowden J , Craufurd D , Neary D , Owen F , Oostra BA , Hardy J , Goate A , van Swieten J , Mann D , Lynch T , Heutink P ((1998) ) Association of missense and 5’-splice-site mutations in tau with the inherited dementia FTDP-17. Nature 393: , 702–705. |
[4] | Kunkle BW , Grenier-Boley B , Sims R , Bis JC , Damotte V , Naj AC , Boland A , Vronskaya M , van der Lee SJ , Amlie-Wolf A , et al. ((2019) ) Genetic meta-analysis of diagnosed Alzheimer’s disease identifies new risk loci and implicates Abeta, tau, immunity and lipid processing. Nat Genet 51: , 414–430. |
[5] | Martinez-Cue C , Rueda N ((2020) ) Cellular senescence in neurodegenerative diseases. Front Cell Neurosci 14: , 16. |
[6] | Childs BG , Durik M , Baker DJ , van Deursen JM ((2015) ) Cellular senescence in aging and age-related disease: From mechanisms to therapy. Nat Med 21: , 1424–1435. |
[7] | Baker DJ , Petersen RC ((2018) ) Cellular senescence in brain aging and neurodegenerative diseases: Evidence and perspectives. J Clin Invest 128: , 1208–1216. |
[8] | Cairns P , Mao L , Merlo A , Lee DJ , Schwab D , Eby Y , Tokino K , van der Riet P , Blaugrund JE , Sidransky D ((1994) ) Rates of p16 (MTS1) mutations in primary tumors with 9p loss. Science 265: , 415–417. |
[9] | Ohtani N , Yamakoshi K , Takahashi A , Hara E ((2004) ) The p16INK4a-RB pathway: Molecular link between cellular senescence and tumor suppression. J Med Invest 51: , 146–153. |
[10] | Melzer D , Pilling LC , Ferrucci L ((2020) ) The genetics of human ageing. Nat Rev Genet 21: , 88–101. |
[11] | Lye JJ , Latorre E , Lee BP , Bandinelli S , Holley JE , Gutowski NJ , Ferrucci L , Harries LW ((2019) ) Astrocyte senescence may drive alterations in GFAPalpha, CDKN2A p14(ARF), and TAU3 transcript expression and contribute to cognitive decline. Geroscience 41: , 561–573. |
[12] | Kamijo T , Zindy F , Roussel MF , Quelle DE , Downing JR , Ashmun RA , Grosveld G , Sherr CJ ((1997) ) Tumor suppression at the mouse INK4a locus mediated by the alternative reading frame product p19ARF. Cell 91: , 649–659. |
[13] | Sherr CJ ((2001) ) The INK4a/ARF network in tumour suppression. Nat Rev Mol Cell Biol 2: , 731–737. |
[14] | McShea A , Harris PL , Webster KR , Wahl AF , Smith MA ((1997) ) Abnormal expression of the cell cycle regulators P16 and CDK4 in Alzheimer’s disease. Am J Pathol 150: , 1933–1939. |
[15] | Esteras N , Bartolome F , Alquezar C , Antequera D , Munoz U , Carro E , Martin-Requero A ((2012) ) Altered cell cycle-related gene expression in brain and lymphocytes from a transgenic mouse model of Alzheimer’s disease [amyloid precursor protein/presenilin 1 (PS1)]. Eur J Neurosci 36: , 2609–2618. |
[16] | Bell JT , Pai AA , Pickrell JK , Gaffney DJ , Pique-Regi R , Degner JF , Gilad Y , Pritchard JK ((2011) ) DNA methylation patterns associate with genetic and gene expression variation in HapMap cell lines. Genome Biol 12: , R10. |
[17] | Urdinguio RG , Sanchez-Mut JV , Esteller M ((2009) ) Epigenetic mechanisms in neurological diseases: Genes, syndromes, and therapies. Lancet Neurol 8: , 1056–1072. |
[18] | Yoshino Y , Mori T , Yoshida T , Yamazaki K , Ozaki Y , Sao T , Funahashi Y , Iga JI , Ueno SI ((2016) ) Elevated mRNA expression and low methylation of SNCA in Japanese Alzheimer’s disease subjects. J Alzheimers Dis 54: , 1349–1357. |
[19] | Funahashi Y , Yoshino Y , Yamazaki K , Mori Y , Mori T , Ozaki Y , Sao T , Ochi S , Iga JI , Ueno SI ((2017) ) DNA methylation changes at SNCA intron 1 in patients with dementia with Lewy bodies. Psychiatry Clin Neurosci 71: , 28–35. |
[20] | Ozaki Y , Yoshino Y , Yamazaki K , Ochi S , Iga JI , Nagai M , Nomoto M , Ueno SI ((2020) ) DRD2 methylation to differentiate dementia with Lewy bodies from Parkinson’s disease. Acta Neurol Scand 141: , 177–182. |
[21] | Folstein MF , Folstein SE , McHugh PR ((1975) ) “Mini-mental state”. A practical method for grading the cognitive state of patients for the clinician. J Psychiatr Res 12: , 189–198. |
[22] | American Psychiatric Association ((1987) ) Diagnostic and statistical manual of mental disorders (4th ed., text rev.). American Psychiatric Association, Washington, DC. |
[23] | Rosen WG , Mohs RC , Davis KL ((1984) ) A new rating scale for Alzheimer’s disease. Am J Psychiatry 141: , 1356–1364. |
[24] | Montgomery SA , Asberg M ((1979) ) A new depression scale designed to be sensitive to change. Br J Psychiatry 134: , 382–389. |
[25] | Hughes CP , Berg L , Danziger WL , Coben LA , Martin RL ((1982) ) A new clinical scale for the staging of dementia. Br J Psychiatry 140: , 566–572. |
[26] | Cummings JL , Mega M , Gray K , Rosenberg-Thompson S , Carusi DA , Gornbein J ((1994) ) The Neuropsychiatric Inventory: Comprehensive assessment of psychopathology in dementia. Neurology 44: , 2308–2314. |
[27] | Watanabe SY , Iga J , Ishii K , Numata S , Shimodera S , Fujita H , Ohmori T ((2015) ) Biological tests for major depressive disorder that involve leukocyte gene expression assays. J Psychiatr Res 66-67: , 1–6. |
[28] | Lee JU , Sul HJ , Son JW ((2012) ) Promoter methylation of CDKN2A, RARbeta, and RASSF1A in non-small cell lung carcinoma: Quantitative evaluation using pyrosequencing. Tuberc Respir Dis (Seoul) 73: , 11–21. |
[29] | Kanda Y ((2013) ) Investigation of the freely available easy-to-use software ‘EZR’ for medical statistics. Bone Marrow Transplant 48: , 452–458. |
[30] | Uyar B , Palmer D , Kowald A , Murua Escobar H , Barrantes I , Moller S , Akalin A , Fuellen G ((2020) ) Single-cell analyses of aging, inflammation and senescence. Ageing Res Rev 64: , 101156. |
[31] | Ochi S , Iga JI , Funahashi Y , Yoshino Y , Yamazaki K , Kumon H , Mori H , Ozaki Y , Mori T , Ueno SI ((2020) ) Identifying blood transcriptome biomarkers of Alzheimer’s disease using transgenic mice. Mol Neurobiol 57: , 4941–4951. |
[32] | Musicco M , Adorni F , Di Santo S , Prinelli F , Pettenati C , Caltagirone C , Palmer K , Russo A ((2013) ) Inverse occurrence of cancer and Alzheimer disease: A population-based incidence study. Neurology 81: , 322–328. |
[33] | Realmuto S , Cinturino A , Arnao V , Mazzola MA , Cupidi C , Aridon P , Ragonese P , Savettieri G , D’Amelio M ((2012) ) Tumor diagnosis preceding Alzheimer’s disease onset: Is there a link between cancer and Alzheimer’s disease? {J Alzheimers Dis 31: , 177–182. |
[34] | Driver JA , Beiser A , Au R , Kreger BE , Splansky GL , Kurth T , Kiel DP , Lu KP , Seshadri S , Wolf PA ((2012) ) Inverse association between cancer and Alzheimer’s disease: Results from the Framingham Heart Study. BMJ 344: , e1442. |
[35] | Lanni C , Masi M , Racchi M , Govoni S ((2021) ) Cancer and Alzheimer’s disease inverse relationship: An age-associated diverging derailment of shared pathways. Mol Psychiatry 26: , 280–295. |
[36] | Bajaj A , Driver JA , Schernhammer ES ((2010) ) Parkinson’s disease and cancer risk: A systematic review and meta-analysis. Cancer Causes Control 21: , 697–707. |
[37] | Catala-Lopez F , Suarez-Pinilla M , Suarez-Pinilla P , Valderas JM , Gomez-Beneyto M , Martinez S , Balanza-Martinez V , Climent J , Valencia A , McGrath J , Crespo-Facorro B , Sanchez-Moreno J , Vieta E , Tabares-Seisdedos R ((2014) ) Inverse and direct cancer comorbidity in people with central nervous system disorders: A meta-analysis of cancer incidence in 577,013 participants of 50 observational studies. Psychother Psychosom 83: , 89–105. |
[38] | Robaina MC , Faccion RS , Arruda VO , de Rezende LM , Vasconcelos GM , Apa AG , Bacchi CE , Klumb CE ((2015) ) Quantitative analysis of CDKN2A methylation, mRNA, and p16(INK4a) protein expression in children and adolescents with Burkitt lymphoma: Biological and clinical implications. Leuk Res 39: , 248–256. |
[39] | Shaw RJ , Hall GL , Lowe D , Liloglou T , Field JK , Sloan P , Risk JM ((2008) ) The role of pyrosequencing in head and neck cancer epigenetics: Correlation of quantitative methylation data with gene expression. Arch Otolaryngol Head Neck Surg 134: , 251–256. |


