
Salivaomics as a Potential Tool for Predicting Alzheimer’s Disease During the Early Stages of Neurodegeneration
Abstract
Background:
The metabolomic and proteomic basis of mild cognitive impairment (MCI) and Alzheimer’s disease (AD) is poorly understood and the relationships between systemic abnormalities in metabolism and AD/AMCI pathogenesis are unclear.
Objective:
The aim of the study was to compare the metabolomic and proteomic signature of saliva from cognitively normal and patients diagnosed with MCI or AD, to identify specific cellular pathways altered with the progression of the disease.
Methods:
We analyzed 80 saliva samples from individuals with MCI or AD as well as age- and gender-matched healthy controls. Saliva proteomic and metabolomic analyses were conducted utilizing mass spectrometry methods and data combined using pathway analysis.
Results:
We found significant alterations in multiple cellular pathways, demonstrating that at the omics level, disease progression impacts numerous cellular processes. Multivariate statistics using SIMCA showed that partial least squares-data analysis could be used to provide separation of the three groups.
Conclusion:
This study found significant changes in metabolites and proteins from multiple cellular pathways in saliva. These changes were associated with AD, demonstrating that this approach might prove useful to identify new biomarkers based upon integration of multi-omics parameters.
INTRODUCTION
Alzheimer’s disease (AD) is a neurodegenerative disease characterized clinically by gradual loss of memory, cognitive decline, and multiple behavioral changes [1, 2] and is the most common form of dementia. The incidence of AD is projected to increase by 300%over the next thirty years, mainly due to the growing aging population in many countries worldwide [3], and this disease has therefore become a global concern in terms of social and economic impact [4–6]. In the United States alone, an estimated 5.8 million people more than 65 years of age are suffering from AD dementia [7]. In clinical practice, patients are not usually diagnosed with AD until the disease has progressed to an advanced stage of cognitive impairment, and there are limited opportunities for reversing disease progression. However, in earlier stages of the disease, often characterized by mild cognitive impairment (MCI), there is substantially more scope to intervene and modify risk factors in order to reduce the risk of cognitive decline and dementia. Those individuals who are identified with MCI have a higher risk of developing AD with advancing age, with approximately 14–18%of MCI patients over 70 years progressing to AD annually [8, 9]. Currently, the ability to detect the early stages of AD and its progression is minimal, making it difficult to determine the optimal clinical therapy. Therefore, a minimally invasive approach is needed to identify preclinical individuals with AD and MCI so that early strategies can be put in place to prevent or reduce the risk of developing clinical symptoms.
Methods for the investigation of AD are often invasive, expensive, and cannot adequately identify biomarkers [10–12]. If successful population-based screening for AD is to be put in place, this will require readily available, minimally invasive, and inexpensive methods for a robust, low-cost diagnostic test with high specificity and sensitivity. Previously, we used cells from the buccal mucosa as a minimally invasive strategy to identify potential biomarkers for AD [13–15]. However, saliva is increasingly gaining attention as a body fluid for the search of biomarkers of health and disease [16]. Recent developments in saliva proteomics have enabled the identification of saliva proteins, and indeed one study demonstrated approximately 40%of the blood proteins currently used in blood-based diagnostics were present in saliva [17].
It is not known precisely how AD is initiated nor what controls the progression pathway. While there have been many different hypotheses as to the cause of AD, the exact triggers and mechanisms remain elusive and are challenging to verify. Recent developments in proteomic and metabolomic methods in disease models of AD have provided valuable insights into the molecular basis of AD [18, 19]. Targeted metabolomics in saliva has also revealed new biomarkers for AD [20]. Furthermore, combined metabolomic and proteomic profiling of saliva may reveal dysregulation of cellular functions that contribute to the disease status of cells or may contribute to the pathology and clinical presentation in AD. Therefore, the aim of the study was to compare the metabolomic and proteomic signature of saliva from cognitively normal and dementia patients diagnosed with MCI and AD, to identify specific cellular pathways altered with the progression of the disease.
METHODS
Patient samples
This study was approved by the local Human Research Ethics Committees, CSIRO Ref 09/11, Ramsay Healthcare Ethics Committee and South Australian Health HREC. All methods were carried out in accordance with the approved guidelines, and all participants provided written informed consent before participating in the study. Diagnosis of MCI or AD was conducted by clinicians (Drs. Hecker, Faunt, Johns, and Maddison) based on the criteria outlined by the National Institute of Neurological and Communicative Disorders and the Stroke-Alzheimer’s Disease and Related Disorders Association (NINCDS-AD&DA) [21] and by using recommendations from the National Institute on Aging-Alzheimer’s Association (NI-AAA) workgroups on diagnostic guidelines for MCI [22] using clinical criteria. The diagnosis of dementia due to AD was made in the clinic setting and was consistent with “probable AD” criteria described in the guidelines paper from the NI-AAA [23]. Data reported in this study are from a total of 80 participants from the South Australian Neurodegenerative Disease (SAND) cohort, including: 1) the cognitively normal/healthy control (C) group (n = 40), which consisted of healthy age- and gender-matched participants; 2) the MCI group (n = 20), clinically diagnosed with MCI; and the 3) AD group (n = 20) clinically diagnosed with AD. Patients with significant cognitive comorbidities including head trauma, alcoholism, learning disability, or Parkinson’s disease (PD), were excluded from the study. Other exclusion criteria for all groups were as follows; patients who were undergoing chemotherapy/radiotherapy treatment for cancer, and taking micronutrient supplements (folate, vitamin B12) above recommended intakes.
Blood and saliva collection
Blood was collected and processed within 3 h of collection. The RNAPro•SAL ™ (Oasis Diagnostics Corporation®, Vancouver, WA, USA) saliva collection system was used, which provides for rapid salivary metabolite and protein collection and recovery, cellular removal, and biomarker stability at ambient temperature. All samples were stored at –80°C until analysis.
Biochemical measurements and statistics
Plasma vitamin B12, folate, vitamin D, homocysteine, cholesterol, triglyceride, HDL-cholesterol, and LDL-cholesterol were measured by a clinical laboratory service; SA Pathology (Adelaide, South Australia, Australia). C-reactive protein (CRP) was measured using commercial enzymatic kits (Beckman Coulter Inc, Brea, CA, USA) on a Beckman AU480 clinical analyzer (Beckman Coulter Inc, Brea, CA, USA) with CV = 2.36%.
Apolipoprotein E genotyping
APOE genotyping for alleles APOE ɛ2, ɛ3, and ɛ4 were based on allele-specific PCR methodology adapted to Real-Time PCR monitored by TaqMan probe [24].
Chemicals
All chemicals used were MS grade or higher, purchased from Sigma-Aldrich (Castle Hill, NSW, Australia) unless specified otherwise. Acrylamide and Bradford assay reagents were purchased from BioRad Laboratories (Gladesville, NSW, Australia). LC Proteomics FlexMix Calibration Solution and Retention Time Calibration Mixture were purchased from Thermo Scientific (Woolloongabba, QLD, Australia). GC Retention Time Calibration standard and isotopically labelled standards were purchased from Cambridge Isotope Laboratories (Tewksbury, MA, USA).
Untargeted metabolomics
Saliva samples were prepared following a modification of a previous method [25]. Briefly, aliquots of saliva (100μL) were processed using internal standards (d27-myristic acid and D-Glucose 13C6 and L-Glutamine-amide-15N. Dried extracts were derivatized before analysis on the GC-MS system. GC-MS analysis was performed on an Agilent 6890B gas chromatograph (GC) oven coupled to a 5977B mass spectrometer (MS) detector (Agilent Technologies, Mulgrave, VIC, Australia) fitted with an MPS autosampler. Total ion chromatogram (TIC) mass spectra were acquired within a range of 50–650 m/z, with a 2.89 spectra s-1 acquisition frequency. Data acquisition and spectral analysis for GC-MS were performed using the Qualitative Analysis software (Version B.010.00) of MassHunter workstation. Qualitative identification of the compounds was performed according to the Metabolomics Standard Initiative (MSI) chemical analysis workgroup using standard GC-MS reference metabolite libraries (Fiehn Metabolomics RTL Library, G166766A, Agilent Technologies) and with the use of Kovats retention indices based on a reference n-alkane standard (C8–C40 Alkanes Calibration Standard). Data were processed on Mass Profiler Professional (v14.9, Agilent Technologies). To ensure quality control/quality assurance in the metabolomics analysis, the sequence used for the analysis was randomly prepared and comprised of 80 samples. The residual standard deviation (RSD) of the d27-Myristic Acid, Glutamine-amide-15N, and Glucose 13C6 internal standards as a percentage was determined to be 6.8%, 4.1%, and 4.9%, respectively.
Untargeted proteomics
Saliva samples were prepared following a modification of a previous method [26]. Saliva protein was precipitated by cold acetone then air-dried before re-dissolving in 8 M urea. An aliquot of protein (5μg) was reduced and alkylated. Proteins were then trypsin digested and incubated at 37°C overnight. The digestion was stopped with 1μL of 10%(v/v) formic acid and filtered with a 0.22 μm filter. For each sample, 100 ng of the tryptic digested peptides were injected onto the liquid chromatography-mass spectrometer (LC-MS) for analysis. Tryptic peptides (100 ng) were desalted and concentrated with a trap column (PepMap100 C18 5 mm×300μm, 5μm, Thermo Scientific, Waltham, MA, USA) and separated on a nano column (PepMap100 C18 150 mm×75μm, 2μm, Thermo Scientific) using an UltimateTM 3000 RSLC nano-LC system (Thermo Scientific). The eluted peptides were ionized with a Nanospray Flex Ion Source (Thermo Scientific). The spray voltage was set to 2.3 kV and the temperature of the heated capillary was set at 300°C. After ionization, mass spectra (MS1) and tandem mass spectra (MS/MS) analysis was performed using an Orbitrap Fusion MS (Thermo Scientific). MS survey scans of peptide precursors were performed in the Orbitrap detector and the scan range was 400 to 1500 m/z at a resolution of 120 K (at 200 m/z). The target value of automatic gain control (AGC) was set as 4×10⁵. The maximum injection time for the MS was 50 ms. MS/MS was performed on the most abundant precursors of charge states 2+ to 7+ with intensity greater than 1×10⁵ and they were isolated by the quadrupole with a window of 1.6 m/z.
Protein data analysis
Protein Discoverer 2.2 (Thermos Scientific) and Sequest HT search engine were used to identify peptides/proteins and quantify the relative abundance of proteins. The spectrum data was searched against the UniProt Homo-sapiens database (Proteome ID: UP000005640, 20,311 sequences). Peptide spectral matches were validated using the Percolar algorithm, based on q-values and 1%false discovery rate (FDR). Relative abundance was calculated from precursor abundance intensity and normalized from the total peptide amount.
Chemometric analysis and salivary metabolome and proteome integration
The metabolomics and proteomics data, after batch-effect adjustment and log transformation, were analyzed using multivariate data analysis software SIMCA (version 16, Sartorius Stedim Biotech, Umeå, Sweden) and MetaboAnalyst 4.0 [27]. The Gene Ontology Resource and Enrichr were used for Enrichment analysis. The cut-off level for significant metabolites was a signal-to-noise (S/N) ratio of 10, while for proteins, it was a relative abundance of 1×10⁵. For statistical analysis of both metabolome and proteome, a fold change of≤0.5 (downregulation) or≥2.0 (upregulation), and a Benjamini–Hochberg adjusted p-value of≤0.05 was used. Metabolomic and proteomic outputs were integrated using the ‘Joint-pathway analysis tool’ of Metaboanalyst 4.0 and Paintomics 3 [28] and the false discovery rate (FDR) was used to report adjusted p-values.
RESULTS
The gender, age, Mini–Mental State Examination (MMSE), APOE ɛ4 allele status, plasma homocysteine concentration, CRP, plasma lipids, and vitamins of the SAND individuals in each group are shown in Table 1. There was no significant difference in age or gender across groups. As expected, there was a significant decrease in the MMSE scores of both MCI (p < 0.018) and AD (p < 0.0001) groups compared with the control group. The frequency (%) of the APOE ɛ4 carriers was increased in both MCI and AD groups compared with the group control (p = 0.011), with a moderate association (Cramer’s V coefficient = 0.349). Vitamin B12 was significantly higher in the MCI and AD groups compared with the control group, whilst both homocysteine and folate tended to be higher (albeit not statistically significant) and vitamin D3 was significantly higher in the MCI group only as compared with healthy controls. Plasma lipids and the inflammatory marker CRP were not different between groups.
Table 1
Age and gender, MMSE scores and various blood measurements between groups
| C | MCI | AD | *p HC versus MCI | * HC versus AD | p | |
| Sample number | 40 | 20 | 20 | |||
| Sex (F/M) | 19/21 | 11/9 | 8/12 | ns | ns | |
| Age | 75.3 | 77.8 | 78.0 | ns | ns | |
| MMSE | 28.6 | 26.6 | 21.1 | 0.018 | < 0.0001 | |
| APOE ɛ4 allele positive (%) Homozygous E4/E4 % | 7/40 (17.5%) 0% | 11/20 (55%) 0% | 10/20 (50%) 20% | |||
| Vitamin B12 (pmol/L) | 303.8±14.5 | 402.5±42.6 | 395.6±27.6 | 0.02 | 0.03 | |
| Folate (nmol/L) | 30.1±1.5 | 34.5±2.2 | 33.9±2.9 | ns | ns | |
| Homocysteine (μmol/L) | 14.1±0.6 | 14.1±0.9 | 15.6±1.2 | ns | ns | |
| Vitamin D3 (nmol/L) | 69.1±3.6 | 89.2±5.8 | 70.7±4.3 | 0.006 | ns | |
| Cholesterol (mmol/L) | 4.79±0.19 | 4.55±0.32 | 4.98±0.29 | ns | ns | |
| Triglyceride (mmol/L) | 1.43±0.10 | 1.47±0.15 | 1.19±0.10 | ns | ns | |
| HDL-cholesterol (mmol/L) | 1.50±0.05 | 1.71±0.15 | 1.89±0.15 | ns | 0.02 | |
| LDL-cholesterol (mmol/L) | 2.65±0.18 | 2.06±0.22 | 2.32±0.25 | ns | ns | |
| Non HDL-cholesterol (mmol/L) | 3.30±0.20 | 3.04±0.36 | 2.89±0.22 | ns | ns | |
| CRP (mg/L) | 2.33±0.39 | 1.76±0.39 | 1.41±0.32 | ns | ns |
*Bonferroni post-hoc test.
The metabolomics and proteomics analysis yielded 173 common metabolites and 923 common proteins across the three saliva sample groups collected [age-matched control, control (n = 40); MCI (n = 20), and AD (n = 20)]. As illustrated in Fig. 1A, statistical analysis indicated that 79 metabolites and 346 proteins were nominally significant and remained statistically significant after post correction for multiple comparisons (Benjamini-Hochberg adjusted p < 0.05) in the saliva samples for the AD group with respect to the control group. Conversely, the MCI group comprised 374 proteins that were statistically significant, with only 6 metabolites found to be statistically significant. The metabolites and proteins were then classified based on chemical ontologies and structural similarity and function to characterize these datasets prior to integration and biological interpretation. As illustrated in Fig. 1B, the most identified proteins were characterized as performing hydrolases, actin-binding, oxidoreductase, and transferase. The most abundant classes of metabolites were sugars, amino acids, carboxylic acids and saturated fatty acids.
Fig. 1
Omics analysis data overview. A) Saliva sample group summary and the number of metabolite and protein features identified and found to be statistically significant in the Alzheimer’s disease (AD) and mild cognitive impairment (MCI) groups compared to the control group. B) Overview of proteins and metabolites classified based on chemical ontologies and structural similarity and function. Partial least squares-data analysis (PLS-DA) score scatter plots for the (C) proteomics and (D) metabolomics datasets.
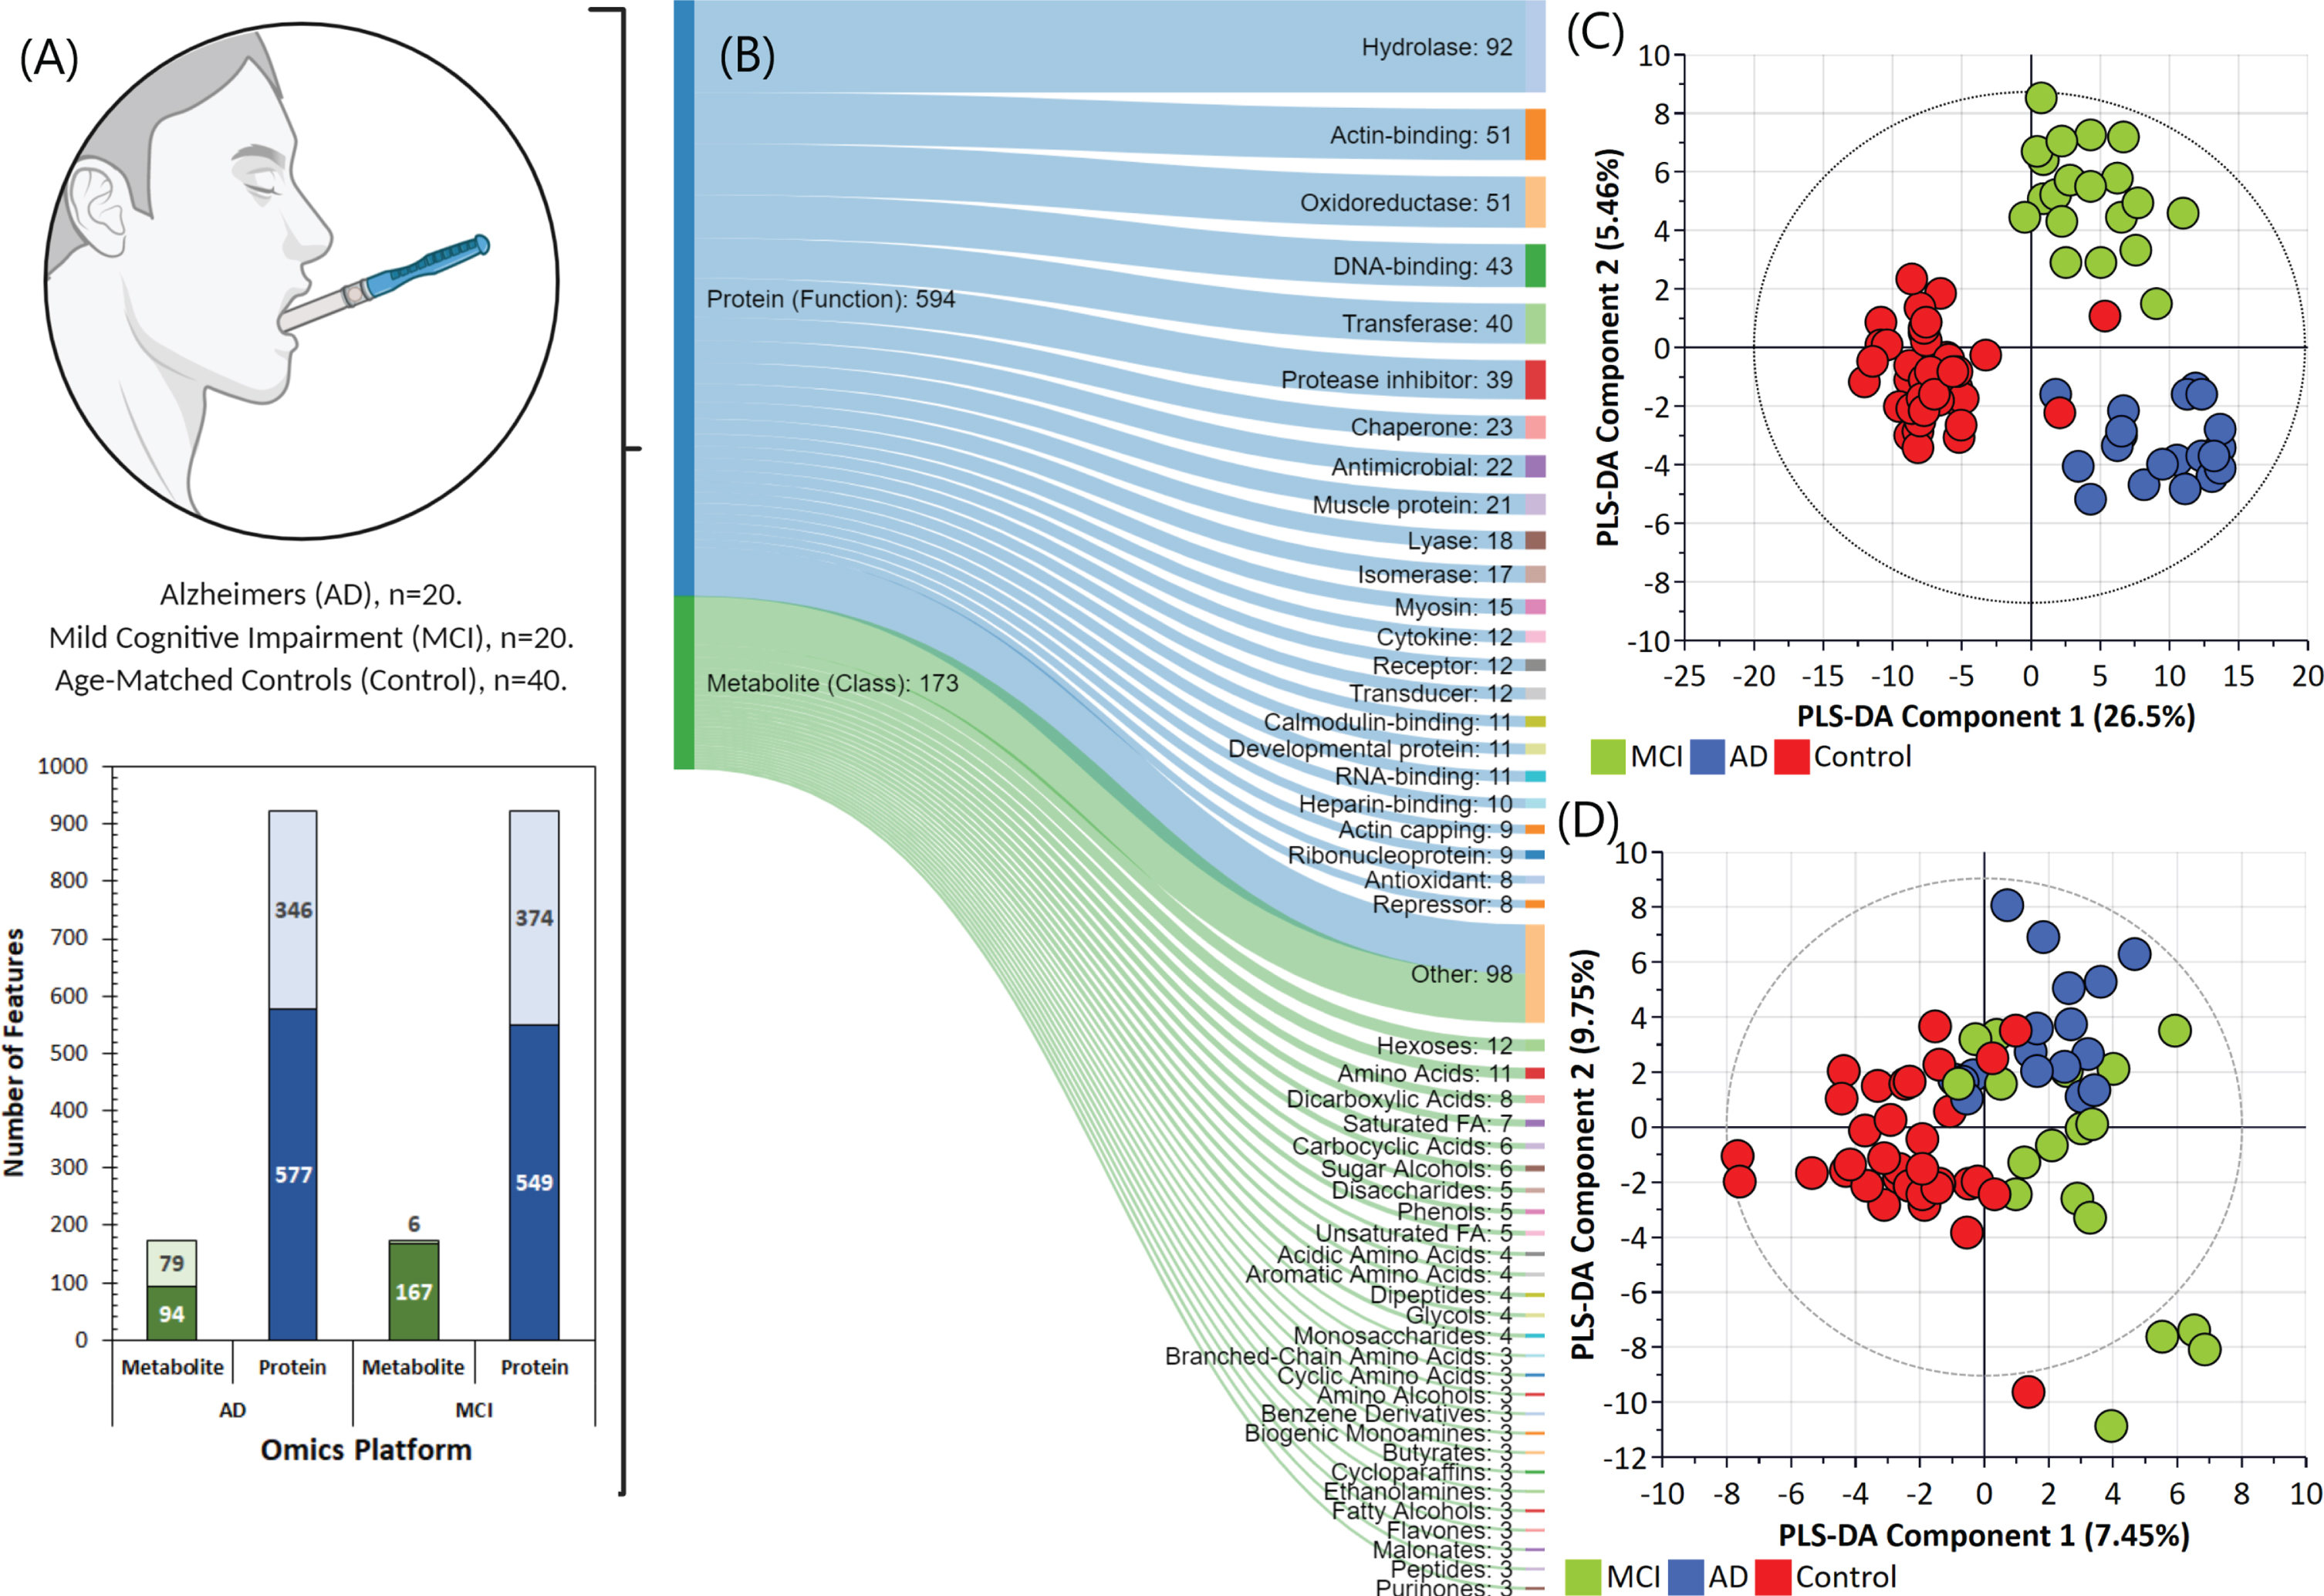
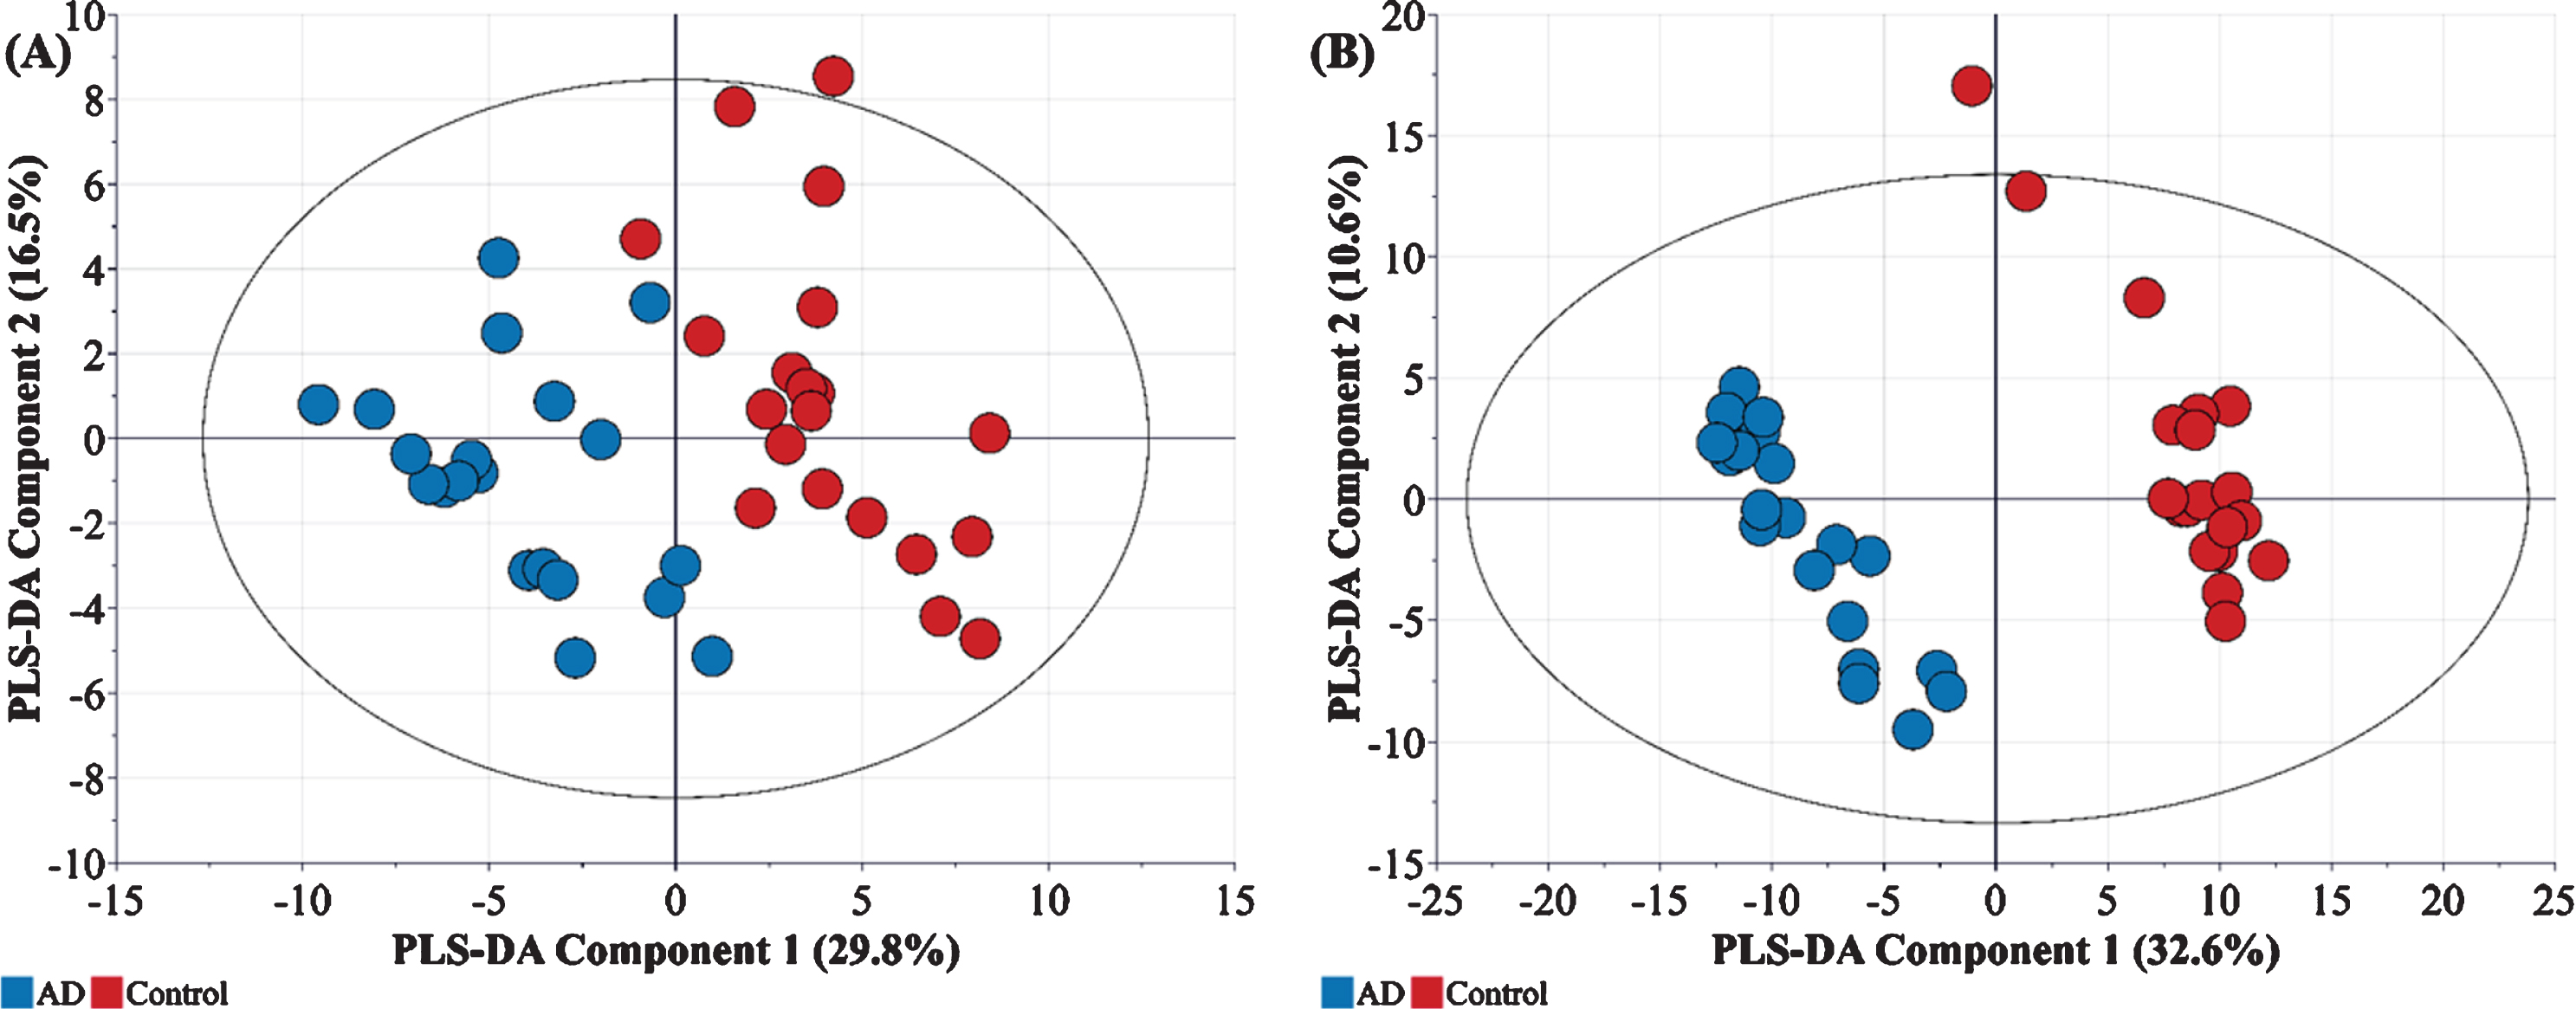
In order to explore variations between these sample groups, the metabolomic and proteomic data were first log transformed, normalized and analyzed by multivariate statistics using SIMCA. Figures 1C and 1D illustrate the partial least squares-data analysis (PLS-DA) score scatter plots for the proteomics and metabolomics datasets, respectively. As evident in Fig. 1C, the proteomics data alone can be used to provide separation of the three groups. In the AD group, 130 proteins were significantly changed in abundance, whilst 155 proteins were changed in abundance in the MCI group compared with controls (Log2fold change≥1.5-fold, ≤-1.5-fold, adjusted p≤0.05). Enrichment analysis revealed some of the proteins were actin and actin related protein, metalloprotease and immunoglobulins. These proteins were mapped to several pathways including neurological disease, inflammation mediated by chemokine and cytokine signal pathway, cytoskeletal regulation by ρ-GTPase, and glycolysis. Conversely, for the metabolomics datasets (Fig. 1D), most metabolites showed an overlap between MCI and AD samples. However, this was not unexpected since the progression of MCI to AD is gradual, and the specific biomarkers for MCI and its translation to AD are not always ubiquitous [9]. In our analysis, all metabolites whose concentrations were significantly different between the control and MCI/AD groups were observed to be significantly upregulated (Fold change > 2.0) –and included rhamnose, L-tyrosine, L-fucose, L-ornithine, L-aspartate, and serotonin. Further analysis indicated that, in contrast to MCI, there was a clear separation of metabolite and protein profiles in control and AD affected individuals, indicated by good linearity (cumulative R2) and predictability (cumulative Q2) (Fig. 2).
Fig. 2
A) Metabolic (R2X = 0.464, R2Y = 802, Q2 = 703) and B) Proteomic (R2X = 0.462, R2Y = 0.996, Q2 = 0.973) profiles of AD samples (n = 20) with respect to controls (n = 20).
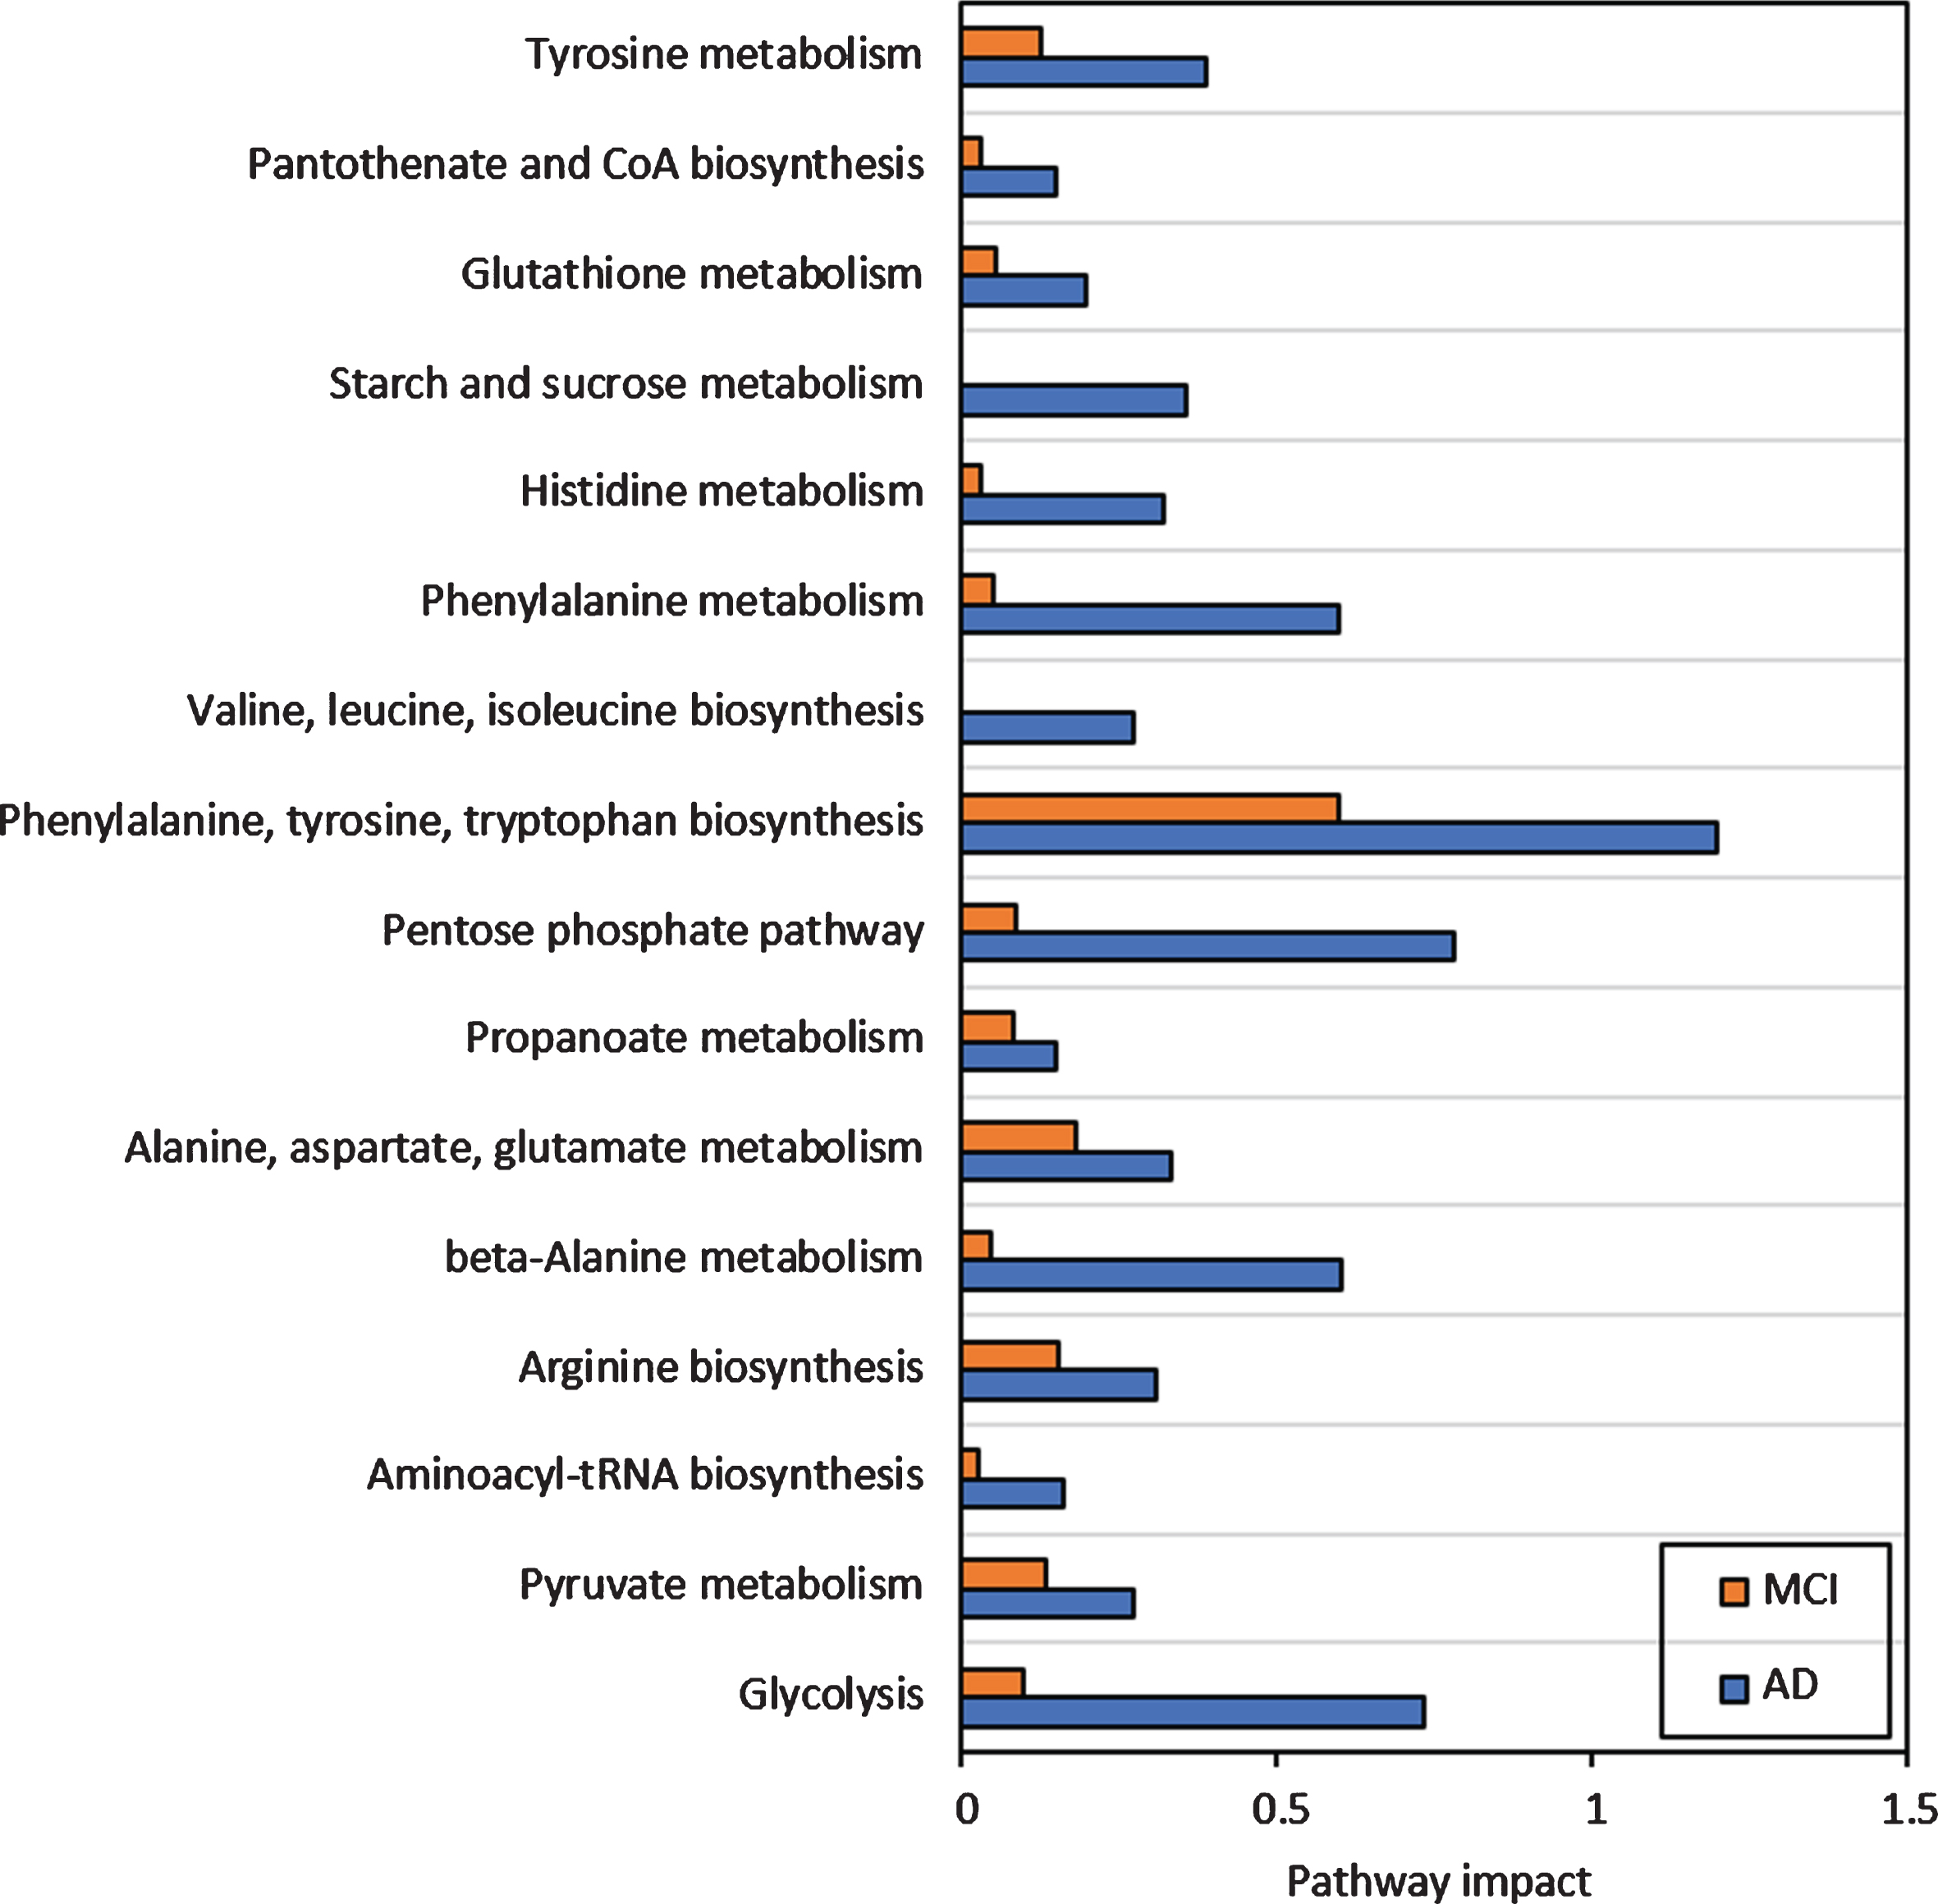
The integration of metabolome and proteome profiles of AD and MCI though the ‘Joint pathway analysis’ tool indicated a presence of 69 metabolic pathways of which 15 were observed to be significantly different (FDR p < 0.05) across both conditions (Table 2).
Table 2
Significant pathways expressed in saliva from AD and MCI (compared with controls)
| Pathway | Match status | FDR | Impact |
| Glycolysis or Gluconeogenesis | 14/61 | 1.19e-12 | 0.73 |
| Pyruvate metabolism | 5/45 | 0.1983 | 0.27 |
| Aminoacyl-tRNA biosynthesis | 12/74 | 1.26e-08 | 0.16 |
| Arginine biosynthesis | 5/27 | 0.0003 | 0.31 |
| beta-Alanine metabolism | 8/44 | 0.0007 | 0.60 |
| Alanine, aspartate and glutamate metabolism | 5/61 | 0.0057 | 0.33 |
| Propanoate metabolism | 4/48 | 0.1983 | 0.15 |
| Pentose phosphate pathway | 5/47 | 0.0057 | 0.78 |
| Phenylalanine, tyrosine and tryptophan biosynthesis | 2/11 | 0.0179 | 1.2 |
| Valine, leucine and isoleucine biosynthesis | 3/12 | 0.0060 | 0.27 |
| Phenylalanine metabolism | 5/21 | 0.0073 | 0.6 |
| Histidine metabolism | 6/32 | 0.0102 | 0.32 |
| Starch and sucrose metabolism | 7/43 | 0.0102 | 0.36 |
| Glutathione metabolism | 4/56 | 0.2517 | 0.2 |
| Pantothenate and CoA biosynthesis | 3/34 | 0.0467 | 0.15 |
| Tyrosine metabolism | 7/88 | 0.0467 | 0.39 |
| Citric acid cycle (TCA cycle) | 3/42 | 0.0467 | 0.37 |
| Galactose metabolism | 5/51 | 0.0467 | 0.28 |
The joint pathway analysis indicated that several major pathways, including the β-alanine pathway, citric acid cycle, cysteine and methionine metabolism, and phenylalanine metabolism showed significant increases in the AD group when compared to the MCI group (Fig. 3).
Fig. 3
Impact of major pathways associated with the MCI and AD conditions compared with the control group.
One of the prominent observations was the accumulation of cholesterol in the saliva of patients with AD (Log2Fold change (FC) = +4.57), in contrast to depletion in the MCI (Log2FC = –1.62). Additionally, for arginine metabolism, a higher accumulation of aspartate, putrescine and ornithine was observed in the AD group compared with controls, which was associated with lower aldehyde dehydrogenase 3 (Uniprot ID P51648) (Log2FC = –2.08) with respect to MCI (Log2FC = –1.32). In tyrosine and phenylalanine metabolism, both tyrosine and phenylalanine accumulation were observed in the AD group but not in the control group. Significant accumulation of downstream products of tyrosine metabolism were further observed in the MCI group only. These included hydroxyphenyl lactate, tyrosol, and tyramine (Fig. 4A). Metabolomic-proteomic integration indicated that such accumulation of the downstream products of tyrosine metabolism was likely due to downregulated aldehyde dehydrogenase family enzyme activities in MCI and AD groups. It is known that the members of this family (P51648, P43353, P30838) catalyze numerous reactions in glycolysis and tyrosine and phenylalanine associated pathways (Fig. 4A). Energy pathways such as glycolysis, oxidative phosphorylation and citrate cycle are the most crucial metabolic pathways in eukaryotic cells due to their role in energy generation.
Fig. 4
Heatmaps showing metabolomic and proteomic expressions during (A) Tyrosine metabolism, (B) Pyruvate metabolism, and (C) Glycolysis in the salivary matrix of AD and MCI patients with respect to control representatives (non-AD/MCI patients). The metabolites and proteins used in the multi-omics integration were selected based on the fold changes (Log2FC≥1.00 or Log2FC≤–1.00) with statistically significant differences False discovery rates (FDR≤0.05)). Note: The numerical IDs in parenthesis indicate Entrez Gene IDs of the proteins involved in these pathways.
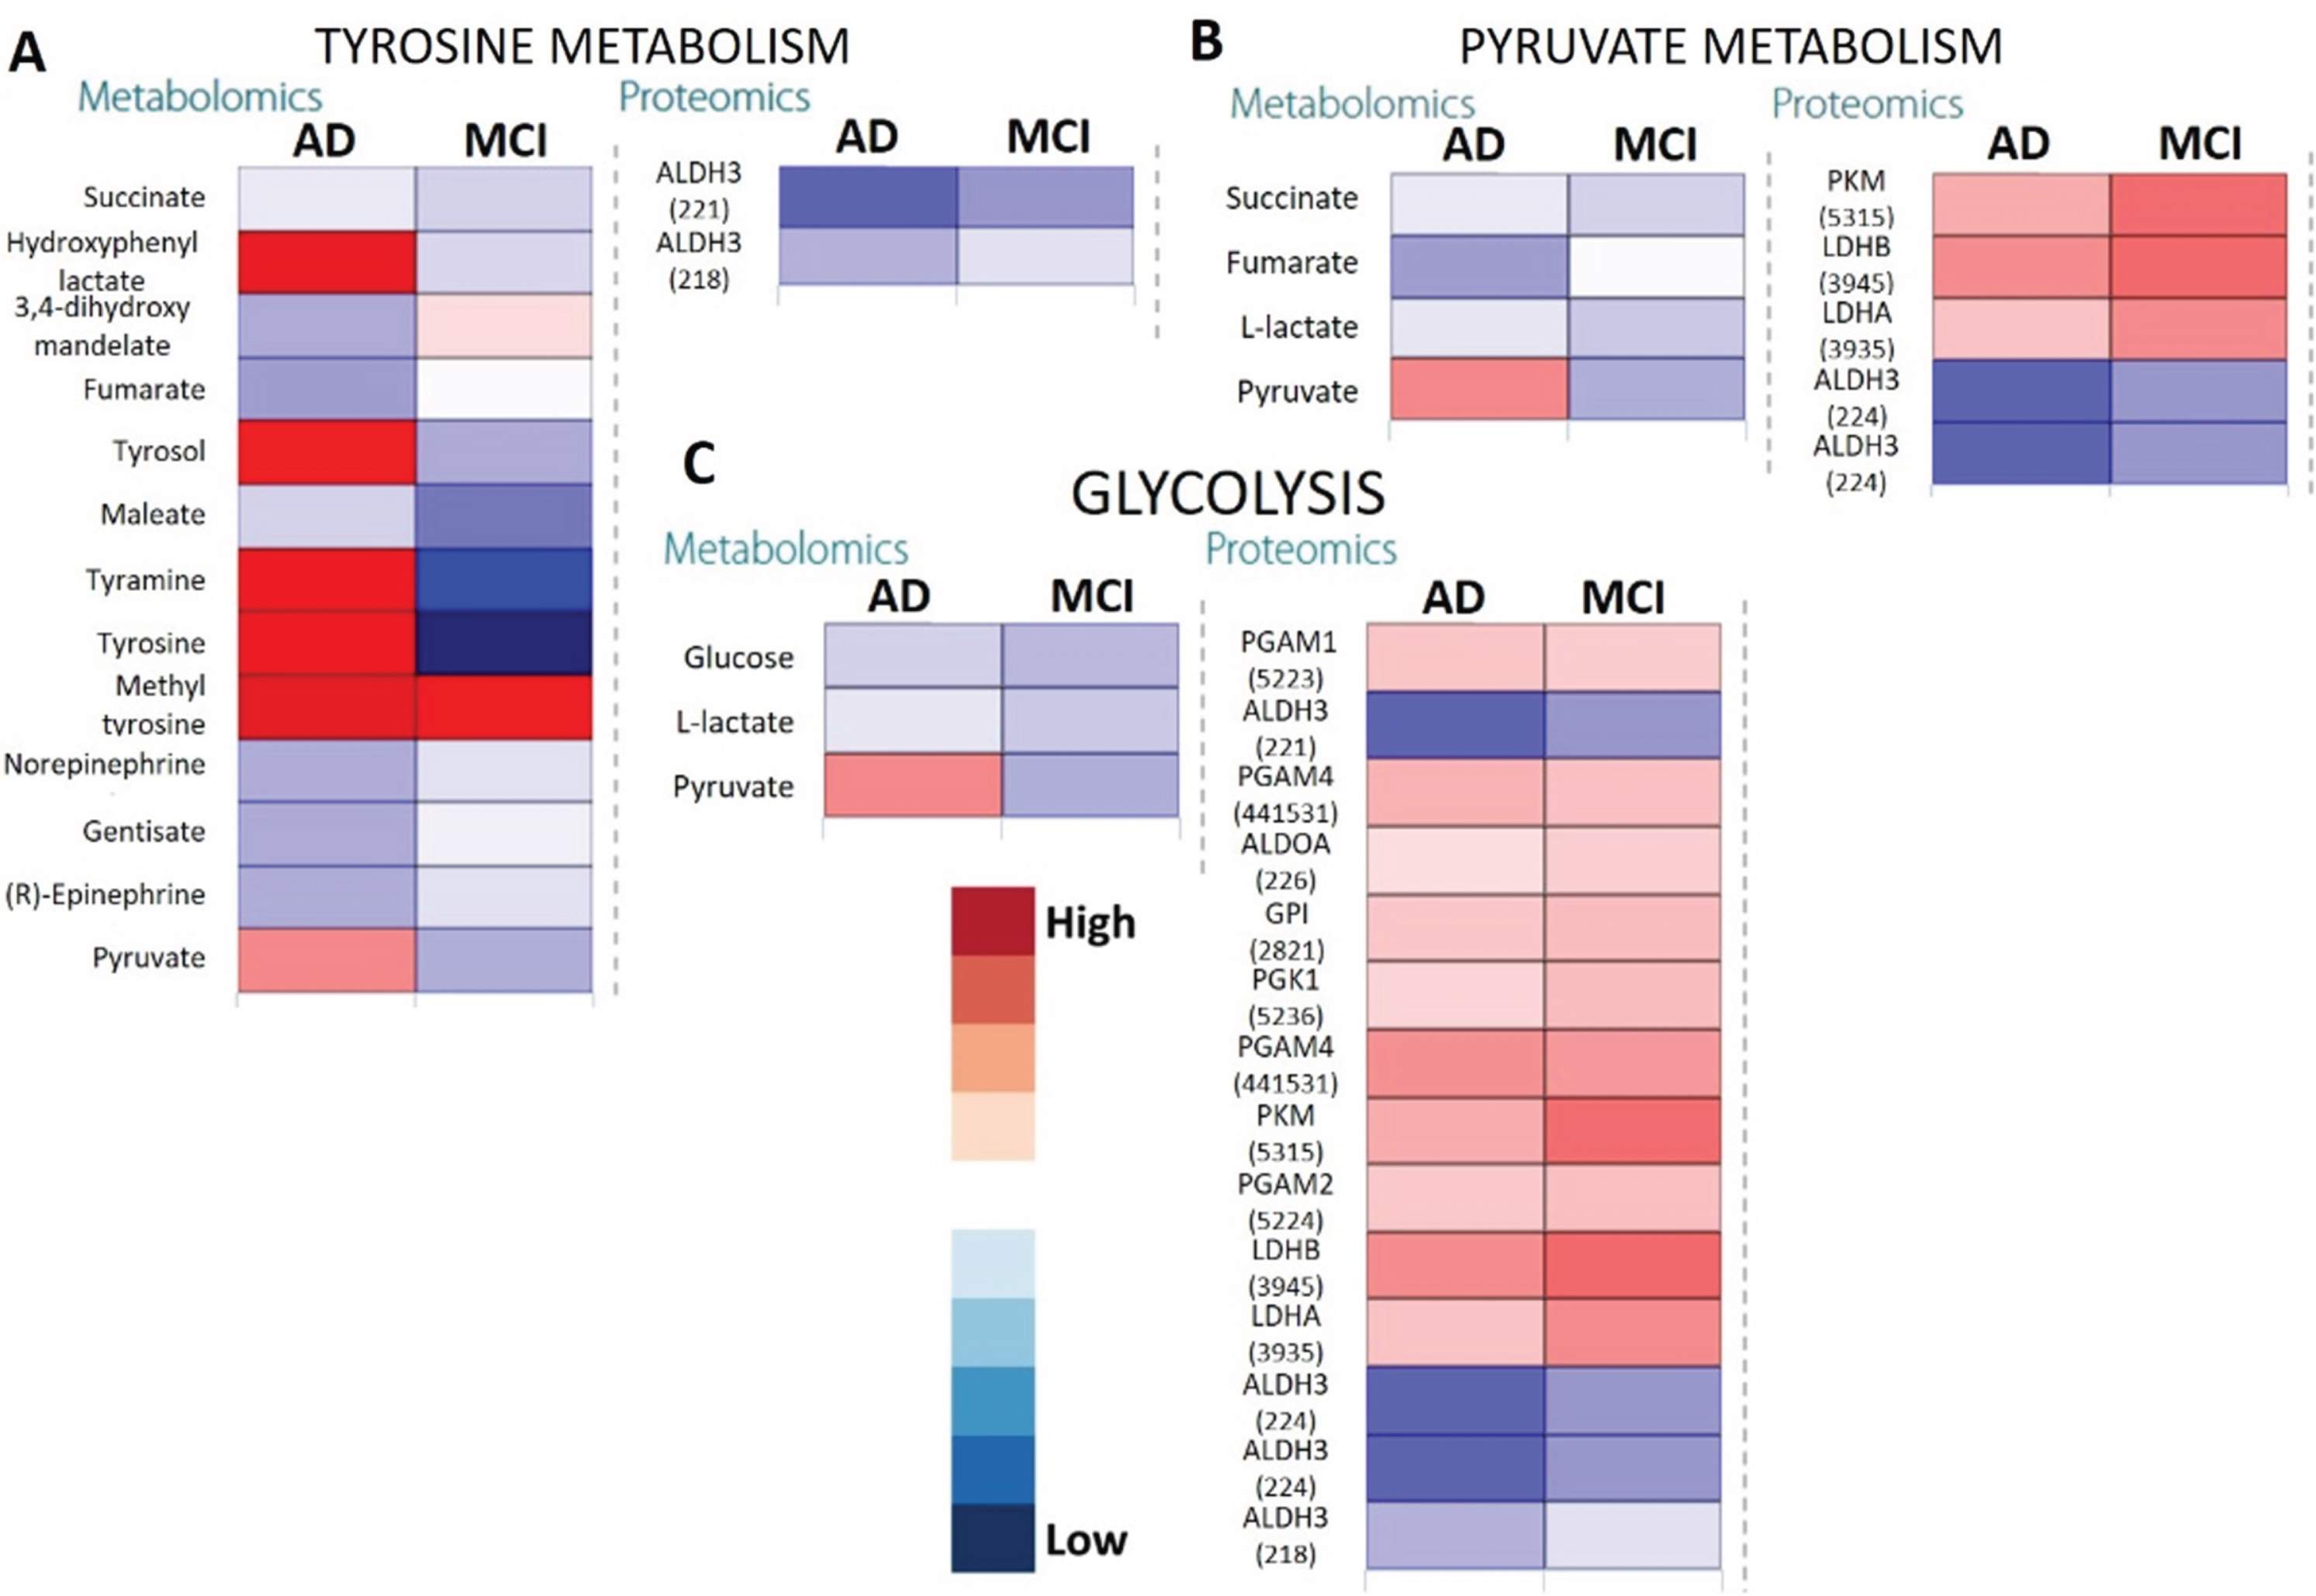
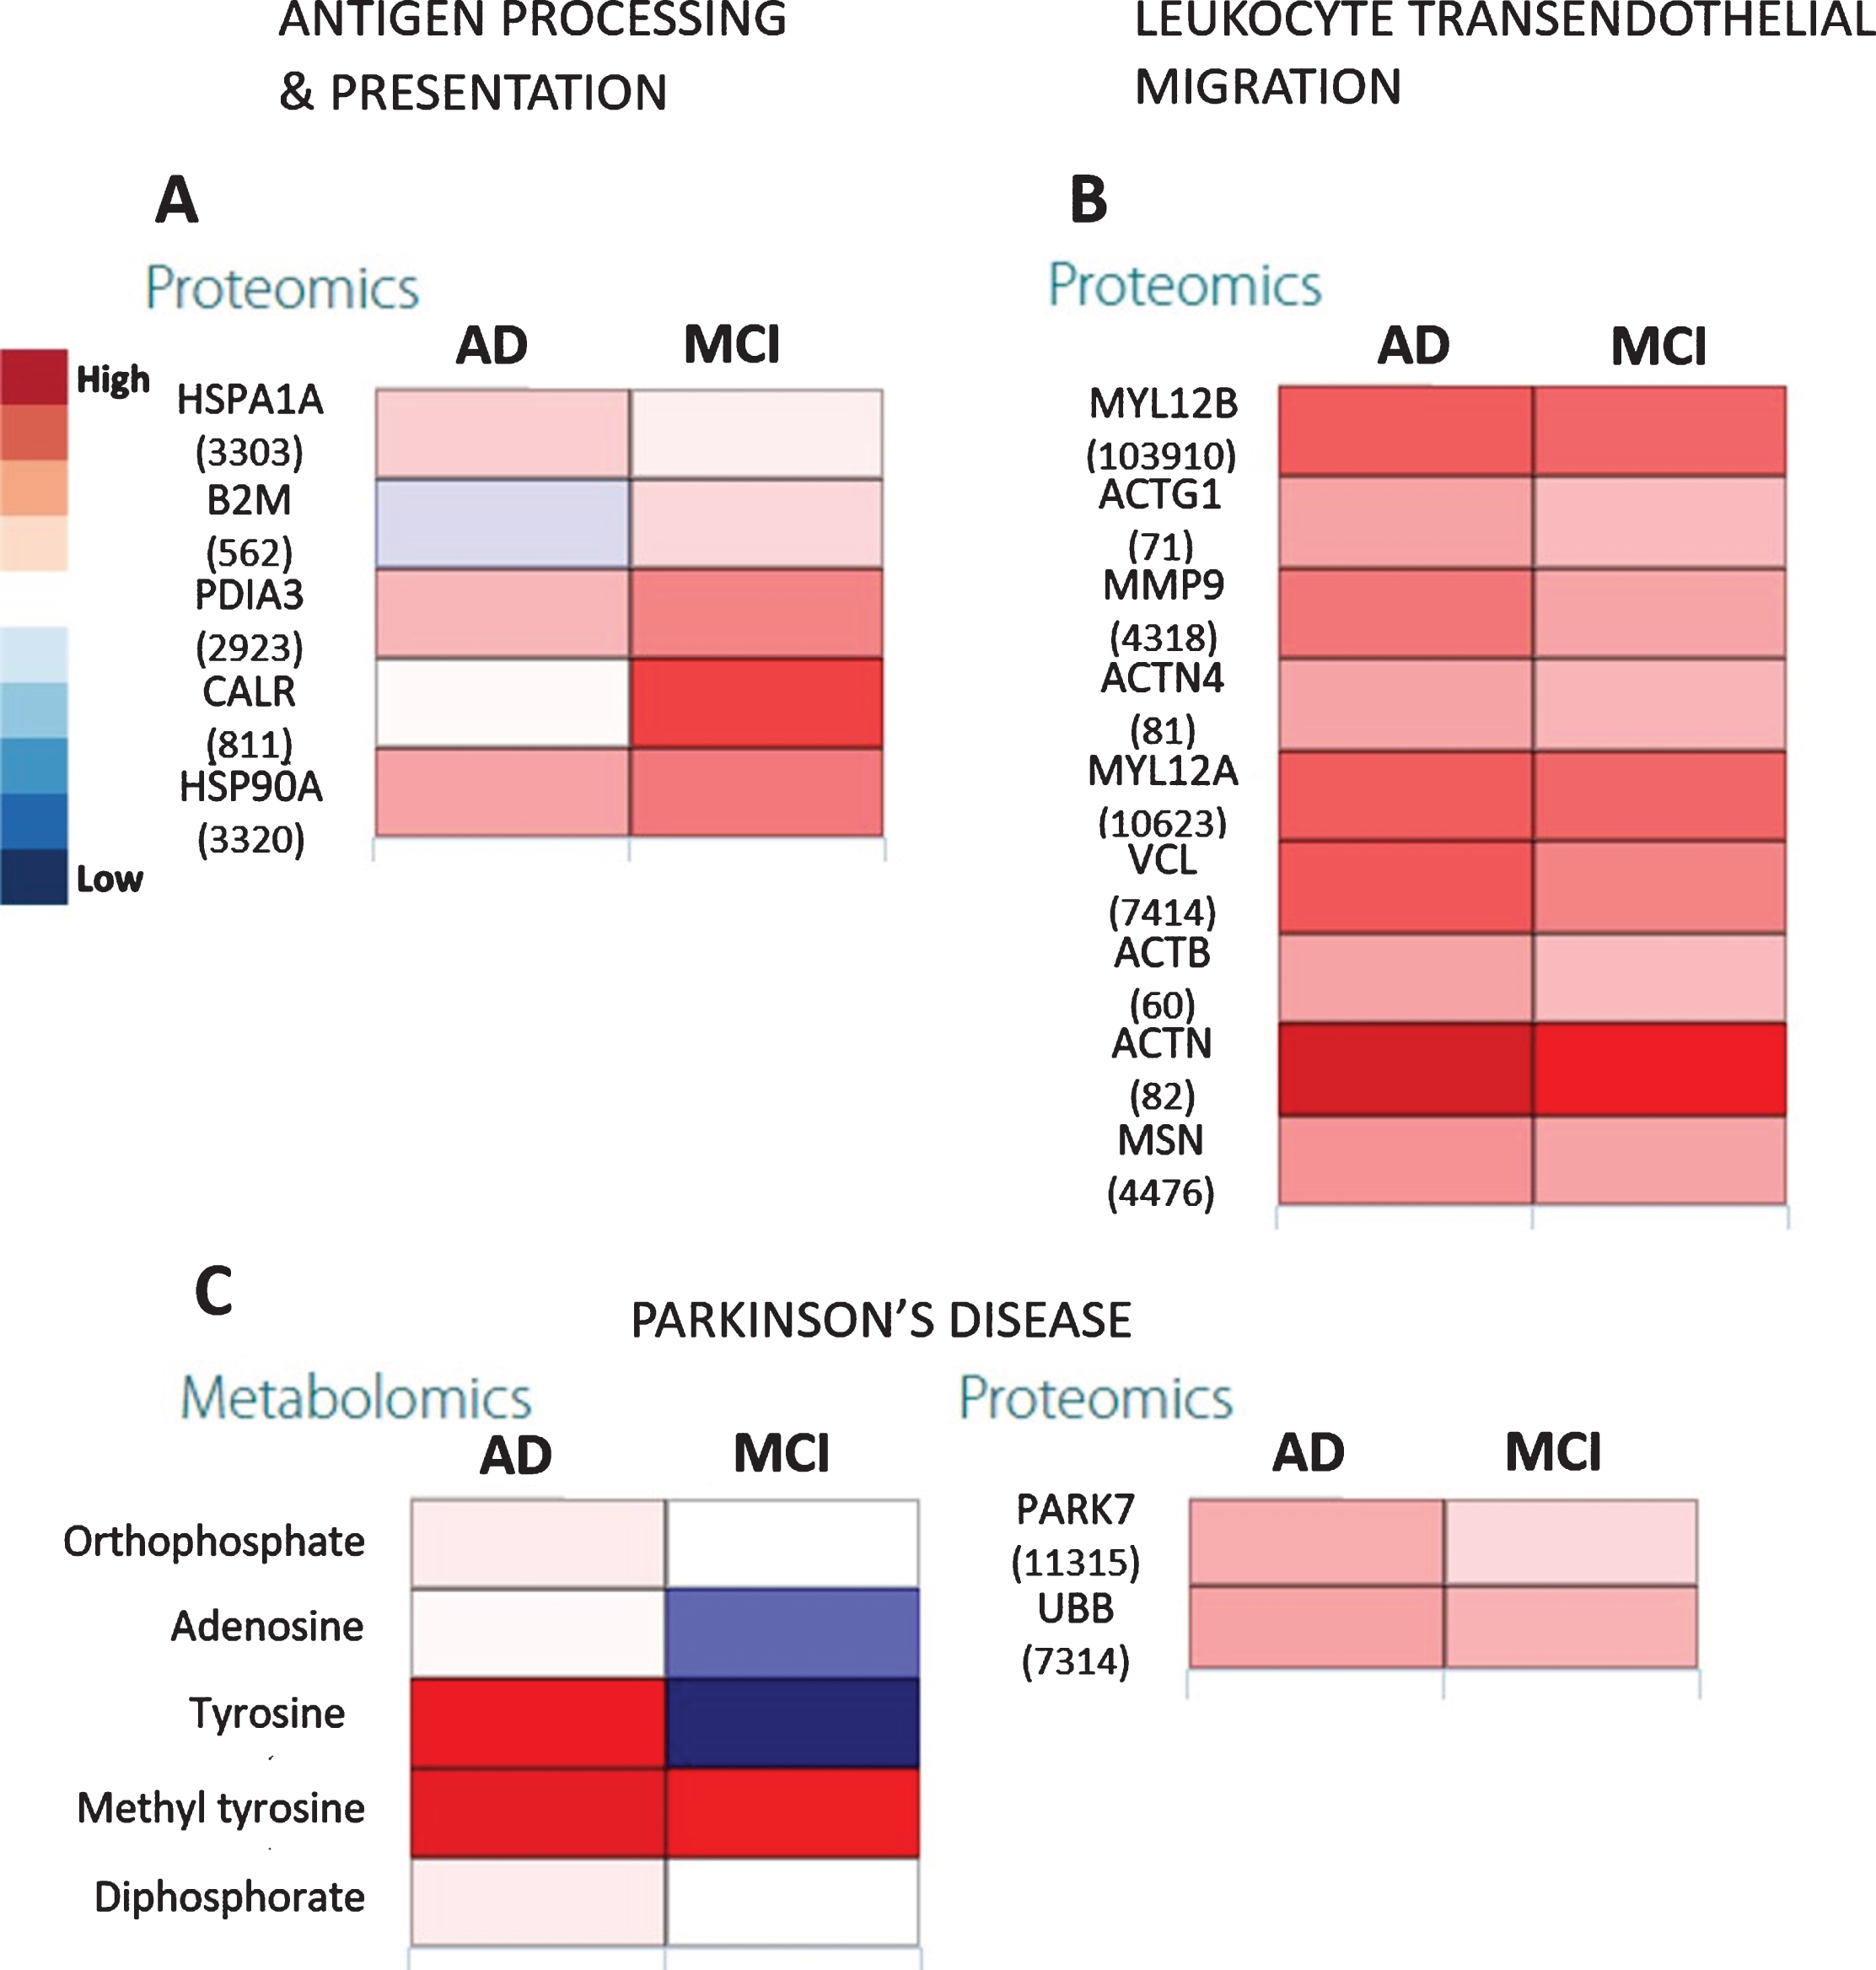
Citric acid cycle showed three out of 42 elements that were differentially expressed only in the AD group (impact = 0.37, FDR = 0.0467) where it appeared to be somewhat upregulated. On the other hand, upstream pathways such as glycolysis and pyruvate metabolism showed higher impact (Fig. 3) especially in AD. This was confirmed by the upregulated pyruvate and downregulated citrate cycle metabolites such as citrate, succinate, and fumarate (Fig. 4) along with increased expression of glycolysis proteins, especially for the AD group as compared with controls. The downregulated succinate and fumarate, combined with low aldehyde dehydrogenase activities in AD also indicated the rerouting of citrate from citrate cycle [29, 30], causing a further upregulation of glycolysis, resulting in pyruvate upregulation in AD (Fig. 4C). This indicated an increased proteasome age activity, causing downregulation of oxidative phosphorylation and fragmenting the citrate cycle and rerouting it toward other pathways [31]. This could be further gauged from the increased antigen processing and presentation, especially through the outputs of antigen-processing cells and leukocyte transendothelial migration (Fig. 5A, B). It appeared that metabolites and proteins contributing to PD also increased throughout the transition of MCI to AD (Fig. 5C).
Fig. 5
The heatmaps show proteomic expressions of (A) antigen processing and presentation and (B) leukocyte transendothelial migration in salivary matrix of AD and MCI patients with respect to their age- and gender-matched controls. C) Heatmaps showing proteomic expression during Parkinson’s disease in salivary matrix of AD and MCI patients with respect to controls. The metabolites and proteins used in the multi-omics integration were selected based on the fold changes (Log2FC≥1.00 or Log2FC≤–1.00) with statistically significant differences (False discovery rates (FDR≤0.05)). Note: The numerical IDs in parenthesis indicate Entrez Gene IDs of the proteins involved in these pathways.
DISCUSSION
Cognitive impairment detection at an early stage is vital, as the disease causes irreversible degeneration of cognitive capabilities in affected individuals. The likelihood of MCI transitioning to dementia annually lies between 14–18%[8, 9] and therefore, it is vital to identify and characterize the biomarkers associated with this transition to enable early diagnosis. Recent untargeted metabolomic analysis has shown the increased levels of glutamate, ornithine, cytidine and sphinganine-1-phosphate [32], and galactose and acetone [33] as probable biomarkers for the transition from MCI to AD. However, the presence of these metabolites as biomarkers of MCI to AD transition is doubtful and variable results exist [34, 35]. Additionally, elevated tau and phosphorylated tau proteins in cerebrospinal fluid have been reported to be indicative of an increased risk of MCI progression to AD [36]. However, salivary tau proteins have shown no correlation with AD in a recent study [37], indicating a necessity to search for more reliable biomarkers, and preferably from non-invasive biofluids such as saliva. To determine potential non-invasive biomarkers for AD, we carried out saliva proteomic and metabolomic analyses utilizing mass spectrometry methods. We found significant alterations in metabolites and proteins from multiple cellular pathways, demonstrating that at the omics level, disease progression impacts numerous cellular processes. These include energy production, cell/organelle structure, signal transduction, mitochondrial function, cell cycle progression, and proteasome function. Therefore, this approach could be used to identify new biomarkers with the results based upon integration of multi-omics parameters for better prediction and diagnostics.
Microglial and astrocyte cells have been shown to produce considerable levels of pro-inflammatory proteins that cross-migrate from cerebral matrix to blood [37]. Prior studies observed changes in serum with increased phenylalanine and tyrosine concentrations. In fact, a high phenylalanine/tyrosine ratio was shown to be a good indicator of AD, caused by the downregulated phenylalanine-4-hydroxylase activity which could prevent stress response metabolites such as L-DOPA and epinephrine [32, 38, 39]. In our current study, phenylalanine and tyrosine accumulation was observed in the AD group, and this correlated with the downregulation of aldehyde dehydrogenase. This enzyme plays a critical role in detoxification and elimination of reactive oxygen species. A recent study with ALDH2 knockout mice has indicated a mutation of this protein in AD patients showing APOE ɛ4 allele causes increased oxidative stress and mitochondrial dysfunction and neuroinflammation [40, 41]. This effect was consistent with the findings from our studies, with downregulated tyrosine and citrate cycle metabolism, leading to increased glycolysis during MCI to AD transition. As the downstream effect of these perturbations, follow-up expression of antigen processing and presentation genes such as CTSS, HLA, HSPA5, TAP2, and TNF have been strongly associated with AD [42].
An upregulated arginine metabolic pathway has been recently shown in AD, especially leading to an increase in ornithine levels through the urea cycle [32]. Our results were in line with this observation, albeit with slight differences as there was a moderate increase in arginine metabolism intermediates in MCI and AD compared to controls. However, a minor reduction of arginase 1 activity was observed when comparing the MCI to AD. Arginine metabolism is important for synthesizing polyamines, which act as agonists for neurotransmitter binding N-methyl-D-aspartate (NMDA) receptors [19]. Indeed, inhibition of arginase activity reversed amyloid-driven neuronal dysfunction and AD symptoms in animal models of AD [43].
Critical risk factors for AD such as hypercholesterolemia and increased serum saturated fatty acids are critical risk factors for AD [44] with gradually increasing levels of cholesterol associated with AD progression for instance [45]. We did not find significant changes in plasma total cholesterol in the MCI or AD groups compared with the control group. However, we observed decreased saliva cholesterol levels in MCI, while levels significantly increased in AD when compared with the control group. Additionally, the expression of steroid hormone biosynthesis enzymes appeared to be disrupted in the transition from MCI to AD, possibly preventing cholesterol degradation and subsequently accelerating AD progression. The study’s observations were in line with the previously shown association with AD of genes involved in sterol regulatory proteins and ATP-binding proteins [46].
One of the peculiar observations from our study was the expression of PD biomarkers in the MCI to AD transition (e.g., Parkinson’s disease protein 7; PARK7). Although PD is considered distinct from AD, recent pathological studies have shown that some similarities exist between the transition from MCI to AD and PD. These include downregulated NR4A1 gene expression which was similar in PD and AD [47]. We intend to conduct future studies that directly compare salivary metabolites and proteins that compare PD with AD, and these results may show the correlations and distinct differences for PD and AD pathologies and may shed additional light on their relationship.
In a study investigating serum metabolomic profiling in patients with AD, a total of eleven components were chosen as biomarker metabolites between AD and control groups, and these metabolites were closely related to seven biological pathways: arginine and proline metabolism, phenylalanine metabolism, β-alanine metabolism, primary bile acid synthesis, glutathione metabolism, starch and sucrose metabolism, and steroid hormone biosynthesis. These serum data may be useful for further understanding AD pathogenesis [39] and our saliva data which demonstrates similar pathway changes thus could provide a simpler non-invasive approach. It is important to note that two MCI and 13 AD participants were taking cholinesterase inhibitors medications; however, these medications are unlikely to affect the significantly impacted pathways revealed in our study. Overall, we found that biomarkers previously reported in cerebral, blood, and liver studies, were also observed in saliva. Additionally, the integrated proteomic-metabolomics approach displayed a greater model predictability for MCI to AD transition at the early stages of neurodegeneration (Fig. 6). This is the first pilot study identifying changes and abundance of saliva proteins and metabolites using an omics approach for the assessment of developing AD risk. Saliva has an additional advantage that it can be self-collected multiple times in a stress-free manner. As such, these practical aspects support the logical step to utilize saliva in the search for early AD biomarkers. Furthermore, this study provides further evidence that MCI and AD pathology is not restricted to neuronal cells but involves substantial changes in peripheral tissues.
Fig. 6
General metabolic behavior in saliva during MCI to AD transition. Note: The 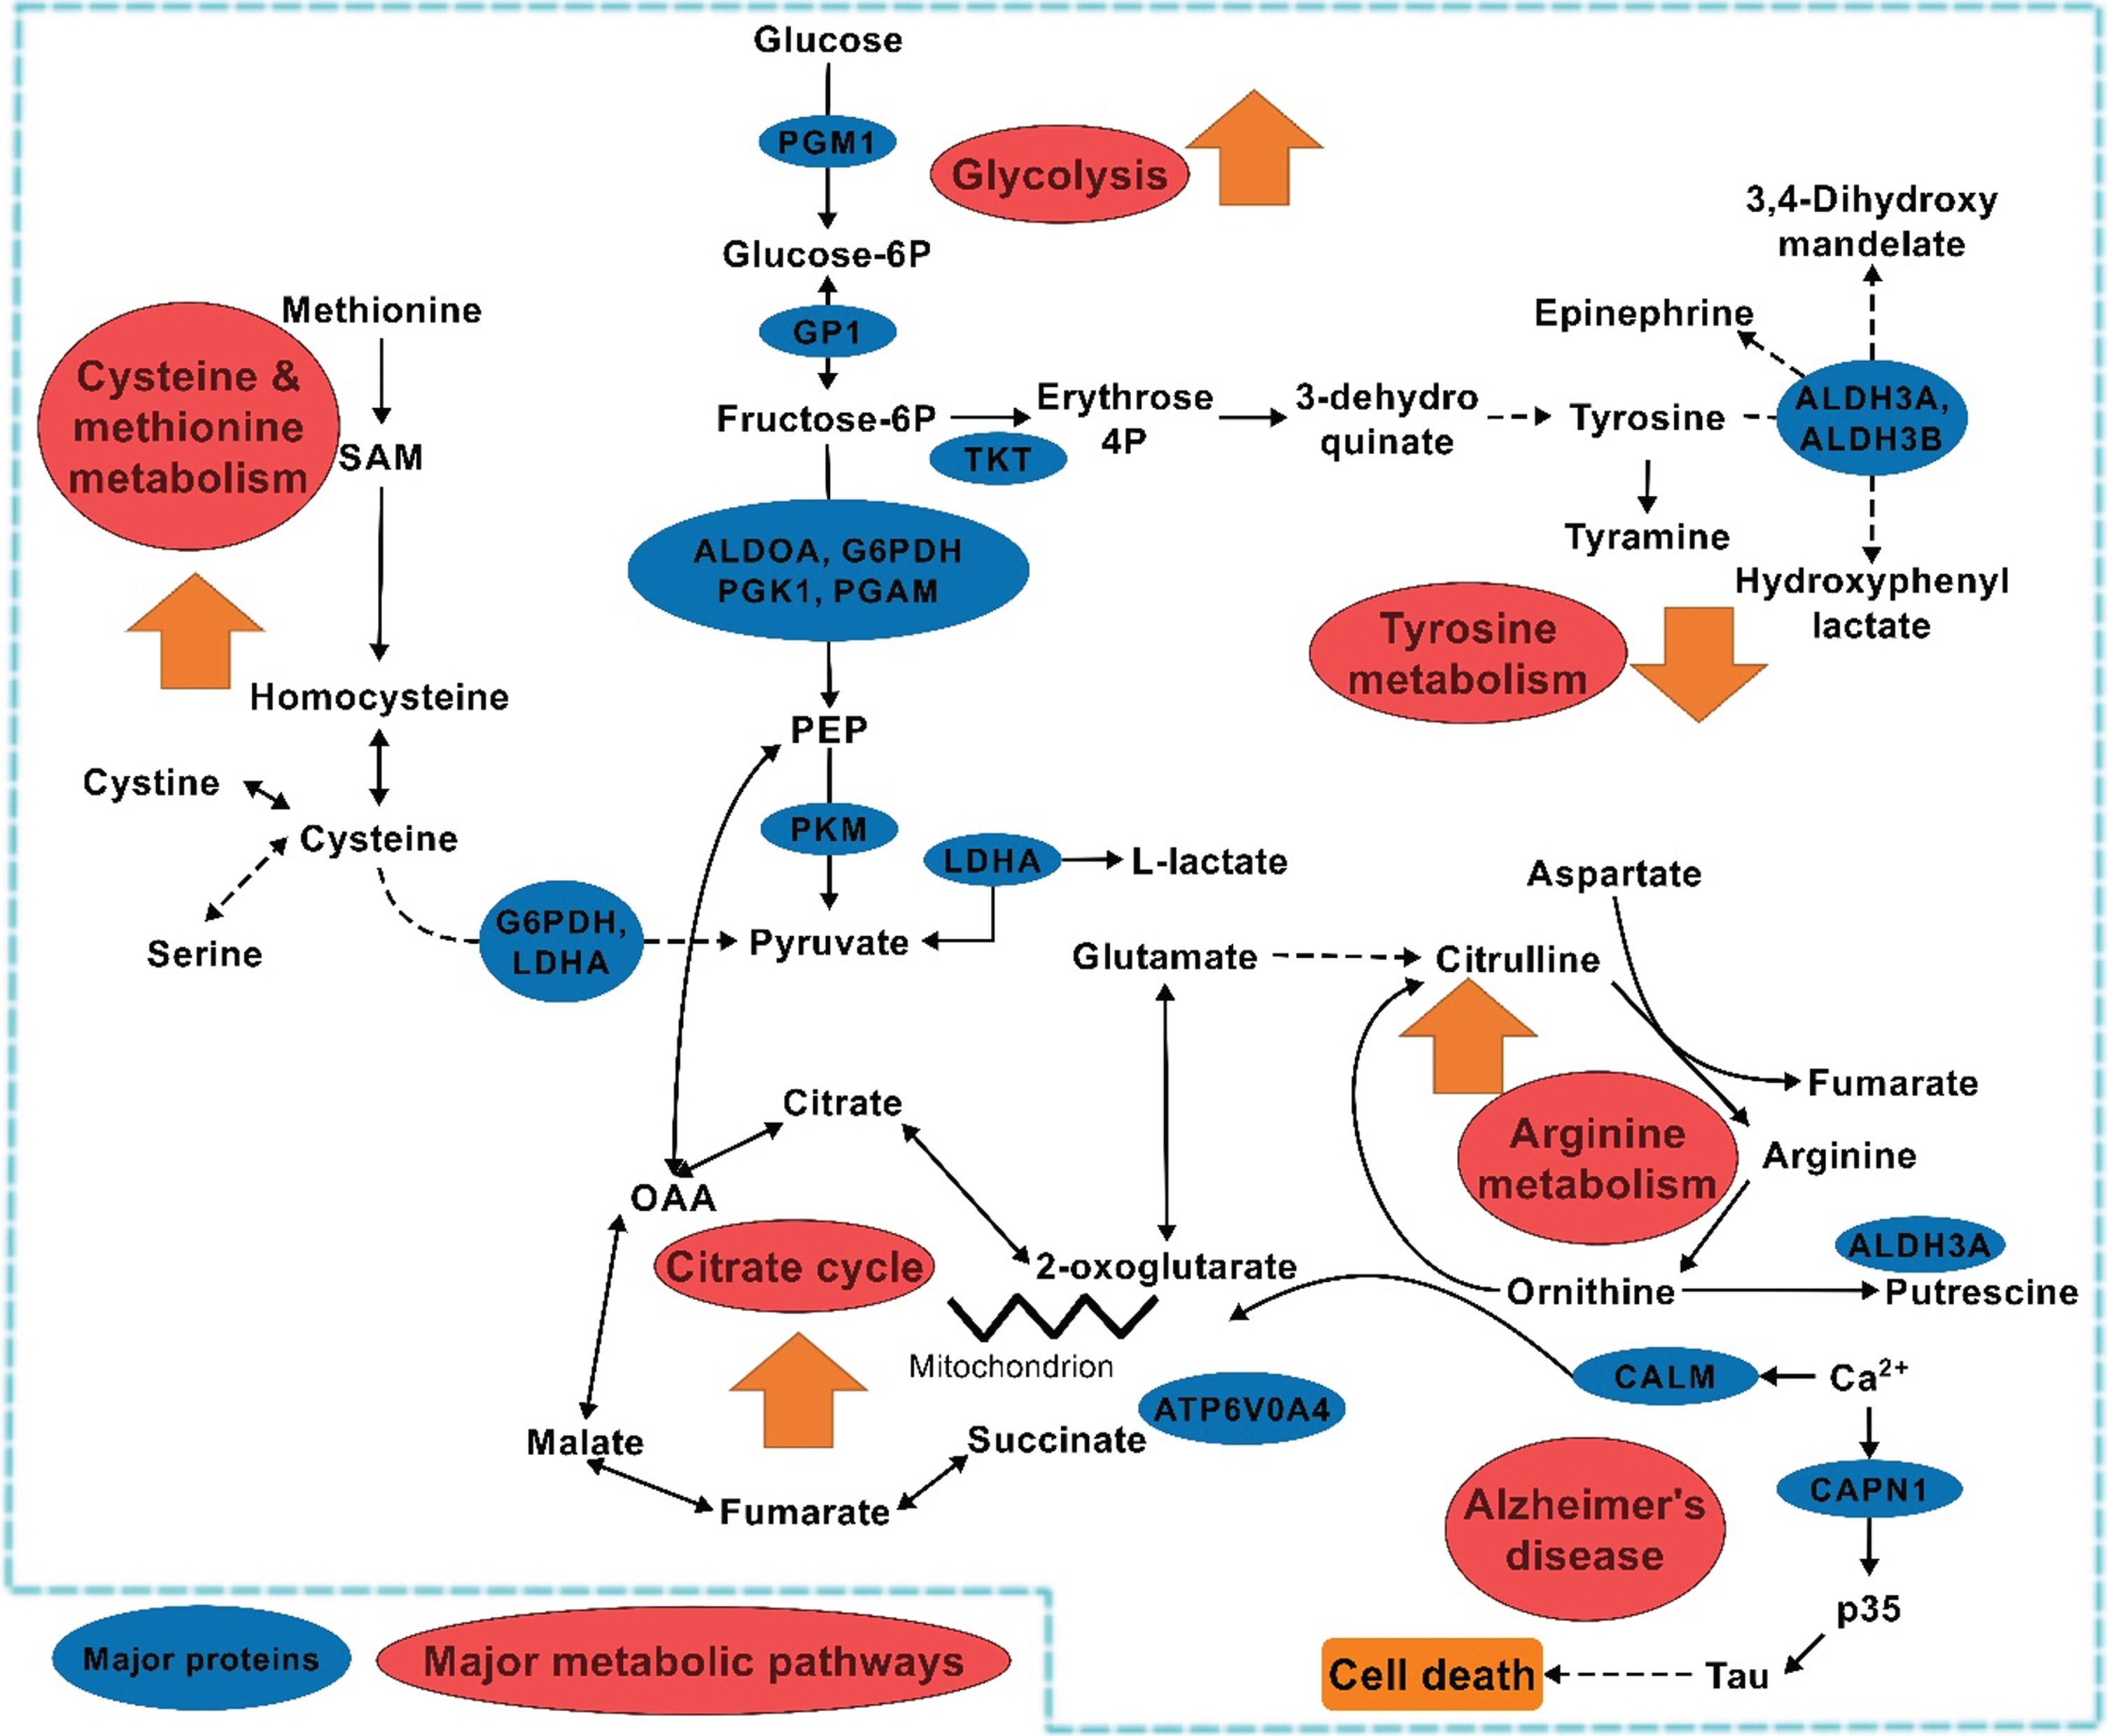 indicates individual pathway behavior during the transition. Zigzag indicates break in the pathway.
ACKNOWLEDGMENTS
We thank all the volunteers who participated in this study as well as the nursing and office staff at the recruitment sites; the Calvary Rehabilitation Hospital, Modbury Hospital (Specialist Ambulatory Rehabilitation Centre) and South Australian Health and Medical Research Institute (CSIRO/SAHMRI) in Adelaide, South Australia. This study was supported by a CSIRO initiative; the Probing Biosystems - Future Science Platform research funding scheme.
Authors’ disclosures available online (https://www.j-alz.com/manuscript-disclosures/21-0283r1).
REFERENCES
[1] | Burns A , Byrne EJ , Maurer K ((2002) ) Alzheimer’s disease. Lancet 360: , 163–165. |
[2] | Alzheimer’s Association, Thies W , Bleiler L ((2011) ) 2011 Alzheimer’s disease facts and figures. Alzheimers Dement 7: , 208–244. |
[3] | Kalaria RN , Maestre GE , Arizaga R , Friedland RP , Galasko D , Hall K , Luchsinger JA , Ogunniyi A , Perry EK , Potocnik F , Prince M , Stewart R , Wimo A , Zhang ZX , Antuono P , World Federation of Neurology Dementia Research Group ((2008) ) Alzheimer’s disease and vascular dementia in developing countries: Prevalence, management, and risk factors. Lancet Neurol 7: , 812–826. |
[4] | Sloane PD , Zimmerman S , Suchindran C , Reed P , Wang L , Boustani M , Sudha S ((2002) ) The public health impact of Alzheimer’s disease, 2000-2050: Potential implication of treatment advances. Annu Rev Public Health 23: , 213–231. |
[5] | Smith AD ((2008) ) The worldwide challenge of the dementias: A role for B vitamins and homocysteine? Food Nutr Bull 29: , S143–S172. |
[6] | Ferri CP , Prince M , Brayne C , Brodaty H , Fratiglioni L , Ganguli M , Hall K , Hasegawa K , Hendrie H , Huang Y , Jorm A , Mathers C , Menezes PR , Rimmer E , Scazufca M , Alzheimer’s Disease International ((2005) ) Global prevalence of dementia: A Delphi consensus study. Lancet 366: , 2112–2117. |
[7] | Alzheimer’s Association ((2020) ) 2020 Alzheimer’s disease facts and figures. Alzheimers Dement 16: , 391–460. |
[8] | Grundman M , Petersen RC , Ferris SH , Thomas RG , Aisen PS , Bennett DA , Foster NL , Jack CR Jr , Galasko DR , Doody R , Kaye J , Sano M , Mohs R , Gauthier S , Kim HT , Jin S , Schultz AN , Schafer K , Mulnard R , van Dyck CH , Mintzer J , Zamrini EY , Cahn-Weiner D , Thal LJ , Alzheimer’s Disease Cooperative Study ((2004) ) Mild cognitive impairment can be distinguished from Alzheimer disease and normal aging for clinical trials. Arch Neurol 61: , 59–66. |
[9] | Petersen RC , Roberts RO , Knopman DS , Boeve BF , Geda YE , Ivnik RJ , Smith GE , Jack CR Jr ((2009) ) Mild cognitive impairment: Ten years later. Arch Neurol 66: , 1447–1455. |
[10] | Thambisetty M , Lovestone S ((2010) ) Blood-based biomarkers of Alzheimer’s disease: Challenging but feasible. Biomark Med 4: , 65–79. |
[11] | Hampel H , Prvulovic D ((2012) ) Are biomarkers harmful to recruitment and retention in Alzheimer’s disease clinical trials? An international perspective. J Nutr Health Aging 16: , 346–348. |
[12] | Blennow K , Zetterberg H ((2009) ) Cerebrospinal fluid biomarkers for Alzheimer’s disease. J Alzheimers Dis 18: , 413–417. |
[13] | Francois M , Leifert W , Martins R , Thomas P , Fenech M ((2014) ) Biomarkers of Alzheimer’s disease risk in peripheral tissues; focus on buccal cells. Curr Alzheimer Res 11: , 519–531. |
[14] | Francois M , Leifert W , Hecker J , Faunt J , Martins R , Thomas P , Fenech M ((2014) ) Altered cytological parameters in buccal cells from individuals with mild cognitive impairment and Alzheimer’s disease. Cytometry A 85A: , 698–708. |
[15] | Leifert WR , Francois M , Thomas P , Luther E , Holden E , Fenech M ((2011) ) Automation of the buccal micronucleus cytome assay using laser scanning cytometry. Methods Cell Biol 102: , 321–339. |
[16] | Francois M , Bull CF , Fenech MF , Leifert WR ((2019) ) Current state of saliva biomarkers for aging and Alzheimer’s disease. Curr Alzheimer Res 16: , 56–66. |
[17] | Loo JA , Yan W , Ramachandran P , Wong DT ((2010) ) Comparative human salivary and plasma proteomes. J Dent Res 89: , 1016–1023. |
[18] | Sancesario GM , Bernardini S ((2018) ) Alzheimer’s disease in the omics era. Clin Biochem 59: , 9–16. |
[19] | Wilkins JM , Trushina E ((2018) ) Application of metabolomics in Alzheimer’s disease. Front Neurol 8: , 719. |
[20] | Marksteiner J , Oberacher H , Humpel C ((2019) ) Acyl-alkyl-phosphatidlycholines are decreased in saliva of patients with Alzheimer’s disease as identified by targeted metabolomics. J Alzheimers Dis 68: , 583–589. |
[21] | McKhann G , Drachman D , Folstein M , Katzman R , Price D , Stadlan EM ((1984) ) Clinical diagnosis of Alzheimer’s disease: Report of the NINCDS-ADRDA Work Group under the auspices of Department of Health and Human Services Task Force on Alzheimer’s Disease. Neurology 34: , 939–944. |
[22] | Albert MS , DeKosky ST , Dickson D , Dubois B , Feldman HH , Fox NC , Gamst A , Holtzman DM , Jagust WJ , Petersen RC , Snyder PJ , Carrillo MC , Thies B , Phelps CH ((2011) ) The diagnosis of mild cognitive impairment due to Alzheimer’s disease: Recommendations from the National Institute on Aging-Alzheimer’s Association workgroups on diagnostic guidelines for Alzheimer’s disease. Alzheimers Dement 7: , 270–279. |
[23] | McKhann GM , Knopman DS , Chertkow H , Hyman BT , Jack CR Jr , Kawas CH , Klunk WE , Koroshetz WJ , Manly JJ , Mayeux R , Mohs RC , Morris JC , Rossor MN , Scheltens P , Carrillo MC , Thies B , Weintraub S , Phelps CH ((2011) ) The diagnosis of dementia due to Alzheimer’s disease: Recommendations from the National Institute on Aging-Alzheimer’s Association workgroups on diagnostic guidelines for Alzheimer’s disease. Alzheimers Dement 7: , 263–269. |
[24] | Zhong L , Xie YZ , Cao TT , Wang Z , Wang T , Li X , Shen RC , Xu H , Bu G , Chen XF ((2016) ) A rapid and cost-effective method for genotyping apolipoprotein E gene polymorphism. Mol Neurodegener 11: , 2-016-0069-4. |
[25] | Goettel M , Niessner R , Mueller D , Scherer M , Scherer G , Pluym N ((2017) ) Metabolomic fingerprinting in various body fluids of a diet-controlled clinical smoking cessation study using a validated GC-TOF-MS metabolomics platform. J Proteome Res 16: , 3491–3503. |
[26] | Nuzzo D , Inguglia L , Walters J , Picone P , Di Carlo M ((2017) ) A shotgun proteomics approach reveals a new toxic role for Alzheimer’s disease Abeta peptide: Spliceosome impairment. J Proteome Res 16: , 1526–1541. |
[27] | Chong J , Soufan O , Li C , Caraus I , Li S , Bourque G , Wishart DS , Xia J ((2018) ) MetaboAnalyst 4.0: Towards more transparent and integrative metabolomics analysis. Nucleic Acids Res 46: , W486–W494. |
[28] | Hernandez-de-Diego R , Tarazona S , Martinez-Mira C , Balzano-Nogueira L , Furio-Tari P , Pappas GJ Jr , Conesa A ((2018) ) PaintOmics 3: A web resource for the pathway analysis and visualization of multi-omics data. Nucleic Acids Res 46: , W503–W509. |
[29] | Infantino V , Convertini P , Cucci L , Panaro MA , Di Noia MA , Calvello R , Palmieri F , Iacobazzi V ((2011) ) The mitochondrial citrate carrier: A new player in inflammation. Biochem J 438: , 433–436. |
[30] | Lampropoulou V , Sergushichev A , Bambouskova M , Nair S , Vincent EE , Loginicheva E , Cervantes-Barragan L , Ma X , Huang SC , Griss T , Weinheimer CJ , Khader S , Randolph GJ , Pearce EJ , Jones RG , Diwan A , Diamond MS , Artyomov MN ((2016) ) Itaconate links inhibition of succinate dehydrogenase with macrophage metabolic remodeling and regulation of inflammation. Cell Metab 24: , 158–166. |
[31] | Galvan-Pena S , O’Neill LA ((2014) ) Metabolic reprograming in macrophage polarization. Front Immunol 5: , 420. |
[32] | Liang Q , Liu H , Lia X , Zhang A ((2016) ) High-throughput metabolomics analysis discovers salivary biomarkers for predicting mild cognitive impairment and Alzheimer’s disease. RSC Adv 6: , 75499–75504. |
[33] | Yilmaz A , Geddes T , Han B , Bahado-Singh RO , Wilson GD , Imam K , Maddens M , Graham SF ((2017) ) Diagnostic biomarkers of Alzheimer’s disease as identified in saliva using 1H NMR-based metabolomics. J Alzheimers Dis 58: , 355–359. |
[34] | Lin CN , Huang CC , Huang KL , Lin KJ , Yen TC , Kuo HC ((2019) ) A metabolomic approach to identifying biomarkers in blood of Alzheimer’s disease. Ann Clin Transl Neurol 6: , 537–545. |
[35] | Liang D , Lu H ((2019) ) Salivary biological biomarkers for Alzheimer’s disease. Arch Oral Biol 105: , 5–12. |
[36] | Hansson O , Zetterberg H , Buchhave P , Londos E , Blennow K , Minthon L ((2006) ) Association between CSF biomarkers and incipient Alzheimer’s disease in patients with mild cognitive impairment: A follow-up study. Lancet Neurol 5: , 228–234. |
[37] | Ashton NJ , Ide M , Scholl M , Blennow K , Lovestone S , Hye A , Zetterberg H ((2018) ) No association of salivary total tau concentration with Alzheimer’s disease. Neurobiol Aging 70: , 125–127. |
[38] | Wissmann P , Geisler S , Leblhuber F , Fuchs D ((2013) ) Immune activation in patients with Alzheimer’s disease is associated with high serum phenylalanine concentrations. J Neurol Sci 329: , 29–33. |
[39] | Sun C , Gao M , Wang F , Yun Y , Sun Q , Guo R , Yan C , Sun X , Li Y ((2020) ) Serum metabolomic profiling in patients with Alzheimer disease and amnestic mild cognitive impairment by GC/MS. Biomed Chromatogr 34: , e4875. |
[40] | Joshi AU , Van Wassenhove LD , Logas KR , Minhas PS , Andreasson KI , Weinberg KI , Chen CH , Mochly-Rosen D ((2019) ) Aldehyde dehydrogenase 2 activity and aldehydic load contribute to neuroinflammation and Alzheimer’s disease related pathology. Acta Neuropathol Commun 7: , 190. |
[41] | Yamashima T ((2020) ) Possible prevention of Alzheimer’s disease by aldehyde dehydrogenase: A perspective review. J Alzheimers Dis Parkinsonism 10: , 489. |
[42] | Hu YS , Xin J , Hu Y , Zhang L , Wang J ((2017) ) Analyzing the genes related to Alzheimer’s disease via a network and pathway-based approach. Alzheimers Res Ther 9: , 29. |
[43] | Polis B , Srikanth KD , Gurevich V , Bloch N , Gil-Henn H , Samson AO ((2018) ) Arginase as a potential target in the treatment of Alzheimer’s disease. Adv Alzheimers Dis 7: , 119–140. |
[44] | Chen J , Shu H , Wang Z , Liu D , Shi Y , Zhang X , Zhang Z ((2015) ) The interaction of APOE genotype by age in amnestic mild cognitive impairment: A voxel-based morphometric study. J Alzheimers Dis 43: , 657–668. |
[45] | Xue-Shan Z , Juan P , Qi W , Zhong R , Li-Hong P , Zhi-Han T , Zhi-Sheng J , Gui-Xue W , Lu-Shan L ((2016) ) Imbalanced cholesterol metabolism in Alzheimer’s disease. Clin Chim Acta 456: , 107–114. |
[46] | Picard C , Julien C , Frappier J , Miron J , Theroux L , Dea D , United Kingdom Brain Expression Consortium and for the Alzheimer’s Disease Neuroimaging Initiative, Breitner JCS , Poirier J ((2018) ) Alterations in cholesterol metabolism-related genes in sporadic Alzheimer’s disease. Neurobiol Aging 66: , 180.e1–180.e9. |
[47] | Montarolo F , Perga S , Martire S , Navone DN , Marchet A , Leotta D , Bertolotto A ((2016) ) Altered NR4A subfamily gene expression level in peripheral blood of Parkinson’s and Alzheimer’s disease patients. Neurotox Res 30: , 338–344. |


