
Predicting and Characterizing Neurodegenerative Subtypes with Multimodal Neurocognitive Signatures of Social and Cognitive Processes
Abstract
Background:
Social cognition is critically compromised across neurodegenerative diseases, including the behavioral variant frontotemporal dementia (bvFTD), Alzheimer’s disease (AD), and Parkinson’s disease (PD). However, no previous study has used social cognition and other cognitive tasks to predict diagnoses of these conditions, let alone reporting the brain correlates of prediction outcomes.
Objective:
We performed a diagnostic classification analysis using social cognition, cognitive screening (CS), and executive function (EF) measures, and explored which anatomical and functional networks were associated with main predictors.
Methods:
Multiple group discriminant function analyses (MDAs) and ROC analyses of social cognition (facial emotional recognition, theory of mind), CS, and EF were implemented in 223 participants (bvFTD, AD, PD, controls). Gray matter volume and functional connectivity correlates of top discriminant scores were investigated.
Results:
Although all patient groups revealed deficits in social cognition, CS, and EF, our classification approach provided robust discriminatory characterizations. Regarding controls, probabilistic social cognition outcomes provided the best characterization for bvFTD (together with CS) and PD, but not AD (for which CS alone was the best predictor). Within patient groups, the best MDA probabilities scores yielded high classification rates for bvFTD versus PD (98.3%, social cognition), AD versus PD (98.6%, social cognition + CS), and bvFTD versus AD (71.7%, social cognition + CS). Top MDA scores were associated with specific patterns of atrophy and functional networks across neurodegenerative conditions.
Conclusion:
Standardized validated measures of social cognition, in combination with CS, can provide a dimensional classification with specific pathophysiological markers of neurodegeneration diagnoses.
INTRODUCTION
Social cognition is critically compromised across neurodegenerative disorders [1, 2]. This has been shown through canonical, gold-standard measures [3] of facial emotion recognition (FER) and theory of mind (ToM, the ability to infer others’ emotional and mental states). FER and ToM deficits are pervasive in behavioral variant frontotemporal dementia (bvFTD), but also in Alzheimer’s disease (AD) and Parkinson disease (PD) (see Tables 1 and 2, and Supplementary Table 1). However, critical advances in neurodegeneration research have not yet been incorporated in this field. Only a few studies have used social cognition outcomes to predict membership (i.e., diagnosis), or contrasted ensuing predictions with those afforded by cognitive screening [CS] and executive function [EF] measures (Tables 1 and 2). Moreover, no work has jointly compared discrimination outcomes across bvFTD, AD, and PD samples. Finally, no single study has reported anatomical signatures of social cognition classification in these patients nor their functional connectivity (FC) correlates. Here, we tackle these gaps by developing multiple group discriminant function analyses (MDAs) of social cognition, CS, and EF metrics, and correlating the best classification outcomes with anatomical and functional network measures in each group and healthy controls.
Table 1
Works that used MiniSEA and/or SEA for group membership prediction and/or between-group comparisons in behavioral variant frontotemporal dementia, Alzheimer’s disease, and/or Parkinson’s disease
| Source | Groups: N | Tasks | Behavioral performance | Prediction of group membership with social cognition? | Comparison with other cognitive measures? | Brain structure associations | Brain function associations |
| Mariano et al., 2020 [91] | AD-apathetic: 10 AD-non-apathetic: 10 bvFTD: 22 HC: 23 | MiniSEA | bvFTD < AD < HC bvFTD < AD-apathetic bvFTD < AD-non-apathetic | Yes, logistic regression and ROC curve analyses Accuracy for the MiniSEA total score: AD versus bvFTD: 78.6% AD-apathetic versus bvFTD: 84.4% AD-non-apathetic versus bvFTD: 81.3% | Yes No significant differences between bvFTD and AD on MMSE, FAB, categorical fluency (animals), FAS, Digit Span, and BCSB Figure Memory tests | NA | NA |
| Bertoux et al., 2016 [9] | AD: 28 bvFTD-amnesic: 19 bvFTD-non-amnesic: 19 HC: 30 | MiniSEA | bvFTD < AD = HC | Yes, logistic regression and ROC curve analyses Accuracy for the MiniSEA total score: bvFTD versus AD: 87.9% bvFTD-amnesic versus AD: 85.1% bvFTD-non-amnesic versus AD: 93.9% | Yes Free and Cued Selective Reminding Test: low accuracy | NA | NA |
| Bertoux et al., 2014 [48] | bvFTD: 20 | MiniSEA | bvFTD < normative values | No | No | NA | Perfusion (SPECT) correlations for bvFTD: –FER: dorsal medial PFC (BA 9) –Faux-Pas: rostral medial PFC (BA 10) |
| Bertoux et al., 2013 [4] | AD: 20 bvFTD: 20 HC: 30 | MiniSEA | bvFTD < AD = HC | Yes, logistic regression and ROC curve analyses Accuracy for the MiniSEA total score: bvFTD versus AD: 82.5% bvFTD versus HC: 88% | Yes Reversal-Learning Test and Go/No-Go subtest of the FAB: very good discriminatory power, but less than MiniSEA IGT total score: poor discrimination | NA | NA\multicolumn 8r(Continued) |
| Bertoux et al., 2012 [62] | bvFTD-early: 17 bvFTD-moderate: 20 MDD: 19 HC: 30 | SEA MiniSEA | bvFTD (early and moderate) < MDD < HC on SEA bvFTD (early and moderate) < MDD = HC on MiniSEA | Yes, ROC curve analyses Sensitivity, specificity: –For the SEA total score: bvFTD versus MDD: 91.9%, 89.5% bvFTD-early versus MDD: 94.1%, 89.5% bvFTD-moderate versus MDD: 90%, 89.5% –For the MiniSEA total score: bvFTD versus MDD: 89.2%, 100% bvFTD-early versus MDD: 94.1%, 100% bvFTD-moderate versus MDD: 85%, 100% | Yes WCST (number of perseverative errors), MMSE, FAB and verbal fluency test: less discrimination ability than MiniSEA | NA | NA |
| Bertoux et al., 2012 [92] | bvFTD: 20 | SEA | bvFTD < normative values | No | No | GM volume (VBM) correlations for bvFTD: –FER: medial PFC (BA 9, 8) –Faux-Pas: rostral medial PFC (BA 10), fronto-insular cortex (BA 13) | NA |
| Funkiewiez et al., 2012 [10] | AD or amnesic-MCI: 22 bvFTD: 22 HC: 30 | SEA | bvFTD < AD < HC | Yes, ROC curve analyses Sensitivity, specificity for the SEA total score: bvFTD versus HC: 100%, 100% bvFTD versus AD: 86.36%, 95.45% | No | NA | NA |
Studies in this table were identified through a systematic literature search conducted on PubMed and Google Scholar, including combinations of the following keywords: MiniSEA, SEA, social cognition, emotion recognition, recognition of emotions, emotion perception, emotion processing, facial emotion(s), facial expression(s), facial affect, theory of mind, mentalizing, neurodegeneration, neurodegenerative disease, dementia, bvFTD, frontotemporal lobar degeneration, Alzheimer(’s disease), Parkinson(’s disease). Only original studies written in English until June 30, 2020 were reviewed. Inclusion criteria were (i) authors assess at least one of the following diagnostic groups: bvFTD, Alzheimer’s disease, Parkinson’s disease, and (ii) report group membership prediction and/or between groups’ statistical comparisons using the MiniSEA or SEA (a more extended social cognition battery from which the MiniSEA was created). AD, Alzheimer’s disease; BA, Brodmann area; BCSB, Brief Cognitive Screening Battery; bvFTD, behavioral variant frontotemporal dementia; FAB, Frontal Assessment Battery; FER, Facial emotion recognition; GM, gray matter; HC, healthy controls; IGT, Iowa Gambling Task; MCI, mild cognitive impairment; MDD, Major depressive disorder; MiniSEA, Mini Social Cognition and Emotional Assessment; MMSE, Mini-Mental State Exam; NA, not assessed; PFC, prefrontal cortex; ROC, receiver-operating characteristic; SEA, Social Cognition and Emotional Assessment; SPECT, single photon emission computed tomography; VBM, voxel-based morphometry; WCST, Wisconsin Card Sorting Task.
Table 2
Works that used emotion recognition and/or ToM tasks (other than SEA/MiniSEA) for group membership prediction (behavioral variant frontotemporal dementia, Alzheimer’s disease, and/or Parkinson’s disease)
| Groups: N | Tasks | Behavioral performance | Prediction of group membership with social cognition? | Comparison with other cognitive measures? | Brain structure associations | Brain function associations | |
| Chiu et al., 2018 [93] | AD: 21 bvFTD: 25 MDD: 20 HC: 31 | Congruent and incongruent emotion intensity rating task (pictures from FEEST) | –Congruent score: bvFTD < AD = HC bvFTD < MDD MDD > HC –Incongruent score: bvFTD > AD = MDD = HC | Yes, ROC curve analyses AUC in discriminating bvFTD versus MDD: –Congruent and incongruent ratings: from 93% to 98% –Contrast score (both ratings types): 99% | No | NA | NA |
| Dodich et al., 2018 [94] | AD: 47 bvFTD: 48 | Ekman-60 SET SNQ | bvFTD < AD (social cognition Z score comprising all tasks) | Yes, logistic regression analyses Social cognition + FBI + MMSE was the best combination in differentiating bvFTD (85% accuracy) from AD (90% accuracy) | No | NA | NA |
| Gossink et al., 2018 [95] | bvFTD: 22 Other NDs: 24 Psychiatric disorders: 33 | Ekman-60 Faux-Pas test | bvFTD < other NDs and psychiatric disorders on Ekman-60 bvFTD = other NDs and psychiatric disorders on Ekman-60 | Yes, logistic regression and ROC analyses Sensitivity of 66.7% and specificity of 68.2% for the Ekman-60 test in discriminating bvFTD versus other NDs and psychiatric disorders Faux-Pas not significant as predictor | Yes No significant groups’ differences in executive functioning, memory, attention/concentration/tempo, despite its association with social cognition Only visuospatial functioning was significantly better in psychiatric disorders | NA | NA |
| Schroeter et al., 2018 [59] | bvFTD: 86 HC: 43 | Modified RMET | bvFTD < HC | Yes, ROC analyses AUC for RMET in discriminating bvFTD versus HC: 0.89 | Yes –CDR, FTLD-CDR, and informant-report behavioral questionnaires: almost perfect discrimination (superior to all measures) –Verbal fluency (semantic and phonemic): high discrimination (better than RMET) –Executive functions (Stroop test, TMT, and Hamasch-Five-Point Test): low discrimination | NA | |
| Reul et al., 2017 [5] | AD: 43 bvFTD: 26 | Ekman-35 | bvFTD = AD | No, Ekman-35 score was not statistically selected (i.e., not discriminative quality) | Yes, discriminant function analysis Verbal recall, figure copy, imitation of face postures and imitation of limb gestures: correct classification of patients as bvFTD (77%) or AD (90%) Attention and executive functions: not discriminative quality | NA | NA |
| Chiu et al., 2016 [11] | AD: 21 bvFTD: 25 MDD: 21 HC: 31 | Emotion intensity rating task (pictures from FEEST) | bvFTD < HC MDD > HC AD = HC (negative emotions) | Yes, ROC curve analyses Sensitivity, specificity in discriminating bvFTD versus MDD: - Total score: 91%, 76% - Negative emotions: 91%, 80% | No | NA | NA |
| Bertoux et al., 2015 [96] | AD: 33 bvFTD: 60 HC: 30 | Ekman-35 | bvFTD < AD < HC | Yes, logistic regression analyses Accuracy for the Ekman-35 total score in differentiating bvFTD versus AD: 76.7% | No | NA | NA |
| Buhl et al., 2013 [97] | AD: 10 bvFTD: 11 | Emotion Hexagon RMET TASIT-EET-SI-M | bvFTD < AD on all tasks’ total scores | Yes, logistic regression and ROC curve analyses Accuracy in discriminating bvFTD versus AD: –RMET: 81% –TASIT-SI-M: 76% –Emotion Hexagon: 71% –TASIT-EET: 71% No added benefit in combining various social cognition tests in the model | Yes Executive tests (FAB, Hayling and Brixton): less classification ability than each of the four social cognition tests | NA | NA |
| Narme et al., 2013 [98] | AD: 13 FTLD (bvFTD + SD): 13 HC: 26 | Ekman-60 Faux-Pas test Yoni task | FRLD < AD < HC on Ekman-60 AD < HC on Ekman-60 (fear) FTLD < AD = HC on Faux-Pas test | Yes, ROC curve analyses Socioemotional Index > 1 (i.e., impairment in more than one social cognition test) had good sensitivity (69%) and specificity (100%) for diagnosing FTLD | Yes Cognitive dysexecutive syndrome, behavioral dysexecutive syndrome, and behavioral change (disinterest): less accurate discrimination | NA | NA |
| Torralva et al., 2009 [35] | bvFTD-high cognitive status: 16 bvFTD-low cognitive status: 19 HC: 14 | Executive and social cognition battery, including:–Multiple Errands Test Hospital Version–The Hotel Task –IGT –RMET –Faux-Pas Test | bvFTD-high cognitive status = bvFTD-low cognitive status < HC on social cognition global score | Yes, ROC curve analyses The social cognition global score showed a sensitivity of 88.9% and a specificity of 94.3% in differentiating bvFTD versus HC | Yes bvFTD-high cognitive status = HC in standard cognitive tests Executive functions (WCST -total score and preservative errors-, digits backwards span, TMT-B): significantly lower ROC curve values than social cognition global score in differentiating bvFTD versus HC | NA | NA |
| Diehl-Schmid et al., 2007 [99] | bvFTD: 33 HC: 25 | Ekman-60 | FTD < HC | Yes, ROC curve analyses Accuracy for the Ekman-60 total score in discriminating bvFTD versus HC: 97% (sensitivity: 94%, specificity: 100%) | No | NA | NA |
Studies in this table were identified through a systematic literature search (see legend of Table 1 for details). Inclusion criteria were (i) authors assess at least one of the following diagnostic groups: bvFTD, Alzheimer’s disease, Parkinson’s disease, and (ii) report group membership prediction with FER and/or ToM tasks other than SEA/MiniSEA. AD, Alzheimer’s disease; AUC, area under the curve; bvFTD, behavioral variant frontotemporal dementia; CDR, Clinical Dementia Rating; FAB, Frontal Assessment Battery; FAST, Facial Affect Selection Test; FBI, Frontal Behavioral Inventory; FEEST, Facial Expressions of Emotion - Stimuli and Tests; FTD, frontotemporal dementia; FTLD, frontotemporal lobar degeneration; HC, healthy controls; IGT, Iowa Gambling Task; IRI, Interpersonal Reactivity Index; MDD, Major depressive disorder; MMSE, Mini-Mental State Exam; NA, not assessed; NDs, neurodegenerative diseases; RMET, Reading the Mind in the Eyes Test; ROC, receiver-operating characteristic; SD, semantic dementia; SET, Story-based Empathy Task; SNQ, Social Norms Questionnaire; TASIT-EET, The Awareness of Social Inference Test - Emotion Evaluation Test; TASIT-SI-M, The Awareness of Social Inference Test - Social Inference-Minimal Test; TMT, Trail Making Test; WCST, Wisconsin Card Sorting Task.
FER and ToM deficits are pervasive in bvFTD patients, even compared with other measures [4]. CS also discriminates them from controls, albeit with less specificity than social cognition and EF [5]. Social cognition impairments in bvFTD are related to fronto-temporo-insular atrophy [6] and fronto-amygdalar networks [2, 7, 8], but neural associations of diagnostic classification remain unreported.
In AD, FER-ToM deficits (Tables 1 and 2, and Supplementary Table 1) seem secondary to CS impairments, offering lower classification power than other cognitive measures [5] and less sensitivity than for bvFTD [4, 9–11]. Though no classification study on AD has examined neural correlates, FER/ToM deficits are associated with patients’ temporo-posterior atrophy [6, 12] and activation [13].
In PD, classification studies are wanting, but FER/ToM deficits are present in 64% of reports [14]. These deficits are linked to basal [2] and fronto-posterior volumes [15, 16] and networks [17, 18]. As each disease exhibits different core correlates (with frontal, temporal, and parietal involvement predominating in bvFTD, AD, and PD, respectively), dimensional approaches could reveal distinct pathophysiological and anatomical signatures in them.
Beyond these reports and isolated studies targeting one or two of these diseases, no study has tested the power of social cognition, vis-à-vis CS and EF, to predict diagnosis across them. Also, unlike atrophy correlates of social cognition and neurodegeneration, network properties have been rarely reported –and no work has tested whether ensuing diagnostic probabilities can predict anatomical and FC markers of neurodegeneration.
Here, we used the Mini-Social Cognition and Emotional Assessment (MiniSEA), a gold standard measure of FER and ToM in neurodegeneration (Table 1), to test the predictive value of social cognition (together with CS and EF) outcomes and their structural and FC correlates across neurodegenerative subtypes. We aimed at establishing the best combination of social cognition and cognitive measures (CS and EF) to predict individual diagnostic probabilities via MDA scores. Such probabilities are normalized relative to healthy controls’ outcomes, enabling comparisons among standardized measures of sociodemographically diverse patient samples. We also implemented a standard receiver-operating characteristic (ROC) approach. To evaluate whether classification scores predict plausible anatomical markers, we explored associations between discriminant scores and expected patterns of atrophy and FC in each condition. The information about previous studies provided in the tables offers an integrated reference point for readers, but will not be subject to systematic review, since it is out of the scope of the current work. However, we have properly discussed the findings which are more relevant for our results in the Discussion section.
We anticipated that, for bvFTD, social cognition would provide a better prediction than CS and EF alone; and that diagnostic probabilities would be associated with fronto-temporo-insular atrophy and fronto-amygdalar networks. For AD, we hypothesized that, beyond social cognition deficits, CS would be more sensitive for diagnostic prediction, with pathophysiological signatures involving temporo-parietal atrophy and posterior networks. Finally, for PD, social cognition deficits were expected to rank among the top predictors (despite yielding lower classification rates), with outcomes being linked to fronto-posterior anatomical markers and networks.
METHODS
Participants
This study comprised 223 participants from three clinical centers, located in Argentina, Chile and Colombia, that take part in a multicenter protocol [19, 20]. Twenty patients (14 from Argentina and 6 from Chile) met the revised criteria for probable bvFTD, lacked primary language deficits, and showed frontotemporal atrophy (Supplementary Table 2).
Thirty-three patients (16 from Argentina and 17 from Chile) fulfilled NINCDS-ADRDA criteria for typical AD, presented memory deficits, and middle-temporal/hippocampal atrophy—alongside decreased gray matter (GM) volume in other regions often affected in AD (Supplementary Table 3). Patients with logopenic progressive aphasia and atypical forms of AD were excluded.
Fifty-one PD patients (8 from Argentina, 15 from Chile, and 28 from Colombia) met the United Kingdom PD Society Brain Bank criteria. Motor impairments and disease stage were assessed through the Unified Parkinson’s Disease Rating Scale and the Hoehn & Yahr Scale, respectively. All patients were evaluated during the “on” phase of medication. Patients had no symptoms of PD-plus or antecedents of deep brain stimulation.
Patients’ clinical diagnoses were established by a multidisciplinary team following formal criteria, as done in previous multicentric studies [19–25]. To align local sites’ procedures, each center used the Multi-Partner Consortium to Expand Dementia Research in Latin America (ReDLat) standardized diagnostic assessment [19, 20]. It consists of a brief questionnaire to be fulfilled for every participant incorporating impressions from the evaluating neurologist and neuropsychologist. Also, all centers used a common training manual for clinical and cognitive assessment and a quality assurance checklist. Thus, all participants performed a harmonized extensive battery of neurological, neuropsychiatric, and neuropsychological assessments. These procedures prevent potential biases in participants’ assessment and diagnosis across centers.
The performance of bvFTD, AD, and PD patients was compared with that of 29, 35, and 55 healthy controls, respectively (10 from Argentina, 23 from Chile, and 23 from Colombia). Matching criteria (age, sex, and years of education) are provided in Table 3. No subject in any group reported a history of alcohol/drug abuse, psychiatric conditions, or other neurological illnesses. All participants provided written informed consent following the Declaration of Helsinki. The institutional Ethics Committee of each center approved the protocol.
Table 3
Demographic, cognitive, and social cognition data
| bvFTD patients (n = 20) | AD patients (n = 33) | PD patients (n = 51) | CN-bvFTD (n = 29) | CN-AD (n = 35) | CN-PD (n = 55) | bvFTD versus CN | AD versus CN | PD versus CN | |
| Mean (SD) | Mean (SD) | Mean (SD) | Mean (SD) | Mean (SD) | Mean (SD) | p | p | p | |
| Demographics | |||||||||
| Age (years)a | 68.9 (10.1) | 75.5 (6.1) | 68.9 (7.9) | 66.7 (6.1) | 74.1 (4.8) | 68.1 (6.0) | 0.352 | 0.268 | 0.560 |
| Sex (M:F)b | 15:5 | 16:17 | 31:20 | 24:5 | 13:22 | 30:25 | 0.508 | 0.345 | 0.516 |
| Education (y)a | 14.8 (5.1) | 11.2 (4.9) | 11.5 (5.2) | 13.4 (4.3) | 12.0 (4.8) | 12.2 (3.9) | 0.297 | 0.492 | 0.439 |
| Cognitive assessment | |||||||||
| MoCA total scorea | 19.7 (6.5) | 16.6 (4.0) | 23.8 (4.3) | 27.2 (2.5) | 25.8 (3.7) | 26.8 (3.2) | < 0.001** | < 0.001** | < 0.001** |
| IFS total scorea | 17.4 (6.4) | 14.1 (4.3) | 18.6 (5.5) | 22.6 (3.6) | 20.7 (3.9) | 22.1 (3.9) | < 0.001** | < 0.001** | < 0.001** |
| Social cognition assessment | |||||||||
| MiniSEA total scorea | 19.5 (7.8) | 21 (3.4) | 21.6 (4.3) | 25.5 (2.0) | 25.0 (2.1) | 25.2 (2.1) | < 0.001* | < 0.001** | < 0.001** |
AD, Alzheimer’s disease; bvFTD, behavioral variant frontotemporal dementia; CN-AD, Controls matched with the AD patients; CN-bvFTD, Controls matched with the bvFTD patients; CN-PD, Controls matched with the PD patients; IFS, INECO Frontal Screening battery; MiniSEA, Mini Social Cognition and Emotional Assessment; MoCA, Montreal Cognitive Assessment; PD, Parkinson’s disease. a p values were calculated through independent t-test. b p values were calculated through chi-squared test (χ2). *Alpha level set at 0.05.
Materials
CS and EF
Participants’ general CS and EFs were assessed with the Montreal Cognitive Assessment (MoCA) [26] and the INECO Frontal Screening (IFS) battery [27], respectively. There were not missing data in these variables.
The MoCA [26] is a sensitive cognitive screening tool for patients with neurodegenerative diseases [28–31]. It comprises 14 subtests evaluating various cognitive domains, namely: attention and concentration, executive functions, memory, language, visuoconstructional and visuospatial skills, conceptual thinking, calculations, and orientation. Its maximum score is 30, with higher scores indicating better performance.
The INECO Frontal Screening (IFS) battery [27] is a sensitive instrument for detecting executive dysfunction in neurological and neuropsychiatric disorders [27, 32, 33]. It includes eight subtests: 1) motor programing (Luria series: “fist, edge, palm”); 2) conflicting instructions (hitting the table once when the administrator hits it twice or hitting it twice when the administrator hits it only once); 3) motor inhibitory control; 4) numerical working memory (backward digit span); 5) verbal working memory (months backward); 6) spatial working memory (modified Corsi tapping test); 7) abstraction capacity (inferring the meaning of proverbs); and 8) verbal inhibitory control (modified Hayling test). Its maximum score is 30, with higher scores indicating better performance.
MiniSEA
All participants performed the MiniSEA (version published in the native language of the corresponding country [20, 25, 34, 35]), which comprises two subtests: a FER test and a shortened version of the Faux Pas test, tapping ToM. The total MiniSEA score is the sum of both subscores, yielding a maximum score of 30.
MRI scanning
A subsample (n = 176) of 16 bvFTD, 30 AD, 43 PD patients, and their matched controls (totaling 17, 30, and 40 subjects, respectively) underwent structural T1 scans. Resting-state fMRI recordings (n = 168) were obtained from 14 bvFTD, 27 AD, 41 PD patients and their matched controls (17, 30, and 39, subjects respectively)—see matching criteria in Supplementary Table 4. Five participants did not perform the resting-state fMRI recordings adducing claustrophobia and 3 were excluded due to excessive motion. Image acquisition parameters and scanning protocols followed in each center are detailed in the Supplementary Material.
Data analysis
Behavioral data
Demographic and cognitive data were compared between groups using independent t and chi-squared tests, as needed.
To predict individual diagnostic probabilities (bvFTD, AD, PD) with social cognition and cognitive measures (CS and EF) we used MDA, a multivariate method that combines independent variables by selecting and assessing the discriminant power of predictor variables applied in each group. It is based on a factor analytic method, which can classify the participants in different groups according to the discriminative capacity of selected predictors. This technique was chosen since it is used for classifying subjects into groups based on assorted measurements and because it allows for parsimonious interpretations [36].
First, to determine which measures best discriminate between patients and controls, we performed six MDAs for each of the following group pairs: (a) bvFTD patients and controls, (b) AD patients and controls, and (c) PD and controls. Second, to determine which (combination of) measures best discriminate between patient groups, we implemented six additional MDAs for each of the following group pairs: (a) bvFTD and AD, (b) bvFTD and PD, and (c) AD and PD.
Each MDA included the following predictors: 1) MiniSEA total score alone, 2) MoCA total score alone, 3) IFS total score alone, 4) MiniSEA total score jointly with MoCA total score, 5) MiniSEA total score jointly with IFS total score, and 6) MiniSEA total score jointly with MoCA and IFS total scores.
Also, we performed ROC curves analyses to test whether the best predictors (composite scores) identified by the MDAs successfully discriminated between patients and controls and between patient groups. Alpha levels were set at 0.05 for all analyses.
VBM
MRI acquisition and preprocessing steps followed guidelines from the Organization for Human Brain Mapping [37]. Images were preprocessed using the DARTEL Toolbox following reported procedures [38]. Then, modulated 10-mm full-width half-maximum kernel-smoothed images [39] were normalized to the MNI space and analyzed through general linear models for 2nd level analyses on SPM-12 software. Based on previous literature [40, 41], to analyze the images of each center together and avoid scanner bias in our results, the normalized and smoothed outputs were transformed to W-score images adjusted for specific covariates (age, disease, total intracranial volume, and scanner type). W-scores, similar to Z-scores (mean = 0, SD = 1), represent the degree to which the observed GM volume in each voxel is higher or lower (positive or negative W-score) than expected, relative to the healthy control sample of each acquisition center.
We performed whole-brain multiple regression analyses to identify GM regions (W-score maps) associated with individual discriminant scores from the models that best discriminated between patients and controls. To render these associations more interpretable, we transformed individual discriminant scores by subtracting them from the centroid of the control group. Thus, a larger value in these transformed scores indicates that the corresponding case had higher probability of belonging to the patient group. Associations were studied in each group of patients conjointly with controls to increase behavioral variance and statistical power [42]. The transformed discriminant scores for the two models that best discriminated between each group of patients and controls were included independently as predictors. For all analyses, we set a p value < 0.001, uncorrected, with an extend threshold ≥ 30 voxels [37, 43].
Functional connectivity analysis
The first five volumes of each subject’s resting-state sequence were discarded. Then, as in previous FC reports [44], images were preprocessed with the Data Processing Assistant for Resting-State fMRI (DPARSF V4.3; http://rfmri.org/DPARSF). Following previous studies [44, 45], pre-processing steps included 1) slice-timing correction (using middle slice of each volume as the reference scan), 2) realignment to the first scan of the session to correct head movement, 3) normalization to the MNI space using the echo-planar imaging (EPI) template from SPM, 4) smoothing using a 8-mm full-width-at-half-maximum isotropic Gaussian kernel, and 5) bandpass filtering (0.01–0.08 Hz). Six motion parameters, CFS, and WM signals were regressed to reduce the effect of motion and physiological artifacts such as cardiac and respiration effects (REST V1.7 toolbox). Motion parameters were estimated during realignment and CFS and WM masks were derived from the tissue segmentation of each subject’s T1 scan in native space with SPM12 (after co-registration of each subject’s structural image with the functional image). Included participants did not show translation movements greater than 3 mm and/or rotations higher than 3°. There were not statistically significant differences between groups in translation and rotation motion parameters (see Supplementary Table 4).
FC analysis was performed as follows. First, for each subject, we extracted the mean time course of the BOLD signal in each of the 116 regions of the Automated Anatomical Labelling Atlas (AAL), by averaging the signal in all voxels comprising each region. Second, we constructed a connectivity matrix for each subject indicating the strength of association between all pairs of regions (Pearson’s correlation coefficient; DPARSF toolbox). Third, we performed a Fisher z-transformation. Finally, to avoid scanner type effects in our results, we performed a site normalization following published procedures for multicenter-imaging data [21]. The FC data of each participant (patients and controls) were z-scored based on the mean and standard deviation of the corresponding center’s controls [21]. The resulting FC z-scores between all pairs of regions (AAL atlas) were used to perform Spearman’s correlations with discriminant scores for each patient’s group alongside its respective control group. To consider results as significant, the alpha level was set at p < 0.001 (whole-brain, uncorrected) [25].
RESULTS
Demographic data, CS, EF, and MiniSEA
Results are summarized in Table 3. Compared to their respective controls, bvFTD, AD, and PD patients exhibited lower total MoCA, IFS, and MiniSEA scores.
MDA analyses
Here and in Table 4, we summarize the top predictive models (yielding accuracy > 70%). Remaining models are summarized in Supplementary Tables 5 and 6.
Table 4
Discriminant functions and classification of models with the best classification accuracy
| Predictor variable | Standardized coefficient | Discriminant function | Classification accuracy (%) |
| bvFTD patients and controls | |||
| MoCA and MiniSEA total scores | |||
| MiniSEA | 0.424 | Wilkis’s λ= 0.493 | 85.7 (75.0:93.1) |
| MoCA | 0.833 | χ2(2) = 32.52 | |
| p < 0.0001 | |||
| MoCA, IFS and MiniSEA total scores | |||
| MiniSEA | 0.620 | Wilkis’s λ= 0.472 | 83.7 (70.0:93.1) |
| MoCA | 0.946 | χ2(3) = 34.19 | |
| IFS | –0.402 | p < 0.0001 | |
| AD patients and controls | |||
| MoCA total score | 1.000 | Wilkis’s λ= 0.408 | 89.7 (90.9:88.6) |
| χ2(1) = 58.71 | |||
| p < 0.0001 | |||
| MiniSEA, MoCA, and IFS total scores | |||
| MiniSEA | 0.322 | Wilkis’s λ= 0.386 | 85.3 (81.8:88.6) |
| MoCA | 0.903 | χ2(3) = 61.43 | |
| IFS | –0.070 | p < 0.0001 | |
| MiniSEA and MoCA total scores | |||
| MiniSEA | 0.309 | Wilkis’s λ= 0.386 | 85.3 (81.8:88.6) |
| MoCA | 0.862 | χ2(2) = 61.81 | |
| p < 0.0001 | |||
| PD patients and controls | |||
| MiniSEA total score | 1.000 | Wilkis’s λ= 0.769 | 74.5 (64.7:83.6) |
| χ2(1) = 27.13 | |||
| p < 0.0001 | |||
| MiniSEA and IFS total scores | |||
| MiniSEA | 0.854 | Wilkis’s λ= 0.760 | 72.6 (62.7:81.8) |
| IFS | 0.254 | χ2(2) = 28.25 | |
| p < 0.0001 | |||
| bvFTD and AD patients | |||
| MiniSEA and MoCA total scores | |||
| MiniSEA | –0.199 | Wilkis’s λ= 0.672 | 71.7 (75:70) |
| MoCA | 1.05 | χ2(2) = 17.11 | |
| p < 0.0001 | |||
| MoCA total score | 1.000 | Wilkis’s λ= 0.679 | 71.7 (68.8:73.3) |
| χ2(1) = 16.82 | |||
| p < 0.0001 | |||
| bvFTD and PD patients | |||
| MiniSEA total score | 1.000 | Wilkis’s λ= 0.237 | 98.3 (93.8:100) |
| χ2(1) = 81.38 | |||
| p < 0.0001 | |||
| MiniSEA and MoCA total scores | |||
| MiniSEA | 1.080 | Wilkis’s λ= 0.187 | 98.3 (93.8:100) |
| MocA | –0.545 | χ2(2) = 93.26 | |
| p < 0.0001 | |||
| MiniSEA and IFS total scores | |||
| MiniSEA | 1.24 | Wilkis’s λ= .172 | 98.3 (93.8:100) |
| IFS | –0.714 | χ2(2) = 98.608 | |
| p < 0.0001 | |||
| MiniSEA, MoCA and IFS total scores | |||
| MiniSEA | 1.23 | Wilkis’s λ= 0.165 | 98.3 (93.8:100) |
| MoCA | –0.275 | χ2(3) = 100.74 | |
| IFS | –0.550 | p < 0.0001 | |
| AD and PD patients | |||
| MiniSEA and MoCA total scores | |||
| MiniSEA | 0.755 | Wilkis’s λ= 0.141 | 98.6 (96.7:100) |
| MoCA | –0.364 | χ2(2) = 137.11 | |
| p < 0.0001 | |||
| MiniSEA, MoCA and IFS total scores | |||
| MiniSEA | 0.745 | Wilkis’s λ= 0.138 | 98.6 (96.7:100) |
| MoCA | –0.360 | χ2(3) = 137.671 | |
| IFS | –0.166 | p < 0.0001 |
AD, Alzheimer’s disease; bvFTD, behavioral variant Frontotemporal Dementia; IFS, INECO Frontal Screening battery; MiniSEA, Mini Social Cognition and Emotional Assessment; MoCA, Montreal Cognitive Assessment; PD, Parkinson’s disease.
MDA: bvFTD and controls
The model combining MiniSEA + MoCA most reliably discriminated between bvFTD patients and controls (Fig. 1A), followed by the model conjoining the three scores (MiniSEA, MoCA, IFS). The first model correctly classified 85.7% subjects (75% of bvFTD patients, 93.1% of controls) and the second one reached 83.7% accuracy (70% of bvFTD patients, 93.1% of controls) (Table 4).
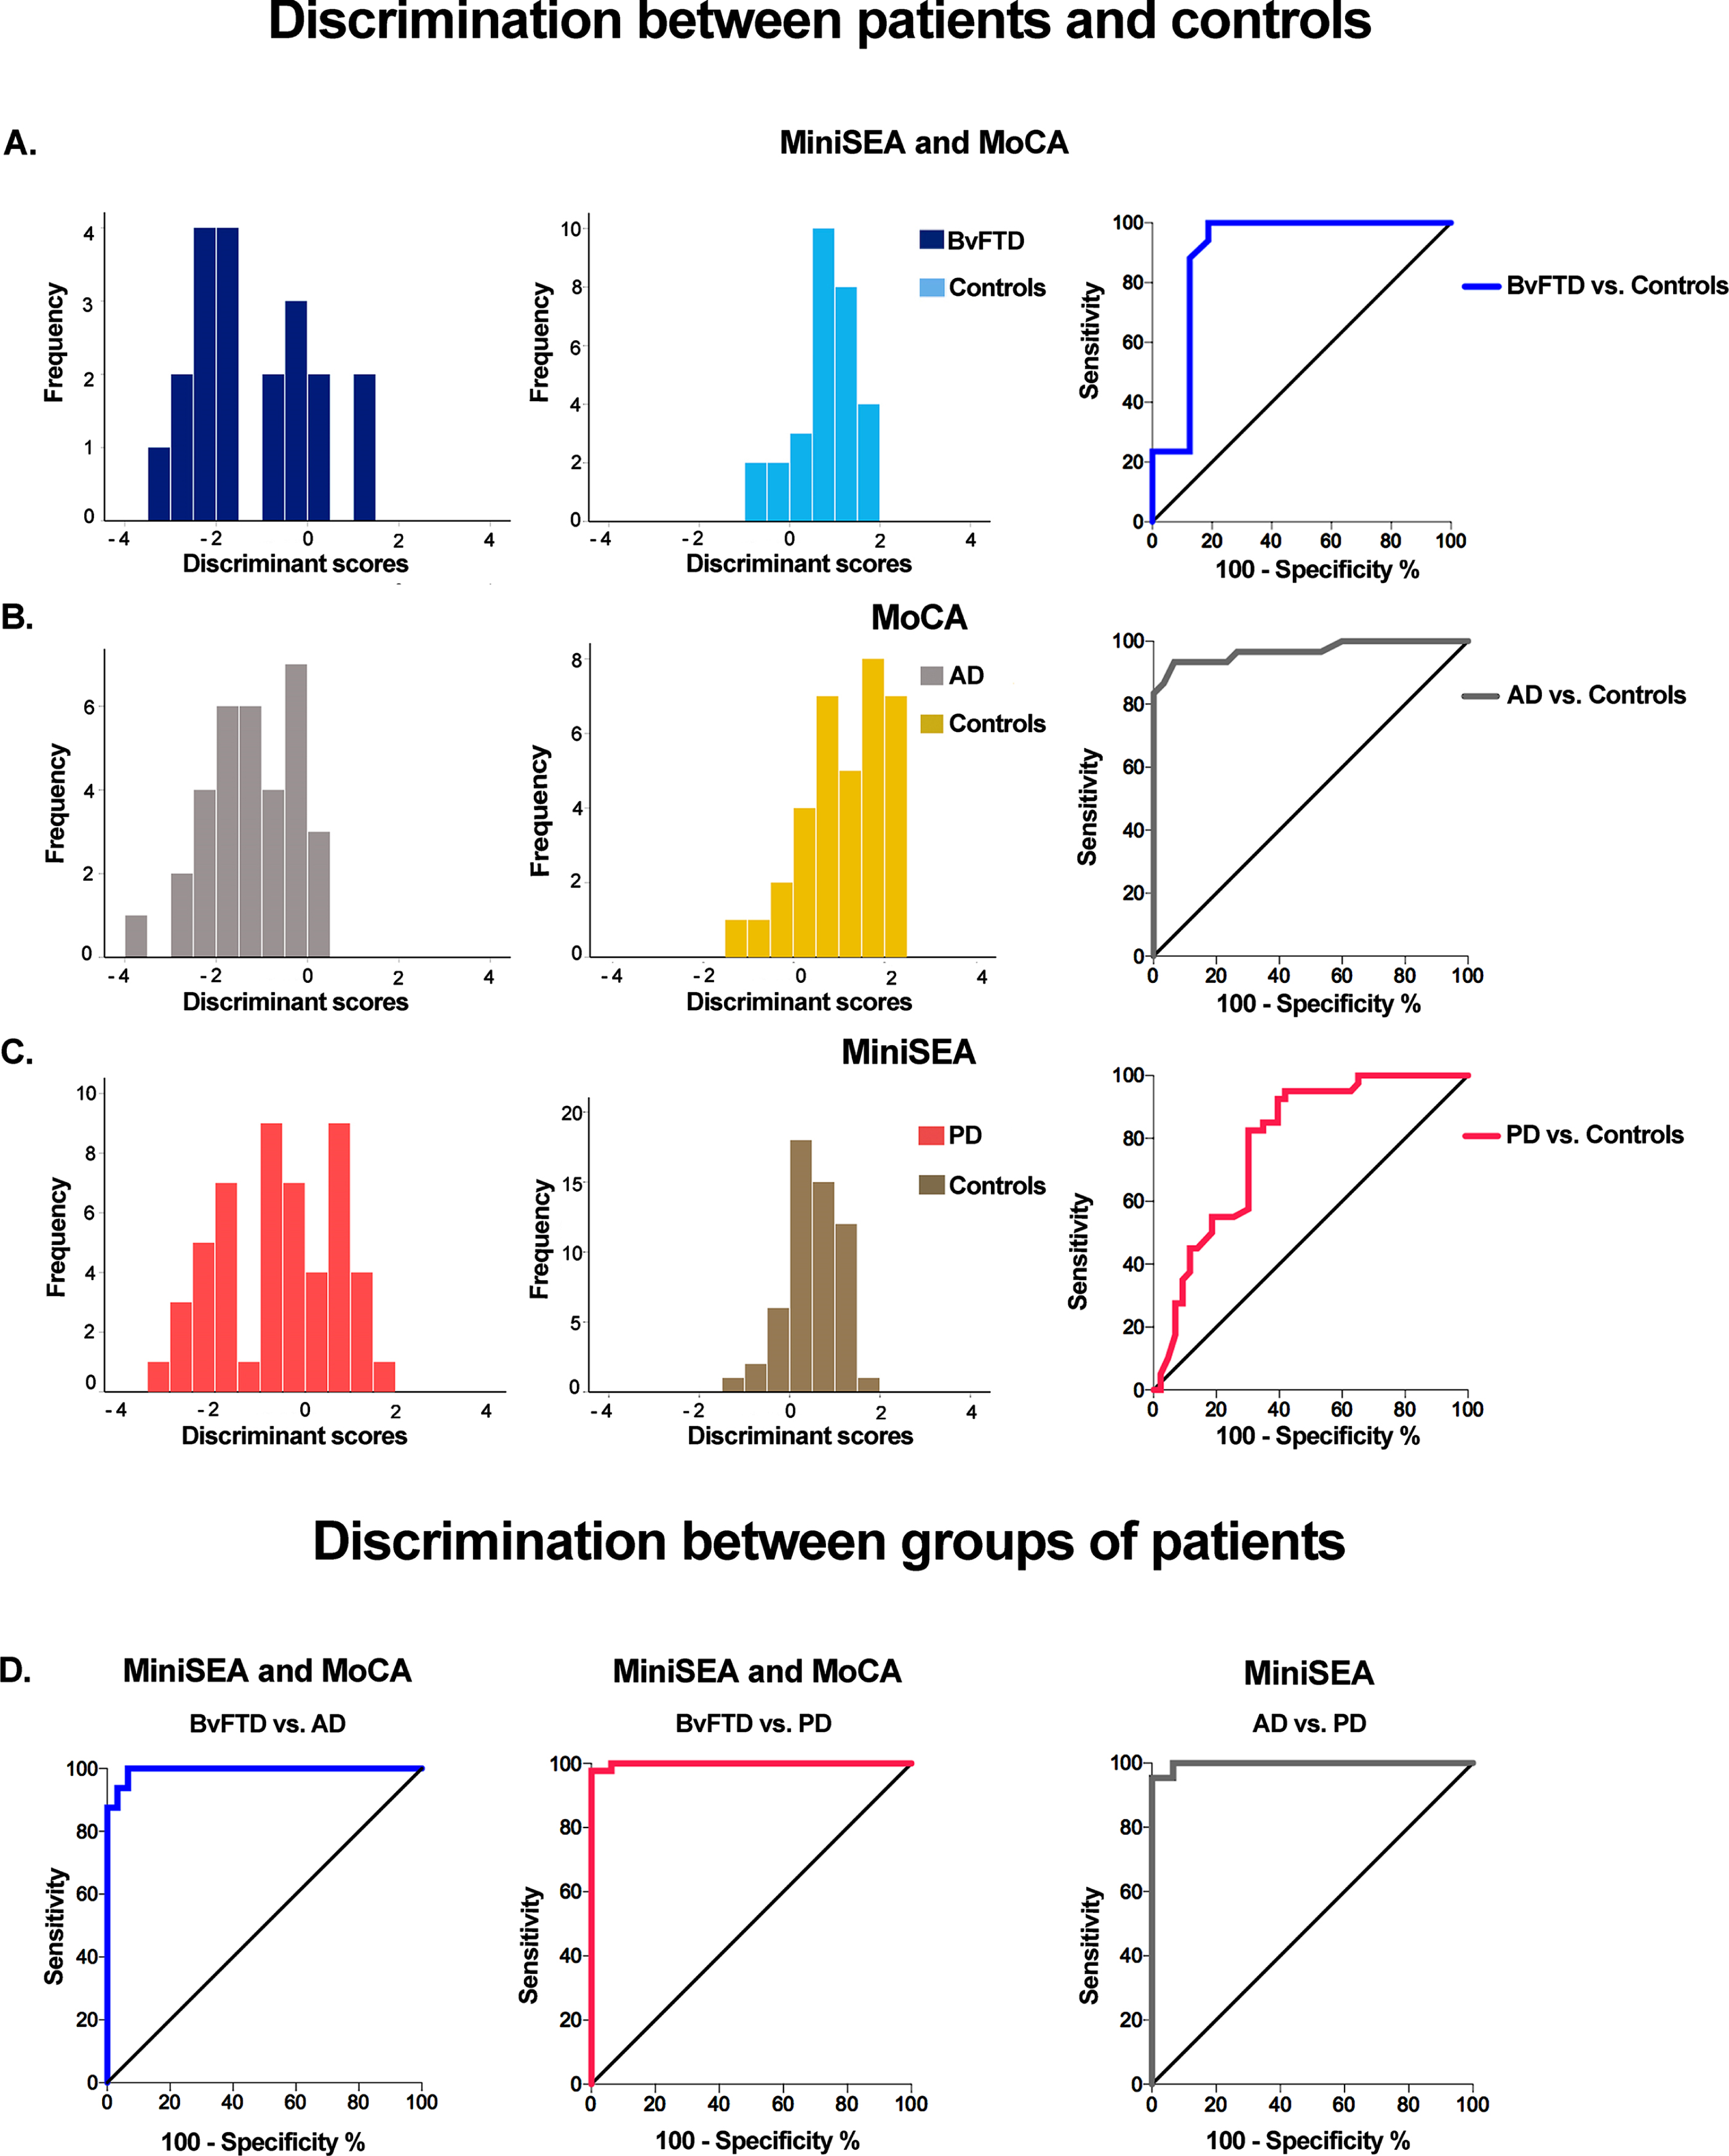
Fig. 1
Classification results based on top social and cognitive scores. A) For controls and bvFTD, social cognition (MiniSEA) and CS (MoCA) provided the best MDA classification accuracy (85.7%, first and second columns) and AUC (0.95, last column). B) For controls and AD, the MoCA (CS) alone provided the best MDA classification accuracy (89.7%, first and second columns) and AUC (0.96, last column). C) For controls and PD, social cognition (MiniSEA) alone provided the best MDA classification accuracy (74.5% first and second columns) and AUC (0.78, last column). D) Classification between patient groups. The discriminant scores providing the best classification yielded high accuracy (71.7%), sensitivity (100%), and specificity (93%) values for bvFTD versus AD (bottom left inset, social cognition and CS: MiniSEA and MoCA), bvFTD versus PD (bottom center inset, social cognition and CS: miniSEA and MoCA), and AD versus PD (bottom right inset, social cognition: MiniSEA). AD, Alzheimer’s disease; bvFTD, behavioral variant frontotemporal dementia; MiniSEA, Mini Social Cognition and Emotional Assessment; MoCA, Montreal Cognitive Assessment; PD, Parkinson’s disease.
MDA: AD and controls
The MoCA showed the best discrimination accuracy between AD patients and controls (Fig. 1B), followed by the model combining the MoCA + MiniSEA and the model including the three measures. MoCA scores correctly classified 89.7% of cases (90.9% of AD patients, 88.6% of controls). The model including MoCA + MiniSEA and the model including the three measures showed identical accuracy (85.3% of cases into their actual group; 81.8% of AD patients, 88.6% of controls) (Table 4).
MDA: PD and controls
The MiniSEA discriminated most accurately between PD patients and controls (Fig. 1C), followed by the model combining MiniSEA + IFS scores. The first model correctly classified 74.5% of cases (64.7% of PD patients, 83.6% of controls) and the second one reached 72.6% accuracy (62.7% of PD patients, 81.8% of controls) (Table 4).
MDA: bvFTD and AD patients
The model combining MoCA + MiniSEA discriminated most reliably between bvFTD patients and controls, followed by the model including only MoCA. The former correctly classified 71.7% of subject (75% of bvFTD, 70% of AD patients) and the latter reached 71.7% accuracy (68.8% of bvFTD, 73.3% of AD patients) (Table 4).
MDA: bvFTD and PD patients
The MiniSEA correctly classified 98.3% of cases (93.8% of bvFTD, 100% of PD patients). The models combining the MiniSEA + MoCA, MiniSEA + IFS, and the model with the three scores also correctly classified 98.3% of cases (93.8% of bvFTD, 100% of PD patients) (see Table 4).
MDA: AD and PD patients
The model combining the total MiniSEA + MoCA scores correctly classified 98.6% of subjects (96.7% of AD, 100% of PD patients). The model including the three measures showed the same classification accuracy (Table 4).
ROC analyses
Patients versus controls
At a cut-off of 25 points, the average of MiniSEA + MoCA scores yielded a sensitivity of 100% and a specificity of 93% to discriminate between bvFTD and controls (AUC = 0.95, CI: 0.85–1.04; p < 0.001). The MoCA score, at a cut-off of 21.5 points, showed a sensitivity and specificity of 93.33% to discriminate between AD patients and controls (AUC = 0.96, CI: 0.92–1.01; p < 0.001). For PD patients versus controls, the MiniSEA total score reached a sensitivity of 85% and a specificity of 65% at a cut-off of 23 points (AUC = 0.78, CI: 0.68–0.88; p < 0.001) (Figs. 1A-C).
Patient group comparisons
At a cut-off of 16.7 points, the average of MiniSEA + MoCA total scores yielded a sensitivity of 100% and a specificity of 93% to discriminate between bvFTD and AD patients (AUC = 0.99, CI: 0.97–1.00; p < 0.001) and between AD and PD patients (AUC = 0.99, CI: 0.90–1.00; p < 0.001). For bvFTD versus PD patients, the MiniSEA total score reached a sensitivity of 100% and a specificity of 93% at a cut-off of 15 points (AUC = 0.99, CI: 0.99–1.00; p < 0.001) (Fig. 1D).
Relationship between brain volume and discriminant scores
bvFTD
Higher values in the MoCA + MiniSEA discriminant scores (greater probability of belonging to the bvFTD group) were associated with lower GM volumes in frontotemporal, parietal, and insular regions as well as in the basal ganglia and the cerebellum (Fig. 2A, Supplementary Table 7). Other discriminant scores (including MoCA + IFS + MiniSEA) showed similar GM volume associations (Supplementary Table 7).
Fig. 2
Associations between discriminant scores and gray matter volume. Voxel-based morphometry was conducted to identify brain regions associated with top discriminant scores in each patient group in tandem with demographically-matched controls (p < 0.001 uncorrected, extent threshold = 30 voxels). A) BvFTD patients and controls. Social cognition and CS (MiniSEA and MoCA) were associated with frontal (gyrus rectus, superior frontal gyrus), temporal (the superior, middle, and inferior temporal gyri, fusiform gyrus, hippocampus, and parahippocampal gyrus), parietal (postcentral gyrus), and insular regions as well as the basal ganglia. B) AD patients and controls. CS (MoCA) results were associated with temporal (hippocampus, amygdala, parahippocampal gyrus, superior temporal, and fusiform gyri), frontal (superior frontal gyrus), and parietal (postcentral gyrus) regions. C) PD patients and controls. Social cognition (MiniSEA) outcomes were associated with parietal (inferior parietal lobule and precuneus), frontal (frontal superior gyrus and anterior cingulate cortex), and temporal (superior temporal and fusiform gyri) regions. AD: Alzheimer’s disease; bvFTD: behavioral variant frontotemporal dementia; L, left; PD, Parkinson’s disease; R, right.
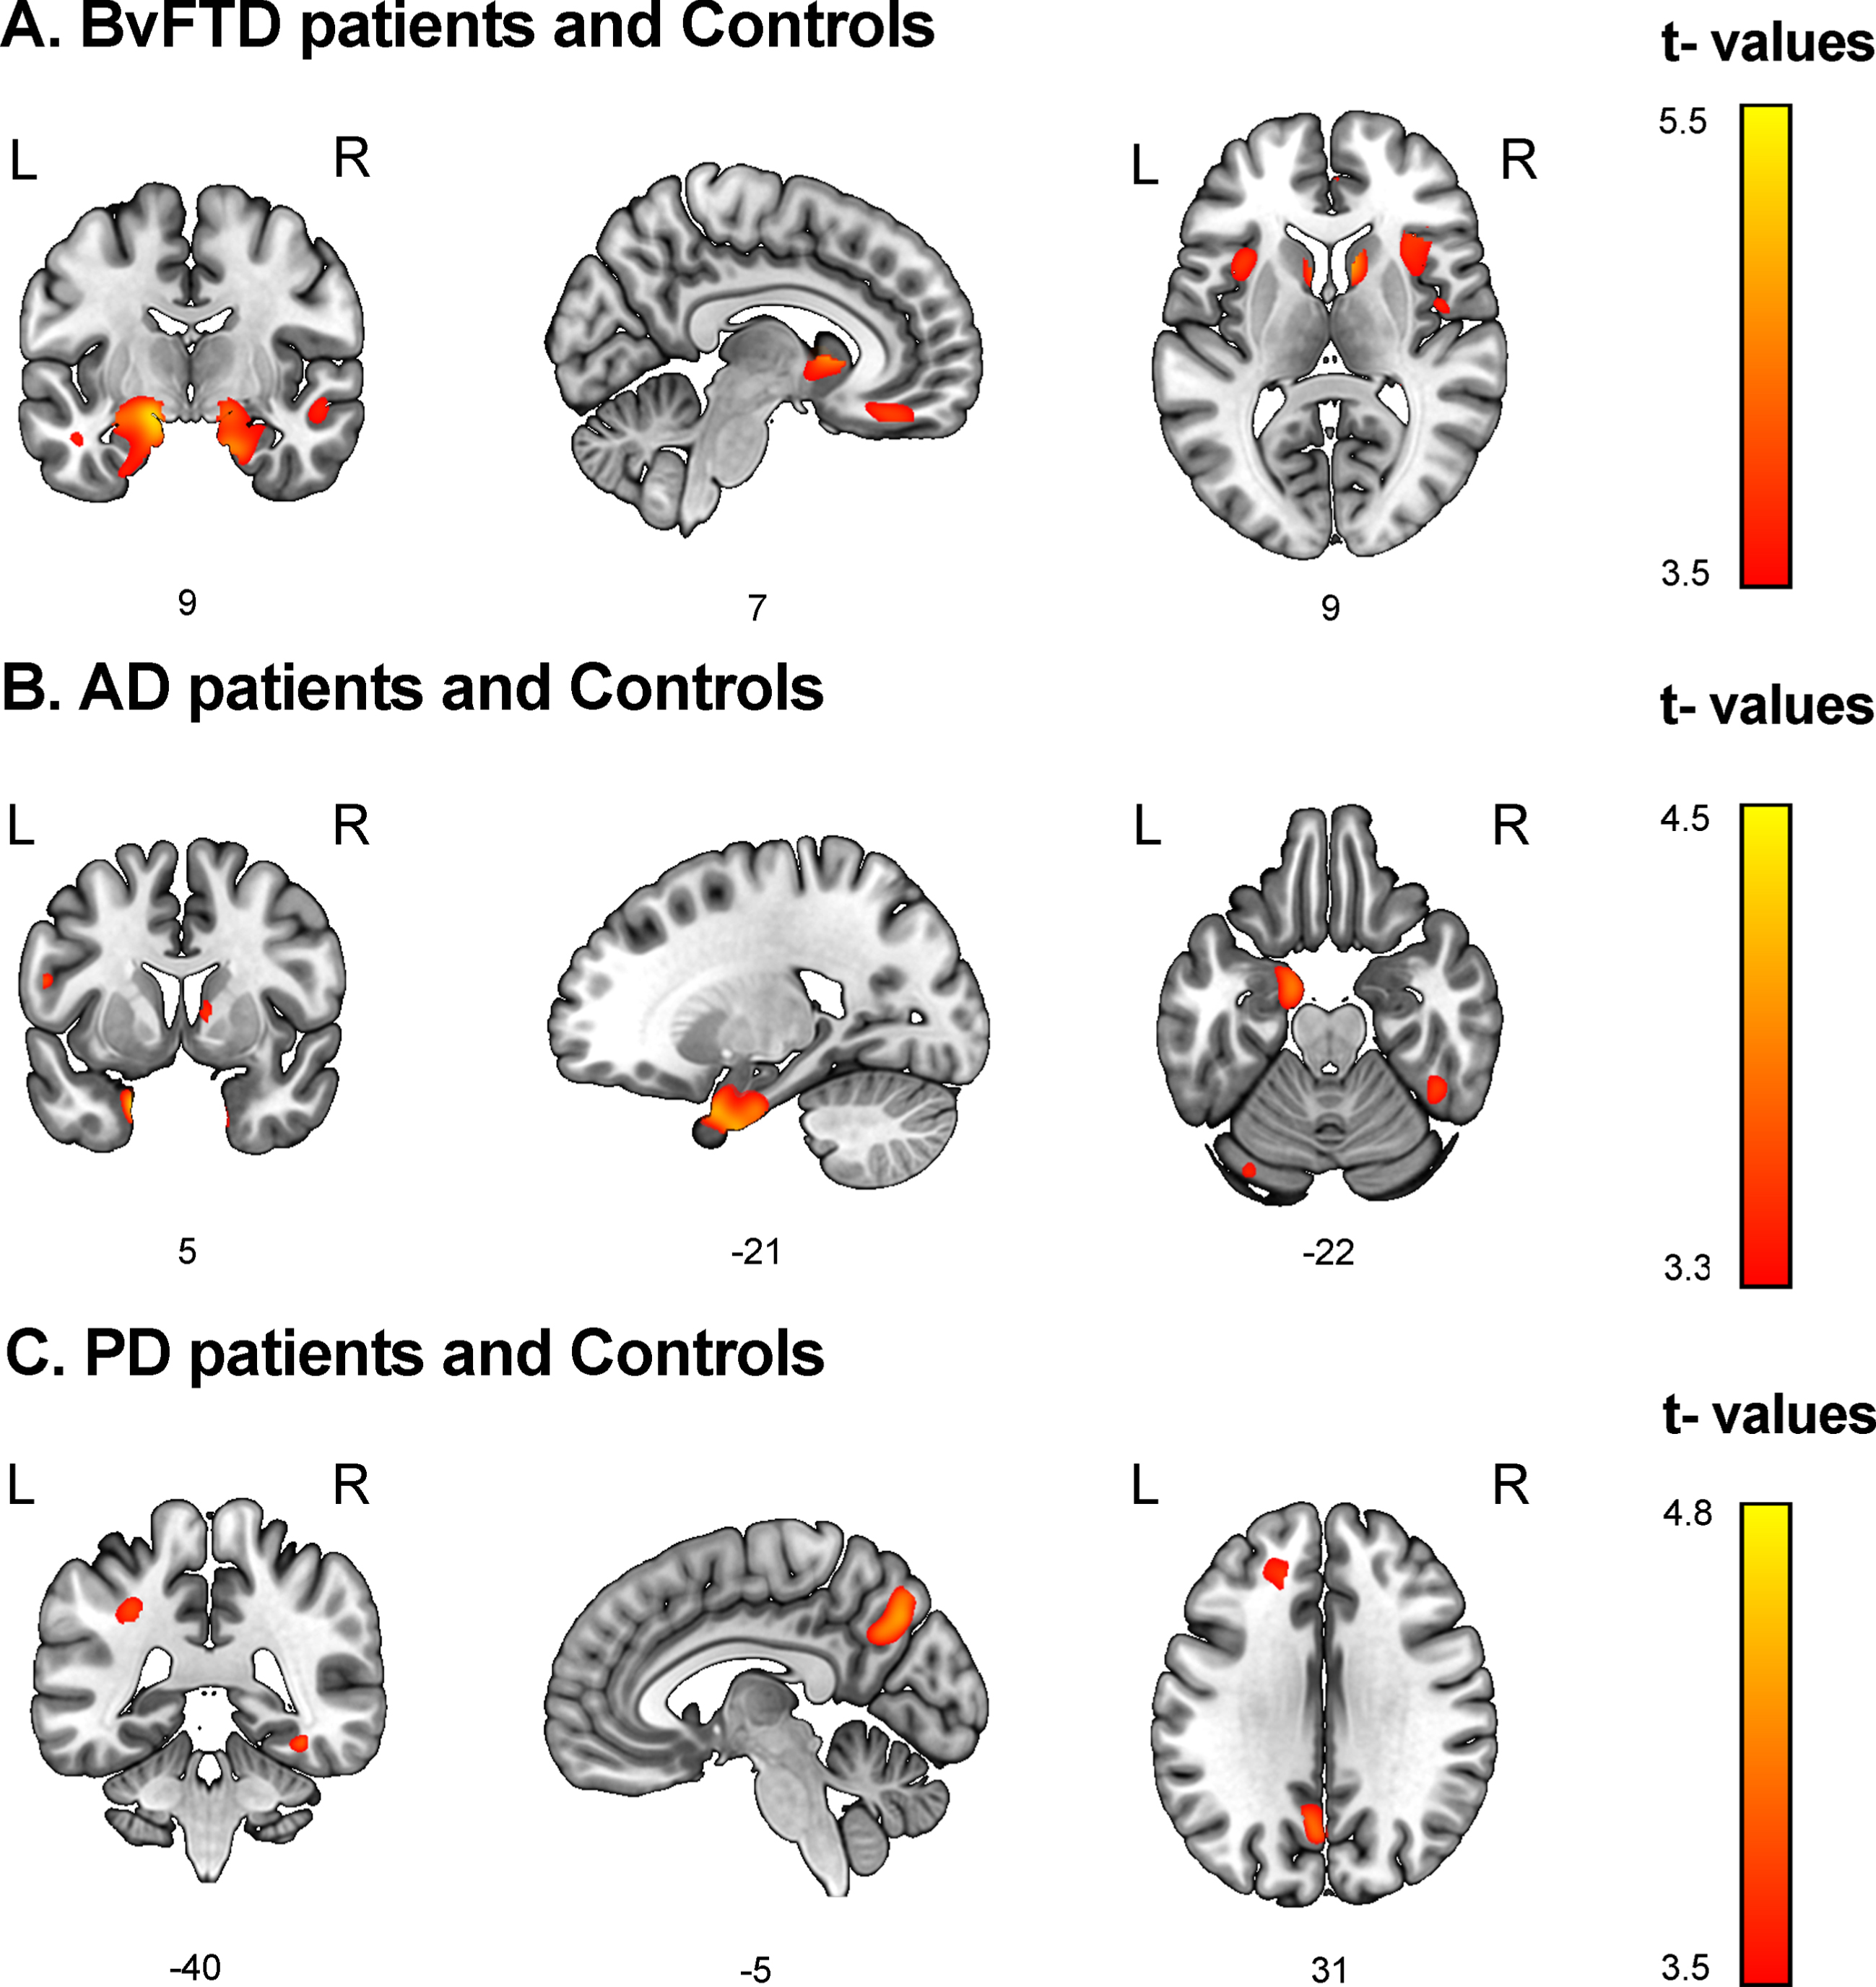
AD
Higher values in the MoCA discriminant scores (greater probability of belonging to the AD group) were associated with lower volumes in temporal, frontal, and parietal regions, and also in the thalamus, caudate, and cerebellum (Fig. 2B, Supplementary Table 8). Associations between discriminant scores from the model including MoCA + MiniSEA and the model including the three measures showed similar GM volume associations (Supplementary Table 8).
PD
Higher values in the MiniSEA discriminant scores (greater probability of belonging to the PD group) were associated with lower GM volumes in parietal, frontal, and temporal regions (Fig. 2C, Supplementary Table 9). Discriminant scores combining IFS + MiniSEA scores showed no significant associations.
Relationship between functional connectivity and discriminant scores
bvFTD patients and controls
Higher discriminant scores from MiniSEA + MoCA scores as predictors were associated with lower FC between frontal and amygdalar hubs. A negative association also emerged between discriminant scores and FC between the left middle temporal gyrus and the cerebellum (Fig. 3A). The same associations were found for the discriminant scores from the model including MoCA, IFS, and MiniSEA scores as predictors.
Fig. 3
Associations between discriminant scores and functional connectivity. Whole-brain analyses over 116 regions of interest from the AAL atlas were performed to test the association between the FC of each pair of brain areas and top discriminant scores in each patient group in tandem with demographically-matched controls (p < 0.001, uncorrected). A) BvFTD patients and controls. Social cognition and CS (MiniSEA and MoCA) outcomes were associated with frontal (inferior frontal gyri/pars triangularis and pars opercularis) and amygdalar networks. B) AD patients and controls. CS (MoCA) results were associated with (a) parietal (parietal superior and inferior lobules, and precuneus and angular gyrus) and frontal (inferior frontal gyrus triangular and orbital, and frontal superior and middle gyri), and (b) parietal superior and inferior lobules, supramarginal gyrus) and basal ganglia (pallidum and putamen) networks. C) PD patients and controls. Social cognition (MiniSEA) results were associated with (a) parietal (parietal superior lobule), temporal (hippocampi) and cerebellar networks, (b) frontal (superior frontal gyrus) and pariental (angular gryus and posterior cingulate) networks, and (c) temporal (inferior temporal gyrus) and occipital (superior occipital gyrus) networks. AD, Alzheimer’s disease; bvFTD, behavioral variant frontotemporal dementia; L, left; PD, Parkinson’s disease; R, right.
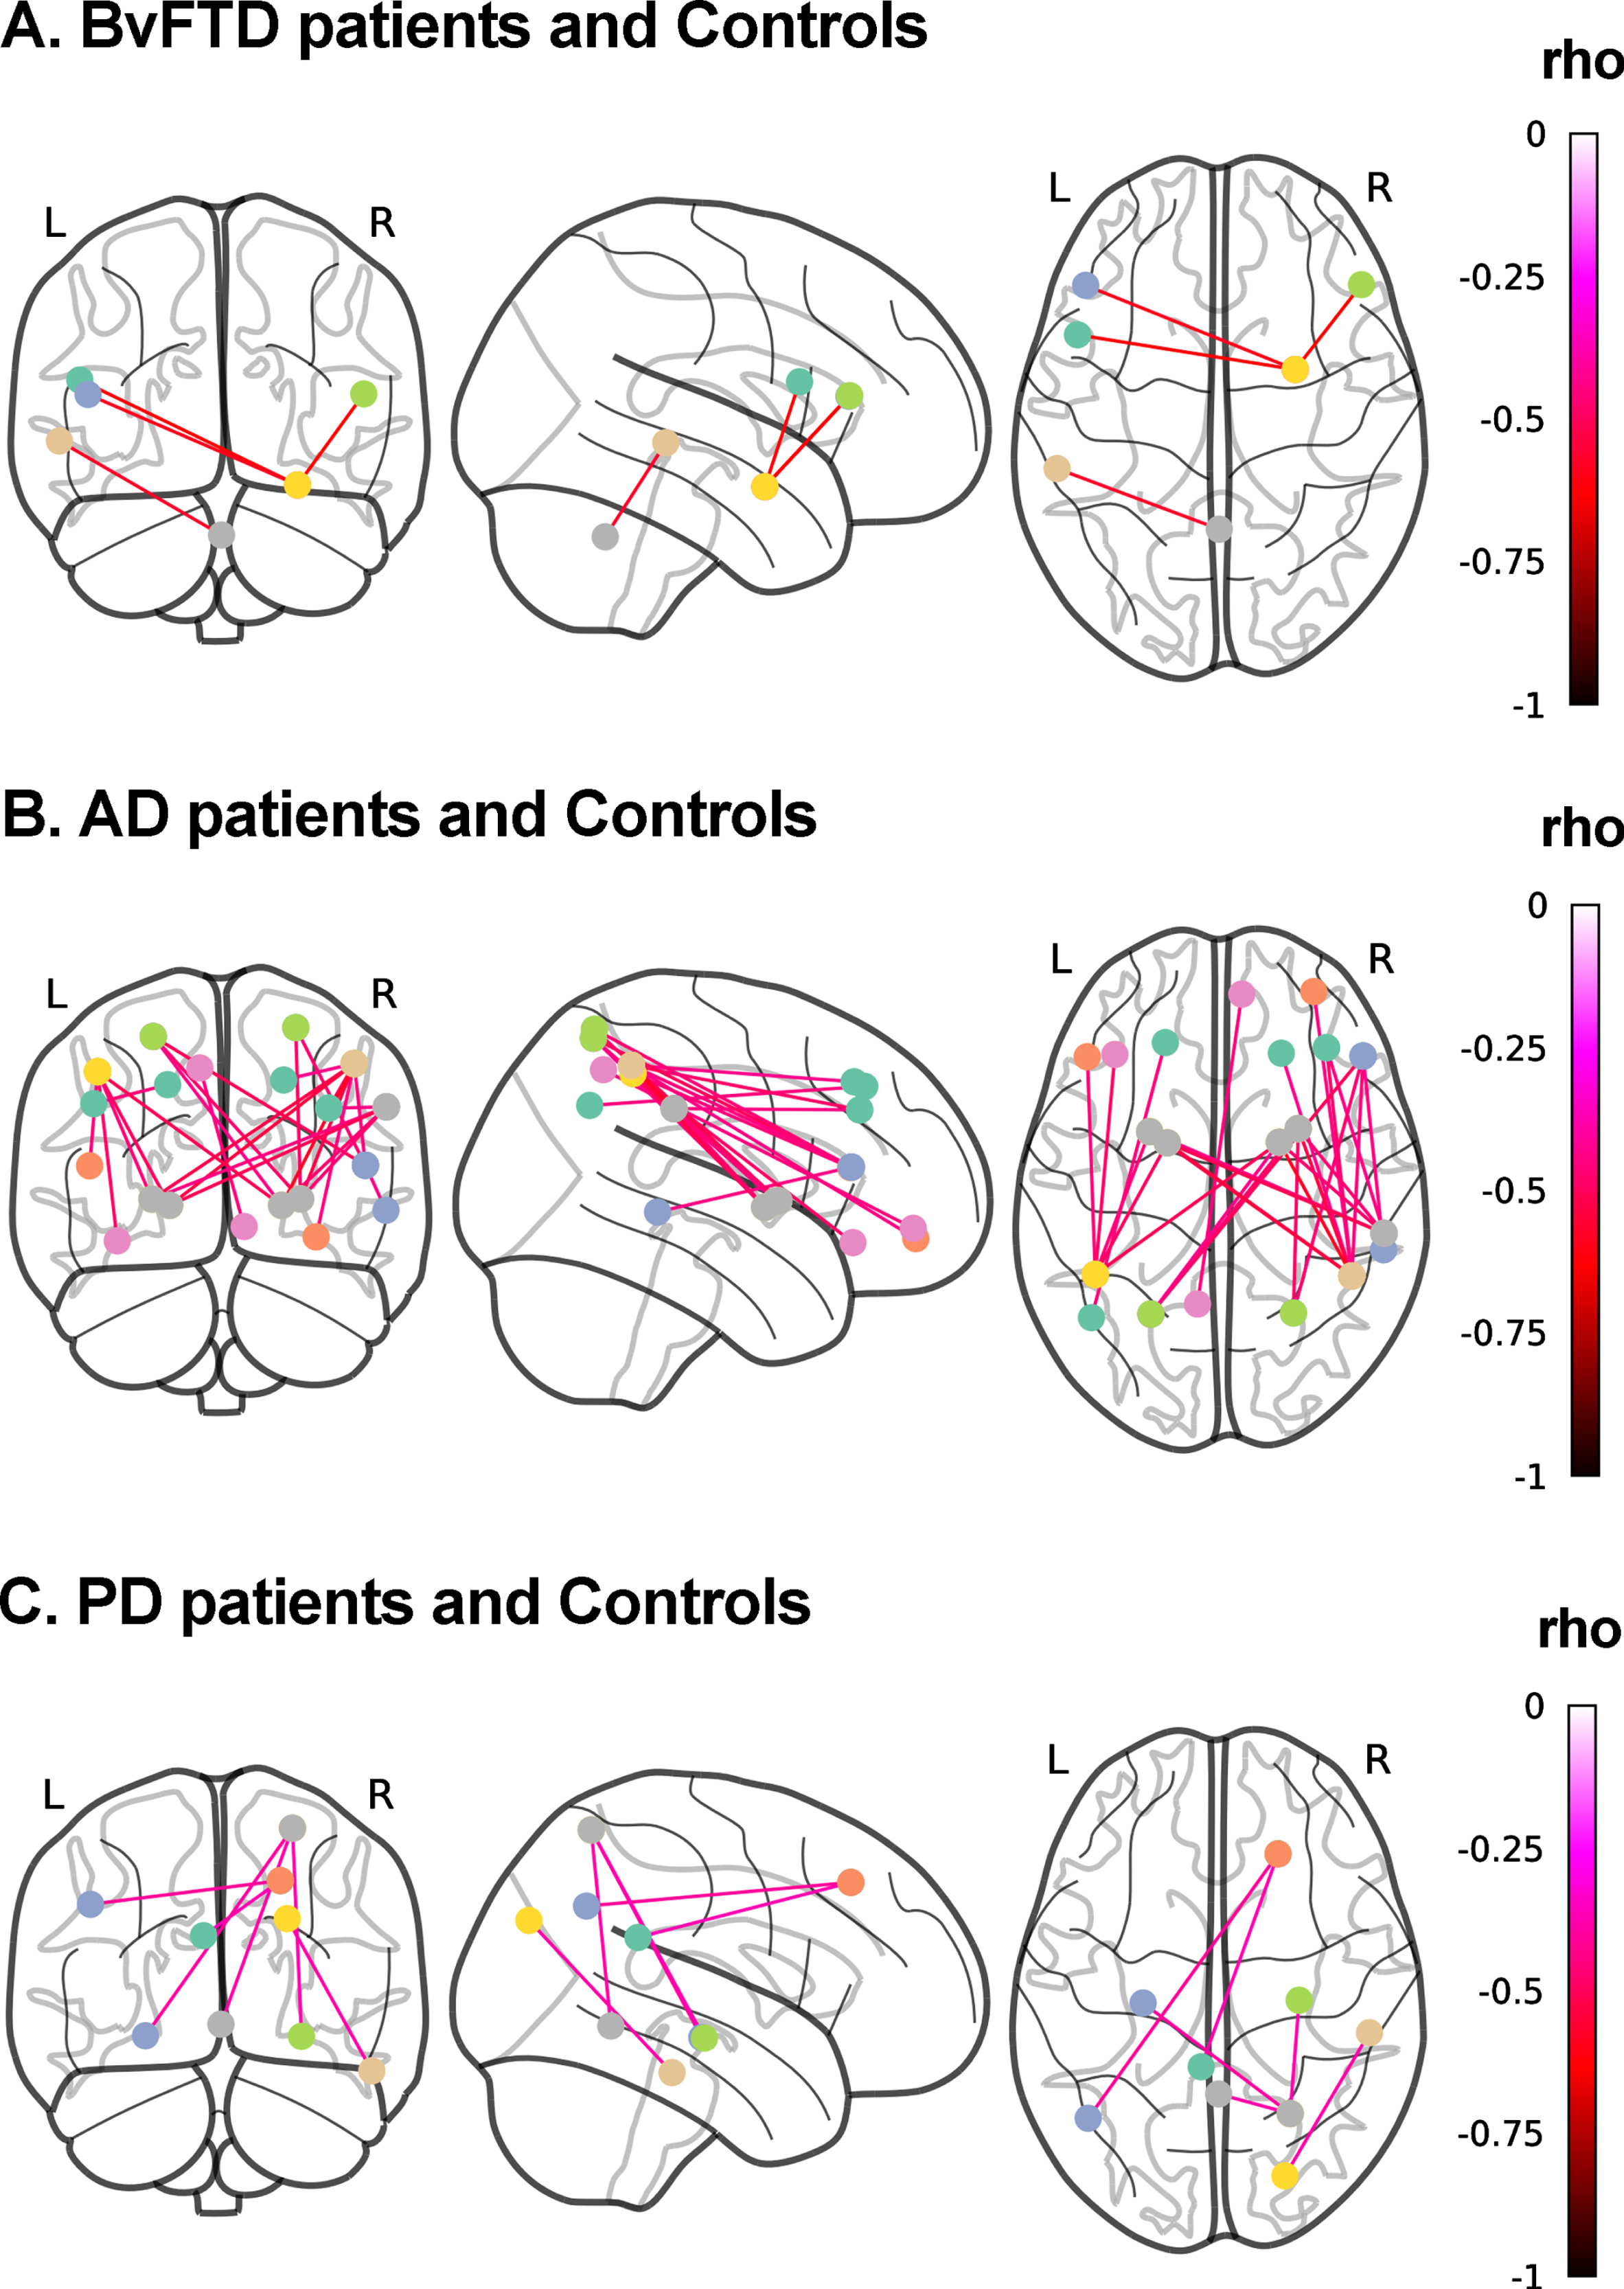
AD patients and controls
Higher discriminant scores from MoCA outcomes were associated with lower FC between (a) parietal and frontal regions, and (b) parietal and basal-ganglia regions (Fig. 3B). Similar associations were found for MoCA + MiniSEA and the model including the three discriminant scores (Supplementary Table 10).
PD patients and controls
Higher discriminant scores from MiniSEA scores were associated with lower FC between (a) the right parietal superior lobule and the bilateral hippocampi and the cerebellum, (b) the right superior frontal gyrus and the angular gryus and posterior cingulate, and (c) the right inferior temporal gyrus and right superior occipital gyrus (Fig. 3C). Similar associations, although with correlations between additional frontal and parietal involvement, were found for the discriminant scores from MiniSEA + IFS discriminant scores (Supplementary Table 11).
DISCUSSION
We tested the relevance of social cognition and other cognitive measures as dimensional predictors of neurodegenerative conditions, while examining the neurofunctional correlates of the best predictors. Although all patient groups revealed generalized deficits in social cognition, CS and EF, our classification approach combining MDAs and ROC analyses provided a robust group characterization. Compared to controls, social cognition impairment probabilities provided the best classification of bvFTD (together with CS) and PD, but not AD (where maximal predictions were afforded by CS alone). Other combinations of social cognition, CS, and EF measures did not improve these classifications. When combining the best MDA probabilities scores of social cognition, CS, and EF, aiming at classifying patient groups, we obtained good rates for bvFTD versus PD (98.3% with social cognition), AD versus PD (98.6% with social cognition and CS), and bvFTD versus AD (71.7% with CS and social cognition). The top MDA outcomes were associated with consistent patterns of pathophysiological compromise and FC dysfunctions across patients: extended fronto-insulo-temporo-parietal atrophy and reduced fronto-amgydalar FC associated with social cognition and CS scores in bvFTD; temporo-fronto-parietal atrophy and reduced parieto-fronto-basal FC associated with CS scores in AD; and parieto-fronto-temporal atrophy and reduced network activity associated with social cognition in PD. Interestingly, the top discriminant scores provided the best pathophysiological characterization, as adding other measures did not significantly change the overall pattern or produced null associations. Briefly, standardized validated measures of social cognition, in combination with general CS measures, can provide robust classification across neurodegenerative diseases, also unveiling relevant pathophysiological markers of atrophy and FC.
Dimensional characterization of social cognition across neurodegenerative disorders
Relative to controls, bvFTD patients were best classified by hallmark dysfunctions in general (CS associated with dementia) and specific (social cognition) domains [46]. Social cognition outcomes provided the best classification, even when compared with other patient groups (be it on its own alone or combined with CS). FER/ToM deficits are early and reliable clinical markers of this disease despite the variable frequency and severity of EF, memory, and visuospatial deficits [47]. The MiniSEA taps specifically on socio-affective deficits in bvFTD [48], as systematically shown across countries and settings (Table 1). Present results reliably classified bvFTD patients vis-á-vis controls and other neurodegenerative conditions, providing objective quantifications of social cognition for diagnosis, even when this feature is absent from current diagnostic criteria. Fronto-insular and temporo-parietal compromise are the main signatures of both social cognition outcomes and bvFTD disruptions [22]. The more extended networks we observed (fronto-amygdalar and temporo-cerebellar) are also critically involved in both social cognition and bvFTD [46]. Whereas social cognition has been widely assessed in bvFTD [1], less clinical attention has been paid to short, potentially scalable, validated, and well-designed tasks compatible with neurocognitive research. Thus, the MiniSEA, in combination with other cognitive measures and related anatomo-functional correlates, seems promising to support clinical assessment and diagnostic classification.
As expected, relative to controls, AD patients were maximally classified based on CS outcomes alone [5, 9], with social cognition (and EF) failing to yield higher classification rates. However, social cognition outcomes proved relevant for identifying AD patients from other groups, especially vis-á-vis PD patients. This reinforces the relevance of social cognition tasks as complements for cross-nosological classifications. In AD, the atrophy pattern associated with discrimination scores revealed typical disease targets, spanning temporal (hippocampus, amygdala, parahippocampal gyrus, superior temporal, and fusiform gyri), frontal (superior frontal gyrus), and parietal (postcentral gyrus) regions [49]. Similarly, classical networks affected in AD, including the default mode network [50], as well as posterior and basal ganglia networks [51], were associated with the MDA scores, supporting a plausible pathophysiological model for classification scores.
Finally, regarding controls versus PD, maximal discrimination was obtained through social cognition outcomes alone, although classification rate was lower than for bvFTD and AD. This aligns with current literature showing moderate deficits in most (but not all) reports [14]. However, the dimensional neurodegenerative classification of PD provided almost perfect classification vis-á-vis bvFTD (social cognition alone) and AD (social cognition and CS). Despite potential confounds [14], social cognition has emerged as a critical marker of PD [52]. Abnormal fronto-posterior volume [16] and networks [16, 17] are consistent with previous studies in PD and social cognition. Moreover, social cognition outcomes have been linked to temporo-parieto-cerebellar and temporo-occipital networks in PD [15, 16, 18]. Indeed, our results support the view that PD presents systemic whole-brain disruptions beyond the basal ganglia [53] alongside long-range network compromise [50]. To our knowledge, this is the first classification study of PD and other neurodegenerative conditions using social cognition tasks and related brain correlates, offering important breakthroughs for research on PD and its social impairments.
Our results have important clinical implications. Social cognition deficits are a hallmark of bvFTD beyond cognitive and executive dysfunction [47], but are also present in AD and PD in varying degrees (Tables 1 and 2, and Supplementary Table 1). Thus, the development of systematic assessment programs combining social cognition, CS and EF measures sensitive to pathophysiological mechanisms represents a promising avenue to overcome diagnosis challenges. In particular, our work highlights the utility of the MiniSEA to potentially reduce diagnostic inconsistencies in multicentric settings, despite being subject to cultural differences [54].
Limitations and further research
Beyond FER and ToM, social cognition encompasses other domains assessed in neurodegeneration, such as empathy [55], social cooperation [56], moral cognition [57], complex social emotions [31], and interoception [58]. However, FER/ToM are the core components of social cognition assessed in clinical settings [3], and the MiniSEA ranks amongst the most robustly and cross-culturally replicated tools in neurodegeneration (Table 1). However, future classification studies across neurodegenerative subtypes should incorporate additional domains and tasks.
Across all classifications, our results do not support diagnosis characterization based on EF performance. This might contradict the suggested use of combined social and executive tasks [59]. However, our results show a well-replicated result, including (a) and generalized deficit of EF across conditions, but (b) yielding low diagnosis classification power [1, 5] (Tables 1 and 2). Also, we used a short EF screening, that, despite its sensitivity across bvFTD, AD and PD, may not be comparable to an extended EF battery. Future assessments should test the potential relevance of extended executive assessment batteries in diagnostic classification. Relatedly, other cognitive domains, such as visuomotor skills, memory, decision-making, and motor cognition, should also be combined and/or compared with social cognition outcomes.
Our study focused on bvFTD, AD and PD, as social cognition assessments are systematic in these conditions. However, a dimensional approach to social cognition across neurodegeneration [60] should include comparisons with other diseases, such as other FTD variants [60], multiple sclerosis, or Huntington’s disease [61]. Similarly, as social cognition is extensively impaired in psychiatric conditions, cross-nosological comparisons [62] may provide novel insights for both clinical and cognitive neuroscience research.
Moreover, our study aimed to test the diagnostic classification power of social cognition outcomes. Future works should also test the power of this domain to characterize different (early or prodromal) disease stages and longitudinal changes, as well as familiar presentations across neurodegenerative disorders. Similarly, further investigation is needed on the capacity of social cognition measures to predict disease onset, progression, prognosis, and behavioral symptoms.
Finally, this work employed MDA and subsequent ROC analyses. Other classification procedures in different fields [21, 23, 24, 44, 63–69] using typical machine learning approaches (i.e., support vector machine, random forest, XGBoost algorithms) need training/test partitions and specific validation (leave-one-out or k-fold) techniques to avoid data overfitting and to perform out-of-sample classifications. However, MDA does not necessarily follow those procedures. MDA is a multivariate method that combines linear independent predictors to assesses the discriminative power regarding a dependent variable in a simple and parsimonious way. In MDA, more cases than predictors are required in the smallest group to prevent overfitting. For that reason, the typical use of MDA does not involve data partition and validation procedures [32, 70–90]. Accordingly, our work follows the standards for MDAs publications (reporting Wilks’ Lambda, χ2 statistic, p values, classification accuracy, sensitivity, and specificity). Considering the above reasons and the complexity of our results (involving four groups with cognitive assessment, structural and functional imaging, and performing both MDAs and ROC analyses), we did not perform partition and leave-one-out or k-fold procedures. In any case, future works should compare the classification power of our multimodal MDA in regard to other machine learning classifiers.
CONCLUSIONS
To our knowledge, this is the first study offering diagnostic classifications of three neurodegenerative subtypes via social and cognitive tasks and providing convergent pathophysiological signatures via brain volume and FC metrics. Social cognition outcomes, in combination with classical cognitive assessments, and accompanied by anatomo-functional correlates, provide a powerful dimensional approach to neurodegeneration at both clinical and research levels. The use of simple, short, scalable, low-demand, validated, and clinically-oriented social cognition tools, such as the MiniSEA, would reduce inconsistencies and heterogeneity, potentially improving clinical-research developments in the field.
ACKNOWLEDGMENTS
This work was supported by CONICET; FONCYT-PICT (2017-1818, 2017-1820); ANID/FONDECYT Regular (1210195 and 1210176); ANID/FONDAP (15150012); Programa Interdisciplinario de Investigación Experimental en Comunicación y Cognición (PIIECC), Facultad de Humanidades, USACH; Sistema General de Regalías (BPIN2018000100059), Universidad del Valle (CI 5316), Alzheimer Association GBHI ALZ UK-20-639295; and the Multi-Partner Consortium to Expand Dementia Research in Latin America (ReDLat), funded by the National Institutes of Aging of the National Institutes of Health under award number R01AG057234, an Alzheimer’s Association grant (SG-20-725707-ReDLat), the Rainwater Foundation, and the Global Brain Health Institute. The content is solely the responsibility of the authors and does not represent the official views of these institutions. The sponsors have no role of the in-study design, collection, analysis, interpretation, writing and submission of this work.
Authors’ disclosures available online (https://www.j-alz.com/manuscript-disclosures/21-0163r2).
SUPPLEMENTARY MATERIAL
[1] The supplementary material is available in the electronic version of this article: https://dx.doi.org/10.3233/JAD-210163.
REFERENCES
[1] | Bora E , Walterfang M , Velakoulis D ((2015) ) Theory of mind in behavioural-variant frontotemporal dementia and Alzheimer’s disease: A meta-analysis. J Neurol Neurosurg Psychiatry 86: , 714–719. |
[2] | Ibáñez A , Billeke P , de la Fuente L , Salamone P , García AM , Melloni M ((2017) ) Reply: Towards a neurocomputational account of social dysfunction in neurodegenerative disease. Brain 140: , e15. |
[3] | Cotter J , Granger K , Backx R , Hobbs M , Looi CY , Barnett JH ((2018) ) Social cognitive dysfunction as a clinical marker: A systematic review of meta-analyses across 30 clinical conditions. Neurosci Biobehav Rev 84: , 92–99. |
[4] | Bertoux M , Funkiewiez A , O’Callaghan C , Dubois B , Hornberger M ((2013) ) Sensitivity and specificity of ventromedial prefrontal cortex tests in behavioral variant frontotemporal dementia. Alzheimers Dement 9: , S84–94. |
[5] | Reul S , Lohmann H , Wiendl H , Duning T , Johnen A ((2017) ) Can cognitive assessment really discriminate early stages of Alzheimer’s and behavioural variant frontotemporal dementia at initial clinical presentation? Alzheimers Res Ther 9: , 61. |
[6] | Kumfor F , Honan C , McDonald S , Hazelton JL , Hodges JR , Piguet O ((2017) ) Assessing the “social brain” in dementia: Applying TASIT-S. Cortex 93: , 166–177. |
[7] | Ibáñez A ((2018) ) Brain oscillations, inhibition and social inappropriateness in frontotemporal degeneration. Brain 141: , e73. |
[8] | Salamone P , Legaz A , Sedeño L , Moguilner S , Fraile-Vazquez M , Gonzalez Campo C , Fittipaldi S , Yoris A , Miranda M , Ibáñez A ((2021) ) Interoception primes emotional processing: Multimodal evidence from neurodegeneration. J Neurosci 41: , 4276–4292. |
[9] | Bertoux M , de Souza LC , O’Callaghan C , Greve A , Sarazin M , Dubois B , Hornberger M ((2016) ) Social cognition deficits: The key to discriminate behavioral variant frontotemporal dementia from Alzheimer’s disease regardless of amnesia? J Alzheimers Dis 49: , 1065–1074. |
[10] | Funkiewiez A , Bertoux M , de Souza LC , Lévy R , Dubois B ((2012) ) The SEA (Social cognition and Emotional Assessment): A clinical neuropsychological tool for early diagnosis of frontal variant of frontotemporal lobar degeneration. Neuropsychology 26: , 81–90. |
[11] | Chiu I , Piguet O , Diehl-Schmid J , Riedl L , Beck J , Leyhe T , Holsboer-Trachsler E , Berres M , Monsch AU , Sollberger M ((2016) ) Dissociation in rating negative facial emotions between behavioral variant frontotemporal dementia and major depressive disorder. Am J Geriatr Psychiatry 24: , 1017–1027. |
[12] | Sapey-Triomphe LA , Heckemann RA , Boublay N , Dorey JM , Hénaff MA , Rouch I , Padovan C , Hammers A , Krolak-Salmon P , Initiative AsDN ((2015) ) Neuroanatomical correlates of recognizing face expressions in mild stages of Alzheimer’s disease. PLoS One 10: , e0143586. |
[13] | Takenoshita S , Hayashi S , Shinya T , Miki T , Yokota O , Maki Y , Hattori H , Yamada N , Terada S ((2020) ) Sally-Anne test and regional cerebral blood flow in Alzheimer’s disease dementia. Psychogeriatrics 20: , 549–556. |
[14] | Argaud S , Vérin M , Sauleau P , Grandjean D ((2018) ) Facial emotion recognition in Parkinson’s disease: A review and new hypotheses. Mov Disord 33: , 554–567. |
[15] | Díez-Cirarda M , Ojeda N , Peña J , Cabrera-Zubizarreta A , Gómez-Beldarrain M , Gómez-Esteban JC , Ibarretxe-Bilbao N ((2015) ) Neuroanatomical correlates of theory of mind deficit in Parkinson’s disease: A multimodal imaging study. PLoS One 10: , e0142234. |
[16] | Baggio HC , Segura B , Ibarretxe-Bilbao N , Valldeoriola F , Marti MJ , Compta Y , Tolosa E , Junqué C ((2012) ) Structural correlates of facial emotion recognition deficits in Parkinson’s disease patients. Neuropsychologia 50: , 2121–2128. |
[17] | Multani N , Taghdiri F , Anor CJ , Varriano B , Misquitta K , Tang-Wai DF , Keren R , Fox S , Lang AE , Vijverman AC , Marras C , Tartaglia MC ((2019) ) Association between social cognition changes and resting state functional connectivity in frontotemporal dementia, Alzheimer’s disease, Parkinson’s disease, and healthy controls. Front Neurosci 13: , 1259. |
[18] | Pohl A , Anders S , Chen H , Patel HJ , Heller J , Reetz K , Mathiak K , Binkofski F ((2017) ) Impaired emotional mirroring in Parkinson’s disease-A study on brain activation during processing of facial expressions. Front Neurol 8: , 682. |
[19] | Ibanez A , Parra MA , Butler C , Latin America and the Caribbean Consortium on Dementia (LAC-CD) ((2021) ) The Latin America and the Caribbean Consortium on Dementia (LAC-CD): From networking to research to implementation science. J Alzheimers Dis 82: (s1), S379–S394. |
[20] | Ibanez A , Yokoyama JS , Possin KL , Matallana D , Lopera F , Nitrini R , Takada LT , Custodio N , Sosa Ortiz AL , Avila-Funes JA , Behrens MI , Slachevsky A , Myers RM , Cochran JN , Brusco LI , Bruno MA , Brucki SMD , Pina-Escudero SD , Okada de Oliveira M , Donnelly Kehoe P , Garcia AM , Cardona JF , Santamaria-Garcia H , Moguilner S , Duran-Aniotz C , Tagliazucchi E , Maito M , Longoria Ibarrola EM , Pintado-Caipa M , Godoy ME , Bakman V , Javandel S , Kosik KS , Valcour V , Miller BL ((2021) ) The Multi-Partner Consortium to Expand Dementia Research in Latin America (ReDLat): Driving multicentric research and implementation science. Front Neurol 12: , 631722. |
[21] | Donnelly-Kehoe PA , Pascariello GO , García AM , Hodges JR , Miller B , Rosen H , Manes F , Landin-Romero R , Matallana D , Serrano C , Herrera E , Reyes P , Santamaria-Garcia H , Kumfor F , Piguet O , Ibanez A , Sedeño L ((2019) ) Robust automated computational approach for classifying frontotemporal neurodegeneration: Multimodal/multicenter neuroimaging. Alzheimers Dement (Amst) 11: , 588–598. |
[22] | Sedeno L , Piguet O , Abrevaya S , Desmaras H , Garcia-Cordero I , Baez S , Alethia de la Fuente L , Reyes P , Tu S , Moguilner S , Lori N , Landin-Romero R , Matallana D , Slachevsky A , Torralva T , Chialvo D , Kumfor F , Garcia AM , Manes F , Hodges JR , Ibanez A ((2017) ) Tackling variability: A multicenter study to provide a gold-standard network approach for frontotemporal dementia. Hum Brain Mapp 38: , 3804–3822. |
[23] | Moguilner S , García AM , Mikulan E , Hesse E , García-Cordero I , Melloni M , Cervetto S , Serrano C , Herrera E , Reyes P , Matallana D , Manes F , Ibáñez A , Sedeño L ((2018) ) Weighted Symbolic Dependence Metric (wSDM) for fMRI resting-state connectivity: A multicentric validation for frontotemporal dementia. Sci Rep 8: , 11181. |
[24] | Moguilner S , García AM , Perl YS , Tagliazucchi E , Piguet O , Kumfor F , Reyes P , Matallana D , Sedeño L , Ibáñez A ((2021) ) Dynamic brain fluctuations outperform connectivity measures and mirror pathophysiological profiles across dementia subtypes: A multicenter study. Neuroimage 225: , 117522. |
[25] | Garcia-Cordero I , Migeot J , Fittipaldi S , Aquino A , Campo CG , García A , Ibáñez A ((2021) ) Metacognition of emotion recognition across neurodegenerative diseases. Cortex 137: , 93–107. |
[26] | Nasreddine ZS , Phillips NA , Bédirian V , Charbonneau S , Whitehead V , Collin I , Cummings JL , Chertkow H ((2005) ) The Montreal Cognitive Assessment, MoCA: A brief screening tool for mild cognitive impairment. J Am Geriatr Soc 53: , 695–699. |
[27] | Torralva T , Roca M , Gleichgerrcht E , Lopez P , Manes F ((2009) ) INECO Frontal Screening (IFS): A brief, sensitive, and specific tool to assess executive functions in dementia. J Int Neuropsychol Soc 15: , 777–786. |
[28] | Dalrymple-Alford JC , MacAskill MR , Nakas CT , Livingston L , Graham C , Crucian GP , Melzer TR , Kirwan J , Keenan R , Wells S , Porter RJ , Watts R , Anderson TJ ((2010) ) The MoCA: Well-suited screen for cognitive impairment in Parkinson disease. Neurology 75: , 1717–1725. |
[29] | Kandiah N , Zhang A , Cenina AR , Au WL , Nadkarni N , Tan LC ((2014) ) Montreal Cognitive Assessment for the screening and prediction of cognitive decline in early Parkinson’s disease. Parkinsonism Relat Disord 20: , 1145–1148. |
[30] | Nazem S , Siderowf AD , Duda JE , Have TT , Colcher A , Horn SS , Moberg PJ , Wilkinson JR , Hurtig HI , Stern MB , Weintraub D ((2009) ) Montreal cognitive assessment performance in patients with Parkinson’s disease with “normal” global cognition according to mini-mental state examination score. J Am Geriatr Soc 57: , 304–308. |
[31] | Santamaría-García H , Baez S , Reyes P , Santamaría-García JA , Santacruz-Escudero JM , Matallana D , Arévalo A , Sigman M , García AM , Ibáñez A ((2017) ) A lesion model of envy and Schadenfreude: Legal, deservingness and moral dimensions as revealed by neurodegeneration. Brain 140: , 3357–3377. |
[32] | Baez S , Ibanez A , Gleichgerrcht E , Perez A , Roca M , Manes F , Torralva T ((2014) ) The utility of IFS (INECO Frontal Screening) for the detection of executive dysfunction in adults with bipolar disorder and ADHD. Psychiatry Res 216: , 269–276. |
[33] | Bocanegra Y , García AM , Pineda D , Buriticá O , Villegas A , Lopera F , Gómez D , Gómez-Arias C , Cardona JF , Trujillo N , Ibáñez A ((2015) ) Syntax, action verbs, action semantics, and object semantics in Parkinson’s disease: Dissociability, progression, and executive influences. Cortex 69: , 237–254. |
[34] | Ciampi E , Uribe-San-Martin R , Vásquez M , Ruiz-Tagle A , Labbe T , Cruz JP , Lillo P , Slachevsky A , Reyes D , Reyes A , Cárcamo-Rodríguez C ((2018) ) Relationship between social cognition and traditional cognitive impairment in progressive multiple sclerosis and possible implicated neuroanatomical regions. Mult Scler Relat Disord 20: , 122–128. |
[35] | Torralva T , Roca M , Gleichgerrcht E , Bekinschtein T , Manes F ((2009) ) A neuropsychological battery to detect specific executive and social cognitive impairments in early frontotemporal dementia. Brain 132: , 1299–1309. |
[36] | Stevens J ((2002) ) Applied multivariate statistics for the social sciences, Lawrence Erlbaum Associates, Mahwah, N.J. |
[37] | Nichols TE , Das S , Eickhoff SB , Evans AC , Glatard T , Hanke M , Kriegeskorte N , Milham MP , Poldrack RA , Poline JB , Proal E , Thirion B , Van Essen DC , White T , Yeo BT ((2017) ) Best practices in data analysis and sharing in neuroimaging using MRI. Nat Neurosci 20: , 299–303. |
[38] | Ashburner J , Friston KJ ((2000) ) Voxel-based morphometry–the methods. Neuroimage 11: , 805–821. |
[39] | Good CD , Johnsrude IS , Ashburner J , Henson RN , Friston KJ , Frackowiak RS ((2001) ) A voxel-based morphometric study of ageing in 465 normal adult human brains. Neuroimage 14: , 21–36. |
[40] | Chung J , Yoo K , Lee P , Kim CM , Roh JH , Park JE , Kim SJ , Seo SW , Shin JH , Seong JK , Jeong Y ((2017) ) Normalization of cortical thickness measurements across different T1 magnetic resonance imaging protocols by novel W-Score standardization. Neuroimage 159: , 224–235. |
[41] | La Joie R , Perrotin A , Barré L , Hommet C , Mézenge F , Ibazizene M , Camus V , Abbas A , Landeau B , Guilloteau D , de La Sayette V , Eustache F , Desgranges B , Chételat G ((2012) ) Region-specific hierarchy between atrophy, hypometabolism, and β-amyloid (Aβ) load in Alzheimer’s disease dementia. J Neurosci 32: , 16265–16273. |
[42] | Melloni M , Billeke P , Baez S , Hesse E , De la Fuente L , Forno G , Birba A , García-Cordero I , Serrano C , Plastino A ((2016) ) Your perspective and my benefit: Multiple lesion models of self-other integration strategies during social bargaining. Brain 139: , 3022–3040. |
[43] | Poldrack RA , Baker CI , Durnez J , Gorgolewski KJ , Matthews PM , Munafò MR , Nichols TE , Poline JB , Vul E , Yarkoni T ((2017) ) Scanning the horizon: Towards transparent and reproducible neuroimaging research. Nat Rev Neurosci 18: , 115–126. |
[44] | Fittipaldi S , Abrevaya S , Fuente A , Pascariello GO , Hesse E , Birba A , Salamone P , Hildebrandt M , Martí SA , Pautassi RM , Huepe D , Martorell MM , Yoris A , Roca M , García AM , Sedeño L , Ibáñez A ((2020) ) A multidimensional and multi-feature framework for cardiac interoception. Neuroimage 212: , 116677. |
[45] | Salamone PC , Esteves S , Sinay VJ , García-Cordero I , Abrevaya S , Couto B , Adolfi F , Martorell M , Petroni A , Yoris A , Torquati K , Alifano F , Legaz A , Cassará FP , Bruno D , Kemp AH , Herrera E , García AM , Ibáñez A , Sedeño L ((2018) ) Altered neural signatures of interoception in multiple sclerosis. Hum Brain Mapp 39: , 4743–4754. |
[46] | Piguet O , Hornberger M , Mioshi E , Hodges JR ((2011) ) Behavioural-variant frontotemporal dementia: Diagnosis, clinical staging, and management. Lancet Neurol 10: , 162–172. |
[47] | Johnen A , Bertoux M ((2019) ) Psychological and cognitive markers of behavioral variant frontotemporal dementia-a clinical neuropsychologist’s view on diagnostic criteria and beyond. Front Neurol 10: , 594. |
[48] | Bertoux M , Volle E , de Souza LC , Funkiewiez A , Dubois B , Habert MO ((2014) ) Neural correlates of the mini-SEA (Social cognition and Emotional Assessment) in behavioral variant frontotemporal dementia. Brain Imaging Behav 8: , 1–6. |
[49] | Ferreira D , Nordberg A , Westman E ((2020) ) Biological subtypes of Alzheimer disease: A systematic review and meta-analysis. Neurology 94: , 436–448. |
[50] | Pievani M , Filippini N , van den Heuvel MP , Cappa SF , Frisoni GB ((2014) ) Brain connectivity in neurodegenerative diseases–from phenotype to proteinopathy. Nat Rev Neurol 10: , 620–633. |
[51] | Cakir Y ((2020) ) Hybrid modeling of alpha rhythm and the amplitude of low-frequency fluctuations abnormalities in the thalamocortical region and basal ganglia in Alzheimer’s disease. Eur J Neurosci 52: , 2944–2961. |
[52] | Palmeri R , Lo Buono V , Corallo F , Foti M , Di Lorenzo G , Bramanti P , Marino S ((2017) ) Nonmotor symptoms in Parkinson disease: A descriptive review on social cognition ability. J Geriatr Psychiatry Neurol 30: , 109–121. |
[53] | Caligiore D , Helmich RC , Hallett M , Moustafa AA , Timmermann L , Toni I , Baldassarre G ((2016) ) Parkinson’s disease as a system-level disorder. NPJ Parkinsons Dis 2: , 16025. |
[54] | Quesque F , Coutrot A , Cox S , de Souza LC , Baez S , Cardona JF , Mulet-Perreault H , Flanagan E , Neely A , Clarens MF , et al. (2020) Culture shapes our understanding of others’ thoughts and emotions: An investigation across 12 countries. PsyArXiv, doi: 10.31234/osf.io/tg2ay |
[55] | Baez S , Morales JP , Slachevsky A , Torralva T , Matus C , Manes F , Ibanez A ((2016) ) Orbitofrontal and limbic signatures of empathic concern and intentional harm in the behavioral variant frontotemporal dementia. Cortex 75: , 20–32. |
[56] | Melloni M , Billeke P , Baez S , Hesse E , de la Fuente L , Forno G , Birba A , Garcia-Cordero I , Serrano C , Plastino A , Slachevsky A , Huepe D , Sigman M , Manes F , Garcia AM , Sedeno L , Ibanez A ((2016) ) Your perspective and my benefit: Multiple lesion models of self-other integration strategies during social bargaining. Brain 139: , 3022–3040. |
[57] | Baez S , Couto B , Torralva T , Sposato LA , Huepe D , Montanes P , Reyes P , Matallana D , Vigliecca NS , Slachevsky A , Manes F , Ibanez A ((2014) ) Comparing moral judgments of patients with frontotemporal dementia and frontal stroke. JAMA Neurol 71: , 1172–1176. |
[58] | García-Cordero I , Sedeño L , de la Fuente L , Slachevsky A , Forno G , Klein F , Lillo P , Ferrari J , Rodriguez C , Bustin J , Torralva T , Baez S , Yoris A , Esteves S , Melloni M , Salamone P , Huepe D , Manes F , García A , Ibañez A ((2016) ) Feeling, learning from, and being aware of inner states: Interoceptive dimensions in neurodegeneration and stroke. Philos Trans R Soc Lond B Biol Sci 371: , 20160006. |
[59] | Schroeter ML , Pawelke S , Bisenius S , Kynast J , Schuemberg K , Polyakova M , Anderl-Straub S , Danek A , Fassbender K , Jahn H , Jessen F , Kornhuber J , Lauer M , Prudlo J , Schneider A , Uttner I , Thöne-Otto A , Otto M , Diehl-Schmid J ((2018) ) A modified reading the Mind in the Eyes test predicts behavioral variant frontotemporal dementia better than executive function tests. Front Aging Neurosci 10: , 11. |
[60] | Fittipaldi S , Ibanez A , Baez S , Manes F , Sedeno L , Garcia AM ((2019) ) More than words: Social cognition across variants of primary progressive aphasia. Neurosci Biobehav Rev 100: , 263–284. |
[61] | Baez S , Pino M , Berrío M , Santamaría-García H , Sedeño L , García AM , Fittipaldi S , Ibáñez A ((2018) ) Corticostriatal signatures of schadenfreude: Evidence from Huntington’s disease. J Neurol Neurosurg Psychiatry 89: , 112–116. |
[62] | Bertoux M , Delavest M , de Souza LC , Funkiewiez A , Lépine JP , Fossati P , Dubois B , Sarazin M ((2012) ) Social Cognition and Emotional Assessment differentiates frontotemporal dementia from depression. J Neurol Neurosurg Psychiatry 83: , 411–416. |
[63] | Abrevaya S , Fittipaldi S , García AM , Dottori M , Santamaria-Garcia H , Birba A , Yoris A , Hildebrandt MK , Salamone P , De la Fuente A , Alarco-Martí S , García-Cordero I , Matorrel-Caro M , Pautassi RM , Serrano C , Sedeño L , Ibáñez A ((2020) ) At the heart of neurological dimensionality: Cross-nosological and multimodal cardiac interoceptive deficits. Psychosom Med 82: , 850–861. |
[64] | Eyigoz E , Courson M , Sedeño L , Rogg K , Orozco-Arroyave JR , Nöth E , Skodda S , Trujillo N , Rodríguez M , Rusz J , Muñoz E , Cardona JF , Herrera E , Hesse E , Ibáñez A , Cecchi G , García AM ((2020) ) From discourse to pathology: Automatic identification of Parkinson’s disease patients via morphological measures across three languages. Cortex 132: , 191–205. |
[65] | Bachli MB , Sedeño L , Ochab JK , Piguet O , Kumfor F , Reyes P , Torralva T , Roca M , Cardona JF , Campo CG , Herrera E , Slachevsky A , Matallana D , Manes F , García AM , Ibáñez A , Chialvo DR ((2020) ) Evaluating the reliability of neurocognitive biomarkers of neurodegenerative diseases across countries: A machine learning approach. Neuroimage 208: , 116456. |
[66] | Dottori M , Sedeño L , Martorell Caro M , Alifano F , Hesse E , Mikulan E , García AM , Ruiz-Tagle A , Lillo P , Slachevsky A , Serrano C , Fraiman D , Ibanez A ((2017) ) Towards affordable biomarkers of frontotemporal dementia: A classification study via network’s information sharing. Sci Rep 7: , 3822. |
[67] | Gonzalez Campo C , Salamone PC , Rodríguez-Arriagada N , Richter F , Herrera E , Bruno D , Pagani Cassara F , Sinay V , García AM , Ibáñez A , Sedeño L ((2020) ) Fatigue in multiple sclerosis is associated with multimodal interoceptive abnormalities. Mult Scler 26: , 1845–1853. |
[68] | Moguilner S , Birba A , Fino D , Isoardi R , Huetagoyena C , Otoya R , Tirapu V , Cremaschi F , Sedeño L , Ibáñez A , García AM ((2021) ) Multimodal neurocognitive markers of frontal lobe epilepsy: Insights from ecological text processing. Neuroimage 235: , 117998. |
[69] | Santamaría-García H , Baez S , Aponte-Canencio DM , Pasciarello GO , Donnelly-Kehoe PA , Maggiotti G , Matallana D , Hesse E , Neely A , Zapata JG , Chiong W , Levy J , Decety J , Ibáñez A ((2021) ) Uncovering social-contextual and individual mental health factors associated with violence via computational inference. Patterns (N Y) 2: , 100176. |
[70] | Biegel DE , Bass DM , Schulz R , Morycz R ((1993) ) Predictors of in-home and out-of-home service use by family caregivers of Alzheimer’s disease patients. J Aging Health 5: , 419–438. |
[71] | Charpentier P , Lavenu I , Defebvre L , Duhamel A , Lecouffe P , Pasquier F , Steinling M ((2000) ) Alzheimer’s disease and frontotemporal dementia are differentiated by discriminant analysis applied to 99mTc HmPAO SPECT data. J Neurol Neurosurg Psychiatry 69: , 661–663. |
[72] | DeCarli C , Grady C , Clark C , Katz D , Brady D , Murphy D , Haxby J , Salerno J , Gillette J , Gonzalez-Aviles A ((1996) ) Comparison of positron emission tomography, cognition, and brain volume in Alzheimer’s disease with and without severe abnormalities of white matter. J Neurol Neurosurg Psychiatry 60: , 158–167. |
[73] | Dixon RM , Bradley KM , Budge MM , Styles P , Smith AD ((2002) ) Longitudinal quantitative proton magnetic resonance spectroscopy of the hippocampus in Alzheimer’s disease. Brain 125: , 2332–2341. |
[74] | Ghavidel-Parsa B , Bidari A , Hajiabbasi A , Shenavar I , Ghalehbaghi B , Sanaei O ((2019) ) Fibromyalgia diagnostic model derived from combination of American College of Rheumatology 1990 and 2011 criteria. Korean J Pain 32: , 120. |
[75] | Gruber R , Sadeh A , Raviv A ((2000) ) Instability of sleep patterns in children with attention-deficit/hyperactivity disorder. J Am Acad Child Adolesc Psychiatry 39: , 495–501. |
[76] | Heinrich H , Hoegl T , Moll GH , Kratz O ((2014) ) A bimodal neurophysiological study of motor control in attention-deficit hyperactivity disorder: A step towards core mechanisms? Brain 137: , 1156–1166. |
[77] | Sato T , Demura S , Murase T , Kobayashi Y ((2007) ) Contribution of physical fitness component to health status in middle-aged and elderly females. J Physiol Anthropol 26: , 569–577. |
[78] | Greenaway MC , Lacritz LH , Binegar D , Weiner MF , Lipton A , Cullum CM ((2006) ) Patterns of verbal memory performance in mild cognitive impairment, Alzheimer disease, and normal aging. Cogn Behav Neurol 19: , 79–84. |
[79] | Gomez RG , White DA ((2006) ) Using verbal fluency to detect very mild dementia of the Alzheimer type. Arch Clin Neuropsychol 21: , 771–775. |
[80] | Elfgren C , Brun A , Gustafson L , Johanson A , Minthon L , Passant U , Risberg J ((1994) ) Neuropsychological tests as discriminators between dementia of Alzheimer type and frontotemporal dementia. Int J Geriatr Psychiatry 9: , 635–642. |
[81] | Malloy P , Tremont G , Grace J , Frakey L ((2007) ) The Frontal Systems Behavior Scale discriminates frontotemporal dementia from Alzheimer’s disease. Alzheimers Dement 3: , 200–203. |
[82] | Kawai Y , Miura R , Tsujimoto M , Sakurai T , Yamaoka A , Takeda A , Arahata Y , Washimi Y , Kachi T , Toba K ((2013) ) Neuropsychological differentiation between Alzheimer’s disease and dementia with Lewy bodies in a memory clinic. Psychogeriatrics 13: , 157–163. |
[83] | Wolf H , Grunwald M , Kruggel F , Riedel-Heller S , Angerhöfer S , Hojjatoleslami A , Hensel A , Arendt T , Gertz H-J ((2001) ) Hippocampal volume discriminates between normal cognition; questionable and mild dementia in the elderly. Neurobiol Aging 22: , 177–186. |
[84] | Pepper K , Demetriou E , Park S , Song Y , Hickie I , Cacciotti-Saija C , Langdon R , Piguet O , Kumfor F , Thomas E ((2018) ) Autism, early psychosis, and social anxiety disorder: Understanding the role of social cognition and its relationship to disability in young adults with disorders characterized by social impairments. Transl Psychiatry 8: , 1–11. |
[85] | Rossi A , Arduini L , Daneluzzo E , Bustini M , Prosperini P , Stratta P ((2000) ) Cognitive function in euthymic bipolar patients, stabilized schizophrenic patients, and healthy controls. J Psychiatr Res 34: , 333–339. |
[86] | Lo AC , Iscru E , Blum D , Tesseur I , Callaerts-Vegh Z , Buée L , De Strooper B , Balschun D , D’Hooge R ((2013) ) Amyloid and tau neuropathology differentially affect prefrontal synaptic plasticity and cognitive performance in mouse models of Alzheimer’s disease. J Alzheimers Dis 37: , 109–125. |
[87] | Schmidt GJ , Boechat YEM , van Duinkerken E , Schmidt JJ , Moreira TB , Nicaretta DH , Schmidt SL ((2020) ) Detection of cognitive dysfunction in elderly with a low educational level using a reaction-time attention task. J Alzheimers Dis 78: , 1197–1205. |
[88] | Serra L , Cercignani M , Mastropasqua C , Torso M , Spanò B , Makovac E , Viola V , Giulietti G , Marra C , Caltagirone C ((2016) ) Longitudinal changes in functional brain connectivity predicts conversion to Alzheimer’s disease. J Alzheimers Dis 51: , 377–389. |
[89] | Baez S , Herrera E , Trujillo C , Cardona JF , Diazgranados JA , Pino M , Santamaría-García H , Ibáñez A , García AM ((2020) ) Classifying Parkinson’s disease patients with syntactic and socio-emotional verbal measures. Front Aging Neurosci 12: , 586233. |
[90] | García AM , Bocanegra Y , Herrera E , Moreno L , Carmona J , Baena A , Lopera F , Pineda D , Melloni M , Legaz A , Muñoz E , Sedeño L , Baez S , Ibáñez A ((2018) ) Parkinson’s disease compromises the appraisal of action meanings evoked by naturalistic texts. Cortex 100: , 111–126. |
[91] | Mariano LI , Caramelli P , Guimarães HC , Gambogi LB , Moura MVB , Yassuda MS , Teixeira AL , de Souza LC ((2020) ) Can social cognition measurements differentiate behavioral variant frontotemporal dementia from Alzheimer’s disease regardless of apathy? J Alzheimers Dis 74: , 817–827. |
[92] | Bertoux M , Volle E , Funkiewiez A , de Souza LC , Leclercq D , Dubois B ((2012) ) Social Cognition and Emotional Assessment (SEA) is a marker of medial and orbital frontal functions: A voxel-based morphometry study in behavioral variant of frontotemporal degeneration. J Int Neuropsychol Soc 18: , 972–985. |
[93] | Chiu I , Piguet O , Diehl-Schmid J , Riedl L , Beck J , Leyhe T , Holsboer-Trachsler E , Kressig RW , Berres M , Monsch AU , Sollberger M ((2018) ) Facial emotion recognition performance differentiates between behavioral variant frontotemporal dementia and major depressive disorder. J Clin Psychiatry 79: , 16m11342. |
[94] | Dodich A , Cerami C , Cappa SF , Marcone A , Golzi V , Zamboni M , Giusti MC , Iannaccone S ((2018) ) Combined socio-behavioral evaluation improves the differential diagnosis between the behavioral variant of frontotemporal dementia and Alzheimer’s disease: In search of neuropsychological markers. J Alzheimers Dis 61: , 761–772. |
[95] | Gossink F , Schouws S , Krudop W , Scheltens P , Stek M , Pijnenburg Y , Dols A ((2018) ) Social cognition differentiates behavioral variant frontotemporal dementia from other neurodegenerative diseases and psychiatric disorders. Am J Geriatr Psychiatry 26: , 569–579. |
[96] | Bertoux M , de Souza LC , Sarazin M , Funkiewiez A , Dubois B , Hornberger M ((2015) ) How preserved is emotion recognition in Alzheimer disease compared with behavioral variant frontotemporal dementia? Alzheimer Dis Assoc Disord 29: , 154–157. |
[97] | Buhl C , Stokholm J , Gade A ((2013) ) Clinical utility of short social cognitive tests in early differentiation of behavioral variant frontotemporal dementia from Alzheimer’s disease. Dement Geriatr Cogn Dis Extra 3: , 376–385. |
[98] | Narme P , Mouras H , Roussel M , Devendeville A , Godefroy O ((2013) ) Assessment of socioemotional processes facilitates the distinction between frontotemporal lobar degeneration and Alzheimer’s disease. J Clin Exp Neuropsychol 35: , 728–744. |
[99] | Diehl-Schmid J , Pohl C , Ruprecht C , Wagenpfeil S , Foerstl H , Kurz A ((2007) ) The Ekman 60 Faces Test as a diagnostic instrument in frontotemporal dementia. Arch Clin Neuropsychol 22: , 459–464. |


