
Paraoxonase 1, B Vitamins Supplementation, and Mild Cognitive Impairment
Abstract
Background:
Identification of modifiable risk factors that affect cognitive decline is important for the development of preventive and treatment strategies. Status of paraoxonase 1 (PON1), a high-density lipoprotein-associated enzyme, may play a role in the development of neurological diseases, including Alzheimer’s disease.
Objective:
We tested a hypothesis that PON1 status predicts cognition in individuals with mild cognitive impairment (MCI).
Methods:
Individuals with MCI (n = 196, 76.8-years-old, 60% women) participating in a randomized, double-blind placebo-controlled trial (VITACOG) were assigned to receive a daily dose of folic acid (0.8 mg), vitamin B12 (0.5 mg) and B6 (20 mg) (n = 95) or placebo (n = 101) for 2 years. Cognition was analyzed by neuropsychological tests. Brain atrophy was quantified in a subset of participants (n = 168) by MRI. PON1 status, including PON1 Q192R genotype, was determined by quantifying enzymatic activity of PON1 using paraoxon and phenyl acetate as substrates.
Results:
In the placebo group, baseline phenylacetate hydrolase (PhAcase) activity of PON1 (but not paraoxonase activity or PON1 Q192R genotype) was significantly associated with global cognition (Mini-Mental State Examination, MMSE; Telephone Inventory for Cognitive Status-modified, TICS-m), verbal episodic memory (Hopkins Verbal Learning Test-revised: Total Recall, HVLT-TR; Delayed Recall, HVLT-DR), and attention/processing speed (Trail Making A and Symbol Digits Modalities Test, SDMT) at the end of study. In addition to PhAcase, baseline iron and triglycerides predicted MMSE, baseline fatty acids predicted SDMT, baseline anti-N-Hcy-protein autoantibodies predicted TICS-m, SDMT, Trail Making A, while BDNF V66M genotype predicted HVLT-TR and HVLT-DR scores at the end of study. B-vitamins abrogated associations of PON1 and other variables with cognition.
Conclusion:
PON1 is a new factor associated with impaired cognition that can be ameliorated by B-vitamins in individuals with MCI.
INTRODUCTION
Dementia is a major public health issue in aging modern societies that affects 50 million individuals worldwide (as of 2017) and continues to increase [1]. Brain atrophy occurs during normal aging and is a feature of neurodegeneration that becomes more prominent in individuals with mild cognitive impairment (MCI) and is further accelerated in Alzheimer’s disease (AD) [2]. As no effective treatment for dementia is available, identification of modifiable risk factors that affect the rate of brain atrophy and cognitive decline is important for the development of preventive and treatment strategies [3, 4]. Reducing the rate of brain atrophy, for example by therapy with B vitamins [5, 6], is likely to slow the conversion of individuals with MCI to AD [2].
The prevalence of MCI, “a cognitive decline greater than that expected for an individual’s age and education level but that does not interfere notably with activities of daily life” [7], is ∼16% in individuals over 70 years of age [8, 9]. As half the MCI cases will convert to AD within 5 years after diagnosis [7], identification of biomarkers of cognitive decline and elucidation of their mechanisms of action has important public health policy implications.
PON1 is a calcium-dependent hydrolytic enzyme carried on high-density lipoprotein (HDL) in the circulation that contributes to the anti-inflammatory, anti-oxidative, and anti-atherothrombotic activities of HDL [10, 11]. The PON1 gene has several polymorphisms, including the Q192R, which involves a change from glutamine (Q variant) to arginine (R variant) at position 192 of the amino acid sequence of the PON1 protein and affects its hydrolytic activity with natural [12] and artificial [13] substrates. Historically, the hydrolytic activity of the PON1 enzyme has been assayed with non-natural substrates such as the organophosphate paraoxon (for which the PON1 enzyme has been named) and phenyl acetate [13], both considered as surrogates for an unknown endogenous substrate that promotes atherogenesis [14]. One such endogenous substrate of PON1, homocysteine (Hcy) thiolactone [12, 15], which can adversely impact protein structure/function by posttranslational modification [16], has been recently shown to be a predictor of myocardial infarction in coronary artery disease patients [17]. And indeed, the Hcy-thiolactonase activity of PON1 is strongly correlated with the paraoxonase (POase) activity in diverse populations (the United States [12], Poland [18], the United Kingdom [19], and the Netherlands [20]) while Hcy-thiolactone levels are significantly higher in carriers of low POase activity PON1-192QQ alleles compared with carriers of high POase activity PON1-192RR alleles [21], suggesting that the POase activity is a good surrogate for the physiological Hcy-thiolactonase activity. The phenylacetate hydrolase (PhAcase) activity, much less affected by the PON1-Q192R genotype, appears to be a good surrogate for the PON1 enzyme concentration [22].
Accumulating evidence suggests that the status of paraoxonase 1 (PON1) may have a role in neurological disease, including AD [23]. For example, genomic association studies found that a single-nucleotide polymorphism in the PON1 gene is a risk factor for AD [24]. Other studies show that low PON1 activity is linked to the risk of AD and dementia [25, 26].
Low PhAcase activity of PON1, found in individuals with MCI [27, 28], has been associated with an increased risk of developing vascular dementia [29]. However, how PON1 affects functional and structural aspects of brain function was not known. For this reason, the present work has been undertaken to examine PON1 activity and genotype as predictors of cognition and brain atrophy rate in individuals with MCI subjected to B vitamin therapy or placebo treatment. This aim was accomplished by studying relationships between PON1 activity (PhAcase, POase), PON1-Q192R genotype and brain function (quantified by neuropsychological testing) as well as the rate of brain atrophy (quantified by MRI).
MATERIALS AND METHODS
Participants
We analyzed serum samples from individuals with MCI who fulfilled the Petersen criteria [30] and participated in a randomized controlled trial registered as VITACOG, ISRCTN 94410159 (http://www.controlled-trials.com) [5]. MCI patients had Mini-Mental State Examination (MMSE) score of > 24/30 and no evidence of dementia. Other patients’ characteristics were collected at baseline and have been previously described, as was the study protocol [5]. The present study included 77.6±4.8-year-old participants (n = 196, 60% women) randomly assigned to the treatment (n = 95) and placebo (n = 101) groups; some participants (n = 168) had MRI scans at baseline and at 24.3±0.7 months of follow-up. Each participant received a daily oral TrioB Plus® supplement tablet (folic acid, 0.8 mg; vitamin B12 - cyanocobalamin, 0.5 mg; vitamin B6 - pyridoxine·HCl, 20 mg) or a placebo tablet for an average of two years. At baseline, 15.3 to 18.1% participants had a history of stroke, transient ischemic attack, or MRI infarct, 4.7 to 12.0% had diabetes, and 7.1 to 7.3% had myocardial infarction (in the treatment and placebo group, respectively); 49.4 to 43.4%, 30.6 to 33.7%, and 16.5 to 20.5% participants used cardiovascular disease drugs, aspirin, and B vitamins, respectively. Blood samples were collected at baseline and at the 24-months follow-up. All participants gave written informed consent. The study was carried out according to the principles of the Declaration of Helsinki and was approved by the Oxfordshire National Health Service research ethics committee (COREC 04/Q1604/100).
MRI scans
High-resolution T1-weighted images were acquired at baseline and at 2-year follow-up on a 1.5T Sonata MRI system (Siemens Medical Systems) and analyzed as previously described [5, 6].
Cognitive testing
At baseline and follow-up, neuropsychological tests were carried out by trained research nurses and psychologists blind to patient’s clinical dementia rating, as previously described in the trial protocol [5]. The tests are representative of cognitive domains affected in MCI: global cognition (MMSE [31], Telephone Inventory for Cognitive Status modified (TICS-m) [32]); episodic memory (Hopkins Verbal Learning Test-revised (HVLT-R) [33]; and attention/processing speed (Map Search [34], Trail Making A [35], Symbol Digits Modalities Test (SDMT) [36]). Executive function (Trail Making B, CLOX), semantic memory (Graded Naming, Category Fluency), the CANTAB Paired Associate Learning (visuospatial episodic memory), and Spatial Recognition Memory (SRM) tests were also used as outcome measures [37, 38].
Inductively coupled plasma-mass spectrometry
Serum samples (100μL) were mineralized with a mixture of redistilled nitric acid (70%, 300μL), hydrogen peroxide (25–35% for ultra-trace analysis, 100μL), and hydrochloric acid (30% suprapure, 100μL) for 24 h. Serial dilutions of ICP-MS single Al, As, Cu, Fe, and Si standard solutions were used for calibration. Additionally, for ICP-MS Sc, Rh, Be, and Ge in 1% HNO3≥99.999% trace metals basis were used as internal standards (automatically added during analysis through T-piece). Reagents and standards for mineralization were purchased from the Sigma Aldrich Merck group, Poznań, Poland. Deionized water was obtained from the Milli-Q Direct 8 Water Purification System (Merck Millipore). A certified reference material, BCR 637 (Institute for Reference Materials and Measurements) as well as reference material ERM-DA120 (European Reference Materials) were analyzed to validate the calibration. Analyses were in agreement with certified values, with recoveries from 93 to 104%. The intra-assay analytical variability, determined with six assays of the same sample in one run, was 1.3% and 6.4% for Cu and Fe, respectively. The inter-assay variability, determined with 20 samples assayed on different days was 20.1%, 13.1%, 1.7%, 13.2%, and 2.1% for Al, As, Cu, Fe, and Si, respectively.
Paraoxonase 1 activity
Serum PON1 activity was quantified by using POase and arylesterase (PhAcase) assays as described previously [15, 20]. Briefly, reaction mixtures contained 0.05 M K-Hepes buffer (pH 7.4), 1 mM CaCl2, serum (100- and 400-fold diluted for POase and PhAcase assays, respectively), and paraoxon (2 mM) or phenyl acetate (5 mM). The assays were carried out in duplicates at 25°C in a 96-well plate format using Infinite M200Pro Spectrophotometer (Tecan, Männedorf, Switzerland), initiated by the addition of the substrate, monitored by spectroscopy. Each run included blanks in which PON1 activity was inactivated by 10 mM EDTA.
For POase activity assays, the generation of p-nitrophenol from paraoxon (MiliporeSigma, St. Louis, MO) was monitored at 412 nm (ɛ = 13,000 M-1 cm-1) for 5 min and reaction rates (A412/min) were calculated. For PhAcase activity assays, the generation of phenol from phenyl acetate (MiliporeSigma, St. Louis, MO) was monitored at 270 nm (ɛ= 1300 M-1 cm-1) for 3 min and the rates (A270/min) calculated. Coefficients of variance for POase and PhAcase activities were 6.1% and 2.1%, respectively. One unit of activity is defined as a change in the absorbance of 0.0001 per min.
PON1 Q192R polymorphism
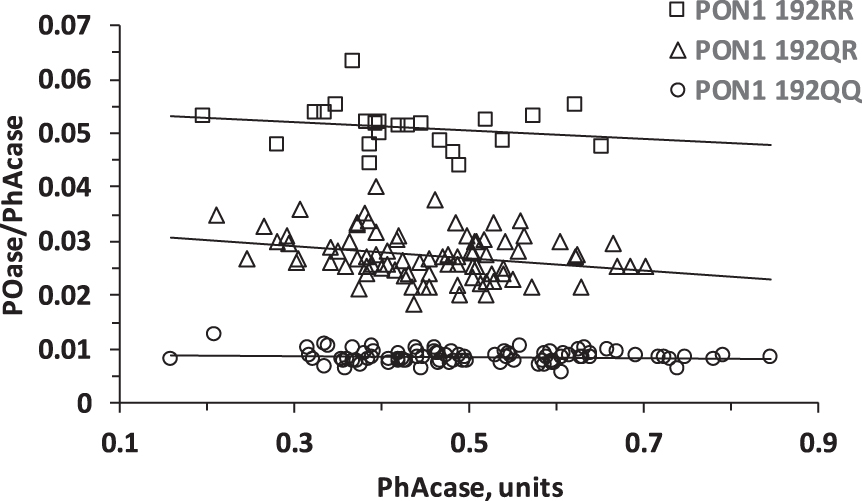
The PON1 Q192R polymorphism was established by the two substrate activity measurements method [39, 40] (Fig. 1).
Fig. 1
Population distribution plot for POase versus PhAcase showing resolution of MCI individuals according to PON1 192QQ, PON1 192QR, and PON1 192RR genotypes.
BDNF V66M genotyping
Genomic DNA was isolated from whole human blood using the phenol extraction procedure and stored at –80°C. The human BDNF locus was genotyped by PCR-RFLP as previously described [41]. The BDNF V66M alleles were amplified using the primers 5’-AAAGAAGCAAACATCCGAGGACAAG-3’ (forward) and 5’-ATTCCTCCAGCAGAAAGAGAAGAGG-3’ (reverse) at an annealing temperature 95°C-3 min, 95°C-15 s, 56°C-15 s, 72°C-5 min for 40 cycles. The 274 bp PCR product was digested with Hin1II (NlaIII) (New England Biolabs) and analyzed on 4% agarose gels. Two bands (216 and 58 bp indicate the BDNF-66V allele while three band (139, 77, and 258 bp) signify the BDNF-66M allele.
Anti-N-Hcy-protein autoantibody assays and metabolite analyses
Values for serum anti-N-Hcy-protein autoantibodies [42], plasma total homocysteine (tHcy), and other metabolites [5] were obtained from analyses reported previously.
Statistical analysis
Normality of variables distributions was examined using the Shapiro-Wilk’s statistic or Chi-square test. Non-normally distributed variables were log-transformed. Unpaired two-sided or paired t-tests were used for comparisons between two groups of variables. Associations between variables were examined by Pearson’s correlations and multiple linear regression using log-transformed data. In Tables 2–8, the independent variables included in a particular model are those that have numerical entries in columns for each model. Other independent variables are indicated in the legend to each table. Statistical software packages PSPP, version 1.0.1 (http://www.gnu.org) and Statistica, version 13 (TIBCO Software Inc., Palo Alto, CA, USA, http://statistica.io) were used. Probability values were 2-sided and p value < 0.05 was considered statistically significant.
Table 1
POase and PhAcase activities of PON1 stratified by PON1 Q192R genotype in participants with MCI*
| Genotype | n (%) | POase | PhAcase | ||
| Units×100 | p versus QQ | Units | p versus QQ | ||
| 192QQ | 87 (44.4) | 0.43±0.12 | 0.51±0.13 | ||
| 192QR | 86 (43.8) | 1.23±0.30 | 1.3E–54 | 0.45±0.10 | 7.9E–3 |
| 192RR | 23 (11.7) | 2.16±0.54 | 1.8E–50 | 0.43±0.11 | 2.2E–29 |
| All | 196 (100) | 0.98±0.64 | 0.47±0.12 | ||
*PhAcase, phenylacetate hydrolase; POase, paraoxonase.
Table 2
Baseline determinants of PON1 activities*
| Variable | LnPhAcase | LnPOase | ||||||
| (n = 186–196) | ||||||||
| Pearson correlation | Multiple regression | Pearson correlation | Multiple regression | |||||
| β | p | β | p | β | p | β | p | |
| PON1 Q192R | –0.17 | 0.016 | –0.15 | 0.026 | 0.89 | 0.000 | 0.90 | 0.000 |
| BDNF V66M | –0.17 | 0.014 | 0.00 | 0.972 | ||||
| LnFe | –0.32 | 0.000 | –0.21 | 0.000 | –0.01 | 0.877 | –0.06 | 0.077 |
| LnCu | 0.07 | 0.340 | –0.06 | 0.404 | ||||
| LnAl | –0.25 | 0.001 | –0.01 | 0.942 | ||||
| LnAs | 0.02 | 0.775 | 0.18 | 0.015 | ||||
| LnSi | –0.20 | 0.006 | –0.16 | 0.034 | ||||
| LnCreatinine | –0.26 | 0.000 | –0.23 | 0.001 | –0.05 | 0.495 | –0.05 | 0.160 |
| LnTaurine | 0.14 | 0.044 | 0.03 | 0.632 | ||||
| LntHcy | –0.21 | 0.003 | –0.04 | 0.607 | ||||
| LnCys | –0.17 | 0.018 | 0.02 | 0.757 | ||||
| LnHVLT-DR | 0.18 | 0.017 | 0.01 | 0.845 | ||||
| LnHVLT-TR | 0.15 | 0.035 | 0.05 | 0.526 | ||||
| LnTrail Making A | –0.14 | 0.043 | 0.01 | 0.918 | ||||
| LnCategory_Fluency | 0.16 | 0.024 | 0.03 | 0.396 | ||||
| LnAnti-N-Hcy | –0.03 | 0.692 | 0.15 | 0.046 | ||||
| Age | –0.20 | 0.005 | 0.00 | 0.962 | ||||
| Sex | 0.11 | 0.133 | 0.011 | 0.122 | ||||
| F = 12.7, | F = 242.7, | |||||||
| p = 0.000, | p = 0.000, | |||||||
| Adjusted | Adjusted | |||||||
| R2 = 0.16 | R2 = 0.80 | |||||||
*Ln, natural logarithm; PhAcase, phenylacetate hydrolase; POase, paraoxonase.
Table 3
Determinants of global cognition at the end of study: LnMMSE_2, placebo group*
| Variable | Pearson correlation | Multiple regression# | ||||||||||||
| (n = 82–112) | ||||||||||||||
| Model 1 | Model 2 | Model 3 | Model 4 | Model 5 | Model 6 | |||||||||
| β | p | β | p | β | p | β | p | β | p | β | p | β | p | |
| LntHcy_1 | –0.28 | 0.003 | –0.32 | 0.017 | –0.29 | 0.030 | –0.32 | 0.023 | –0.31 | 0.024 | –0.27 | 0.050 | –0.29 | 0.037 |
| LnPOase_1 | –0.06 | 0.526 | –0.28 | 0.246 | –0.04 | 0.725 | ||||||||
| LnPhAcase_1 | –0.11 | 0.286 | –0.24 | 0.034 | –0.23 | 0.033 | ||||||||
| PON1-Q192R | –0.01 | 0.964 | –0.02 | 0.854 | 0.06 | 0.624 | 0.30 | 0.211 | ||||||
| LnTG_1 | –0.08 | 0.387 | –0.22 | 0.044 | –0.20 | 0.058 | –0.20 | 0.080 | –0.19 | 0.099 | –0.20 | 0.071 | –0.19 | 0.084 |
| LnFe_1 | 0.05 | 0.650 | 0.24 | 0.031 | 0.23 | 0.030 | 0.28 | 0.014 | 0.26 | 0.023 | 0.29 | 0.010 | 0.27 | 0.013 |
| LnAtrophy_rate | –0.31 | 0.006 | –0.27 | 0.029 | –0.25 | 0.038 | –0.24 | 0.057 | –0.25 | 0.045 | –0.24 | 0.062 | 0.33 | 0.002 |
| LnMMSE_1 | 0.34 | 0.000 | 0.26 | 0.017 | 0.29 | 0.005 | 0.32 | 0.004 | 0.30 | 0.006 | 0.43 | 0.000 | 0.33 | 0.002 |
| Age | –0.28 | 0.003 | –0.24 | 0.056 | –0.26 | 0.034 | –0.24 | 0.063 | –0.23 | 0.071 | –0.27 | 0.039 | –0.26 | –0.041 |
| F = 5.63, | F = 5.63, | F = 4.86, | F = 4.57, | F = 4.73, | F = 5.21, | |||||||||
| p = 0.000, | p = 0.000, | p = 0.000, | p = 0.000, | p = 0.000, | p = 0.000, | |||||||||
| Adjusted | Adjusted | Adjusted | Adjusted | Adjusted | Adjusted | |||||||||
| R2 = 0.43 | R2 = 0.43 | R2 = 0.39 | R2 = 0.39 | R2 = 0.38; | R2 = 0.38 | |||||||||
*Ln, natural logarithm; PhAcase, phenylacetate hydrolase; POase, paraoxonase; TG, triglyceride; _1, baseline; _2, end of study. # Adjusted for sex, LnAnti-N-Hcy_1, and BDNF V66M genotype.
Table 4
Determinants of global memory at the end of study: LnTICSm_2, placebo
| Variable | Pearson correlation | Multiple regression# | ||||||||||||
| (n = 82–112) | ||||||||||||||
| Model 1 | Model 2 | Model 3 | Model 4 | Model 5 | Model 6 | |||||||||
| β | p | β | p | β | p | β | p | β | p | β | p | β | p | |
| LntHcy-_1 | –0.39 | 0.000 | –0.23 | 0.040 | –0.23 | 0.039 | –0.21 | 0.071 | –0.23 | 0.056 | –0.20 | 0.087 | –0.20 | 0.086 |
| LnPhAcase_1 | –0.16 | 0.113 | –0.24 | 0.027 | –0.27 | 0.005 | ||||||||
| LnPOase_1 | –0.04 | 0.721 | –0.25 | 0.285 | 0.12 | 0.241 | ||||||||
| PON1-Q192R | 0.03 | 0.744 | 0.09 | 0.372 | 0.18 | 0.065 | 0.39 | 0.076 | ||||||
| LnAnti-N-Hcy_1 | 0.03 | 0.763 | –0.20 | 0.049 | –0.18 | 0.068 | –0.24 | 0.021 | –0.22 | 0.042 | –0.24 | 0.028 | –0.20 | 0.052 |
| LnAtrophy_rate | –0.41 | 0.000 | –0.27 | 0.011 | –0.28 | 0.007 | –0.23 | 0.035 | –0.24 | 0.026 | –0.22 | 0.040 | –0.23 | 0.035 |
| LnTICSm_1 | 0.43 | 0.000 | 0.25 | 0.017 | 0.23 | 0.017 | 0.35 | 0.001 | 0.31 | 0.004 | 0.36 | 0.001 | 0.33 | 0.001 |
| Age | –0.36 | 0.000 | –0.40 | 0.000 | –0.34 | 0.036 | –0.39 | 0.001 | –0.38 | 0.001 | –0.40 | 0.001 | –0.38 | 0.001 |
| F = 9.39, | F = 10.93, | F = 9.31, | F = 8.31, | F = 8.90, | F = 10.35, | |||||||||
| p = 0.000, | p = 0.000, | p = 0.000, | p = 0.000, | p = 0.000, | p = 0.000, | |||||||||
| Adjusted | Adjusted | Adjusted | Adjusted | Adjusted | Adjusted | |||||||||
| R2 = 0.51 | R2 = 0.52 | R2 = 0.48 | R2 = 0.48 | R2 = 0.46; | R2 = 0.46 | |||||||||
*Ln, natural logarithm; PhAcase, phenylacetate hydrolase; POase, paraoxonase; _1, baseline; _2, end of study. # Adjusted for sex.
Table 5
Determinants of verbal episodic memory at the end of study: LnHVLT-TR_2, placebo group*
| Variable | Pearson correlation | Multiple regression# | ||||||||||||
| (n = 82–112) | ||||||||||||||
| Model 1 | Model 2 | Model 3 | Model 4 | Model 5 | Model 6 | |||||||||
| β | p | β | p | β | p | β | p | β | p | β | p | β | p | |
| LntHcy-_1 | –0.36 | 0.000 | ||||||||||||
| LnPOase_1 | 0.02 | 0.840 | –0.40 | 0.053 | –0.02 | 0.840 | ||||||||
| LnPhAcase_1 | –0.01 | 0.939 | –0.19 | 0.046 | –0.20 | 0.028 | ||||||||
| PON1-Q192R | 0.07 | 0.517 | 0.03 | 0.714 | 0.07 | 0.423 | 0.44 | 0.037 | ||||||
| LnCreatinine_1 | –0.33 | 0.000 | ||||||||||||
| LnAtrophy_rate | –0.35 | 0.001 | –0.19 | 0.177 | –0.19 | 0.076 | –0.18 | 0.105 | –0.20 | 0.058 | –0.17 | 0.116 | –0.15 | 0.212 |
| LnHVLT-TR_1 | 0.69 | 0.000 | 0.45 | 0.000 | 0.44 | 0.000 | 0.43 | 0.000 | 0.41 | 0.000 | 0.42 | 0.000 | 0.43 | 0.000 |
| BDNF V66M | 0.09 | 0.345 | 0.21 | 0.034 | 0.22 | 0.021 | 0.024 | 0.017 | 0.25 | 0.011 | 0.27 | 0.008 | 0.21 | 0.019 |
| Age | –0.29 | 0.002 | –0.25 | 0.012 | –0.26 | 0.008 | –0.25 | 0.014 | –0.25 | 0.023 | –0.27 | 0.008 | –0.30 | 0.001 |
| Sex | 0.21 | 0.030 | ||||||||||||
| F = 8.89, | F = 10.37, | F = 8.97, | F = 8.82, | F = 8.95, | F = 12.35, | |||||||||
| p = 0.000, | p = 0.000, | p = 0.000, | p = 0.000, | p = 0.000, | p = 0.000, | |||||||||
| Adjusted | Adjusted | Adjusted | Adjusted | Adjusted | Adjusted | |||||||||
| R2 = 0.53 | R2 = 0.54 | R2 = 0.50 | R2 = 0.52 | R2 = 0.49; | R2 = 0.51 | |||||||||
*Ln, natural logarithm; PhAcase, phenylacetate hydrolase; POase, paraoxonase; _1, baseline; _2, end of study. # Adjusted for sex, creatinine_1, LntHcy_1, and TCN 776CG genotype. LntHcy_1 was not significant in any of the models.
Table 6
Determinants of verbal episodic memory at the end of study: LnHVLT-DR_2, placebo group*
| Variable | Pearson correlation | Multiple regression# | ||||||||||||
| (n = 82–112) | ||||||||||||||
| Model 1 | Model 2 | Model 3 | Model 4 | Model 5 | Model 6 | |||||||||
| β | p | β | p | β | p | β | p | β | p | β | p | β | p | |
| LntHcy-_1 | –0.37 | 0.000 | ||||||||||||
| LnPOase_1 | –0.04 | 0.710 | –0.54 | 0.053 | –0.16 | 0.192 | ||||||||
| LnPhAcase_1 | 0.01 | 0.942 | –0.32 | 0.012 | –0.29 | 0.015 | ||||||||
| PON1-Q192R | 0.00 | 0.998 | –0.14 | 0.231 | –0.05 | 0.655 | 0.40 | 0.125 | ||||||
| LnFe_1 | –0.19 | 0.090 | ||||||||||||
| LnAtrophy_rate | –0.30 | 0.008 | –0.24 | 0.053 | –0.21 | 0.054 | –0.22 | 0.089 | –0.26 | 0.047 | –0.24 | 0.068 | –0.22 | 0.087 |
| LnHVLT-DR_1 | 0.55 | 0.000 | 0.46 | 0.000 | 0.44 | 0.001 | 0.38 | 0.004 | 0.41 | 0.002 | 0.40 | 0.002 | 0.38 | 0.003 |
| APOE | –0.21 | 0.038 | ||||||||||||
| BDNF V66M | 0.05 | 0.641 | 0.31 | 0.010 | 0.29 | 0.015 | 0.31 | 0.015 | 0.38 | 0.004 | 0.36 | 0.005 | 0.31 | 0.010 |
| Age | –0.33 | 0.000 | ||||||||||||
| Sex | 0.14 | 0.167 | ||||||||||||
| F = 4.68, | F = 5.23, | F = 3.93, | F = 4.14, | F = 4.41, | F = 4.93, | |||||||||
| p = 0.000, | p = 0.000, | p = 0.000, | p = 0.000, | p = 0.000, | p = 0.000, | |||||||||
| Adjusted | Adjusted | Adjusted | Adjusted | Adjusted | Adjusted | |||||||||
| R2 = 0.37 | R2 = 0.37 | R2 = 0.29 | R2 = 0.34 | R2 = 0.32; | R2 = 0.32 | |||||||||
*Ln, natural logarithm; PhAcase, phenylacetate hydrolase; POase, paraoxonase; _1, baseline; _2, end of study. # Adjusted for sex, LnAnti-N-Hcy_1, LntHcy_1, and APOE genotype. LntHcy_1 was not significant in any of the models.
Table 7
Determinants of attention/processing speed at the end of study: LnTrail_making_A_2, placebo group*
| Variable | Pearson correlation | Multiple regression# | ||||||||||||
| (n = 78–110) | ||||||||||||||
| Model 1 | Model 2 | Model 3 | Model 4 | Model 5 | Model 6 | |||||||||
| β | p | β | p | β | p | β | p | β | p | β | p | β | p | |
| LntHcy-_1 | 0.38 | 0.000 | 0.32 | 0.008 | 0.32 | 0.008 | 0.31 | 0.014 | 0.31 | 0.014 | 0.26 | 0.028 | ||
| LnPOase_1 | 0.16 | 0.120 | 0.16 | 0.453 | 0.14 | 0.148 | ||||||||
| LnPhAcase_1 | 0.14 | 0.163 | 0.24 | 0.015 | 0.19 | 0.055 | ||||||||
| PON1-Q192R | 0.08 | 0.434 | 0.19 | 0.049 | 0.13 | 0.193 | –0.02 | 0.295 | ||||||
| LnAnti-N-Hcy_1 | –0.02 | 0.877 | 0.24 | 0.025 | 0.27 | 0.011 | 0.26 | 0.020 | 0.24 | 0.028 | 0.25 | 0.025 | 0.28 | 0.011 |
| LnAtrophy_rate | 0.34 | 0.002 | 0.30 | 0.007 | 0.30 | 0.007 | 0.28 | 0.013 | 0.29 | 0.013 | 0.29 | 0.010 | 0.29 | 0.011 |
| LnTrail_making_A _1 | 0.52 | 0.000 | 0.32 | 0.001 | 0.32 | 0.001 | 0.29 | 0.003 | 0.29 | 0.003 | 0.28 | 0.004 | 0.30 | 0.003 |
| Age | 0.37 | 0.000 | 0.31 | 0.005 | 0.31 | 0.005 | 0.32 | 0.005 | 0.32 | 0.006 | 0.32 | 0.006 | 0.32 | 0.005 |
| F = 6.70, | F = 6.53, | F = 6.05, | F = 5.61, | F = 6.20, | F = 6.59, | |||||||||
| p = 0.000, | p = 0.000, | p = 0.000, | p = 0.000, | p = 0.000, | p = 0.000, | |||||||||
| Adjusted | Adjusted | Adjusted | Adjusted | Adjusted | Adjusted | |||||||||
| R2 = 0.57 | R2 = 0.54 | R2 = 0.52 | R2 = 0.51 | R2 = 0.52; | R2 = 0.52 | |||||||||
*Ln, natural logarithm; PhAcase, phenylacetate hydrolase; POase, paraoxonase; _1, baseline; _2, end of study. #Adjusted for sex, LnFA_1, LnTG_1, COMT V158M and DHFR 19bpins genotypes.
Table 8
Determinants of attention/processing speed at the end of study: LnSDMT_2, placebo group
| Variable | Pearson correlation | Multiple regression# | ||||||||||||
| (n = 78–109) | ||||||||||||||
| Model 1 | Model 2 | Model 3 | Model 4 | Model 5 | Model 6 | |||||||||
| β | p | β | p | β | p | β | p | β | p | β | p | β | p | |
| LntHcy-_1 | –0.31 | 0.001 | –0.20 | 0.013 | –0.19 | 0.013 | –0.19 | 0.025 | –0.19 | 0.019 | –0.19 | 0.022 | –0.18 | 0.026 |
| LnPOase_1 | –0.17 | 0.107 | –0.33 | 0.028 | –0.06 | 0.336 | ||||||||
| LnPhAcase_1 | –0.14 | 0.162 | –0.18 | 0.008 | –0.16 | 0.011 | ||||||||
| PON1-Q192R | –0.04 | 0.702 | –0.06 | 0.417 | 0.00 | 0.963 | 0.29 | 0.047 | ||||||
| LnFA_1 | –0.14 | 0.157 | –0.20 | 0.020 | –0.20 | 0.017 | –0.21 | 0.020 | –0.19 | 0.032 | –0.24 | 0.005 | –0.24 | 0.006 |
| LnAnti-N–Hcy_1 | –0.01 | 0.912 | –0.15 | 0.041 | –0.15 | 0.027 | –0.17 | 0.025 | –0.14 | 0.047 | –0.15 | 0.036 | –0.17 | 0.017 |
| LnAtrophy_rate | –0.35 | 0.002 | –0.24 | 0.001 | –0.24 | 0.001 | –0.22 | 0.005 | –0.23 | 0.002 | –0.21 | 0.005 | –0.22 | 0.004 |
| LnSDMT _1 | 0.80 | 0.000 | 0.65 | 0.000 | 0.67 | 0.000 | 0.67 | 0.000 | 0.65 | 0.000 | 0.67 | 0.000 | 0.68 | 0.000 |
| Age | –0.35 | 0.000 | ||||||||||||
| F = 23.20, | F = 27.39, | F = 22.18, | F = 22.04, | F = 24.03, | F = 27.23, | |||||||||
| p = 0.000, | p = 0.000, | p = 0.000, | p = 0.000, | p = 0.000, | p = 0.000, | |||||||||
| Adjusted | Adjusted | Adjusted | Adjusted | Adjusted | Adjusted | |||||||||
| R2 = 0.78 | R2 = 0.79 | R2 = 0.76 | R2 = 0.78 | R2 = 0.77; | R2 = 0.77 | |||||||||
*Ln, natural logarithm; PhAcase, phenylacetate hydrolase; POase, paraoxonase; _1, baseline; _2, end of study. # Adjusted for sex, and LnTG_1.
RESULTS
Baseline PON1 characteristics in the MCI cohort
We quantified serum PON1 activities in a cohort of MCI patients (n = 196) using paraoxon (for POase) or phenylacetate (PhAcase) as substrates. These measurements allow identification of PON1 Q192R genotype for each participant in the study [39, 40]. A plot of POase/PhAcase versus PhAcase shows three distinct groups of data points that identify 192QQ, 192QR, and 192RR individuals in our cohort (Fig. 1).
The frequencies of the 192QQ, 192QR, and 192RR genotypes in the MCI cohort were 44.4%, 43.8%, and 11.7%, respectively (Table 1), similar to other European populations [18, 19, 21, 40, 43]. The 192Q and 192R alleles were in the Hardy-Weinberg equilibrium (established by the Chi-square Test for Normality), as observed in other populations [12, 21, 39, 43].
The 192QQ and 192RR genotypes were associated with low and high POase activities, respectively (Table 1). In contrast, the Q192R polymorphism had an inverse effect on the PhAcase activity: 192QQ and 192RR genotypes were associated with high and low PhAcase activities, respectively (Table 1), consistent with findings in other populations [21, 44, 45].
Neuropsychological measures of cognition are associated with PhAcase activity of PON1 at baseline
Associations between baseline PhAcase, POase, PON1 Q192R genotype, and neuropsychological measures of cognition and other baseline variables are shown in Table 2.
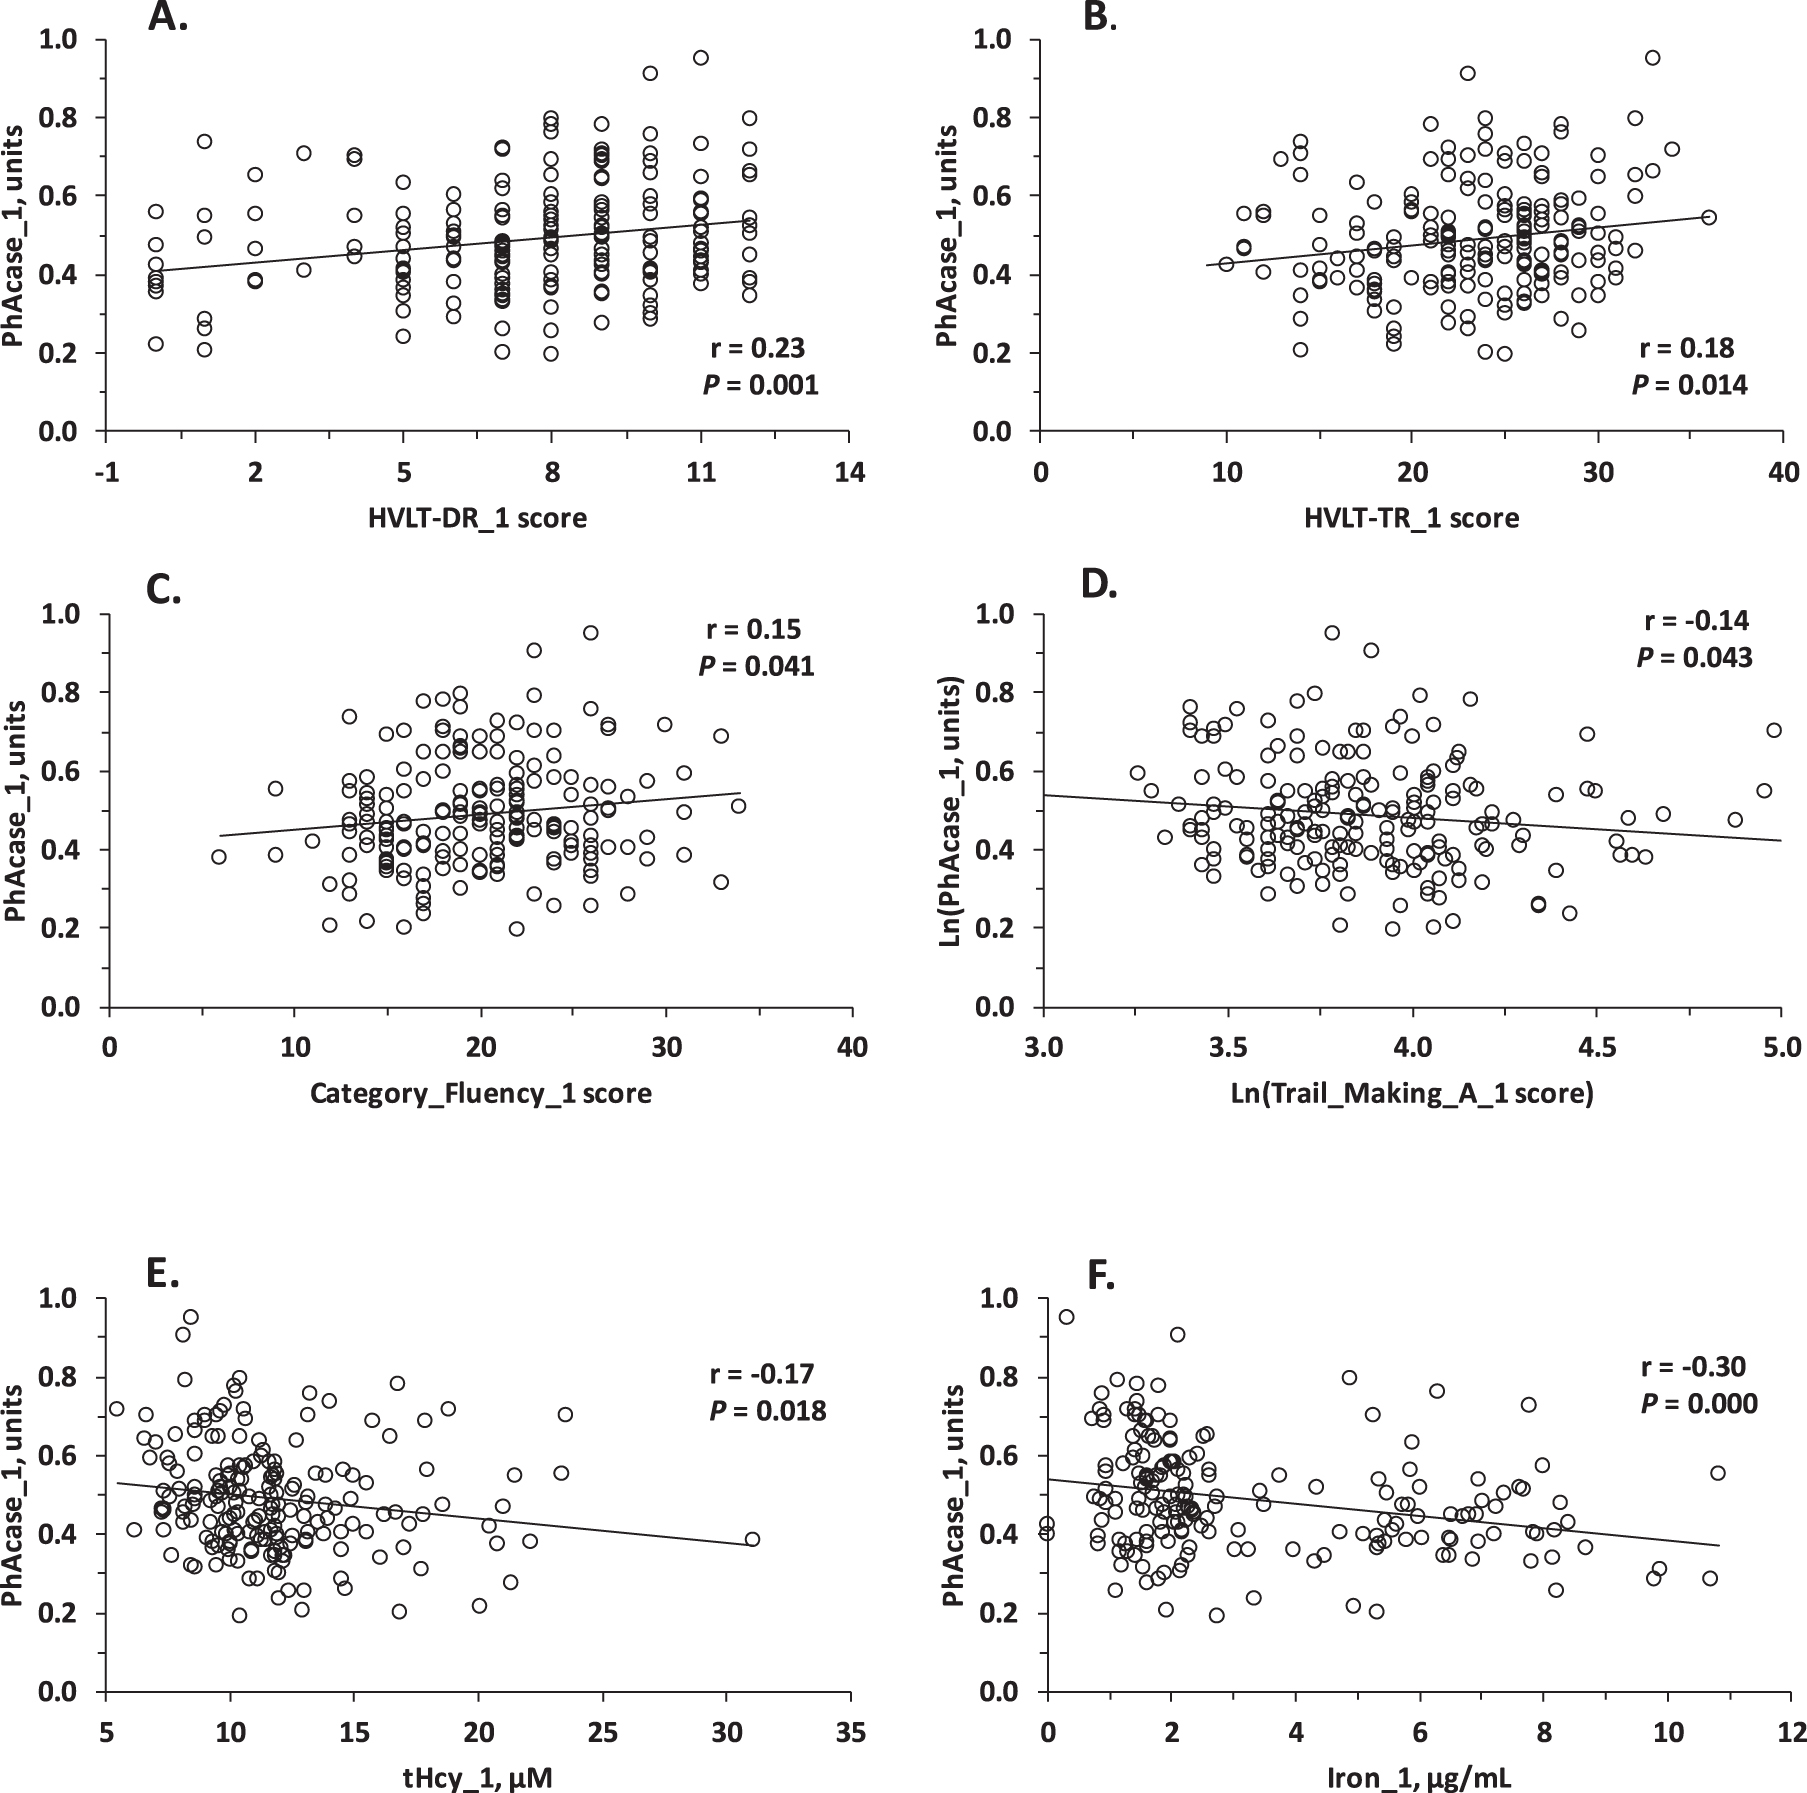
Pearson correlation analysis showed that baseline PhAcase activity was significantly associated with neuropsychological measures in three domains of cognition at baseline: verbal episodic memory (HVLT-TR, HVLT-DR) (Fig. 2A, B), semantic memory (Category Fluency) (Fig. 2C), and attention/processing speed (Trail Making A) (Fig. 2D). PhAcase was also significantly associated with other variables at baseline: tHcy (Fig. 2E), Fe (Fig. 2F), Al, Si (but not with Cu and As), creatinine, taurine, cysteine, age, BDNF V66M genotype, and, as expected [21, 44, 45], with PON1 Q192R genotype (Table 2). In contrast, baseline POase activity was not associated with neuropsychological measures of cognition but was associated with Si, As, anti-N-Hcy autoantibodies, and PON1 Q192R genotype (Table 2).
Fig. 2
Relationships between PhAcase activity of serum PON1 and verbal episodic memory (A) HVLT-DR, (B) HVLT-TR test scores, tHcy (C), and iron (D) at baseline.
In multiple regression analysis, baseline PhAcase activity was significantly associated with iron, creatinine, and PON1 Q192R genotype. In contrast, baseline POase activity was associated only with PON1 Q192R genotype (Table 2).
PON1 measures at baseline determine cognition at the end of study: The placebo group
Multiple regression analysis for the placebo group in models including neuropsychological test score at the end of study as a dependent variable and PON1 measures and other variables at baseline as independent variables revealed that baseline PhAcase, but not POase nor PON1 Q192R genotype, was a predictor of cognition in four domains at the end of study: global cognition (MMSE, TICS-m), verbal episodic memory (HVLT TR, HVLT DR), and attention/processing speed (SDMT, Trail Making A). There was no association between baseline PhAcase and scores in other neuropsychological tests at the end of study: PAL Total Errors and CATNAB SRM (visuospatial episodic memory), Trail Making B and CLOX (executive function), Map Search (complex attention/processing speed), Graded Naming and Category Fluency (semantic memory).
Global cognition: MMSE_2
Baseline variables that determined global cognition score in the MMSE_2 test at the end of study were PhAcase (β=–0.24, p = 0.034), Fe (β= 0.24, p = 0.031), tHcy (β= –0.32, p = 0.017), triglycerides (β= –0.22, p = 0.044), MMSE_1 score (β= 0.26, p = 0.017), rate of brain atrophy (β= –0.27, p = 0.029), and age (β= –0.24, p = 0.056); adjusted R2 was 0.43 (Table 3, Model 1).s
PON1 Q192R genotype did not affect these associations and MMSE_2 was not associated with PON1 Q192R genotype in models with (Model 1: β= –0.02, p = 0.854) or without PhAcase (Model 3: β= 0.06, p = 0.624). MMSE_2 was also not associated with POase in models with (Model 4: β= –0.28, p = 0.246) or without PON1 Q192R genotype (Model 5: β= –0.04, p = 0.725).
We also found that MMSE_2 score was significantly associated with baseline iron independently of the PON1 status in models with or without PhAcase, POase, and/or PON1 Q192R genotype (Models 1–6).
The R2 values in Models 1–5 versus Model 6 (Table 3) suggested that PhAcase explained a greater fraction of the MMSE_2 score variation (at least 5%; Model 2 versus Model 6) than did POase (0%; Model 5 versus Model 6) or PON1 Q192R genotype (1%; Model 3 versus Model 6). Because higher score in the MMSE test indicates better cognitive outcome, these findings suggest that higher PhAcase activity has a detrimental effect on general cognition, similar to the detrimental effect of elevated tHcy.
Global cognition/memory: TICS-m_2
Baseline variables that significantly determined global cognition/memory score in the TICS-m_2 test at the end of study were PhAcase (β= –0.27, p = 0.005), tHcy (β=–0.23, p = 0.039), TICS-m_1 score (β= 0.23, p = 0.017), rate of brain atrophy (β=–0.28, p = 0.007), and age (β=–0.34, p = 0.036); adjusted R2 was 0.52 (Table 4, Model 2).
PON1 Q192R genotype did not affect these associations and TICS-m_2 was not significantly associated with PON1 Q192R genotype in models with (Model 1: β= 0.09, p = 0.372) or without PhAcase (Model 3: β= 0.18, p = 0.065). TICS-m_2 was also not associated with POase in models with (Model 4: β= –0.25, p = 0.285) or without PON1 Q192R genotype (Model 5: β= 0.12, p = 0.241).
We also found that TICS-m_2 score was significantly associated with baseline anti-N-Hcy autoantibodies in models with (Model 1: β=–0.20, p = 0.049) and without PhAcase (Model 3: β=–0.24, p = 0.021; Model 4; β=–0.22, p = 0.042; Model 5: β= –0.24, p = 0.028).
The R2 values in Models 1–5 versus Model 6 (Table 4) suggested that PhAcase explained a greater fraction of variation (at least 6%; Model 2 versus Model 6) in the TICS-m_2 score than did POase (0%; Model 5 versus Model 6) or PON1 Q192R (2%; Model 3 versus Model 6) genotype. Because higher score in the TICS-m test indicates better cognition, these findings suggest that higher PhAcase activity has a detrimental effect on global cognition/memory, similar to the detrimental effect of elevated tHcy or anti-N-Hcy autoantibodies (Table 4).
Episodic memory: HVLT-TR_2
Baseline variables that significantly determined episodic memory score in the HVLT-TR_2 test at the end of study were PhAcase (β= –0.20, p = 0.028), HVLT-TR_1 score (β= 0.44, p = 0.000), age (β = –0.26, p = 0.008), and BDNF V66M genotype (β= 0.22, p = 0.021); adjusted R2 was 0.54 (Table 5, Model 2).
PON1 Q192R genotype did not affect these associations and HVLT-TR_2 was not associated with PON1 Q192R genotype in models with (Model 1: β= 0.03, p = 0.714) or without PhAcase (Model 3: β= 0.07, p = 0.423). HVLT-TR_2 was also not significantly associated with POase in models with (Model 4: β= –0.40, p = 0.053) or without PON1 Q192R genotype (Model 5: β=–0.02, p = 0.840).
The association of HVLT-TR_2 score with BDNF V66M genotype was independent of the PON1 status and was observed in models with or without PhAcase, POase, and/or PON1 Q192R genotype (Models 1–6). The carriers of BDNF 66V allele had a higher HVLT-TR_2 score (better cognition) compared with carriers of BDNF 66M allele.
The R2 values in Models 1–5 versus Model 6 (Table 5) suggested that PhAcase explained a greater fraction of variation (at least 3%; Model 2 versus Model 6) in the HVLT-TR_2 score than did POase (-2%; Model 5 versus Model 6) or PON1 Q192R (-1%; Model 3 versus Model 6) genotype. Because higher score in the HVLT-TR test indicates better cognition, these findings suggest that higher PhAcase activity has a detrimental effect on episodic memory.
Episodic memory: HVLT-DR_2
Baseline variables that significantly determined episodic memory score in the HVLT-DR_2 test at the end of study were PhAcase (β= –0.29, p = 0.015), HVLT-DR _1 score (β= 0.44, p = 0.001), and BDNF V66M genotype (β= 0.29, p = 0.015); adjusted R2 was 0.37 (Table 6, Model 2).
PON1 Q192R genotype did not affect these associations: HVLT-DR_2 was not associated with PON1 Q192R genotype in models with (Model 1: β= –0.14, p = 0.231) or without PhAcase (Model 3: β = –0.05, p = 0.655). HVLT-DR_2 was also not significantly associated with POase in models with (Model 4: β= –0.54, p = 0.053) or without PON1 Q192R genotype (Model 5: β=–0.16, p = 0.192).
The association of HVLT-DR_2 score with BDNF V66M genotype was independent of the PON1 status in models with or without PhAcase, POase, and/or PON1 Q192R genotype (Models 1–6). The carriers of BDNF 66V allele had a higher HVLT-DR_2 score (better cognition) compared with carriers of BDNF 66M allele.
The R2 values in Models 1–5 versus Model 6 (Table 6) suggested that PhAcase explained a greater fraction of variation in the HVLT-TR_2 score (at least 4%; Model 2 versus Model 6) than did POase (0%; Model 5 versus Model 6) or PON1 Q192R genotype (-3%; Model 3 versus Model 6). Because higher score in the HVLT-DR test indicates better cognition, these findings suggest that higher PhAcase activity has a detrimental effect on episodic memory.
Attention/processing speed: Trail Making A_2
Baseline variables that significantly determined attention/speed score in the Trail Making A_2 test at the end of study were PhAcase (β= 0.24, p = 0.015), tHcy (β= 0.32, p = 0.008), anti-N-Hcy autoantibodies (β= 0.24, p = 0.025), Trail Making A _1 score (β= 0.32, p = 0.000), PON1 Q192R genotype (β= 0.19, p = 0.049), and age (β= 0.31, p = 0.005); adjusted R2 was 0.57 (Table 7, Model 1). The carriers of PON1 192R allele had a higher Trail Making A_2 score compared with carriers of PON1 192Q allele. Trail Making A_2 tended to be associated with PhAcase in a model without PON1 Q192R genotype (Model 2; β= 0.19, p = 0.055) but was not associated with PON1 Q192R genotype in models without PhAcase (Models 3 and 4) nor with POase in models with (Model 4: β= 0.16, p = 0.453) or without PON1 Q192R genotype (Model 5: β= 0.14, p = 0.148).
The association of HVLT-DR_2 score with anti-N-Hcy autoantibodies was independent of the PON1 status in models with or without PhAcase, POase, and/or PON1 Q192R genotype (Models 1–6).
The R2 values in Models 1–5 versus Model 6 (Table 7) suggested that PhAcase explained a greater fraction of variation in the Trail Making A_2 score (2 –4%; Models 2 and 1 versus Model 6) than did POase (0%; Model 5 versus Model 6) or PON1 Q192R genotype (0%; Model 3 versus Model 6). Because higher score in Trail Making A test indicates worse cognition, these findings suggest that higher PhAcase activity has a detrimental effect on attention/processing speed.
Attention/processing speed: SDMT_2
Baseline variables that significantly determined global cognition score in the SDMT_2 test at the end of study were PhAcase (β= –0.16, p = 0.011), tHcy (β=–0.19, p = 0.013), anti-N-Hcy autoantibodies (β=–0.15, p = 0.027), fatty acids (FA: β=–0.20, p = 0.017), brain atrophy (β= –0.24, p = 0.001), and SDMT_1 score (β=0.67, p = 0.000); adjusted R2 was 0.79 (Table 8, Model 2). SDMT_2 was associated with POase only in a model with PON1 Q192R genotype (Model 4: β=–0.33, p = 0.028) but not without (Model 5: β=–0.06, p = 0.336). Similarly, SDMT_2 was associated with PON1 Q192R genotype in a model with POase (Model 4: β= 0.29, p = 0.047) but not without (Model 3: β = 0.00, p = 0.963). In contrast, SDMT_2 was not associated with PON1 Q192R genotype in models with (Model 1: β=–0.18, p = 0.008) or without PhAcase (Model 3: β=0.00, p = 0.963). Because a higher score in SDMT test indicates better cognition, these findings suggest that higher PhAcase activity has a detrimental effect on attention/processing speed.
Associations of the SDMT_2 score with anti-N-Hcy autoantibodies and fatty acids (FA_1) were independent of the PON1 status in models with or without PhAcase, POase, and/or PON1 Q192R genotype (Models 1–6). Carriers of high levels of anti-N-Hcy autoantibodies or fatty acids had a lower SDMT_2 score indicating worse cognition.
B vitamin treatment abrogates effects of PON1 measures on cognition
Effects of B vitamin treatment on PhAcase, POase, and neuropsychological measures of cognition at the end of study are shown in Table 9. In the B vitamin group, there was a small but significant decrease in PhAcase activity at the end-of-study in the B vitamin group from 0.497±0.143 units at baseline to 0.468±0.117 units at the end-of-study after a 2-year-long treatment (p = 0.003). A similar decrease in PhAcase activity was also observed in the placebo group, from 0.481±0.132 units at baseline to 0.448±0.121 units at the end of study (p = 2.E-5). In contrast, there was no change in POase activity both in the B vitamin and placebo groups at the end of study. These findings indicate that PhAcase and POase activities were not affected by the B vitamin treatment.
Table 9
PhAcase, POase, and neuropsychological measures of cognition at baseline and the end of study
| Variable | Mean±SD at baseline | Mean±SD at the end-of-study (EOS) | p B-vit. versus placebo group# | p EOS versus baseline# | ||||
| (n = 97–133) | ||||||||
| Placebo group | B-vitamin group | Placebo group | B-vitamin group | Baseline | EOS | Placebo group | B-vit. group | |
| PhAcase$, units | 0.481±0.132 | 0.497±0.143 | 0.448±0.121 | 0.468±0.117 | 0.400 | 0.246 | 2.E–5* | 0.003* |
| POase, unitsX100 | 10.4±6.3 | 9.3±7.0 | 10.2±5.8 | 9.5±6.6 | 0.256 | 0.425 | 0.235* | 0.327* |
| tHcy, μM | 12.1±4.1 | 11.8±3.4 | 13.1±4.7 | 8.9±2.2 | 0.503 | 1.E–14 | 0.112 | 7.E–13 |
| MMSE | 28.2±1.5 | 28.1±1.8 | 27.7±2.3 | 27.8±2.2 | 0.750 | 0.626 | 0.029 | 0.224 |
| 0.007* | 0.056* | |||||||
| TICS-m$ | 25.0±2.7 | 24.8±2.9 | 26.5±4.4 | 26.9±5.0 | 0.540 | 0.722 | 0.009 | 0.004 |
| 0.002* | 0.003* | |||||||
| HVLT-TR$ | 23.0±5.1 | 23.5±5.4 | 22.9±5.8 | 23.3±6.7 | 0.592 | 0.918 | 0.586* | 0.052* |
| HVLT-DR | 7.4±3.2 | 7.7±2.9 | 6.9±3.6 | 7.4±3.5 | 0.241 | 0.303 | 0.046* | 0.199* |
| Trail Making A | 53.1±24.5 | 51.0±19.0 | 56.7±41.6 | 52.4±39.8 | 0.603 | 0.255 | 0.697* | 0.694* |
| SDMT$ | 37.1±9.9 | 37.9±10.0 | 35.4±11.0 | 37.4±11.0 | 0.312 | 0.064 | 0.002* | 0.214* |
| Category Fluency | 19.8±5.1 | 20.3±4.9 | 19.3±5.8 | 20.1±4.8 | 0.451 | 0.161 | 0.252* | 0.233* |
| Map Search | 53.4±14.9 | 53.0±13.6 | 53.4±17.7 | 54.6±16.5 | 0.799 | 0.506 | 0.909* | 0.577* |
$Normally distributed data. #p-values were derived from Log-transformed values: two-sided T-test except where noted; *paired T-test.
The efficacy of the B vitamin treatment was confirmed by tHcy measurements, which showed a significant reduction in tHcy from 11.8±3.4μM at baseline to 8.9±2.2μM at the end-of-study in the B vitamin group (p = 7.E-13), as previously described [5]. In contrast, in the placebo group, tHcy tended to increase from 12.1±4.1μM at baseline to 13.1±4.7μM (p = 0.112).
The B vitamin treatment improved neuropsychological test scores in several domains of cognition. For example, a significant decrease in global cognition observed in the placebo group (MMSE score: 27.7±2.3 at the-end-of-study versus 28.2±1.5 at baseline, p = 0.029) was abrogated by the B vitamin treatment (27.8±2.2 versus 28.1±1.8, p = 0.224). Similarly, there was a significant decrease in verbal episodic memory (HVLT-DR score) in the placebo group from 7.4±3.2 at baseline to 6.9±3.6 at the end of study (p = 0.046) that was prevented by the B vitamin treatment (7.7±2.9 versus 7.4±3.5, p = 0.199). A significant decrease in attention/processing speed observed in the placebo group (SDMT score: 35.4±11.0 at the-end-of-study versus 37.1±9.9 at baseline, p = 0.002) was abrogated by the B vitamin treatment (37.4±11.0 versus 37.9±10.0, p = 0.214) and the SDMT score tended to be improved in the B-vitamin group at the end of study (37.4±11.0 versus 35.4±11.0, p = 0.064) (Table 9).
TICS-m score, a measure of global cognition/memory, was significantly increased both in the B vitamin (26.9±5.0 versus 24.8±2.9, p = 0.003) and placebo groups (26.5±4.4 versus 25.0±2.7, p = 0.002) at the end of study (Table 9). However, analysis of male and female subgroups showed that the effect of B vitamin treatment on cognition (TICS-m score) was sex-dependent. Specifically, in the male subgroup at the end-of-study, the TICS-m score was increased in the B vitamin-treated (26.4±3.9 versus 24.5±2.8, p = 0.013) but not in the placebo-treated (25.9±5.3 versus 25.2±2.9, p = 0.445) group. In contrast, in the female subgroup, the TICS-m score was increased both in the B vitamin group (26.6±4.6 versus 24.8±2.9, p = 0.005) and in the placebo group (26.7±3.5 versus 24.8±2.6, p = 0.0002).
Other neuropsychological test scores such as HVLT-TR (verbal episodic memory), Trail Making A and Map Search (attention/processing speed), and Category Fluency (semantic memory), did not differ between the end-of-study and baseline both in the B vitamin and placebo groups.
Multiple regression analysis for the B vitamin treatment group revealed that the treatment abrogated associations between baseline PhAcase and neuropsychological measures in several domains of cognition: global cognition (MMSE, TICS-m), verbal episodic memory (HVLT-TR, HVLT-DR), and attention/processing speed (Trail Making A, SDMT) at the end of study (Table 10). Associations between baseline POase, PON1 Q192R genotype, and SDMT_2 score observed in the placebo group (Table 8) were abrogated in the B vitamin treatment group (Table 10). Similarly, the association between PON1 Q192R genotype and Trail Making A_2 score observed in the placebo group (Table 7) was abrogated in the B vitamin treatment group (Table 10).
Table 10
Determinants of cognition at the end of study –B vitamin group*
| Variable | Global cognition | Episodic memory | Attention/processing speed | |||||||||||
| (n = 82–112) | ||||||||||||||
| LnMMSE_21 | LnTICSm_22 | LnHVLT-TR_23 | LnHVLT-DR_24 | LnTrail_Making_A _25 | LnSDMT_26 | LnSDMT_27 | ||||||||
| β | p | β | p | β | p | β | p | β | p | β | p | β | p | |
| LntHcy-_1 | –0.03 | 0.798 | –0.02 | 0.859 | –0.02 | 0.873 | –0.21 | 0.024 | –0.18 | 0.062 | ||||
| LnPOase_1 | 0.38 | 0.094 | ||||||||||||
| LnPhAcase_1 | 0.09 | 0.569 | 0.24 | 0.056 | –0.02 | 0.843 | 0.14 | 0.306 | 0.16 | 0.288 | 0.13 | 0.184 | ||
| PON1-Q192R | 0.05 | 0.686 | –0.31 | 0.160 | ||||||||||
| LnTG_1 | 0.03 | 0.792 | 0.23 | 0.046 | 0.20 | 0.079 | ||||||||
| LnFA_1 | 0.06 | 0.632 | 0.01 | 0.952 | ||||||||||
| LnFe_1 | 0.17 | 0.201 | ||||||||||||
| LnAnti-N-Hcy_1 | 0.00 | 0.981 | 0.06 | 0.632 | –0.18 | 0.051 | –0.14 | 0.143 | ||||||
| BDNF V66M | –0.01 | 0.916 | –0.03 | 0.826 | ||||||||||
| LnAtrophy_rate | –0.16 | 0.182 | –0.13 | 0.259 | –0.08 | 0.479 | 0.03 | 0.826 | 0.12 | 0.318 | –0.09 | 0.308 | –0.07 | 0.442 |
| LnMMSE_1 | 0.52 | 0.000 | ||||||||||||
| LnTICS-m_1 | 0.38 | 0.002 | ||||||||||||
| LnHVLT-TR_1 | 0.63 | 0.000 | ||||||||||||
| LnHVLT-DR_1 | 0.47 | 0.001 | ||||||||||||
| LnTrail Making_1 | 0.62 | 0.000 | ||||||||||||
| LnSDMT_1 | 0.65 | 0.000 | 0.66 | 0.000 | ||||||||||
| F = 2.44, | F = 4.44, | F = 6.37, | F = 2.64, | F = 2.81, | F = 11.03, | F = 9.26, | ||||||||
| p = 0.000, | p = 0.000, | p = 0.000, | p = 0.000, | p = 0.000, | p = 0.000, | |||||||||
| Adjusted | Adjusted | Adjusted | Adjusted | Adjusted | Adjusted | |||||||||
| R2 = 0.20 | R2 = 0.28 | R2 = 0.38 | R2 = 0.20 | R2 = 0.30; | R2 = 0.61 | R2 = 0.60 | ||||||||
*Ln, natural logarithm; PhAcase, phenylacetate hydrolase; POase, paraoxonase; TG, triglycerides; FA, fatty acids; _1, baseline; _2, end of study. 1-7Adjusted for sex, age. Additional adjustment for: 1,4 Anti-N-Hcy, tHcy_1; 1BDNF V66M genotype; 3 Creatinine, TCN 776CG genotype; 4 APOE genotype; 5 Fe_1, FA_1, TG_1, COMT V158M and DHFR 19bpins genotypes.
Associations between tHcy and cognition (MMSE, TICS-m, and Trail Making A test scores) as well as associations between anti-N-Hcy autoantibodies and cognition (TICS-m and SDMT test scores), observed in the placebo group (Tables 4 and 8), were absent in the B vitamin treatment group (Table 10). Similarly, an association between iron and global cognition (MMSE score), observed in the placebo group (Table 3, was abrogated by the B vitamin treatment; Table 10). The associations of brain atrophy rate with these cognitive measures, observed in the placebo group, were also abrogated by the B vitamin treatment. For each neuropsychological test at the end of study, adjusted R2 values were reduced by 23 to 55% in the B vitamin group compared to the placebo group. The only variable that remained significantly associated with a neuropsychological test score in the B vitamin group at the end of study was a corresponding neuropsychological test score at baseline (Table 10).
Baseline PON1 measures not associated with brain atrophy rate at the end of study
To determine whether PON1 measures could affect brain atrophy, we carried out multiple regression analysis in models including brain atrophy rate as a dependent variable and baseline PhAcase, POase, or PON1 Q192R genotype, iron, tHcy, age, sex, and/or brain volume as independent variables.
In the placebo group at the end of study, we found that PhAcase (β=–0.13, p = 0. 263; R2 = 0.21), POase (β=–0.04, p = 0.712; R2 = 0.24), and PON1 Q192R genotype (β= 0.01, p = 0.961; R2 = 0.19) were not associated with the brain atrophy rate, regardless of absence or presence of iron in the examined models. These models became non-significant in the absence of tHcy. As previously reported [5], tHcy was associated with the brain atrophy rate (β= 0.45, p = 0. 000); overall p values were < 0.005.
In the B vitamin group at the end of study, baseline PhAcase, POase, or PON1 Q192R genotype were also not associated with the brain atrophy rate, while the dependence of the brain atrophy rate on baseline tHcy was abrogated by the B vitamin treatment, as previously reported [5].
DISCUSSION
The present prospective study shows that PON1 is an important predictor of cognition in MCI patients and that B vitamins ameliorate detrimental effects of PON1 on cognition. Specifically, we found that baseline PhAcase activity was a stronger predictor of cognition than POase activity or PON1 Q192R genotype and that baseline PhAcase activity affected cognition in domains that were not affected by POase activity or PON1 Q192R genotype at the end of study two years later. For example, PhAcase activity predicted global cognition (MMSE and TICS-m scores), verbal episodic memory (HVLT-TR and HVLT-DR scores), and attention/processing speed (SDMT and Trail Making A scores) at the end of study.
In contrast, baseline POase activity predicted cognition only in the attention/processing speed domain (SDMT score) as did PON1 Q192R genotype (SDMT score, Trail Making A score).
These findings suggest that some aspects of PON1 status, such as PhAcase activity, can affect several domains of cognition while other aspects, such as POase activity or PON1 Q192R genotype, can affect cognition only in domains that were affected by PhAcase activity. Because PhAcase activity reflects PON1 protein levels [22] and PON1 Q192R genotype has no effect on the PON1 protein concentration [21, 46], the predominant associations of cognition with PhAcase identified in the present study suggest that the level of PON1 protein expression is the relevant predictor of cognition (or determines these effects on cognition).
Although baseline PON1 variables predicted global cognition (MMSE, TICS-m scores), verbal episodic memory (HVLT-TR and HVLT-DR scores), attention/processing speed (Trail Making A score), and attention/processing speed (SDMT score) at the end of study, the PON1 variables did not predict the rate of brain atrophy. The lack of PON1 effect on brain atrophy suggests that PON1 affects functional (cognitive performance), but not structural aspects of cognition (brain atrophy). The mechanism by which PON1 affects cognition remains to be examined in future studies.
Previous findings showed that B vitamin treatment was beneficial by reducing the rate of brain atrophy [5]. In the present study we found that B vitamin treatment can also be beneficial by abrogating the detrimental effects of PON1 on cognition. At the same time, B vitamin treatment eliminated (or reduced) the detrimental effect of brain atrophy on cognition observed in the placebo group at the end of study.
In many cases genes have multiple functions that differ depending on a tissue. PON1 possesses several enzymatic activities and has been implicated in cardiovascular and neurodegenerative diseases, suggesting that its function is tissue-dependent. Our present study provides support for this notion. Specifically, we found that serum PON1 PhAcase activity was a negative predictor of cognition (i.e., high PON1 activity was associated with worse cognition) while PON1 Q192R genotype and POase activity had a marginal, if any, effect on cognition. Further, we found that the status of PON1 was not associated with brain atrophy. In contrast, previous prospective study found that the cardiovascular risk was significantly reduced in individuals with the highest PON1 activity (PhAcase and POase) and PON1 192RR genotype versus those with the lowest PON1 activity and PON1 192QQ genotype (i.e., high PON1 activity was associated with better outcome) [47]. Taken together, these findings suggest that PON1 has different functions in the central nervous system (CNS) and in the cardiovascular system.
How higher PON1 PhAcase activity could lead to impairments in cognition is not clear. In the cardiovascular system PON1 activity was negatively associated with indices of systemic oxidative stress such as multiple oxidized fatty acids [47]. Because PON1 does not possess any intrinsic redox activity (PhAcase and POase are hydrolytic, not redox, activities) and indeed does not protect low-density lipoprotein from oxidation [48–50], such associations could be due to the interaction between PON1 genotype/activity and the expression of redox-related proteins [51]. Thus, detrimental effects of PON1 on cognition observed in the present study could be mediated by effects of PON1 on the expression of proteins maintaining brain homeostasis, which remains to be examined in future studies, for example in a Pon1-KO mouse model.
In addition to PON1, we identified iron, triglycerides, and fatty acids, and confirmed anti-N-Hcy autoantibodies as predictors of cognition in MCI. Specifically, iron and triglycerides predicted global cognition (MMSE score); anti-N-Hcy autoantibodies and fatty acids predicted attention/processing speed (SDMT score); and anti-N-Hcy autoantibodies predicted global cognition (TICS-m score) and attention/processing speed (SDMT and Trail Making A scores). Iron and other metals [52], triglycerides and fatty acids [53] have been postulated to affect cognition in AD. The association of anti-N-Hcy autoantibodies with cognition in MCI has been previously reported [42]. Value of these variables as predictors of cognitive decline in MCI patients need to be confirmed in larger studies. Mechanisms underlying these associations remain to be investigated in future studies.
We also identified BDNF V66M genotype as a predictor of cognition in MCI. Specifically, BDNF V66M genotype predicted verbal episodic memory (HVLT-TR and HVLT-DR scores) with carriers of BDNF 66V allele showing a better cognition than carriers of BDNF 66M allele. This finding is consistent with findings in patients with schizophrenia as well as in a control population showing impaired episodic memory in Wechsler Memory Scale test (lower score) in individuals with BDNF 66M allele [54].
In conclusion, our findings in participants with MCI provide the first experimental evidence suggesting that PON1 could play a role in the CNS by affecting cognition in the general domain (global cognition) as well as in more specific domains such as verbal episodic memory and attention/processing speed. These findings also support a concept that PON1 is a risk factor for cognitive decline in MCI that can be abrogated by B vitamins, thereby highlighting a novel positive aspect of B vitamin treatment on the CNS.
ACKNOWLEDGMENTS
This work was supported in part by grants from the National Science Center, Poland (2016/23/B/NZ5/00573, 2018/29/B/NZ4/00771, 2019/33/B/NZ4/01760), and the American Heart Association (17GRNT32910002). The original VITACOG trial was supported by grants from the Medical Research Council and several charities (see [29]).
Authors’ disclosures available online (https://www.j-alz.com/manuscript-disclosures/21-0137r1).
REFERENCES
[1] | Livingston G , Sommerlad A , Orgeta V , Costafreda SG , Huntley J , Ames D , Ballard C , Banerjee S , Burns A , Cohen-Mansfield J , Cooper C , Fox N , Gitlin LN , Howard R , Kales HC , Larson EB , Ritchie K , Rockwood K , Sampson EL , Samus Q , Schneider LS , Selbaek G , Teri L , Mukadam N ((2017) ) Dementia prevention, intervention, and care. Lancet 390: , 2673–2734. |
[2] | Smith AD , Refsum H ((2017) ) Dementia prevention by disease-modification through nutrition. J Prev Alzheimers Dis 4: , 138–139. |
[3] | Kivipelto M , Mangialasche F , Ngandu T ((2018) ) Lifestyle interventions to prevent cognitive impairment, dementia and Alzheimer disease. Nat Rev Neurol 14: , 653–666. |
[4] | Lehtisalo J , Levalahti E , Lindstrom J , Hanninen T , Paajanen T , Peltonen M , Antikainen R , Laatikainen T , Strandberg T , Soininen H , Tuomilehto J , Kivipelto M , Ngandu T ((2019) ) Dietary changes and cognition over 2 years within a multidomain intervention trial-The Finnish Geriatric Intervention Study to Prevent Cognitive Impairment and Disability (FINGER). Alzheimers Dement 15: , 410–417. |
[5] | Smith AD , Smith SM , de Jager CA , Whitbread P , Johnston C , Agacinski G , Oulhaj A , Bradley KM , Jacoby R , Refsum H ((2010) ) Homocysteine-lowering by B vitamins slows the rate of accelerated brain atrophy in mild cognitive impairment: A randomized controlled trial. PLoS One 5: , e12244. |
[6] | Douaud G , Refsum H , de Jager CA , Jacoby R , Nichols TE , Smith SM , Smith AD ((2013) ) Preventing Alzheimer’s disease-related gray matter atrophy by B-vitamin treatment. Proc Natl Acad Sci U S A 110: , 9523–9528. |
[7] | Gauthier S , Reisberg B , Zaudig M , Petersen RC , Ritchie K , Broich K , Belleville S , Brodaty H , Bennett D , Chertkow H , Cummings JL , de Leon M , Feldman H , Ganguli M , Hampel H , Scheltens P , Tierney MC , Whitehouse P , Winblad B , International Psychogeriatric Association Expert Conference on mild cognitive impairment ((2006) ) Mild cognitive impairment. Lancet 367: , 1262–1270. |
[8] | Graham JE , Rockwood K , Beattie BL , Eastwood R , Gauthier S , Tuokko H , McDowell I ((1997) ) Prevalence and severity of cognitive impairment with and without dementia in an elderly population. Lancet 349: , 1793–1796. |
[9] | Petersen RC , Roberts RO , Knopman DS , Boeve BF , Geda YE , Ivnik RJ , Smith GE , Jack CR Jr. ((2009) ) Mild cognitive impairment: Ten years later. Arch Neurol 66: , 1447–1455. |
[10] | Mackness M , Mackness B ((2004) ) Paraoxonase 1 and atherosclerosis: Is the gene or the protein more important? Free Radic Biol Med 37: , 1317–1323. |
[11] | Durrington PN , Mackness B , Mackness MI ((2001) ) Paraoxonase and atherosclerosis. Arterioscler Thromb Vasc Biol 21: , 473–480. |
[12] | Jakubowski H , Ambrosius WT , Pratt JH ((2001) ) Genetic determinants of homocysteine thiolactonase activity in humans: Implications for atherosclerosis. FEBS Lett 491: , 35–39. |
[13] | Humbert R , Adler DA , Disteche CM , Hassett C , Omiecinski CJ , Furlong CE ((1993) ) The molecular basis of the human serum paraoxonase activity polymorphism. Nat Genet 3: , 73–76. |
[14] | Loscalzo J ((2008) ) Paraoxonase and coronary heart disease risk: Language misleads, linkage misinforms, function clarifies. Circ Cardiovasc Genet 1: , 79–80. |
[15] | Jakubowski H ((2000) ) Calcium-dependent human serum homocysteine thiolactone hydrolase. A protective mechanism against protein N-homocysteinylation. J Biol Chem 275: , 3957–3962. |
[16] | Jakubowski H ((2019) ) Homocysteine modification in protein structure/function and human disease. Physiol Rev 99: , 555–604. |
[17] | Borowczyk K , Piechocka J , Glowacki R , Dhar I , Midtun O , Tell GS , Ueland PM , Nygard O , Jakubowski H ((2019) ) Urinary excretion of homocysteine thiolactone and the risk of acute myocardial infarction in coronary artery disease patients: The WENBIT trial. J Intern Med 285: , 232–244. |
[18] | Lacinski M , Skorupski W , Cieslinski A , Sokolowska J , Trzeciak WH , Jakubowski H ((2004) ) Determinants of homocysteine-thiolactonase activity of the paraoxonase-1 (PON1) protein in humans. Cell Mol Biol (Noisy-le-grand) 50: , 885–893. |
[19] | Domagala TB , Lacinski M , Trzeciak WH , Mackness B , Mackness MI , Jakubowski H ((2006) ) The correlation of homocysteine-thiolactonase activity of the paraoxonase (PON1) protein with coronary heart disease status. Cell Mol Biol (Noisy-le-grand) 52: , 4–10. |
[20] | Perla-Kajan J , Jakubowski H ((2010) ) Paraoxonase 1 protects against protein N-homocysteinylation in humans. FASEB J 24: , 931–936. |
[21] | Perla-Kajan J , Borowczyk K , Glowacki R , Nygard O , Jakubowski H ((2018) ) Paraoxonase 1 Q192R genotype and activity affect homocysteine thiolactone levels in humans. FASEB J 32: , 6019–6024. |
[22] | Costa LG , Cole TB , Jarvik GP , Furlong CE ((2003) ) Functional genomic of the paraoxonase (PON1) polymorphisms: Effects on pesticide sensitivity, cardiovascular disease, and drug metabolism. Annu Rev Med 54: , 371–392. |
[23] | Menini T , Gugliucci A ((2014) ) Paraoxonase 1 in neurological disorders. Redox Rep 19: , 49–58. |
[24] | Li H , Wetten S , Li L , St Jean PL , Upmanyu R , Surh L , Hosford D , Barnes MR , Briley JD , Borrie M , Coletta N , Delisle R , Dhalla D , Ehm MG , Feldman HH , Fornazzari L , Gauthier S , Goodgame N , Guzman D , Hammond S , Hollingworth P , Hsiung GY , Johnson J , Kelly DD , Keren R , Kertesz A , King KS , Lovestone S , Loy-English I , Matthews PM , Owen MJ , Plumpton M , Pryse-Phillips W , Prinjha RK , Richardson JC , Saunders A , Slater AJ , St George-Hyslop PH , Stinnett SW , Swartz JE , Taylor RL , Wherrett J , Williams J , Yarnall DP , Gibson RA , Irizarry MC , Middleton LT , Roses AD ((2008) ) Candidate single-nucleotide polymorphisms from a genomewide association study of Alzheimer disease. Arch Neurol 65: , 45–53. |
[25] | Erlich PM , Lunetta KL , Cupples LA , Abraham CR , Green RC , Baldwin CT , Farrer LA ((2012) ) Serum paraoxonase activity is associated with variants in the PON gene cluster and risk of Alzheimer disease. Neurobiol Aging 33: , 1015 e1017–1023. |
[26] | Bednarska-Makaruk ME , Krzywkowski T , Graban A , Lipczynska-Lojkowska W , Bochynska A , Rodo M , Wehr H , Ryglewicz DK ((2013) ) Paraoxonase 1 (PON1) gene-108C>T and p.Q192R polymorphisms and arylesterase activity of the enzyme in patients with dementia. Folia Neuropathol 51: , 111–119. |
[27] | Wehr H , Bednarska-Makaruk M , Graban A , Lipczynska-Lojkowska W , Rodo M , Bochynska A , Ryglewicz D ((2009) ) Paraoxonase activity and dementia. J Neurol Sci 283: , 107–108. |
[28] | Bednarz-Misa I , Berdowska I , Zboch M , Misiak B , Zielinski B , Placzkowska S , Fleszar M , Wisniewski J , Gamian A , Krzystek-Korpacka M ((2020) ) Paraoxonase 1 decline and lipid peroxidation rise reflect a degree of brain atrophy and vascular impairment in dementia. Adv Clin Exp Med 29: , 71–78. |
[29] | Cervellati C , Trentini A , Romani A , Bellini T , Bosi C , Ortolani B , Zurlo A , Passaro A , Seripa D , Zuliani G ((2015) ) Serum paraoxonase and arylesterase activities of paraoxonase-1 (PON-1), mild cognitive impairment, and 2-year conversion to dementia: A pilot study. J Neurochem 135: , 395–401. |
[30] | Petersen RC ((2004) ) Mild cognitive impairment as a diagnostic entity. J Intern Med 256: , 183–194. |
[31] | Folstein MF , Folstein SE , McHugh PR ((1975) ) “Mini-mental state”. A practical method for grading the cognitive state of patients for the clinician. J Psychiatr Res 12: , 189–198. |
[32] | Brandt J , Welsh KA , Breitner JC , Folstein MF , Helms M , Christian JC ((1993) ) Hereditary influences on cognitive functioning in older men. A study of 4000 twin pairs. Arch Neurol 50: , 599–603. |
[33] | Brandt J ((1991) ) The hopkins verbal learning test: Development of a new memory test with six equivalent forms. Clin Neuropsychol 5: , 125–142. |
[34] | Robertson I , Ward T , Ridgeway V , Nimmo-Smith I ((1994) ) The Test of Everyday Attention, Thames Valley Test Company, Bury St Edmunds. |
[35] | Lezak MD , Howieson DB , Loring DW ((1994) ) Neurolopsychological Assessment, Oxford University Press, NewYork. |
[36] | Sheridan LK , Fitzgerald HE , Adams KM , Nigg JT , Martel MM , Puttler LI , Wong MM , Zucker RA ((2006) ) Normative Symbol Digit Modalities Test performance in a community-based sample. Arch Clin Neuropsychol 21: , 23–28. |
[37] | de Jager CA , Oulhaj A , Jacoby R , Refsum H , Smith AD ((2012) ) Cognitive and clinical outcomes of homocysteine-lowering B-vitamin treatment in mild cognitive impairment: A randomized controlled trial. Int J Geriatr Psychiatry 27: , 592–600. |
[38] | de Jager CA ((2004) ) Changes over time in memory, processing speed and clock drawing tests help to discriminate between vascular cognitive impairment, mild cognitive impairment and Alzheimer’s disease. Neurol Res 26: , 481–487. |
[39] | Eckerson HW , Wyte CM , La Du BN ((1983) ) The human serum paraoxonase/arylesterase polymorphism. Am J Hum Genet 35: , 1126–1138. |
[40] | Davies HG , Richter RJ , Keifer M , Broomfield CA , Sowalla J , Furlong CE ((1996) ) The effect of the human serum paraoxonase polymorphism is reversed with diazoxon, soman and sarin. Nat Genet 14: , 334–336. |
[41] | Cagni FC , Campelo C , Coimbra DG , Barbosa MR , Junior LGO , Neto ABS , Ribeiro AM , Junior COG , Gomes de Andrade T , Silva RH ((2017) ) Association of BDNF Val66MET polymorphism with Parkinson’s disease and depression and anxiety symptoms. J Neuropsychiatry Clin Neurosci 29: , 142–147. |
[42] | Włoczkowska O , Perła-Kaján J , Smith AD , de Jager C , Refsum H , Jakubowski H ((2021) ) Anti-N-homocysteine-protein autoantibodies are associated with impaired cognition. Alzheimers Dement (N Y) 7: , e12159. |
[43] | Mueller RF , Hornung S , Furlong CE , Anderson J , Giblett ER , Motulsky AG ((1983) ) Plasma paraoxonase polymorphism: A new enzyme assay, population, family, biochemical, and linkage studies. Am J Hum Genet 35: , 393–408. |
[44] | Tang WH , Hartiala J , Fan Y , Wu Y , Stewart AF , Erdmann J , Kathiresan S , Consortium CA , Roberts R , McPherson R , Allayee H , Hazen SL ((2012) ) Clinical and genetic association of serum paraoxonase and arylesterase activities with cardiovascular risk. Arterioscler Thromb Vasc Biol 32: , 2803–2812. |
[45] | Brophy VH , Jampsa RL , Clendenning JB , McKinstry LA , Jarvik GP , Furlong CE ((2001) ) Effects of 5’ regulatory-region polymorphisms on paraoxonase-gene (PON1) expression. Am J Hum Genet 68: , 1428–1436. |
[46] | Mackness B , Davies GK , Turkie W , Lee E , Roberts DH , Hill E , Roberts C , Durrington PN , Mackness MI ((2001) ) Paraoxonase status in coronary heart disease: Are activity and concentration more important than genotype? Arterioscler Thromb Vasc Biol 21: , 1451–1457. |
[47] | Bhattacharyya T , Nicholls SJ , Topol EJ , Zhang RL , Yang X , Schmitt D , Fu XM , Shao MY , Brennan DM , Ellis SG , Brennan ML , Allayee H , Lusis AJ , Hazen SL ((2008) ) Relationship of paraoxonase 1 (PON1) gene polymorphisms and functional activity with systemic oxidative stress and cardiovascular risk. JAMA 299: , 1265–1276. |
[48] | Marathe GK , Zimmerman GA , McIntyre TM ((2003) ) Platelet-activating factor acetylhydrolase, and not paraoxonase-1, is the oxidized phospholipid hydrolase of high density lipoprotein particles. J Biol Chem 278: , 3937–3947. |
[49] | Teiber JF , Draganov DI , La Du BN ((2004) ) Purified human serum PON1 does not protect LDL against oxidation in the in vitro assays initiated with copper or AAPH. J Lipid Res 45: , 2260–2268. |
[50] | Connelly PW , Draganov D , Maguire GF ((2005) ) Paraoxonase-1 does not reduce or modify oxidation of phospholipids by peroxynitrite. Free Radic Biol Med 38: , 164–174. |
[51] | Sikora M , Bretes E , Perla-Kajan J , Lewandowska I , Marczak L , Jakubowski H ((2020) ) Genetic attenuation of paraoxonase 1 activity induces proatherogenic changes in plasma proteomes of mice and humans. Antioxidants (Basel) 9: , 1198. |
[52] | Wang P , Wang ZY ((2017) ) Metal ions influx is a double edged sword for the pathogenesis of Alzheimer’s disease. Ageing Res Rev 35: , 265–290. |
[53] | Morley JE , Banks WA ((2010) ) Lipids and cognition. J Alzheimers Dis 20: , 737–747. |
[54] | Egan MF , Kojima M , Callicott JH , Goldberg TE , Kolachana BS , Bertolino A , Zaitsev E , Gold B , Goldman D , Dean M , Lu B , Weinberger DR ((2003) ) The BDNF val66met polymorphism affects activity-dependent secretion of BDNF and human memory and hippocampal function. Cell 112: , 257–269. |


