
Plasma Apolipoprotein E3 and Glucose Levels Are Associated in APOE ɛ3/ɛ4 Carriers
Abstract
Background:
Altered cerebral glucose metabolism, especially prominent in APOE ɛ4 carriers, occurs years prior to symptoms in Alzheimer’s disease (AD). We recently found an association between a higher ratio of plasma apolipoprotein E4 (apoE4) over apoE3, and cerebral glucose hypometabolism in cognitively healthy APOE ɛ3/ɛ4 subjects. Plasma apoE does not cross the blood-brain barrier, hence we speculate that apoE is linked to peripheral glucose metabolism which is known to affect glucose metabolism in the brain.
Objective:
Explore potential associations between levels of plasma insulin and glucose with previously acquired plasma apoE, cerebral metabolic rate of glucose (CMRgl), gray matter volume, and neuropsychological test scores.
Methods:
Plasma insulin and glucose levels were determined by ELISA and a glucose oxidase assay whereas apoE levels were earlier quantified by mass-spectrometry in 128 cognitively healthy APOE ɛ3/ɛ4 subjects. Twenty-five study subjects had previously undergone FDG-PET and structural MRI.
Results:
Lower plasma apoE3 associated with higher plasma glucose but not insulin in male subjects and subjects with a body mass index above 25. Negative correlations were found between plasma glucose and CMRgl in the left prefrontal and bilateral occipital regions. These associations may have functional implications since glucose levels in turn were negatively associated with neuropsychological test scores.
Conclusion:
Plasma apoE3 but not apoE4 may be involved in insulin-independent processes governing plasma glucose levels. Higher plasma glucose, which negatively affects brain glucose metabolism, was associated with lower plasma apoE levels in APOE ɛ3/ɛ4 subjects. High plasma glucose and low apoE levels may be a hazardous combination leading to an increased risk of AD.
INTRODUCTION
Apolipoprotein E (apoE) is a 299 amino acid long glycoprotein, existing in three common isoforms due to polymorphism in the human APOE gene located on chromosome19 [1]. Of the three common APOE alleles, ɛ2, ɛ3, and ɛ4, the latter has repeatedly been identified as the strongest genetic risk factor for developing sporadic Alzheimer’s disease (AD), the leading cause of neurodegenerative dementia [2]. The disease has a long asymptomatic phase, predating symptoms by several decades [3]. During the asymptomatic phase, development and accumulation of the two main neuropathological hallmarks, amyloid-β (Aβ) plaques and neurofibrillary tau tangles occur, processes that can be identified by brain imaging and the use of positron emission topography (PET) tracers [4], and by alterations in cerebrospinal fluid (CSF) levels of Aβ42 and tau [3]. Reductions in cerebral glucose utilization, indexed by the uptake of the PET tracer 18Fluoro-2-deoxy-D-glucose (FDG), is another early event in the AD pathogenesis, reflecting decreased neuronal activity, synaptic dysfunction, and/or degeneration [5]. Reduced cerebral glucose metabolism has been observed in APOE ɛ4 carriers already in young adulthood [6] as well as in cognitively normal older individuals [7] especially in areas vulnerable to AD pathology [8]. Evidence from recent studies indicates that brain glucose hypometabolism is linked to impaired glycemic control in the periphery in cognitively healthy subjects [9, 10]. Higher plasma glucose levels were previously linked to increased dementia risk [11]. In APOE ɛ4 carriers, increased midlife levels of glucose were linked to more severe AD pathology at autopsy, specifically neurofibrillary tangles within the medial temporal lobe [12]. Moreover, impaired peripheral glycemic control was suggested to be associated with a faster conversion from mild cognitive impairment (MCI) to AD [13]. Impaired glycemic control in the periphery is intimately correlated to insulin resistance, a hallmark of type 2 diabetes mellitus (T2DM) [14] which also increases the risk of AD [15]. Greater peripheral insulin resistance, indexed with the Homeostatic Model Assessment of Insulin Resistance (HOMA-IR), was reported to be negatively associated with FDG-uptake and AD-like reduction in cerebral metabolic rate of glucose (CMRgl) in frontal, parieto-temporal and cingulate regions in cognitively normal elderly with pre-diabetes and T2DM [16]. In addition, higher HOMA-IR in cognitively healthy late-middle aged individuals with a family history of AD exhibited lower glucose metabolism in frontal, lateral parietal, lateral temporal, and medial temporal lobes [17].
How the APOE gene variants, especially APOE ɛ4, may bridge both T2DM-related processes and neurodegenerative dementia [18] is not fully understood. Low plasma levels of apoE are known to be directly associated with the presence of the APOE ɛ4 allele [19, 20]. Results from our previous study showed that an increased relative ratio between plasma levels of the apoE4/apoE3 isoforms in cognitively healthy APOE ɛ3/ɛ4 subjects was significantly and specifically associated with reduced hippocampal glucose metabolism [21]. These results suggest that plasma apoE levels or the relative contribution of each apoE isoform to the total plasma apoE levels, may be of importance to processes relating to glucose metabolism in the brain. Importantly, previous studies have proposed a detrimental effect of low plasma apoE levels, regardless of APOE variant, on the overall risk of dementia [22] and a link between low plasma apoE levels, cognitive deficits, and pathological AD CSF biomarkers [23]. Interestingly, these observations may be closely related to the pathogenesis of the dementia component of neurodegeneration such as in AD and dementia with Lewy bodies [24]. In comparison, the APOE ɛ4 allele has not been implicated in the risk of developing the neurodegenerative disorder amyotrophic lateral sclerosis (ALS) in which higher plasma apoE levels in fact appear to be deleterious rather than beneficial [25].
The notion that plasma apoE levels could be related to pathological processes in the brain is controversial given that plasma apoE cannot cross the blood-brain barrier [26]. However, given our previous findings of an association between plasma apoE levels and glucose metabolism specifically in the hippocampus [21], we hypothesize that plasma apoE levels may be related to plasma glucose and/or insulin levels which in turn may affect glucose metabolism in specific areas of the brain. In the present study, we have therefore expanded our previous analyses of 128 cognitively healthy subjects with an APOE ɛ3/ɛ4 genotype, with an assessment of plasma insulin and glucose levels. With these expanded analyses, we aimed to investigate whether plasma apoE levels are directly associated with plasma glucose and/or insulin levels, which potentially could help explain our previous findings of an association between the plasma apoE4/E3 ratio and alterations in brain glucose metabolism and gray matter volume (GMV). Since a subset of the included study subjects had undergone FDG-PET and structural MRI, we also aimed to assess potential associations between plasma glucose and insulin levels, and cerebral glucose metabolism and GMV. Since previous studies proposed adverse associations between higher plasma glucose levels, including transient hyperglycemia, and cognition [27–29], we last aimed to investigate potential correlations bet-ween plasma glucose and insulin levels, and results from a large neuropsychological test battery. Identification of the latter would indicate a functional relationship between alterations in plasma glucose and insulin levels, potentially in conjunction with plasma apoE, and cognitive performance.
MATERIALS AND METHODS
Study cohort
The subjects included in this study are a subset of cognitively healthy individuals with an APOE ɛ3/ɛ4 genotype enrolled in the Arizona APOE cohort, as previously described [6,8, 21, 30]. Briefly, since 1994 recruitment of residents for inclusion in a study of cognitive aging was carried out in Maricopa County, AZ, USA, through local media advertisements. The subjects had to be 21 years or older at the time of inclusion. In the current study the subjects included were between 33 and 87 years of age. The subjects also had to be cognitively healthy at inclusion. To be considered cognitively healthy the subjects had to score at least 27 on the Mini-Mental State Examination (MMSE) and score 10 or less on the Hamil-ton Depression Rating Scale. Those fulfilling entry requirements returned every 1–2 years for participa-tion in an extensive and standardized neuropsycholo-gical test battery. APOE genotyping was performed using Taqman single nucleotide polymorphism assays and the participants agreed to have the result of the APOE genotyping withheld from them. For the current cross-sectional study, we only considered data acquired between 1994 and 2009 including 128 subjects. All included subjects had an APOE ɛ3/ɛ4 genotype as we aimed to assess the potentially differential influence of plasma apoE3 and plasma apoE4 isoform levels on the parameters of interest. Blood for plasma analysis was collected after at least 4 h of fasting in tubes containing EDTA from these 128 individuals with an APOE ɛ3/ɛ4 genotype in association with their neuropsychological evaluation or within a year from it. The collected blood was centrifuged at 2000×g at 4°C for 10 min and the plasma fraction aliquoted and immediately frozen at –80°C pending further biochemical analysis. Twenty-five of the individuals included in this study also underwent imaging (FDG-PET and volumetric T1-MRI) at the time of the plasma collection.
All the participants gave written informed consent to participate in the study. The study protocol was approved by the institutional review boards of Banner Good Samaritan Medical Center (now Ban-ner-University Medical Center, Phoenix, AZ, USA), the Mayo Clinic, and the regional ethical review agency in Stockholm, Sweden. The research was carried out according to the Helsinki Declaration.
Plasma apoE quantification using mass spectrometry
Total apoE levels and the individual apoE isoform (apoE3 and apoE4) levels were previously quantified by use of a mass-spectrometry based method [31], and the results were reported in a previous pub-lication [21]. In brief, plasma samples where diluted 1:100, trypsin-digested and analyzed using liquid chromatography-tandem mass spectrometry (LC-MS/MS) with a Waters NanoAcquity coupled to a Thermo Vantage mass spectrometer at the Mayo Cli-nic Proteomics Core, USA. For quantification of apoE3 and apoE4 isoforms two tryptic peptides, LGADMEDVCGR or LGADMEDVR, derived from the two single major APOE single nucleotide polymorphisms (SNP112 and SNP158) were used. Total apoE was quantified using a peptide present in both isoforms, LGPLVEQGR, which also served as a control to assess the accuracy of the total sum of the two isoforms within each sample.
Brain imaging and voxel-wise analysis
Imaging data from a total of 25 subjects were pre-viously acquired using T1-weighted, three-dimen-sional, pulse sequence MRI or FDG-PET as reported in [21]. Both the MRI and FDG-PET imaging took place during the same session. MRI scans were performed on a 1.5-T Signa system (General electric, Milwaukee, WI, USA) with the following settings: Radiofrequency-spoiled gradient recall acquisition in the steady state (SPGR), repetition time = 33 ms, echo time = 5 ms, α=30°, number of excitations = 1, field of view = 24 cm, imaging matrix = 256×192, slice thickness = 1.5 mm and in-plane voxel dimensions of 0.94×1.25 mm. 128 contiguous MRI slices with a slice thickness of 1.5 mm and in-plane voxel dimensions of 0.94×1.25 mm was used for reconstruction of images.
FDG-PET scans were acquired using an HR+ scanner (Siemens, Knoxville, TN, USA) in the three-dimensional mode in a darkened scanner room. Participants were instructed to lie quietly with their eyes closed. Prior to the emission scan, a transmis-sion scan was carried out. Thereafter, 5–8 mCi was in-jected intravenously followed by a 60-min dynamic sequence of emission scans. Images were recons-tructed with 63 horizontal slices, with a center-to-center slice separation of 2.46 mm, an axial field of view of 15.5 cm, an in-plane resolution of 4.2–5.1 mm full width at half maximum and an axial resolution of 4.6-6.0 mm full width at half-maximum.
For T1-MRI data, the automated brain mapping algorithmic program voxel-based morphometry, imp-lemented in Statistical Parametric Mapping (SPM8; Wellcome Trust Center for Neuroimaging, London, UK) was employed to iteratively and simultaneously segment and spatially normalize the acquired volumetric T1- MRI data in the template coordinate space, as defined by the Montreal Neurological Institute (MNI) brain template. The segmented individual gray matter maps were used in a voxel-wise correlation analysis with the plasma glucose or insulin concentration with the apoE4/E3 ratio as a covariate using the same general linear model (GLM). For the PET data, the voxel-wise analysis used images acquired during the last 30 minutes, with counts relative to whole brain uptake. Similar to the MRI analysis, SPM8 was used to deform the individual FDG-PET to the same MNI brain template. GLM-based, voxel-wise analysis was used to analyze associations between plasma glucose or insulin with FDG-PET-measured CMRgl. Both MRI and FDG analyses were corrected for the apoE4/apoE3 ratio of every individual. Voxel map cut-off was set at an uncorrected p = 0.005, which previously have been shown to provide the optimal balance between type-I and type-II errors [32]. To further control possible inflated type-I error by correcting for multiple comparisons, the small volume correction (SVC) procedure in SPM was utilized with a p = 0.05 threshold. The statistical maps were superimposed onto a cortical surface map.
Assessment of plasma glucose and insulin levels, and HOMA-IR
Plasma insulin and glucose levels were determined using commercially available assays; the Mercodia Ultrasensitive insulin ELISA (Mercodia, cat.# 10-1132-01) and the Glucose colorimetric detection kit (Invitrogen by Thermo Fisher Scientific, cat.# EIAGLUC), following the manufacturers’ instructions. For the insulin quantification, plasma samples where diluted 1:4 in calibrator 0 and 100μl/well was added to the pre-coated ELISA plate in duplicates together with standards (insulin concentration range: 0–20 mU/L) supplied in the kit. Thereafter, 100μL/well of the enzyme-conjugate (peroxidase-conjugated mouse monoclonal anti-insulin antibody) was added to all wells and the plate incubated at room temperature (RT) for 1 h. The plate was then decanted, washed 6 times using the supplied washing buffer whereafter 200μL/well tetramethylbenzidine was added to all wells and the plate incubated for 30 min, at RT in the dark. The reaction was stopped by adding 50μL 0.5 M H2SO4 to the wells. The plate was immediately read at 450 nm using a HiPO microplate photometer, MPP-96 (Biosan) and a 5-parametric logistics standard curve was constructed using the Quant assay software supplied with the photometer (Biosan). Plasma insulin concentrations were determined through interpolation from the standard curve and results from duplicate wells averaged. The inter-plate variation coefficient (CV%) was 4.9%, and the spike-recovery percentage ranged between 94–144%. The detection limit of the kit was 0.15 mU/L.
For the glucose quantification, plasma samples were diluted 1:32 in the kit-supplied assay buffer whereafter 20μL of standards (range: 0–32 mg/dL glucose) and samples were added in duplicates to a clear, 96-well half area plate (Costar, supplied with the kit). Twenty-five μL of horseradish peroxidase solution, substrate and glucose oxidase, respectively, was added to each well and the plate was incubated for 30 min at RT. Absorbance was read at 560 nm in a Multiskan GO microplate spectrophotometer (ThermoFisher Scientific), and the results were acquired by interpolation from a 4-parametric logistic curve generated by the Thermo Scientific SkanIT Software version 3.2. Results from standards and samples run in duplicates were averaged. The inter-plate variation coefficient (CV%) was 4.8%, and the spike-recovery percentage ranged between 109–126%. The analytical sensitivity of the assay reported in the manufacturer’s product sheet was 0.413 mg/dL glucose.
HOMA-IR was used as an index of peripheral insulin resistance and was calculated from plasma glucose and insulin levels using the formula: (glucose (mg/dL) x insulin (mU/L))/405 [33].
Neuropsychological testing
In addition to the assessment of global cognitive health using the MMSE, Dementia rating Scale, and instrumental activities of daily living, the neuropsychological tests administered to the subjects of the Arizona APOE cohort measured performance in four broadly defined cognitive domains, memory, executive functioning, language, and visuospatial, as previously described [30, 34]. Brain and cognitive testing were performed within an average of 0.6 years (0.2–1.1). A list of cognitive tests and outcomes were previously published [21]; a summary of the included tests is given in Supplementary Table 1.
Statistical analysis
Statistical analysis was performed using the JMP Pro Statistical software, version 14.0.0. Normal distribution of plasma insulin and glucose levels, and HOMA-IR was assessed by the Shapiro-Wilks W test which indicated that none of the plasma insulin, apoE, and glucose levels nor HOMA-IR followed the normal distribution. The Wilcoxon non-parametric test was therefore utilized for group comparisons. The non-parametric correlation analysis test Spearman’s Rho was used to examine associations between total plasma apoE, apoE3 and apoE4 levels, apoE4/apoE3 ratio, body mass index (BMI), insulin levels, glucose levels, and HOMA-IR both in the whole study population, and also separately in the imaged sub-cohort. Potential associations of the above parameters with age were also examined using the Spearman’s Rho test to address a potential influence of age on the outcome of the analyses. Results are presented as average±standard deviation (SD) for data with normal distribution and as medians and range (min-max) for non-normally distributed data. A p-value of≤0.05 was considered significant.
RESULTS
Characteristics of the study population
The characteristics of the study population were previously published in [21], parameters important to the current study are reiterated in Table 1 (age, BMI, and %of subjects with diabetes). A total of 3.1%of the study subjects were diabetic and the average BMI was 26.1±4.4 [21]. Seventy-five out of 127 (1 study participant missing BMI) of the study participants had a BMI above 25 (59%). Total plasma levels of apoE and the concentrations of the individual apoE3 and apoE4 isoforms in the included subjects were previously reported [21].
Table 1
Study population characteristics
| N | Age at investigation (y) | Body mass index | Diabetes (%yes) | |
| Total | 128 | 63.1±10.6 | 26.1±4.4 | 3.1 |
| Females | 91 | 61.8±10.4 | 25.8±4.8 | 2.2 |
| Males | 37 | 66.3±10.5 | 27.0±3.3 | 5.4 |
| Imaged subjects | 25 | 65.7±5.0 | 26.7±3.8 | 8 |
| Females | 17 | 65.2±5.3 | 25.7±4 | 0 |
| Males | 8 | 64.4±5.6 | 28.7±2.5 | 25 |
The data is presented as mean±standard deviation.
Plasma insulin and glucose levels, and HOMA-IR index
We employed clinically defined cut-off values for hyperinsulinemia, insulin >12.2 mU/L, and HOMA-IR >2.6, determined by McAuley et al. [35], pre-viously used in [36], to assess the percentage of individuals in the study population with ‘pathologically’ elevated insulin levels. Furthermore, we employed the American Diabetes Association (ADA) definition of fasting glucose levels indicative of pre-diabetes or impaired glucose tolerance at fasting plasma glucose between 100–125 mg/dL and used 100 mg/dL as a cut-off to explore the number of individuals with elevated plasma glucose. Nineteen out of 127 (15%) individuals had insulin levels above 12.2 mU/L and the HOMA-IR followed the same distribution (Table 2). Fourteen out of 128 individuals (10.9%) had a plasma glucose level above 100 mg/dL. In the imaged subjects (n = 25), the distribution was similar for glucose, with 19 subjects (88%) of the imaged subjects presenting glucose levels below 100 mg/dL and 3 (12%) above 100 mg/dL. The distribution of imaged subjects falling into the categories of higher/lower insulin and HOMA-IR, however, differed slightly from the whole study group as the percentage of subjects with pathologically elevated insulin /HOMA-IR were 6 subjects out of 25 (24%). A total of 21 out of 128 (16.4%) subjects had under subsequent follow-ups developed MCI assessed as reported previously [37]. We compared the glucose and insulin levels, and the HOMA-IR scores between subjects that had not developed MCI with those that had developed MCI and did not find any statistically significant differences between the groups (glucose; 83.36 (62.81–22.06) versus 83.87 (64.6–125.88) mg/dL, p = 0.5669, insulin; 4.95 (1.1–95) versus 4.6 (2.3–64) mU/L, p = 0.7578, HOMA-IR; 1.03 (0.18–31.43) versus 1.07 (0.39–15.1), p = 0.9508).
Table 2
Percentage of study subjects above/below pathological cut-offs
| Glucose (mg/dL) | Insulin (mU/L) | HOMA-IR | ||||
| Cut-off | >100 | <100 | >12.2 | <12.2 2 | >2.6 | <2.62 |
| N (%) | ||||||
| Total (n = 128) | 114 (89%) | 14 (11%) | 108 (85%) | 19 (15%) | 108 (85%) | 19 (15%) |
| Imaged subjects (n = 25) | 22 (88%) | 3 (12%) | 19 (76%) | 6 (24%) | 19 (76%) | 6 (24%) |
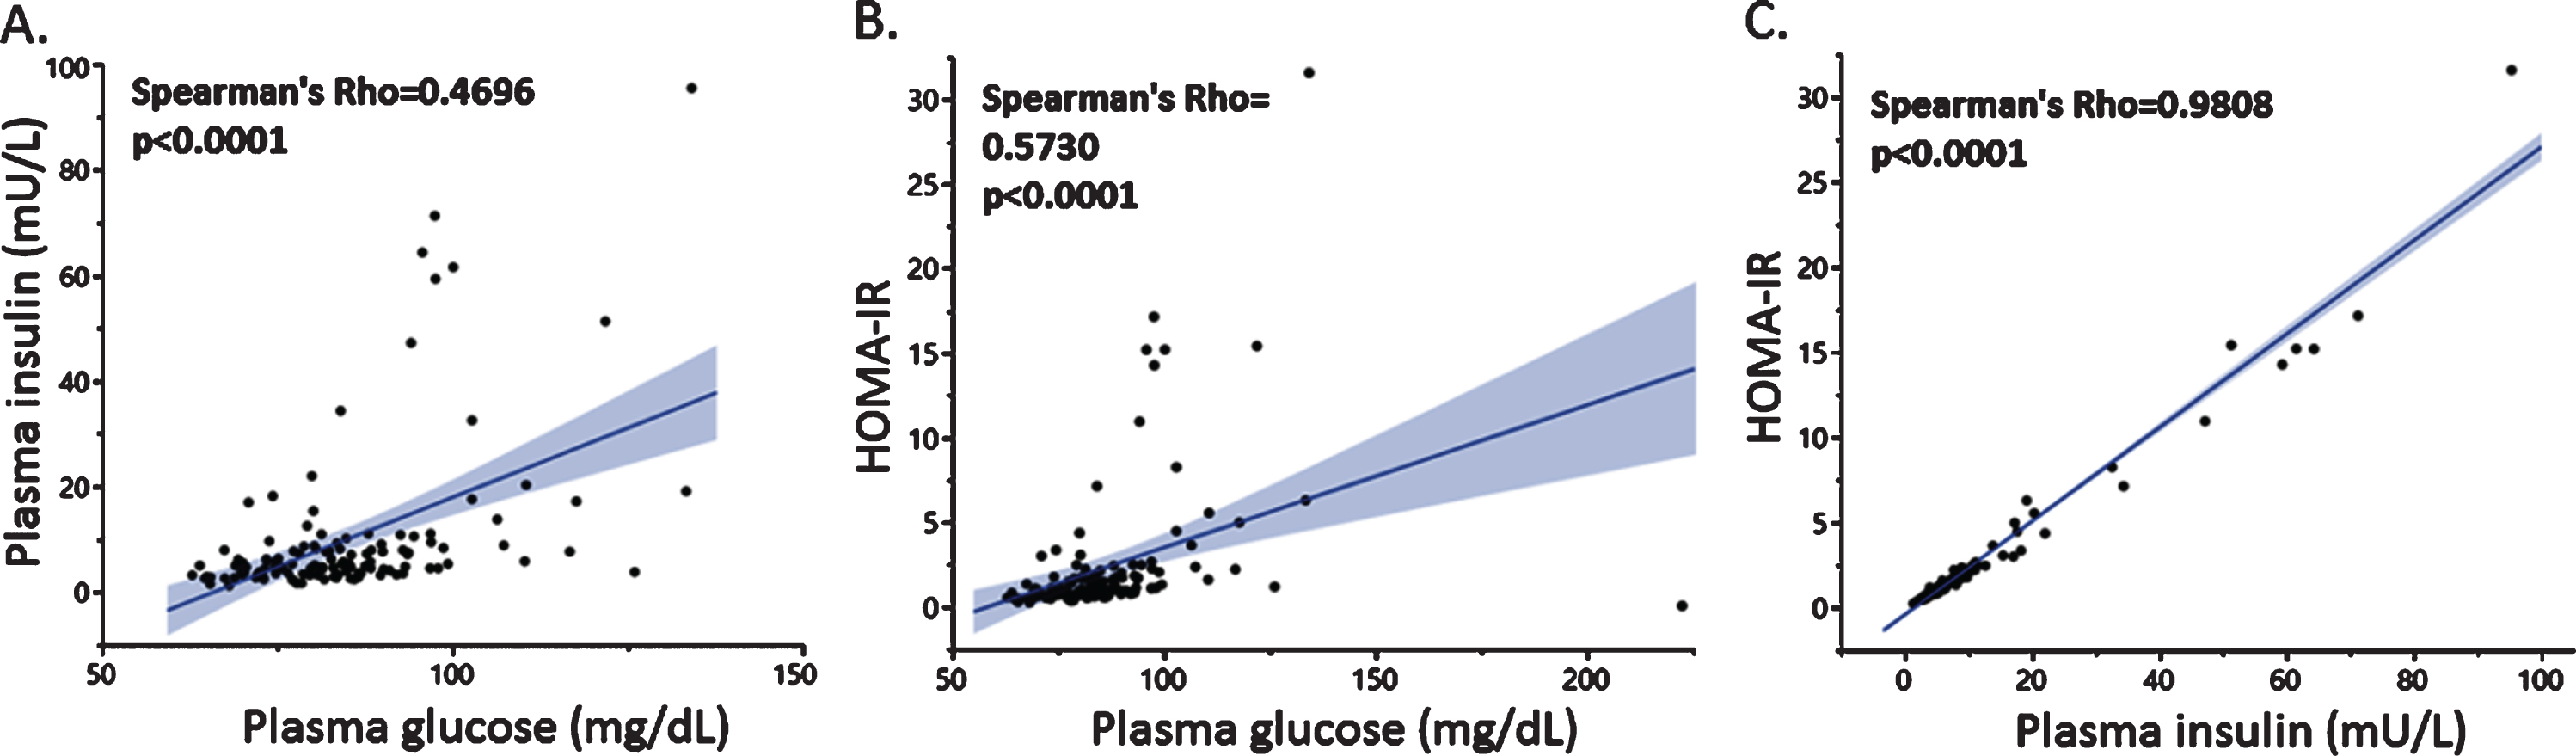
Plasma glucose, insulin, and HOMA-IR levels for the whole study group were 82.95 (62.81–222.06) mg/dL, 4.9 (1.1–95) mU/L, and 1.03 (0–31.43), res-pectively. The male subjects exhibited significantly higher glucose levels compared to the females, 86.5 (67.38–125.88) mg/dL versus 80.94 (62.81–222.06) mg/dL (p = 0.008), whereas insulin levels and resulting HOMA-IR did not differ significantly between sexes in the study population. We did not find any effect of age on glucose, HOMA-IR, or insulin levels in the whole cohort though in the subgroup comprised of the imaged subjects we found a weak, positive association between insulin and age (Spearman’s Rho = 0.3979, p = 0.0488).
As expected, plasma insulin and glucose levels were positively and significantly correlated (Fig. 1A), and glucose (Fig. 1B) and insulin levels (Fig. 1C) were each associated with HOMA-IR separately. The most potent driver of the HOMA-IR index, as indicated by the stronger association factor (Fig. 1C), was plasma insulin. Similar associations were found in the smaller group of subjects that had undergone brain imaging (data not shown).
Fig. 1
Associations between plasma insulin and glucose levels with HOMA-IR. Plasma glucose levels were positively associated with insulin (A) and HOMA-IR (B), the latter was strongly associated with plasma insulin (C).
A total of 59%of the study participants exhibited a BMI higher than 25. We stratified the study pop-ulation by employing a cut-off for overweight (pre-obese) set at a BMI >25, as defined by the World Health Organization [38], and compared glucose, insulin, and HOMA-IR values between the two groups. We found that insulin and HOMA-IR were significantly higher in the group with BMI above 25 (insulin: 4.05 (1.1–46.9) mU/L versus 6.95 (2.3–95) mU/L, p = 0.0001, HOMA-IR: 0.78 (0.18–10.87) versus 1.29 (0–31.43) p = 0.0001), whereas glucose was not significantly associated with BMI in our study population (81.10 (62.81–110.21) mg/dL versus 84.73 (65.42–222.06) mg/dl, p = 0.0875). Non-par-ametric multivariate correlation analysis confirmed a positive association between HOMA-IR and BMI (Spearman’s Rho = 0.4268 p < 0.0001) as well as pla-sma insulin levels with BMI (Spearman’s Rho = 0.4409, p < 0.0001) in the whole study population and in both males (HOMA-IR: Spearman’s Rho = 0.4301, p < 0.0088, insulin: Spearman’s Rho = 0.4434, p < 0.0068) and females (HOMA-IR: Spearman’s Rho = 0.4273, p < 0.0001, Insulin: Spearman’s Rho = 0.4516, p < 0.0001). The glucose levels were weakly associated with BMI in the whole cohort (Spearman’s Rho = 0.2089 p = 0.0185), but not when stratifying based on sex.
Plasma levels of apoE and apoE3 are associated with plasma glucose but not with insulin
Total plasma apoE, apoE3, and apoE4 levels for the investigated cohort were previously reported [21]. In brief, the total plasma apoE, apoE3, and apoE4 levels for the whole study group were 34.15 (15.49–137.52) μg/mL, 28.7 (10.41–124.06) μg/mL, and 4.53 (0.01–18.61) μg/mL, respectively. As previously reported, females exhibited slightly higher levels of apoE4 compared to males (p = 0.0267).
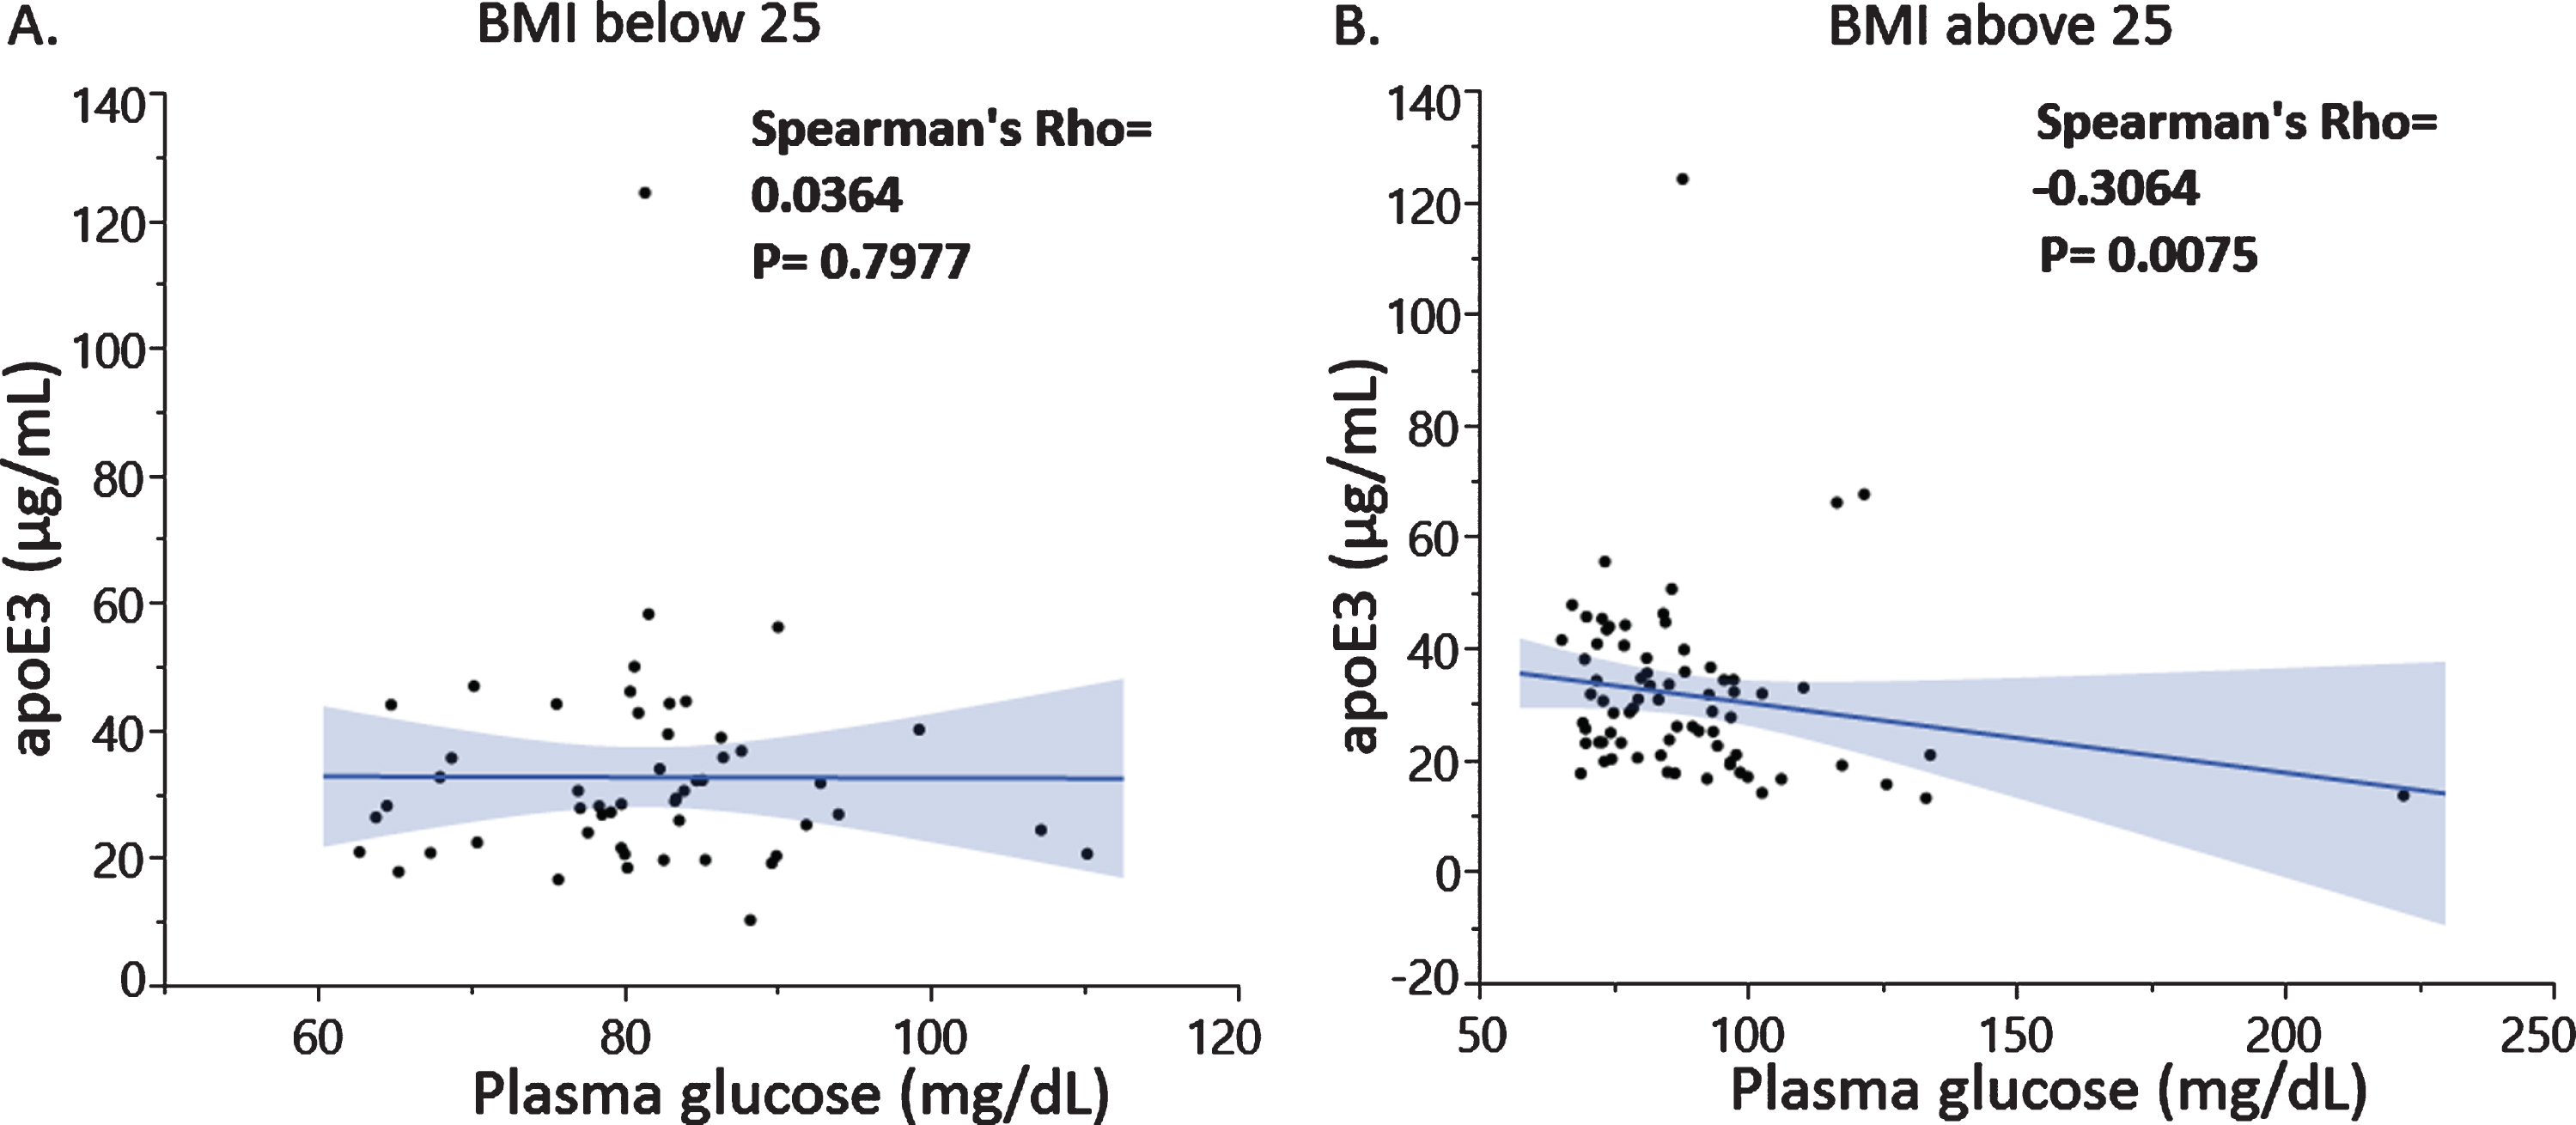
Correlation analysis revealed a negative association between plasma glucose and total apoE levels (Fig. 2A) driven by the apoE3 levels (Fig. 2B) and not the apoE4 isoform levels (data not shown). The latter was expected since we previously reported that total plasma apoE is mainly composed by apoE3 and to a lesser extent apoE4 in the investigated individuals [21]. Similar associations were found in the imaged subjects (data not shown). Importantly, the observed negative association between plasma apoE3 and glucose levels was specific to male subjects only (Fig. 2C, D) and especially pronounced in subjects with a BMI higher than 25 (Fig. 3A, B).
Fig. 2
Plasma glucose levels were negatively associated with total apoE (A) and apoE3 isoform levels (B) with differences in the association depending on male (C) or female sex (D).
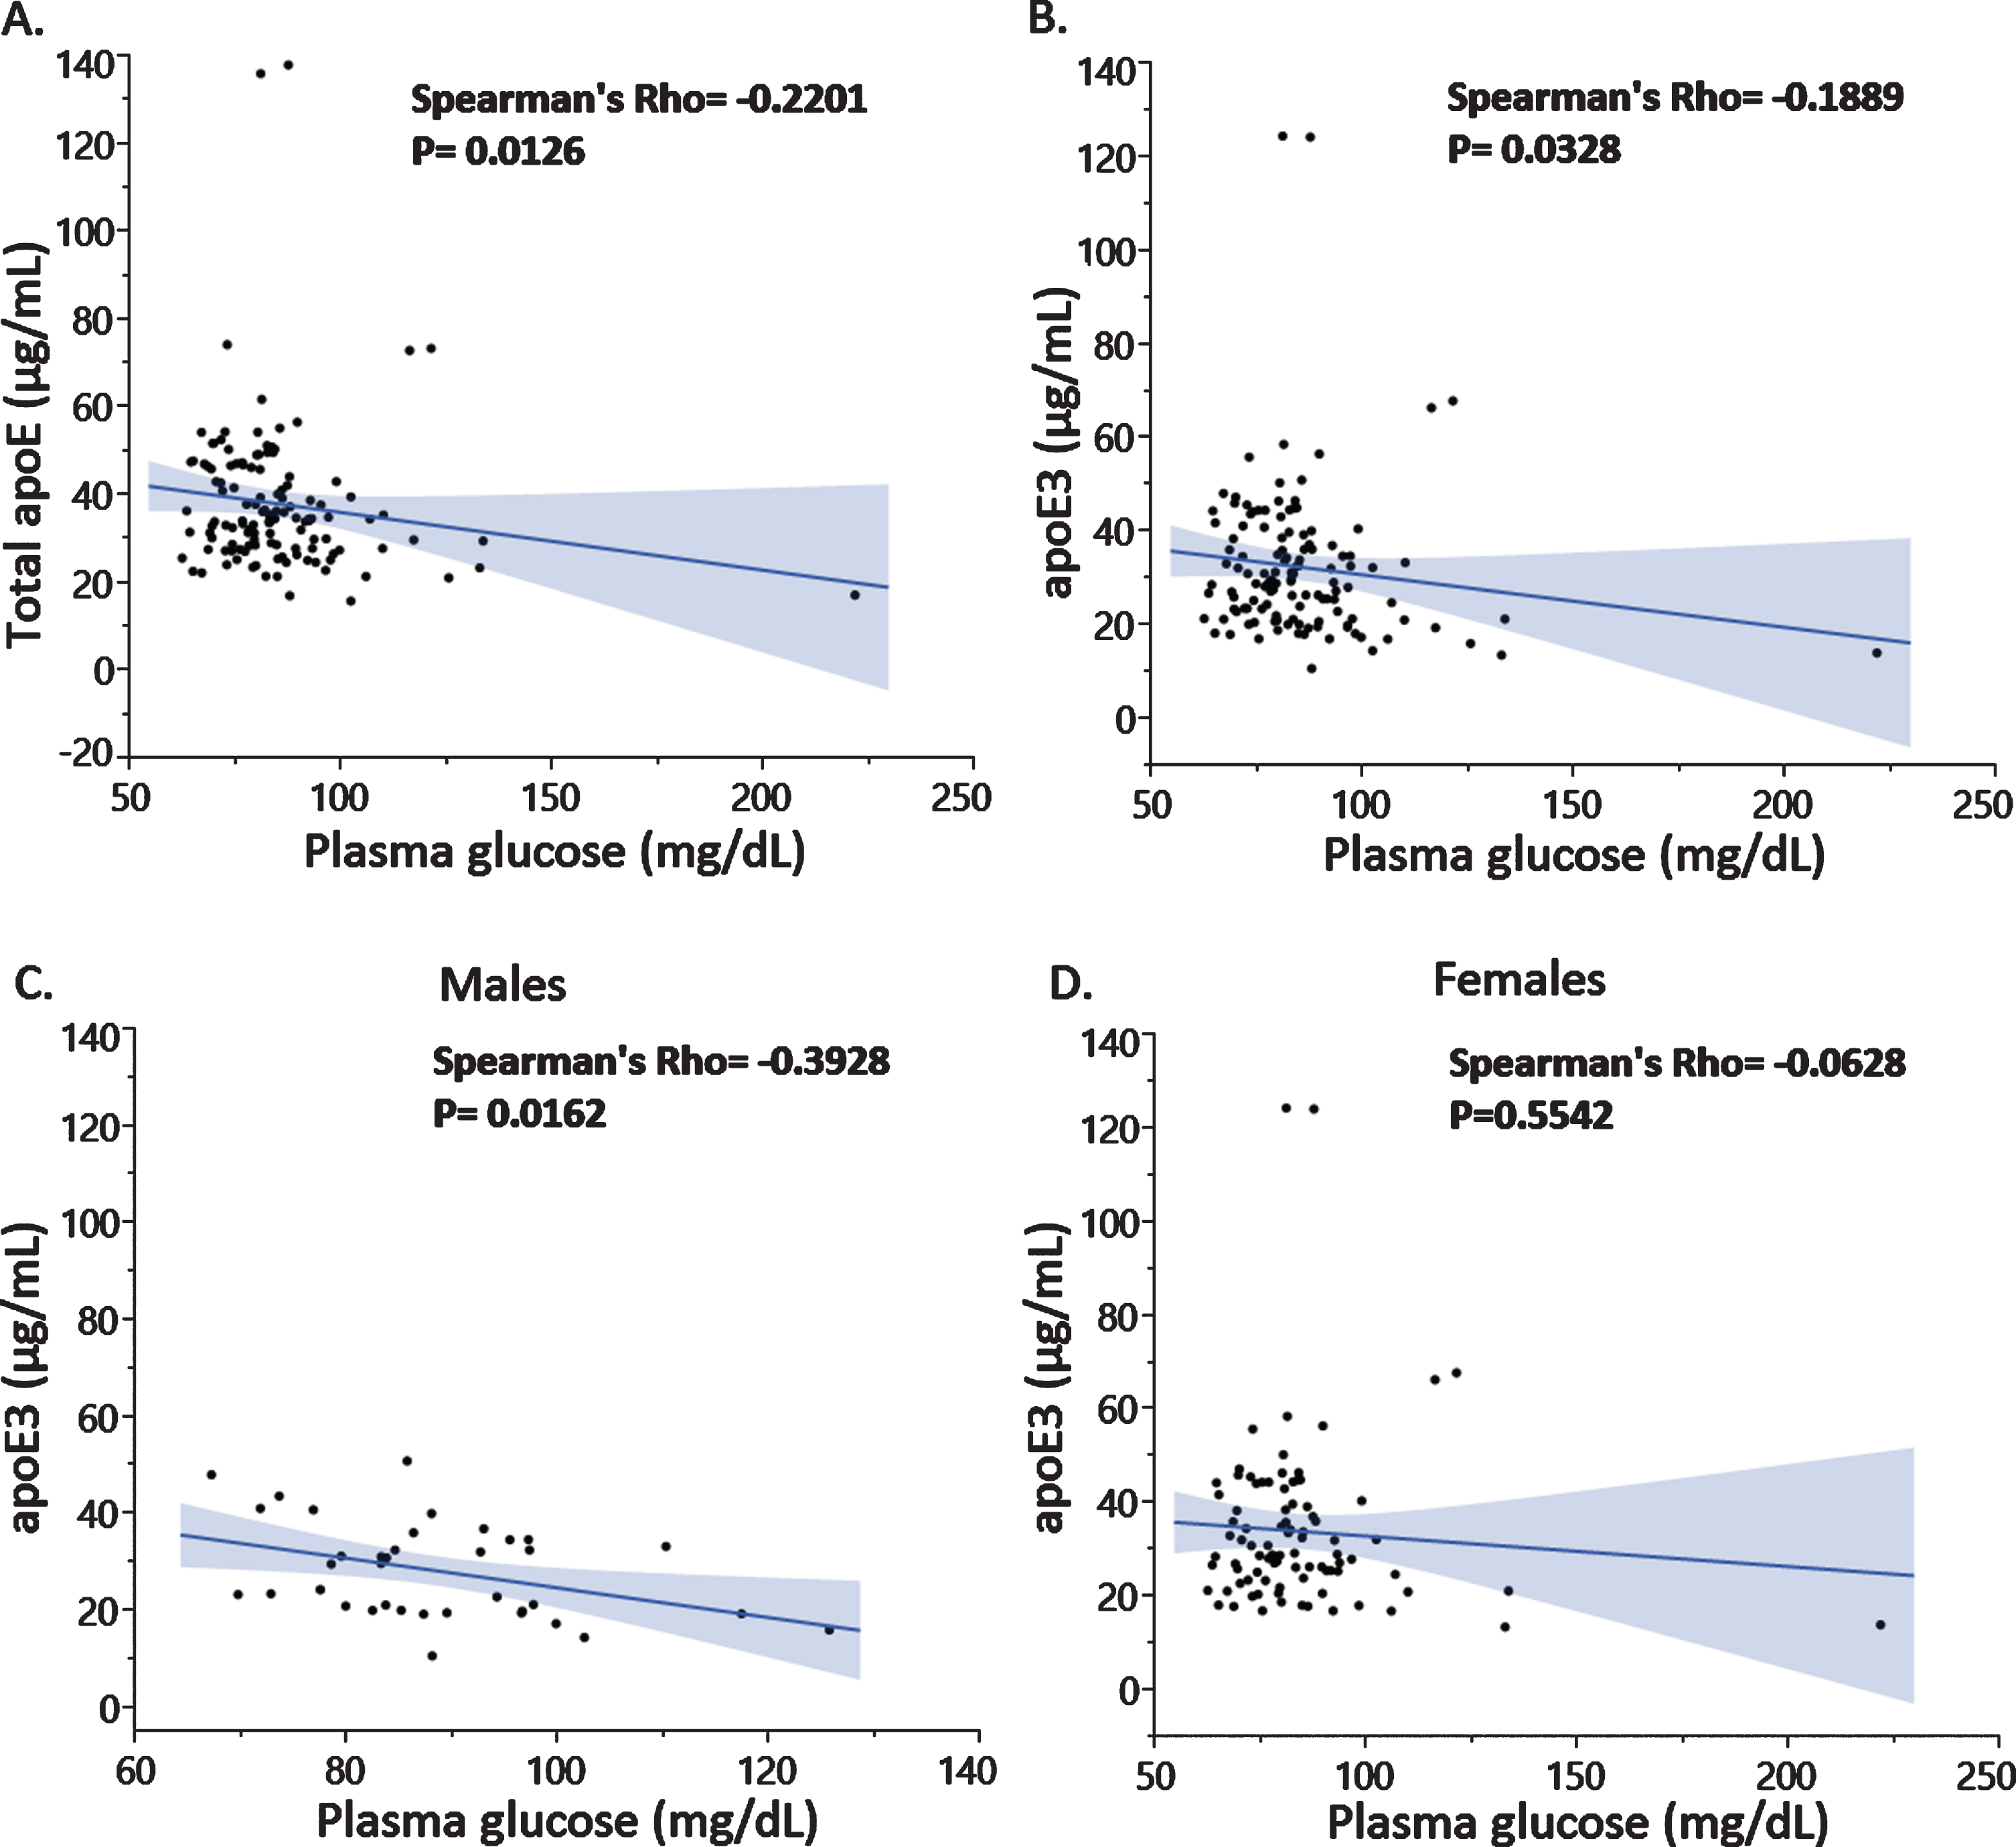
Fig. 3
Associations between plasma apoE3 and plasma glucose levels in subjects with BMI below 25 (A) and above 25 (B).
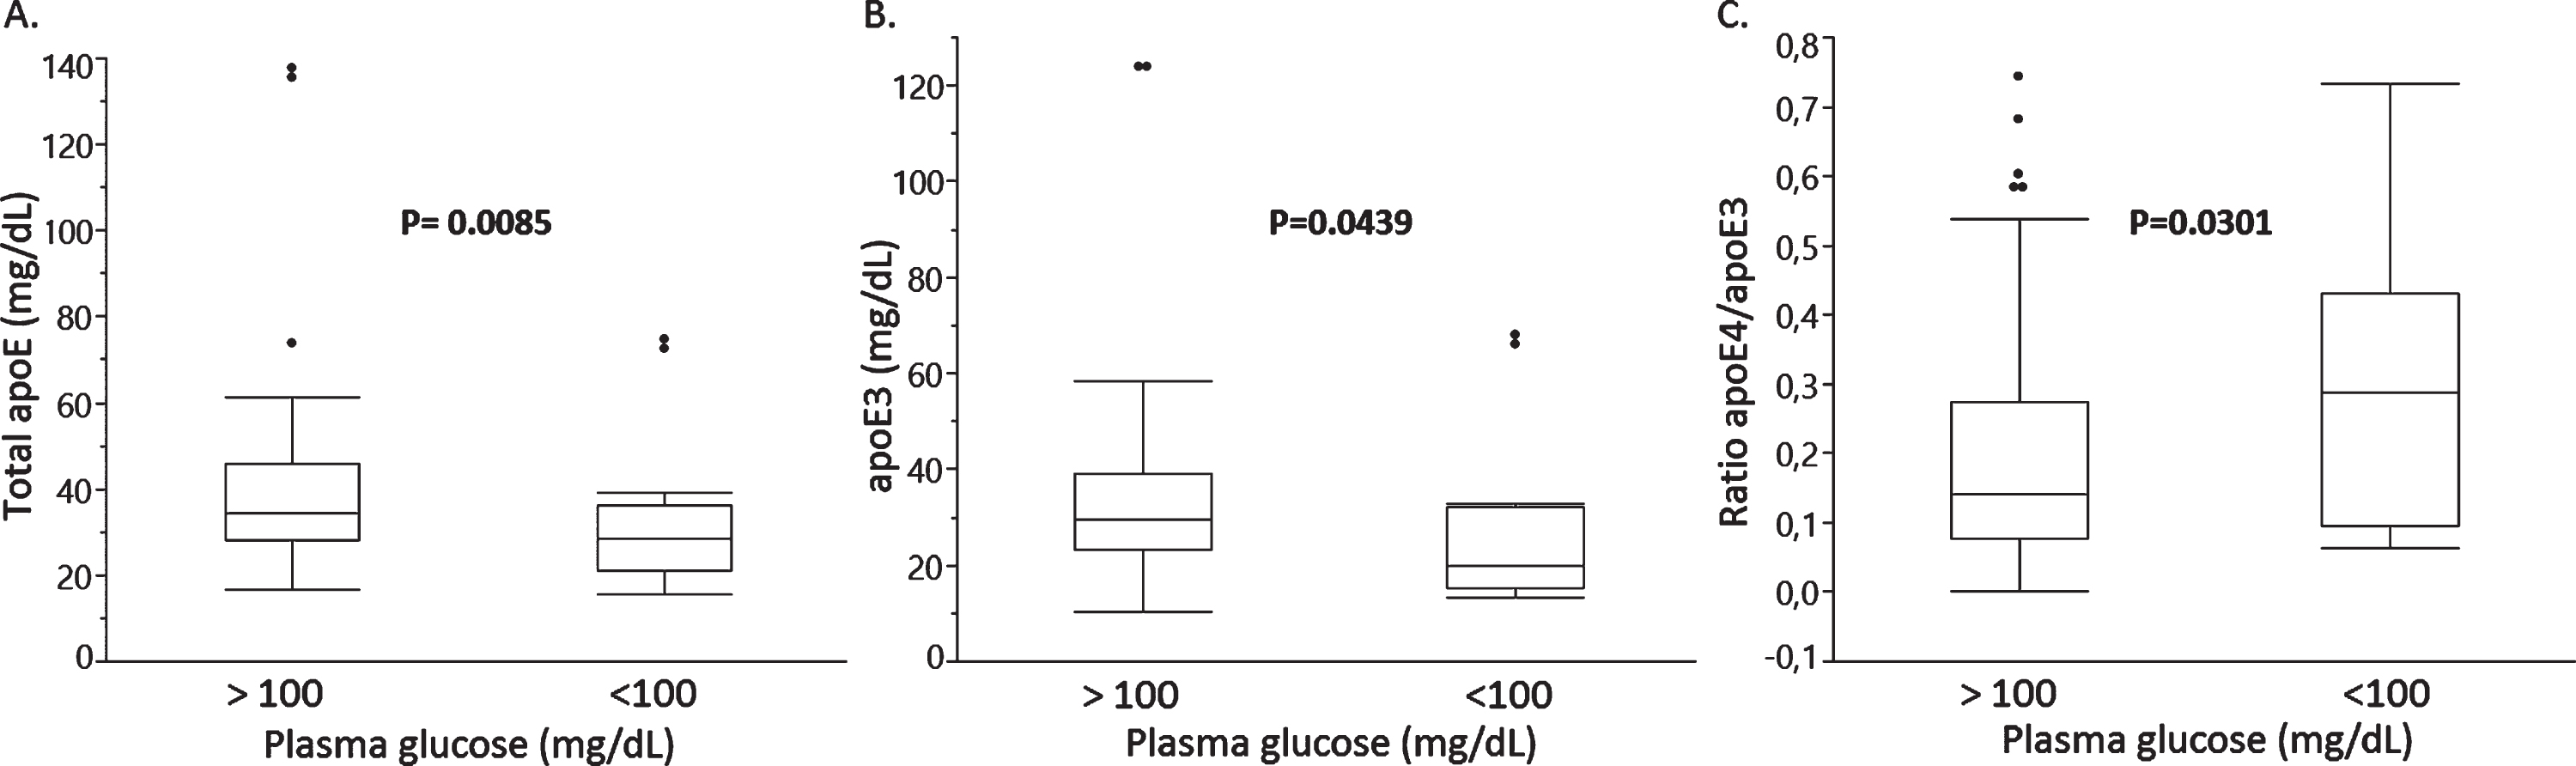
We next explored whether total plasma apoE, apoE3, or apoE4 levels differed between groups stratified based on BMI (cut-off at 25), plasma glucose (cut-off at 100 mg/dL), and plasma insulin (cut-off at 12.2 mU/L) levels, or HOMA-IR (cut-off at 2.6). We found no significant differences in total plasma apoE or the individual apoE3 and apoE4 levels between groups above and below the cut-offs for BMI, plasma insulin, and HOMA-IR (data not shown). However, subjects with plasma glucose levels above 100 mg/dL exhibited 67.8%lower total apoE levels (median, p = 0.0085) (Fig. 4A) and 82.4%lower apoE3 levels (median, p = 0.0439) (Fig. 4B) resulting in a 204%higher relative apoE4/apoE3 isoform ratio (median, p = 0.0301) in the group with glucose levels above 100 mg/dL (Fig. 4C).
Fig. 4
Total plasma apoE (A), plasma apoE3 (B) and a relative apoE4/apoE3 plasma isoform ratio in study subjects stratified based on plasma glucose cut-offs of 100 mg/dL.
Associations between plasma glucose and insulin levels, brain glucose metabolism, and gray matter volume
A total of 25 of the studied subjects had undergone FDG-PET and MRI to determine CMRgl and GMV [21]. In this subgroup we explored associations of plasma glucose or insulin levels with CMRgl or GMV while correcting for the plasma apoE4/E3 ratio which we previously found to be associated with regional CMRgl and GMV [21], p = 0.005 uncorrected for multiple comparisons over the whole brain, but with post-hoc examination using SVC procedure.
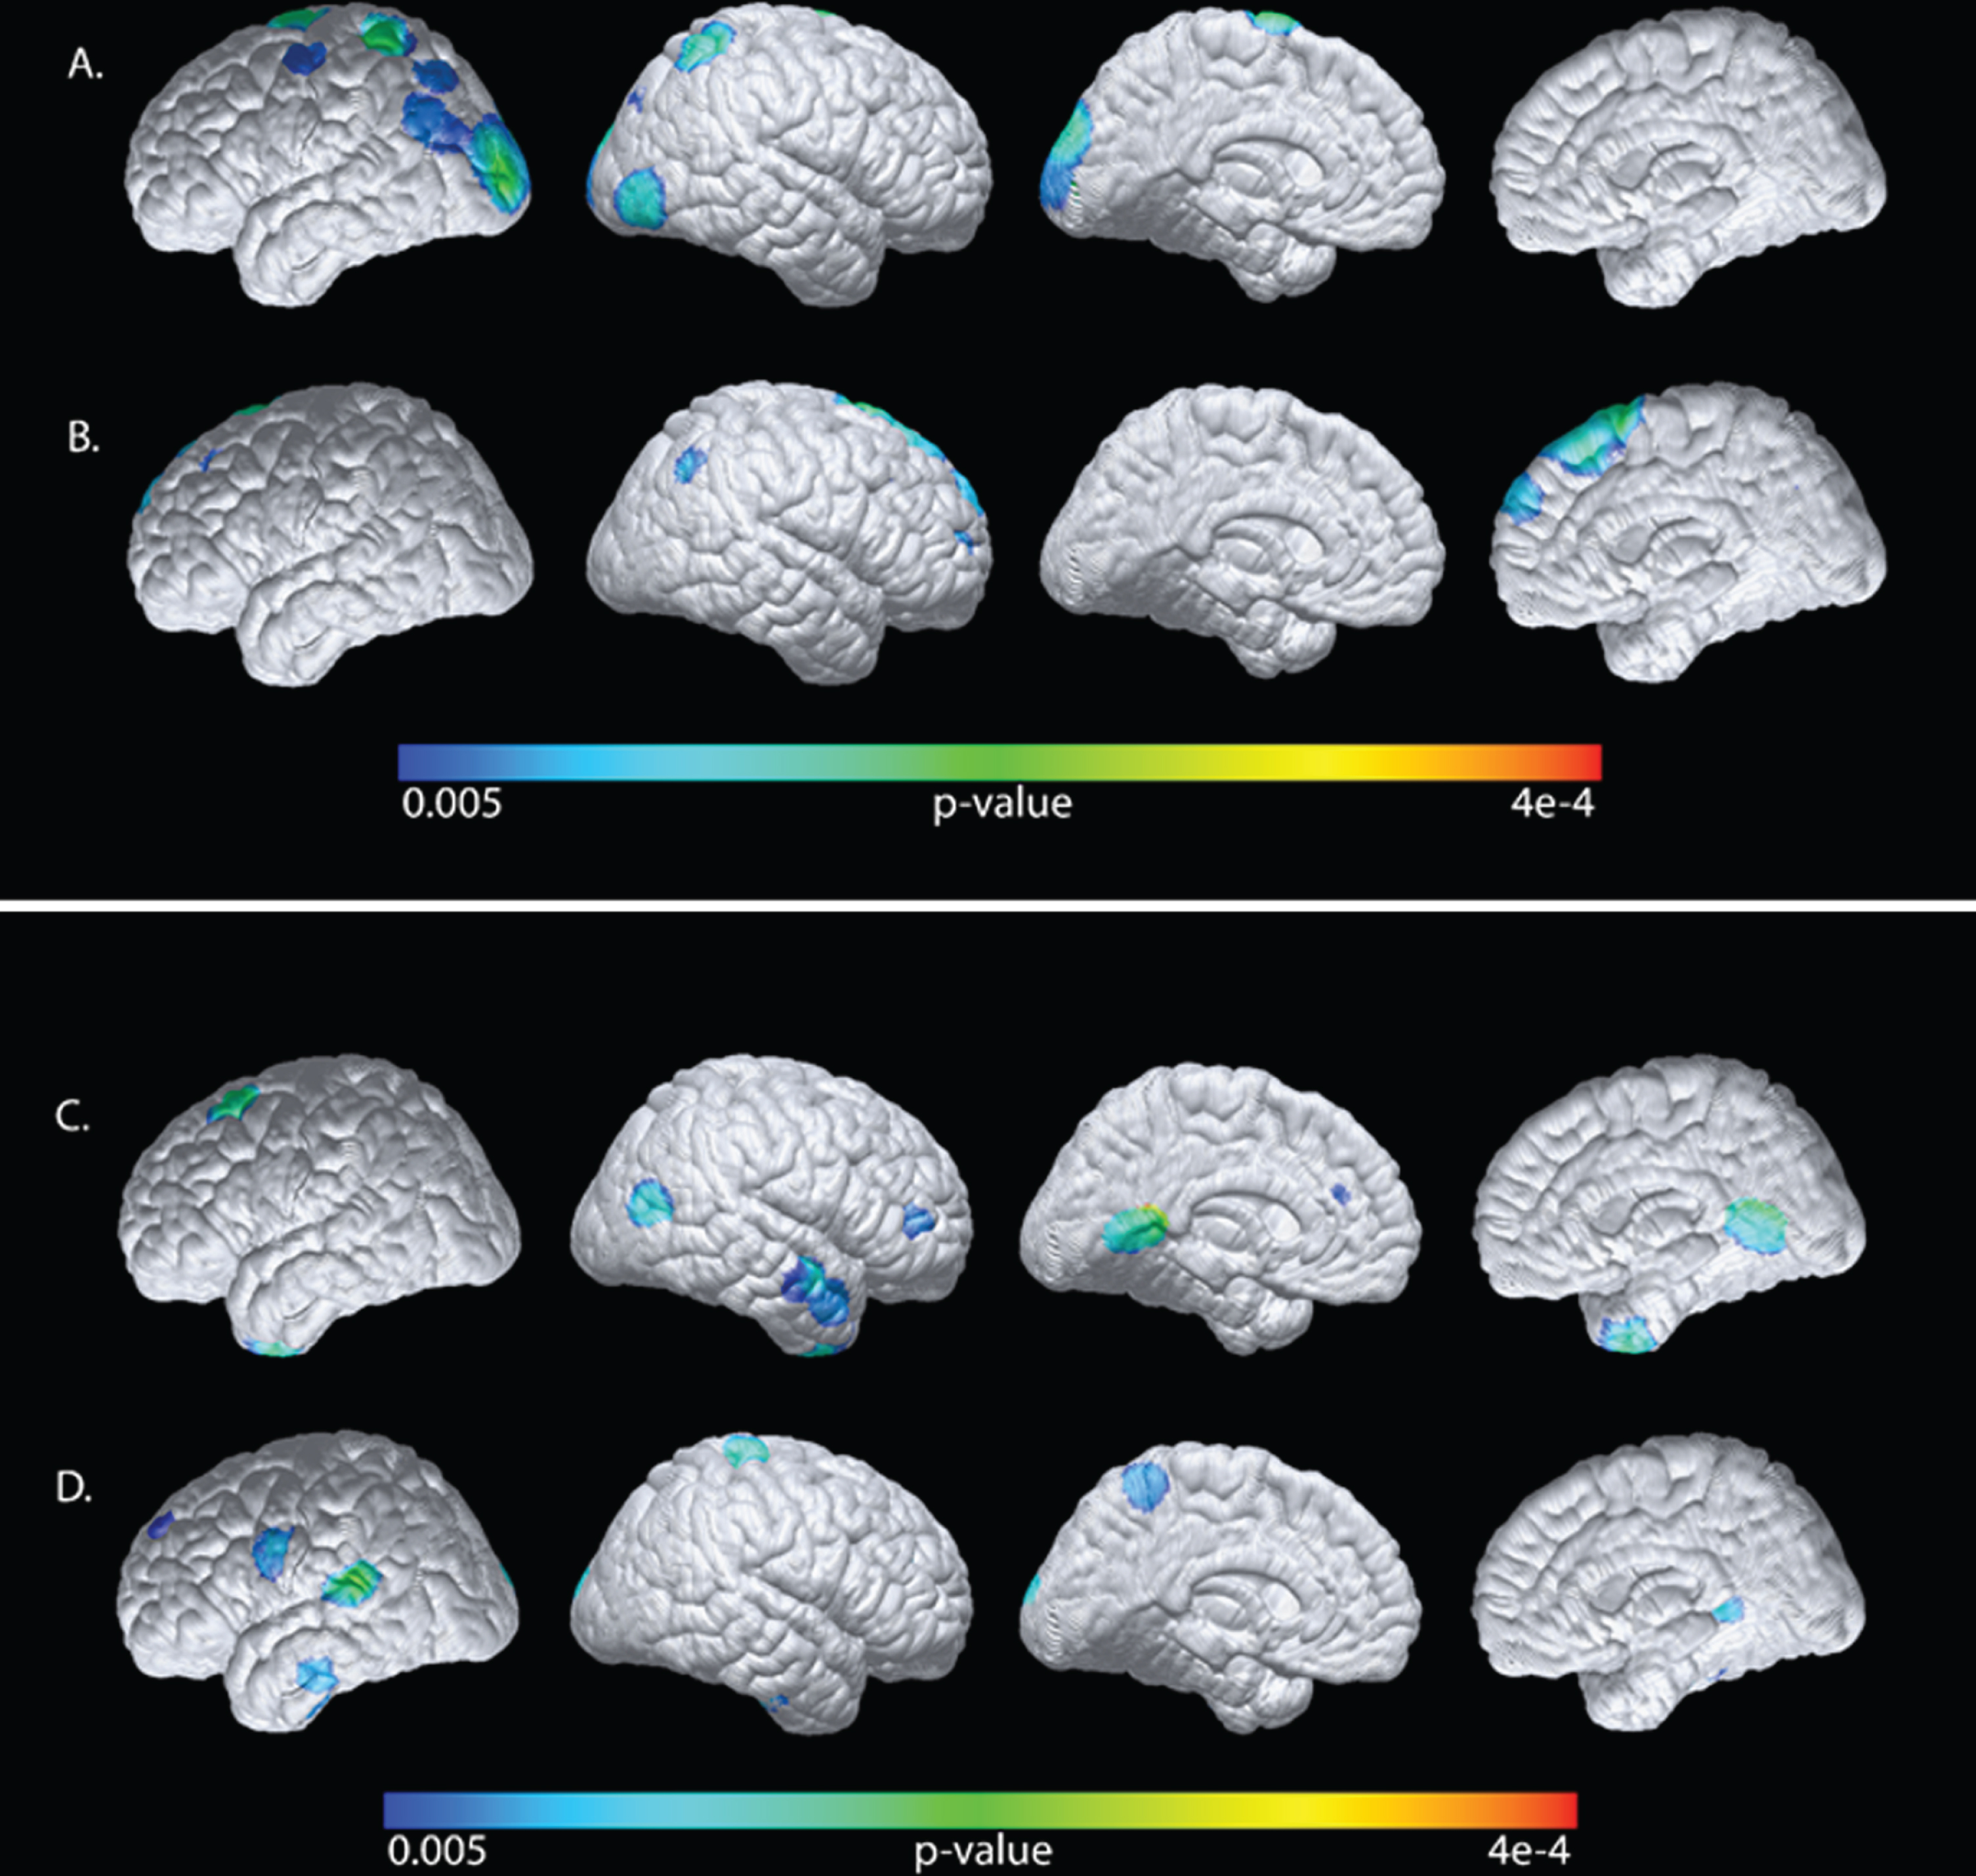
Factoring out the plasma apoE4/E3 levels (partial correlation analyses), our exploratory analyses revealed only negative associations between plasma glucose and CMRgl mainly in the occipital region but also in the left prefrontal region (Table 3). In contrast, plasma insulin levels were positively associated with CMRgl in the parietal and precunial regions as well as bilaterally in the prefrontal region. The positive association between insulin and CMRgl remained significant in the parietal region after SVC (Table 3). Plasma glucose levels were also negatively associated with GMV bilaterally in the lateral temporal region (Table 4), whereas plasma insulin levels were positively correlated to GMV in the left hippocampal region and bilaterally in the lateral temporal region. Hence, plasma glucose and insulin levels are differently associated with CMRgl and GMV in the same brain regions. For illustrative purposes, the findings were superimposed onto a cortical surface map (Fig. 5A D).
Table 3
Statistical associations of plasma glucose or insulin levels with CMRgl
| Associations with CMRgl | Brain region (N = 24) | Coordinates (X,Y,Z) | Correlation Coefficient | p |
| Plasma Glucose Negative associations | Occipital_L | –38, –94, 8 | –0.68 | 2.04e-4 |
| Occipital_R | 46, –86, –6 | –0.60 | 1.39e-3 | |
| prefrontal_L | –16, –4, 78 | –0.70 | 1.05e-4 | |
| Plasma Insulin Positive associations | Parietal_R | 44, –56, 42 | 0.61 | 1.13e-3a |
| Precuneus_R | 12, –66, 36 | 0.54 | 3.32e-3 | |
| prefrontal_L | –20, 30, 36 | 0.62 | 9.23e-4 | |
| prefrontal_R | 12, 30, 54 | 0.63 | 7.51e-4 |
Voxel based linear regression analyses corrected for the plasma apoE4/E3 ratio. a Significant after SVC using the 0.05 threshold.
Table 4
Statistical correlations of plasma glucose or insulin levels with GMV
| Associations with GMV | Brain region (N = 24) | Coordinates (X,Y,Z) | Correlation Coefficient | p |
| Plasma Glucose Negative associations | Lateral_Temporal_L | –68, –37, –8 | –0.53 | 4.91e-3 |
| Lateral_Temporal_R | 57, –3, –23 | –0.64 | 6.48e-4 | |
| Plasma Insulin Positive associations | Hippocampus_L | –38, –25, –15 | 0.60 | 1.53e-3 |
| Lateral_Temporal_L | –60, –37, 7 | 0.69 | 2.33e-5 | |
| Lateral_Temporal_R | 44, –21, –21 | 0.69 | 4.11e-5 |
Voxel based linear regression analyses after correction for plasma apoE4/E3 ratio.
Fig. 5
Statistical maps generated from the voxel-wise analyses were superimposed onto a cortical surface map. Negative associations of plasma glucose levels (A), or positive associations of plasma insulin levels (B) with CMRgl after correction for the plasma apoE4/E3 ratio. Negative associations of plasma glucose and GMV (C) or positive associations between plasma insulin (D) with GMV after correction for the plasma apoE4/E3 ratio.
Effects of plasma glucose, insulin and HOMA-IR on the neuropsychological test outcome
Previous studies have outlined an interaction between peripheral glucose and insulin levels, and cognition [10, 17, 36, 39]. Therefore, we also explored potential associations between plasma glucose, insulin, and HOMA-IR, and scores on neuropsychological tests that assess performance of four major cognitive domains: memory, executive function, language, and visuospatial ability (neuropsychological test scores were previously found to be unrelated to plasma apoE levels in the current cohort [21]). Plasma glucose levels were negatively and significantly associated with outcomes of three tests specifically assessing performance of memory and visuospatial abilities; the AVLT-RL total learning score (verbal memory) (Spearman’s Rho = –0.2123, p = 0.0161), SRT-free total (verbal memory) (Spearman’s Rho = –0.2801, p = 0.0014), and Rey-Ostereith CFT recall (visual) (Spearman’s Rho = –0.2907, p = 0.0009); however, we did not find any associations between plasma insulin levels or HOMA-IR, and scores from any of the neuropsychological tests in our panel (data not shown). No significant associations were found between plasma glucose levels and measures of global cognition and instrumental activities of daily living (results not shown). Lastly, we explored potential sex-differences by stratifying the population into a female and a male subgroup, and re-ran the analysis for the identified associations between glucose, insulin, and HOMA-IR, and cognitive test scores. No outcomes from these analyses were statistically significant.
DISCUSSION
Since the discovery of APOE ɛ4 as a very strong genetic risk factor for late onset AD [40], most studies have focused on the role of APOE and the apoE isoforms in the central nervous system, as peripherally derived apoE, generated mainly by the liver, does not cross the blood-brain barrier [26]. Nevertheless, results from recent studies suggest that low plasma apoE levels significantly increase the risk of developing AD as well as other types of dementia [41]. We have previously shown that low plasma apoE levels unfavorably correlated with CSF AD biomarker levels and cognition [23]. Using the same cohort of subjects examined in the current study, we have also reported that a higher relative plasma concentration ratio between the apoE4 and apoE3 isoforms was associated with reduced GMV and cerebral glucose metabolism specifically in the hip-pocampus [21]. Together the previous results suggest that despite not crossing the blood-brain barrier, plasma apoE levels are as of yet to be appreciated relevance not only to AD risk, but also to un-favorable levels of CSF AD biomarkers indicative of tau and Aβ pathology, as well as structural and functional brain measures. In the current study, we sought to in more detail investigate whether plasma apoE levels are related to peripheral glucose metabolism, specifically plasma glucose and insulin levels and HOMA-IR, which previously was shown to affect brain glucose metabolism and brain atrophy [9, 10, 16, 17, 42] by analyzing a potential association between plasma apoE, glucose, and insulin levels, and HOMA-IR. Such pot-ential associations would in part help to explain our previous findings of a correlation between plasma apoE levels, brain glucose metabolism, and GMV. The strength of using the same cohort as previously investigated include the rather large number of 128 subjects having the exact same APOE (ɛ3/ɛ4) genotype and the possibility of assessing potential associations specifically between the individual ‘AD neutral’ apoE3 and ‘AD risky’ apoE4 isoforms, glucose, insulin, and HOMA-IR in the same setting.
We here report that higher plasma glucose levels were inversely linked to lower plasma apoE levels, specifically the apoE3 isoform levels. This inverse association between higher plasma glucose and lower apoE levels was especially pronounced in males and in study participants with a BMI higher than 25. Importantly, plasma levels of apoE4 were not associated with glucose levels and neither apoE3 nor apoE4 levels were correlated to plasma insulin levels. These findings suggest that the protein levels of the apoE4 isoform in contrast to apoE3, at least in the blood stream, may not be directly implicated in glucose metabolism. It is known that carriers of the APOE ɛ4 allele exhibit less apoE in plasma, due to a specific reduction of the apoE4 isoform [19] possibly due to a higher turn-over rate compared to apoE3 [43]. However, it is yet to be established whether the two APOE variants are expressed to the same extent in heterozygous individuals and whether plasma apoE levels per se can be modulated by plasma glucose levels or the other way around. Given that previous studies have shown that low plasma apoE levels increase the risk of dementia [22, 41] and that higher plasma glucose levels also are harmful in various ways [44], we hypothesize that low plasma apoE in conjunction with higher glucose levels are a pathological combination that may promote neurodegenerative dementia. In support, sustained higher plasma glucose levels were associated with insulin resistance and T2DM, which significantly increases the risk of AD [15, 45].
In the current study, we failed to find any significant contribution of higher glucose levels to the development of MCI in cognitively healthy individuals. This may seem controversial given that faster conversion from MCI to AD was reported in individuals with high plasma glucose levels [13] and T2DM [46]. Furthermore, a recent meta-analysis uncovered that a longer duration of T2DM may be a risk factor for the conversion from MCI to AD in people with T2DM [47]. Thus, despite that higher plasma glucose levels were unrelated to the development of MCI in the current study, the individuals with higher plasma glucose levels may still be at a higher risk of converting from MCI to AD. Higher plasma glucose levels may more strongly promote conversion from MCI to AD, however, we speculate that the underlying foundation may silently be laid down already earlier in the disease development.
Interestingly, rather than increasing the risk of disease, as for AD, T2DM has instead been proposed to reduce the risk of another neurodegenerative disease, ALS, in some populations [48]. Plasma apoE in ALS patients was also suggested to serve as a marker of disease progression, as higher plasma apoE was related to an increased rate of deterioration and a higher risk of earlier death [25]. It is well known that ALS patients, despite muscle atrophy, often are ‘hypermetabolic’ [49]. Opposite to the case in AD [50, 51], dyslipidemia including increased levels of cholesterol and triglycerides, and a higher low-density lipoprotein (LDL) to high-density lipoprotein (HDL) ratio, appear to be beneficial, protective and linked to prolonged survival in ALS patients [52]. When considered together, studies of apoE levels in the context of both AD and ALS may provide clues to how metabolic processes which differ between the diseases, may be linked to apoE levels.
The determined plasma glucose levels were, as expected, strongly influenced by insulin levels, as indicated by the significant correlation between the two, however, not only does insulin-mediated glu-cose uptake control the overall glucose levels, but non insulin-mediated glucose uptake, which is dif-ferentially regulated, also does the same [53]. As we were unable to find a significant association bet-ween plasma apoE and insulin levels, despite the correlation with glucose, we speculate that insulin-independent processes governing plasma glucose may instead be related to apoE. One such scenario may be played out through the lipid binding and lipoparticle formation of apoE. The apoE4 isoform preferentially associates with very-low density lipoprotein (VLDL) and LDL particles whereas apoE3 mainly associates with HDL [54]. High-density lipoprotein particles may modulate glucose metabolism in an insulin-independent manner through an ABCA1/AMPK-dependent mechanism, which can promote increased glucose uptake in skeletal muscles [55]. Thus, plasma apoE3 levels may indirectly modify glucose metabolism through its interaction with HDL particles. Interestingly, revisiting the previously reported lipid profile of 24 of the subjects included in the current study [21], we found that the levels of HDL but not LDL cholesterol were negatively associated with both plasma glucose (Spearman’s Rho: –0.4656, 9 = 0.0218) and insulin levels (Spearman’s Rho: –0.5004, p = 0.0128). These results support the specificity of the link between plasma apoE3, and not apoE4, via HDL particles to plasma glucose controlled by both insulin and insulin-independent processes. As we have previously reported that the dimer formation of apoE3 in plasma from healthy controls were positively linked to HDL levels [23], we speculate that the degree of dimer formation of apoE3 may also have functional consequences potentially for the association with plasma glucose as observed in the current study. Of note, altered plasma lipoprotein cholesterol levels were previously linked to higher risk of T2DM [56, 57] which may be linked to lipoprotein apolipoprotein composition and APOE genotype
Furthermore, in our study, higher plasma apoE3 levels were linked to lower plasma glucose levels mainly in males. Age-related changes in glucose metabolism were previously reported with fasting plasma glucose levels increasing at a rate of 0.7–1.1 mg/dL per age decade [58], however, we did not observe any effects of age on the plasma glucose levels in our study population. Instead, higher plasma glucose levels may be modulated by a higher BMI and reflect aberrant hepatic glucose production, which has been linked to increased body fat and male sex rather than age [58]. How this is linked to carrying the APOE ɛ4 allele remains unclear, but obese men with an APOE ɛ4 genotype were earlier described to have higher insulin and glucose levels than obese men without APOE ɛ4 [59].
Functionally, we found that the higher plasma glucose levels were related to worse performance on neuropsychological tests assessing memory and visuospatial abilities. Furthermore, when correcting for the apoE4/E3 ratio, which we previously showed was associated with reduced glucose metabolism specifically in the hippocampus, and reduced GMV in several brain areas [21], we found that indeed plasma glucose and insulin levels were, independently of the apoE4/E3 ratio, associated with brain glucose metabolism and GMV. Our latter findings, although only observed in a small number of participants who had undergone brain imaging, are in line with results of previous reports. For example, higher fasting plasma glucose levels, even if still in the normal range, have been linked to hippocampal atrophy, reduced GMV in several brain areas, and worse cognitive performance [42, 60]. Interestingly, the association between reduced GMV in the frontal cortices and a functional effect on cognition was specific to male study subjects [60]. Previous studies have also shown that higher plasma glucose levels increased the risk of dementia and in addition were linked to more severe AD pathology at autopsy [11, 61]. Whether hampered insulin signaling or merely the higher glucose levels and related effects may be the driver in the AD-associated Aβ pathology is not clear. However, results from the work of Wakabayashi and colleagues who used two in vivo models, proposed that brain Aβ metabolism and pathology may be related to causal factors of insulin resistance induced by a high fat diet (such as metabolic stress and inflammation), rather than insulin resistance [62]. This may be of specific importance in APOE ɛ4 carriers who are known to start accumulating Aβ pathology already in their fifth decade of life while not experiencing any cognitive deficits [63].
Our results showed that higher plasma insulin levels were positively associated with GMV and CMR-gl but, as mentioned, unrelated to apoE levels. Pre-vious studies of the effects of peripheral insulin resistance in cognitively healthy subjects, using HOMA-IR as an index, on brain glucose metabolism have reported on links between greater hypometabolism with increasing insulin resistance [16, 17]. Transient changes in brain insulin resistance have been suggested to occur in AD pathology, Willette and colleagues found that the HOMA-IR correlated with glucose hypometabolism in stable MCI sub-jects, whereas MCI-progressors exhibited hypermetabolism in medial temporal regions [64]. Our findings of associations of opposite direction between glucose and insulin and CMRgl, for example in the prefrontal cortex where peripheral glucose levels were negatively associated with CMRgl, whereas peripheral insulin was positively associated with CMRgl, suggests that insulin signaling unrelated to its role in glycemic control may be of importance in this context. Insulin receptors are highly expressed at synapses and modulate synaptic activity for example in the hippocampus where insulin signaling has been reported to be involved in enhanced excitatory neurotransmission [65]. We speculate that in brains with intact insulin sensitivity increased peripheral levels of insulin promote increased FDG-PET uptake through insulin stimulated-neuronal activity. This assumption is in line with a previous report demonstrating that modulation of peripheral insulin levels while maintaining euglycemia affected memory performance and plasma levels of the amyloid-β protein precursor (AβPP) in an APOE ɛ4-dependent manner in AD patients [66].
Shortcomings in our study include the lack of a complete lipid profile for all of the investigated subjects as well as the non-standardized blood sampling for the assessment of plasma and insulin levels (at least 4 h of fasting). As only a small number of the total study subjects had undergone brain imaging, the results from the analyses relating to associations between plasma glucose and insulin should be regarded as descriptive, although they do support previously reported findings. Also, although our study of APOE ɛ3/ɛ4 subjects offered us the opportunity to independently study associations between plasma glucose and insulin with the individual levels of both the ‘AD neutral’ apoE3 and ‘AD risky’ apoE4 isoforms, future studies need to include subjects with all the major APOE genotypes. We further need to point out that the sample size of the imaged subjects is small, and our current study needs to be replicated in a larger cohort. Nevertheless, given the small number of imaged subjects in our study, we find it remarkable that we were able to capture the described links between plasma glucose and insulin levels with GMV and CMRgl underscoring the robustness of these biological processes.
We conclude that the previously associated pathological link between a higher ratio of the plasma apoE4 to apoE3 isoform levels with negative imaging findings of cerebral GMV and glucose metabolism [21] as well as low plasma apoE levels as a strong risk factor for developing dementia [41], may be related to an association between plasma apoE and peripheral insulin-independent glucose metabolism. Importan-tly, the reported link between plasma glucose levels and specifically plasma apoE3, but not apoE4, suggest that apoE4 may be deficient in a potential function that links apoE3 to processes governing plasma glucose levels independently of insulin. Future studies to confirm the association between plasma apoE3, but not apoE4, and plasma glucose levels preferably in APOE ɛ3 versus APOE ɛ4 homozygous individuals, are needed. Pinpointing the mechanisms that regardless of APOE genotype may modulate plasma apoE levels and how these in turn relate to peripheral glucose metabolism may provide important new clues into the pathogenesis of APOE ɛ4-promoted neurodegeneration.
ACKNOWLEDGMENTS
The authors wish to sincerely express their gratitude to the study subjects for their participation. This study was supported by grants from Olle Engkvist Foundation, Demensfonden and the BrightFocus Foundation (A2019446S) (to HMN), by NIA grant P30AG019610 and R01AG031581 (to ER), and by the Arizona Alzheimer’s Research Consortium. None of the funding sources participated in the design of the study or in the collection, analyses and interpretation of data, or in writing the manuscript.
Authors’ disclosures available online (https://www.j-alz.com/manuscript-disclosures/21-0065r1).
SUPPLEMENTARY MATERIAL
[1] The supplementary material is available in the electronic version of this article: https://dx.doi.org/10.3233/JAD-210065.
REFERENCES
[1] | Das HK , McPherson J , Bruns GA , Karathanasis SK , Breslow JL ((1985) ) Isolation, characterization, and mapping to chromosome 19 of the human apolipoprotein E gene. J Biol Chem 260: , 6240–6247. |
[2] | Corder EH , Saunders AM , Strittmatter WJ , Schmechel DE , Gaskell PC , Small GW , Roses AD , Haines JL , Pericak-Vance MA ((1993) ) Gene dose of apolipoprotein E type 4 allele and the risk of Alzheimer’s disease in late onset families. Science 261: , 921–923. |
[3] | Bateman RJ , Xiong C , Benzinger TL , Fagan AM , Goate A , Fox NC , Marcus DS , Cairns NJ , Xie X , Blazey TM , Holtzman DM , Santacruz A , Buckles V , Oliver A , Moulder K , Aisen PS , Ghetti B , Klunk WE , McDade E , Martins RN , Masters CL , Mayeux R , Ringman JM , Rossor MN , Schofield PR , Sperling RA , Salloway S , Morris JC ((2012) ) Clinical and biomarker changes in dominantly inherited Alzheimer’s disease. N Engl J Med 367: , 795–804. |
[4] | Chandra A , Valkimadi PE , Pagano G , Cousins O , Dervenoulas G , Politis M ((2019) ) Applications of amyloid, tau, and neuroinflammation PET imaging to Alzheimer’s disease and mild cognitive impairment. Hum Brain Mapp 40: , 5424–5442. |
[5] | Mosconi L ((2013) ) Glucose metabolism in normal aging and Alzheimer’s disease: Methodological and physiological considerations for PET studies. Clin Transl Imaging 1: , doi: 10.1007/s40336-013-0026-y |
[6] | Reiman EM , Chen K , Alexander GE , Caselli RJ , Bandy D , Osborne D , Saunders AM , Hardy J ((2004) ) Functional brain abnormalities in young adults at genetic risk for late-onset Alzheimer’s dementia. Proc Natl Acad Sci U S A 101: , 284–289. |
[7] | Jagust WJ , Landau SM ((2012) ) Apolipoprotein E, not fibrillar beta-amyloid, reduces cerebral glucose metabolism in normal aging. J Neurosci 32: , 18227–18233. |
[8] | Reiman EM , Chen K , Alexander GE , Caselli RJ , Bandy D , Osborne D , Saunders AM , Hardy J ((2005) ) Correlations between apolipoprotein E epsilon4 gene dose and brain-imaging measurements of regional hypometabolism. Proc Natl Acad Sci U S A 102: , 8299–8302. |
[9] | Burns CM , Chen K , Kaszniak AW , Lee W , Alexander GE , Bandy D , Fleisher AS , Caselli RJ , Reiman EM ((2013) ) Higher serum glucose levels are associated with cerebral hypometabolism in Alzheimer regions. Neurology 80: , 1557–1564. |
[10] | Burns CM , Kaszniak AW , Chen K , Lee W , Bandy DJ , Caselli RJ , Reiman EM ((2018) ) Longitudinal changes in serum glucose levels are associated with metabolic changes in Alzheimer’s disease related brain regions. J Alzheimers Dis 62: , 833–840. |
[11] | Crane PK , Walker R , Hubbard RA , Li G , Nathan DM , Zheng H , Haneuse S , Craft S , Montine TJ , Kahn SE , McCormick W , McCurry SM , Bowen JD , Larson EB ((2013) ) Glucose levels and risk of dementia. N Engl J Med 369: , 540–548. |
[12] | Bangen KJ , Himali JJ , Beiser AS , Nation DA , Libon DJ , Fox CS , Seshadri S , Wolf PA , McKee AC , Au R , Delano-Wood L ((2016) ) Interaction between midlife blood glucose and APOE genotype predicts later Alzheimer’s disease pathology. J Alzheimers Dis 53: , 1553–1562. |
[13] | Morris JK , Vidoni ED , Honea RA , Burns JM ((2014) ) Impaired glycemia increases disease progression in mild cognitive impairment. Neurobiol Aging 35: , 585–589. |
[14] | Pearson ER ((2019) ) Type 2 diabetes: A multifaceted disease. Diabetologia 62: , 1107–1112. |
[15] | Matsuzaki T , Sasaki K , Tanizaki Y , Hata J , Fujimi K , Matsui Y ((2010) ) Insulin resistance is associated with the pathology of Alzheimer disease. Neurology 75: , 764–770. |
[16] | Baker LD , Cross DJ , Minoshima S , Belongia D , Watson GS , Craft S ((2011) ) Insulin resistance and Alzheimer-like reductions in regional cerebral glucose metabolism for cognitively normal adults with prediabetes or early type 2 diabetes. Arch Neurol 68: , 51–57. |
[17] | Willette AA , Bendlin BB , Starks EJ , Birdsill AC , Johnson SC , Christian BT , Okonkwo OC , La Rue A , Hermann BP , Koscik RL , Jonaitis EM , Sager MA , Asthana S ((2015) ) Association of insulin resistance with cerebral glucose uptake in late middle-aged adults at risk for Alzheimer disease. JAMA Neurol 72: , 1013–1020. |
[18] | Peila R , Rodriguez BL , Launer LJ , Honolulu-Asia Aging Study ((2002) ) Type 2 diabetes, APOE gene, and the risk for dementia and related pathologies: The Honolulu-Asia Aging Study. Diabetes 51: , 1256–1262. |
[19] | Martinez-Morillo E , Hansson O , Atagi Y , Bu G , Minthon L , Diamandis EP , Nielsen HM ((2014) ) Total apolipoprotein E levels and specific isoform composition in cerebrospinal fluid and plasma from Alzheimer’s disease patients and controls. Acta Neuropathol 127: , 633–643. |
[20] | Baker-Nigh AT , Mawuenyega KG , Bollinger JG , Ovod V , Kasten T , Franklin EE , Liao F , Jiang H , Holtzman D , Cairns NJ , Morris JC , Bateman RJ ((2016) ) Human central nervous system (CNS) ApoE isoforms are increased by age, differentially altered by amyloidosis, and relative amounts reversed in the CNS compared with plasma. J Biol Chem 291: , 27204–27218. |
[21] | Nielsen HM , Chen K , Lee W , Chen Y , Bauer RJ 3rd , Reiman E , Caselli R , Bu G ((2017) ) Peripheral apoE isoform levels in cognitively normal APOE epsilon3/epsilon4 individuals are associated with regional gray matter volume and cerebral glucose metabolism. Alzheimers Res Ther 9: , 5. |
[22] | Rasmussen KL , Tybjaerg-Hansen A , Nordestgaard BG , Frikke-Schmidt R ((2015) ) Plasma levels of apolipoprotein E and risk of dementia in the general population. Ann Neurol 77: , 301–311. |
[23] | Patra K , Giannisis A , Edlund AK , Sando SB , Lauridsen C , Berge G , Grontvedt GR , Brathen G , White LR , Nielsen HM ((2019) ) Plasma apolipoprotein E monomer and dimer profile and relevance to Alzheimer’s disease. J Alzheimers Dis 71: , 1217–1231. |
[24] | Berge G , Sando SB , Rongve A , Aarsland D , White LR ((2014) ) Apolipoprotein E epsilon2 genotype delays onset of dementia with Lewy bodies in a Norwegian cohort. J Neurol Neurosurg Psychiatry 85: , 1227–1231. |
[25] | Lacomblez L , Doppler V , Beucler I , Costes G , Salachas F , Raisonnier A , Le Forestier N , Pradat PF , Bruckert E , Meininger V ((2002) ) APOE: A potential marker of disease progression in ALS. Neurology 58: , 1112–1114. |
[26] | Linton MF , Gish R , Hubl ST , Butler E , Esquivel C , Bry WI , Boyles JK , Wardell MR , Young SG ((1991) ) Phenotypes of apolipoprotein B and apolipoprotein E after liver transplantation. J Clin Invest 88: , 270–281. |
[27] | Qiu Q , Lin X , Sun L , Zhu MJ , Wang T , Wang JH , Li GJ , Xiao SF , Li X ((2019) ) Cognitive decline is related to high blood glucose levels in older Chinese adults with the ApoE epsilon3/epsilon3 genotype. Transl Neurodegener 8: , 12. |
[28] | Sommerfield AJ , Deary IJ , Frier BM ((2004) ) Acute hyperglycemia alters mood state and impairs cognitive performance in people with type 2 diabetes. Diabetes Care 27: , 2335–2340. |
[29] | Cox D , Gonder-Frederick L , McCall A , Kovatchev B , Clarke W (2002) The effects of glucose fluctuation on cognitive function and QOL: The functional costs of hypoglycaemia and hyperglycaemia among adults with type 1 or type 2 diabetes. Int J Clin Pract Suppl, pp. 20-26. |
[30] | Caselli RJ , Dueck AC , Osborne D , Sabbagh MN , Connor DJ , Ahern GL , Baxter LC , Rapcsak SZ , Shi J , Woodruff BK , Locke DE , Snyder CH , Alexander GE , Rademakers R , Reiman EM ((2009) ) Longitudinal modeling of age-related memory decline and the APOE epsilon4 effect. N Engl J Med 361: , 255–263. |
[31] | Martinez-Morillo E , Nielsen HM , Batruch I , Drabovich AP , Begcevic I , Lopez MF , Minthon L , Bu G , Mattsson N , Portelius E , Hansson O , Diamandis EP ((2014) ) Assessment of peptide chemical modifications on the development of an accurate and precise multiplex selected reaction monitoring assay for apolipoprotein E isoforms. J Proteome Res 13: , 1077–1087. |
[32] | Reiman EM , Lane RD , Ahern GL , Schwartz GE , Davidson RJ , Friston KJ , Yun LS , Chen K ((1997) ) Neuroanatomical correlates of externally and internally generated human emotion. Am J Psychiatry 154: , 918–925. |
[33] | Matthews DR , Hosker JP , Rudenski AS , Naylor BA , Treacher DF , Turner RC ((1985) ) Homeostasis model assessment: Insulin resistance and beta-cell function from fasting plasma glucose and insulin concentrations in man. Diabetologia 28: , 412–419. |
[34] | Caselli RJ , Locke DE , Dueck AC , Knopman DS , Woodruff BK , Hoffman-Snyder C , Rademakers R , Fleisher AS , Reiman EM ((2014) ) The neuropsychology of normal aging and preclinical Alzheimer’s disease. Alzheimers Dement 10: , 84–92. |
[35] | McAuley KA , Williams SM , Mann JI , Walker RJ , Lewis-Barned NJ , Temple LA , Duncan AW ((2001) ) Diagnosing insulin resistance in the general population. Diabetes Care 24: , 460–464. |
[36] | Young SE , Mainous AG , Carnemolla M ((2006) ) Hyperinsulinemia and cognitive decline in a middle-aged cohort. Diabetes Care 29: , 2688–2693. |
[37] | Caselli RJ , Langlais BT , Dueck AC , Chen Y , Su Y , Locke DEC , Woodruff BK , Reiman EM ((2020) ) Neuropsychological decline up to 20 years before incident mild cognitive impairment. Alzheimers Dement 16: , 512–523. |
[38] | ((2000) ) Obesity: Preventing and managing the global epidemic. Report of a WHO consultation. World Health Organ Tech Rep Ser 894: , i-xii, 1–253. |
[39] | Laws SM , Gaskin S , Woodfield A , Srikanth V , Bruce D , Fraser PE , Porter T , Newsholme P , Wijesekara N , Burnham S , Dore V , Li QX , Maruff P , Masters CL , Rainey-Smith S , Rowe CC , Salvado O , Villemagne VL , Martins RN , Verdile G ((2017) ) Insulin resistance is associated with reductions in specific cognitive domains and increases in CSF tau in cognitively normal adults. Sci Rep 7: , 9766. |
[40] | Strittmatter WJ , Saunders AM , Schmechel D , Pericak-Vance M , Enghild J , Salvesen GS , Roses AD ((1993) ) Apolipoprotein E: High-avidity binding to beta-amyloid and increased frequency of type 4 allele in late-onset familial Alzheimer disease. Proc Natl Acad Sci U S A 90: , 1977–1981. |
[41] | Rasmussen KL , Tybjaerg-Hansen A , Nordestgaard BG , Frikke-Schmidt R ((2018) ) Plasma apolipoprotein E levels and risk of dementia: A Mendelian randomization study of 106,562 individuals. Alzheimers Dement 14: , 71–80. |
[42] | Cherbuin N , Sachdev P , Anstey KJ ((2012) ) Higher normal fasting plasma glucose is associated with hippocampal atrophy: The PATH Study. Neurology 79: , 1019–1026. |
[43] | Wildsmith KR , Basak JM , Patterson BW , Pyatkivskyy Y , Kim J , Yarasheski KE , Wang JX , Mawuenyega KG , Jiang H , Parsadanian M , Yoon H , Kasten T , Sigurdson WC , Xiong C , Goate A , Holtzman DM , Bateman RJ ((2012) ) In vivo human apolipoprotein E isoform fractional turnover rates in the CNS. PLoS One 7: , e38013. |
[44] | Brownlee M ((2005) ) The pathobiology of diabetic complications: A unifying mechanism. Diabetes 54: , 1615–1625. |
[45] | Schrijvers EM , Witteman JC , Sijbrands EJ , Hofman A , Koudstaal PJ , Breteler MM ((2010) ) Insulin metabolism and the risk of Alzheimer disease: The Rotterdam Study. Neurology 75: , 1982–1987. |
[46] | Xu W , Caracciolo B , Wang HX , Winblad B , Bäckman L , Qiu C , Fratiglioni L ((2010) ) Accelerated progression from mild cognitive impairment to dementia in people with diabetes. Diabetes 59: , 2928–2935. |
[47] | Pal K , Mukadam N , Petersen I , Cooper C ((2018) ) Mild cognitive impairment and progression to dementia in people with diabetes, prediabetes and metabolic syndrome: A systematic review and meta-analysis. Soc Psychiatry Psychiatr Epidemiol 53: , 1149–1160. |
[48] | Zeng P , Wang T , Zheng J , Zhou X ((2019) ) Causal association of type 2 diabetes with amyotrophic lateral sclerosis: New evidence from Mendelian randomization using GWAS summary statistics. BMC Med 17: , 225. |
[49] | Bouteloup C , Desport JC , Clavelou P , Guy N , Derumeaux-Burel H , Ferrier A , Couratier P ((2009) ) Hypermetabolism in ALS patients: An early and persistent phenomenon. J Neurol 256: , 1236–1242. |
[50] | Nägga K , Gustavsson A-M , Stomrud E , Lindqvist D , van Westen D , Blennow K , Zetterberg H , Melander O , Hansson O ((2018) ) Increased midlife triglycerides predict brain β-amyloid and tau pathology 20 years later. Neurology 90: , e73–e81. |
[51] | Reitz C ((2013) ) Dyslipidemia and the risk of Alzheimer’s disease. Curr Atheroscler Rep 15: , 307. |
[52] | Ferri A , Coccurello R ((2017) ) What is “hyper” in the ALS hypermetabolism? Mediators Inflamm 2017: , 7821672. |
[53] | Baron AD , Wallace P , Olefsky JM ((1987) ) In vivo regulation of non-insulin-mediated and insulin-mediated glucose uptake by epinephrine. J Clin Endocrinol Metab 64: , 889–895. |
[54] | Nguyen D , Dhanasekaran P , Nickel M , Nakatani R , Saito H , Phillips MC , Lund-Katz S ((2010) ) Molecular basis for the differences in lipid and lipoprotein binding properties of human apolipoproteins E3 and E4. Biochemistry 49: , 10881–10889. |
[55] | Drew BG , Duffy SJ , Formosa MF , Natoli AK , Henstridge DC , Penfold SA , Thomas WG , Mukhamedova N , de Courten B , Forbes JM , Yap FY , Kaye DM , van Hall G , Febbraio MA , Kemp BE , Sviridov D , Steinberg GR , Kingwell BA ((2009) ) High-density lipoprotein modulates glucose metabolism in patients with type 2 diabetes mellitus. Circulation 119: , 2103–2111. |
[56] | Haffner SM , Stern MP , Hazuda HP , Mitchell BD , Patterson JK ((1990) ) Cardiovascular risk factors in confirmed prediabetic individuals. Does the clock for coronary heart disease start ticking before the onset of clinical diabetes? JAMA 263: , 2893–2898. |
[57] | Mackey RH , Mora S , Bertoni AG , Wassel CL , Carnethon MR , Sibley CT , Goff DC Jr. ((2015) ) Lipoprotein particles and incident type 2 diabetes in the multi-ethnic study of atherosclerosis. Diabetes Care 38: , 628–636. |
[58] | Chia CW , Egan JM , Ferrucci L ((2018) ) Age-related changes in glucose metabolism, hyperglycemia, and cardiovascular risk. Circ Res 123: , 886–904. |
[59] | Elosua R , Demissie S , Cupples LA , Meigs JB , Wilson PW , Schaefer EJ , Corella D , Ordovas JM ((2003) ) Obesity modulates the association among APOE genotype, insulin, and glucose in men. Obes Res 11: , 1502–1508. |
[60] | Mortby ME , Janke AL , Anstey KJ , Sachdev PS , Cherbuin N ((2013) ) High “normal” blood glucose is associated with decreased brain volume and cognitive performance in the 60s: The PATH through life study. PLoS One 8: , e73697. |
[61] | Bangen KJ , Beiser A , Delano-Wood L ((2013) ) APOE genotype modifies the relationship between midlife vascular risk factors and later cognitive decline. J Stroke Cerebrovasc Dis 22: , 1361–1369. |
[62] | Wakabayashi T , Yamaguchi K , Matsui K , Sano T , Kubota T , Hashimoto T , Mano A , Yamada K , Matsuo Y , Kubota N , Kadowaki T , Iwatsubo T ((2019) ) Differential effects of diet- and genetically-induced brain insulin resistance on amyloid pathology in a mouse model of Alzheimer’s disease. Mol Neurodegener 14: , 15. |
[63] | Morris JC , Roe CM , Xiong C , Fagan AM , Goate AM , Holtzman DM , Mintun MA ((2010) ) APOE predicts amyloid-beta but not tau Alzheimer pathology in cognitively normal aging. Ann Neurol 67: , 122–131. |
[64] | Willette AA , Modanlo N , Kapogiannis D ((2015) ) Insulin resistance predicts medial temporal hypermetabolism in mild cognitive impairment conversion to Alzheimer disease. Diabetes 64: , 1933–1940. |
[65] | Skeberdis VA , Lan J , Zheng X , Zukin RS , Bennett MV ((2001) ) Insulin promotes rapid delivery of N-methyl-D- aspartate receptors to the cell surface by exocytosis. Proc Natl Acad Sci U S A 98: , 3561–3566. |
[66] | Craft S , Asthana S , Schellenberg G , Baker L , Cherrier M , Boyt AA , Martins RN , Raskind M , Peskind E , Plymate S ((2000) ) Insulin effects on glucose metabolism, memory, and plasma amyloid precursor protein in Alzheimer’s disease differ according to apolipoprotein-E genotype. Ann N Y Acad Sci 903: , 222–228. |


