
Language Network Connectivity Increases in Early Alzheimer’s Disease
Abstract
Background:
Language production deficits occur early in the course of Alzheimer’s disease (AD); however, only a few studies have focused on language network’s functional connectivity in mild cognitive impairment (MCI) due to AD.
Objective:
The current study aims to uncover the extent of language alteration at the MCI stage, at a behavioral and neural level, using univariate and multivariate analyses of structural MRI and resting-state fMRI.
Methods:
Twenty-four MCI due to AD participants and 24 matched healthy controls underwent a comprehensive language evaluation, a structural T1-3D MRI, and resting-state fMRI. We performed seed-based analyses, using the left inferior frontal gyrus and left posterior temporal gyrus as seeds. Then, we analyzed connectivity between executive control networks and language network in each group. Finally, we used multivariate pattern analyses to test whether the two groups could be distinguished based on the pattern of atrophy within the language network; within the executive control networks, as well as the pattern of functional connectivity within the language network and within the executive control networks.
Results:
MCI due to AD participants had language impairment during standardized language tasks and connected-speech production. Regarding functional connectivity, univariate analyses were not able to discriminate participants, while multivariate pattern analyses could significantly predict participants’ group. Language network’s functional connectivity could discriminate MCI due to AD participants better than executive control networks. Most notably, they revealed an increased connectivity at the MCI stage, positively correlated with language performance.
Conclusion:
Multivariate analyses represent a useful tool for investigating the functional and structural (re-)organization of the neural bases of language.
INTRODUCTION
Language production deficits occur early in the course of Alzheimer’s disease (AD). Most studies have shown impairment in fluency tasks and confrontation naming tasks [1], usually attributed to lexical-semantic impairment [2]. These tasks have also been shown to accurately discriminate mild cognitive impairment (MCI) patients from healthy controls [1, 3]. Fewer studies have analyzed other language processes. Some studies have shown preserved syntactic abilities in early AD [1], while others did not find such preservations [4]. Most studies have stressed the fact that phonological capacities are relatively preserved in early AD [1]. More and more studies have been focusing on connected speech production in AD, for the assessment of the functional use of language and cognition. They revealed several impairments in AD: reduced lexical content [5], increased word-finding difficulty and use of repetitions and self-corrections [6], etc. While most studies focused on AD at a dementia stage, other studies revealed changes as early as the MCI stage. Some authors [3] demonstrated that MCI due to AD patients had lower lexical richness compared to healthy controls, but similar production of filled pauses (e.g., “hm”). Others [7] also showed that these patients produced more modalizing discourse, which refers to “discourse about discourse” (i.e., comments, feelings and uncertainty about the task).
Neuroimaging studies in AD patients have shown that language impairments are associated with atrophy or hypometabolism in the left inferior frontal gyrus (IFG) and temporal regions [8]. However, besides the alteration of isolated brain regions, the functional connectivity within brain networks can underlie the cognitive impairments or compensations observed. Resting-state functional connectivity is one of the current methods that allows to investigate functional brain networks, including the language network [9, 10]. In AD, only few studies focused on this network, reporting lower functional connectivity in AD compared to healthy controls (Weiler and colleagues [11], patients’ mean MMSE: 18.86; Mascali and colleagues [12], patients’ mean MMSE: 20.5; Montembeault and colleagues [13], patients’ mean MMSE: 24.9). These studies used the left IFG [12, 13] or left posterior temporal gyrus [11–13] as seeds. They also showed that connectivity changes were only marginally correlated with AD participants’ language performance (i.e., no significant correlations in Mascali et al., 2018 [12], no correlations with IFG’s connectivity map in Montembeault et al., 2019 [13]). However, it is possible that some changes remain unnoticed when focusing exclusively on the language network. For example, we now know that, in healthy aging, the language network interacts with the executive control network/attentional network to maintain a sufficient level of language performance [14, 15]. It is therefore possible that MCI due to AD is primarily characterized by a loss of this compensation, rather than an alteration within the language network.
Second, univariate fMRI analyses may not be able to uncover the extent of changes occurring at the MCI stage. Indeed, analysis of structural or functional MRI data is traditionally performed in a univariate manner, where each voxel or area in the brain is separately tested for a condition of interest. By contrast, multivariate pattern analyses (MVPA) simultaneously consider patterns of information (i.e., atrophy or BOLD signal), leveraging the multivariate, i.e., multi-voxel, and distributed nature of neural representations [16]. In other words, while univariate analyses ask to what degree each voxel’s activity is affected by a particular condition, MVPA examines whether, by contrast, an experimental manipulation or a clinical population can be predicted based on the pattern of activity across a set of voxels. Using multivariate patterns of activity, i.e., activity across multiple voxels, can increase sensitivity in differentiating between individuals or conditions [16] (but see Hebart & Baker [17] for a discussion on the benefits and pitfalls of MVPA as compared with classical univariate analyses). Regarding Alzheimer’s disease, some authors [18] applied MVPA to investigate the topologic alterations of resting-state functional connectivity in participants with subjective cognitive decline, MCI and AD compared with healthy individuals. They showed that by using MVPA, it was possible to predict whether a participant belonged to one of the three clinical groups or to the healthy control group, which indicated that patterns of resting-state data are already discriminant for cognitive decline and MCI due to AD. Further work is required to understand how these changes relate to patients’ cognitive impairment.
In the current study, we focus on language processing to uncover the extent of language alteration in MCI due to AD at behavioral and neural levels, using univariate and multivariate analyses of structural MRI and resting-state fMRI. Additionally, we will examine whether neural changes are correlated with language performance, using both standardized and connected speech tasks. Regarding language performance, we expect behavioral inter-group differences for both the standardized language tasks and discourse task, in line with current literature on MCI due to AD. Regarding functional connectivity, we will first analyze language networks using the same method as previous literature on AD, and the same two seeds: left IFG and left posterior temporal gyrus. We anticipate marginal inter-group differences with this analysis. We will then analyze connectivity between executive control networks and language network, to test whether MCI due to AD induced a loss of the compensation observed in typical aging [10, 15]. We expect lower between-network connectivity in MCI due to AD participants, correlated with lower language performance. Finally, we will use MVPA to test whether it is possible to distinguish the two groups based on 1) the pattern of atrophy within the language network, 2) atrophy within the executive control networks, as well as 3) the pattern of functional connectivity within the language network and 4) functional connectivity within executive control networks (using atlases from Shirer et al. [19]). Based on previous studies showing that functional connectivity is affected in MCI due to AD, we predict that functional information will allow to discriminate MCI due to AD participants from healthy controls using MVPA. We also hypothesize that functional changes within both language and executive control networks will be related to language performance. In particular, we will test correlations with language tasks that rely on the speech production network (seed LIFG) and speech perception network (seed LSTG) based on current literature on language functional networks [20]. Regarding classifications based on atrophy patterns, no study, to the best of our knowledge, focused on language network’s atrophy in MCI due to AD. Nonetheless, we predict that this information will distinguish MCI due to AD participants from healthy controls, but will not be correlated with participants’ language performance, similarly to healthy aging [15].
MATERIAL AND METHODS
Participants
Participants’ recruitment followed the same procedure as the one described in Pistono et al., 2019; 2021 [15, 21]. Participants were right-handed and native French speakers. In order to avoid possible reorganization of the language network due to multilingualism, we only included speakers that did not have a good command and/or a frequent use of a language other than French. All the participants provided written, informed consent before participating in the study and received monetary compensation for their participation. The current study was approved by the ethics committee (IDRCB: 2015-A01416–43).
MCI due to AD participants were selected if they presented with a memory complaint and had no concomitant history of neurological or psychiatric disease other than AD. They underwent the following pre-inclusion assessment:
- Autonomy in daily living (Instrumental Activities of Daily Living (IADL) [22]) and Clinical Dementia Rating (CDR) [23]);
- Global cognition (Mini-Mental State Evaluation (MMSE) [24]);
- Anterograde verbal memory (Free and Cued Selective Reminding Test (FCSRT [25]).
- Amyloid assessment with cerebrospinal fluid (CSF) analysis by lumbar puncture: CSF biomarker levels of total tau (T-Tau), phospho-tau (P-Tau), Aβ42 and Aβ40 were measured using an ELISA method (Innogenetics, Ghent, Belgium). Innotest Amyloid Tau Index (IATI) was calculated. P-Tau≥60 pg/ml and IATI≤0.8 were deemed to be suggestive of AD. In case of an ambiguous profile (P-Tau < 60 pg/ml or IATI > 0.8), we calculated the Aβ42/Aβ40 ratio and a score < 0.045 was considered to be compatible with a diagnosis of AD.
Individuals with typical AD were included at the MCI stage, which corresponds to the following criteria: MMSE≥24; CDR≤0.5, and based on the IWG-2 criteria [26]: evidence of a gradual and progressive change in memory function reported by patient or informant for more than 6 months and demonstrated by an episodic memory test, and CSF evidence of AD.
Healthy control participants underwent the same pre-inclusion neuropsychological assessment as the MCI due to AD group. They were included if they had no memory complaint and no history of neurological or psychiatric disease and a MMSE≥27. They were excluded if they presented with cognitive impairment (test scores < –1.5 SDs) during the pre- or post-inclusion neuropsychological assessment.
Twenty-four MCI due to AD participants and 24 healthy controls (HC) were recruited. Both groups were matched for age (MCI due to AD: 72.9±8 years old; HC: 70±4 years old, p = 0.09), gender (MCI due to AD: 13 women; HC: 11 women) and level of education (years of education, MCI due to AD: 12.5±4; HC: 12.4±4, p = 0.9).
Cognitive evaluation
Neuropsychological assessment
All participants also underwent a comprehensive neuropsychological assessment, executed by trained neuropsychologists. Visual recognition memory was assessed with the Doors and People test [27]. Short-term memory and working memory were evaluated with the WAIS-III Digit Span and Backward Digit Span subtest [28]. Cognitive flexibility was assessed with the Trail Making Test, TMT [29]). Praxis was explored with Mahieux’s assessment [30] and gnosis with the Visual Gnosis Evaluation Protocol (VGEP [31]). Apathy and depression were also measured, using the Starkstein scale [32] and the Beck Depression Inventory [33].
Language assessment
Language was assessed with the GREMOTs assessment [34]. GREMOTs is a computerized battery of language tests that evaluates both oral and written language as well as production and comprehension at different levels (i.e., phonological processing, lexical processing and syntactic processing).
This battery includes a connected-speech task, which we analyzed more specifically. With regards to the procedure for this task, the participants were given the same instructions: “This is a story depicted in 5 pictures. Tell me the story with as many details as possible.” During the task, the experimenter remained neutral and avoided speaking in order to ensure uniform conditions for discourse production. The oral productions of participants were recorded and manually and orthographically transcribed. The following variables were used to analyze the discourse of both the MCI due to AD group and healthy controls:
- Total number of words in the narrative;
- Lexical content [21]: proportion of closed class and open class words (i.e. nouns, most verbs, adjectives, numerals and adverbs of manner). Standardized indexes were calculated according to the following formula: (Open class –Closed class)/(Open class + Closed class);
- Proportion of self-corrections: number of self-corrections normalized per 100 words (e.g., when the speaker stops and resumes with a substitution for a word or a new utterance);
- Proportion of repetitions: number of repetitions (of sounds, syllables, words or partial phrases) normalized per 100 words;
- Proportion of filled pauses: number of filled pauses (e.g., “hm,” “um,” “pff”) normalized per 100 words;
- Proportion of modalizing discourse: number of words that are part of a modalizing utterance, normalized per 100 words (e.g., “It seems that”; “I don’t know how to say it”; etc.).
Intergroup comparisons for the neuropsychological assessment and the language assessment were performed using Student’s t-test for independent samples. Bonferroni-Holm corrections for multiple comparisons were applied.
Structural and functional MRI
MRI acquisition, preprocessing, and univariate analyses follow the same methods as the ones described in Pistono et al., 2021 [15], since it is part of the same project.
MRI acquisition
MRI scans were performed for all participants using a 3-T imager (Philips Achieva dStream, Inserm/UPS UMR1214 ToNIC Technical Platform, Toulouse, France). A 3D-T1 image was acquired for anatomical reference with the following parameters: TR = 8 ms, TE = 3.7 ms, flip angle = 8°, matrix size = 256×256 mm, 170 slices, voxel size (in mm) = 0.9×0.9×1. Whole-brain resting-state fMRI images were obtained with the following parameters: TR = 2837 ms, TE = 40 ms, flip angle = 90° 46 interleaved acquisition, slice thickness = 3 mm, matrix size = 80×80 mm, 200 volumes, total scan time 10 min. During scanning, participants were instructed to keep their eyes closed but to stay awake and avoid thinking of anything in particular. All participants affirmed that they were fully awake during the 10 min of the scanning.
Preprocessing
The data were analyzed using the Conn toolbox (Version 18b [35]), implemented in MATLAB. The preprocessing pipeline of the functional images included: functional realignment and unwarp, slice-timing correction, outlier identification, normalization to the MNI template, and smoothing with a Gaussian kernel of 6 mm. This step created a scrubbing covariate (containing the potential outliers scans for each participant) and a realignment covariate (containing the six head motion parameters). Average head motion (t(46) = 0.97, p = 0.17) and maximum head motion (t(46) = 1.16, p = 0.13) did not significantly differ between the two groups. Then, the six head motion parameters plus their associated first-order derivatives, the identified outliers scans, white matter and cerebrospinal fluid signals and the effect of rest were removed by means of the CompCor method. The resulting preprocessed images were band-pass filtered (0.01 Hz–0.1 Hz) to remove physiological high- and low-frequency noise (e.g., cardiac and respiratory fluctuations).
Atlases
Language and executive control ROIs were selected from Shirer’s atlas [19]. The language network includes 7 ROIs within the left IFG, right IFG, left middle temporal gyrus, left middle/angular gyrus, left middle/superior/supramarginal gyrus, right middle/superior/ supramarginal gyrus, left thalamus and left cerebellum. Following Shirer’s parcellation, we used two executive control networks (ECN): a left ECN and right ECN. The left ECN includes 6 ROIs within the left middle frontal/superior frontal gyrus, left IFG/orbitofrontal gyrus, left superior/inferior parietal/precuneus/angular gyrus, right cerebellum and left thalamus. The right ECN includes 6 ROIs as well: the right middle frontal/superior frontal gyrus, right middle frontal gyrus, right superior frontal gyrus, right inferior parietal/supramarginal/angular gyrus, left cerebellum and right caudate.
For each ROI we used individual participants’ gray matter masks estimated from the T1 segmentation to restrict the analyses to voxels located in the gray matter.
Voxel based morphometry (VBM)
Gray matter density was assessed using a voxel-based morphometry method on Statistical Parametric Mapping version 12 (SPM 12, Wellcome Trust Centre for Neuroimaging). For each participant, the 3D-T1 sequence was segmented to isolate gray matter and white matter partitions, modulated for deformation, normalized to the MNI space and smoothed (8×8×8 mm). Inter-group comparison on gray matter density was then performed (two-sample t-test, voxel level p < 0.05, FWE-corrected, cluster = 50 voxels).
Seed-based analyses
The left Inferior frontal gyrus (LIFG) and the left posterior temporal gyrus (LSTG, including parts of the left middle/superior/supramarginal gyrus) were used as seeds, based on Shirer’s functional atlas of language. Correlation maps were constructed by correlating the average BOLD-signal dynamic of the region of interest with the BOLD-signal of every other single voxel belonging to an estimated gray matter mask derived from the T1 segmentation. To enforce a Gaussian distribution of the correlation data, Pearson’s correlation coefficients were then transformed to z-scores using the Fisher r to z transformation for subsequent t-tests. These individual z values maps were entered into a one-sample t-test to determine the functional network correlated with spontaneous activity of the seed region within each group (p < 0.05 FWE at the cluster level). We then performed two-sample t-tests to detect inter-group differences. The threshold for second-level maps was set at p < 0.05 FWE at the cluster level.
Within- and between-network connectivity
Within- and between-network connectivity (average for all the ROIs within each network) was evaluated for each participant. More precisely, within-network connectivity is a mean composite network connectivity estimate, calculated by means of pairwise correlations between all the regions comprising an individual network. Between-network connectivity is the result of pairwise correlations between the regions in each pair of different networks. Averages of within- and between-network connectivity were compared between groups with one-tailed t-tests to assess whether healthy controls present greater within- and between-network connectivity than MCI due to AD participants.
Multivariate pattern analyses (MVPA)
To investigate whether the two groups could be identified based on the pattern of atrophy or connectivity within the language network and the ECN, we performed multivariate pattern classification.
Supervised classification analyses, performed using a classifier algorithm, consist in training a classifier to distinguish two or more classes of data (e.g., class 1: healthy controls (HC), class 2: MCI due to AD participants (AD)) from a set of training samples by providing the corresponding labels of each sample, e.g., “HC” or “AD.”. Following this training phase, the classifier is then tested on a test dataset composed of samples not used during the training phase, in order to assess whether the classifier is able to generalize to new unseen data. If the classifier is able to predict the class of novel samples in the test dataset, i.e., accurate prediction, it indicates that the multivariate pattern of information is informative about the classes of interest. To ensure unbiased evaluation of classification performance, this procedure is repeated over multiple independent divisions of the entire dataset into training and test datasets, i.e., cross-validation. The accuracy of classifier predictions, i.e., 0 for incorrect and 1 for correct, are then averaged across cross-validation folds to obtain a classification score between 0 and 1 (or 0%and 100%) that can be compared to chance level. For our analyses, there was always 2 classes, corresponding to the HC or AD groups, therefore chance level was 1/2 = 50%.
Features selection
Classifiers are sensitive to the ratio between the number of variables, e.g., voxels, and number of samples, i.e., the different data samples provided, which can cause overfitting and/or poor classification accuracy [36]. One method to prevent this is to perform the analysis on specific ROIs based on anatomical or functional data [37]. Doing so decreases the number of voxels used by the classifier and focuses on appropriate regions that allow for best discrimination. We therefore extracted ROIs from the Shirer’s atlas [19] of language network (7 ROIs), left ECN (6 ROIs), and right ECN (6 ROIs) to perform 6 classifications: gray matter density within areas of each of these three networks, as well as functional connectivity between areas of each of these three networks. We extracted the average gray matter density values of each ROI, for each participant. We therefore obtained 7 values per participant for the language network, 6 values for the left ECN and 6 values for the right ECN. We also extracted individual connectivity values between each ROI of the networks under study using the Conn toolbox. This yielded 21 values for the language network, and 15 values for the left ECN and right ECN.
Classification procedure
We used a linear discriminant analysis (LDA) classifier implemented in the Scikit-learn toolbox [38]. More precisely, we trained the LDA classifier to distinguish the two classes of data, i.e., “HC” versus “AD”. The classification was performed in a leave-one-out cross-validation approach. In each cross-validation fold, the classifier was trained on data from all but one participant from each class and used on the left-out participants to predict their class membership. This procedure was repeated until each trial’s class had been used as a test.
Permutation test
To evaluate the significance of classification accuracies, for each analysis, we computed permutation tests. In order to estimate the null distribution of classification accuracy, we randomly permuted the labels of all samples (i.e., HC or AD) and performed the classification analysis 100,000 times, yielding 100,000 surrogate classification accuracies under the null hypothesis that the two classes are completely interchangeable. From these surrogate distributions, we computed the probability of observing a certain classification accuracy, i.e., p-value.
Feature contribution
For each classification, we extracted each feature contribution by using a method that allows an “informativity” measure to be extracted from classifier weights [39]. Indeed, classifier weights cannot be interpreted, as they reflect both noise and signal in the data; we thus used this approach to evaluate the extent to which a certain feature was informative in performing the classification. For each classification, the contribution value of each feature was calculated. Furthermore, a null distribution of each feature’s contribution was computed using the permutation procedure described above to estimate the significance of the contribution values.
Correlations between functional connectivity and language performance
For the different functional analyses, significant inter-group differences were further examined through intra-group correlations. To do so, we selected variables to link functional results to linguistic theories [20]. Phonemic fluency and sentence production scores were chosen to test correlations with the speech production network (i.e., functional connectivity with the LIFG). Word repetition, non-words repetition, object naming, and action naming tasks were chosen to test correlations with the speech perception network (i.e., functional connectivity with the LSTG, that also contributes to higher level lexical processes [20]). We also tested correlations with the narrative task (lexical content, modalizing discourse, self-corrections). We performed Kendall correlations and then applied Bonferroni-Holm corrections.
RESULTS
Population
Neuropsychological assessment
During the pre-inclusion assessment, MCI due to AD participants had a lower MMSE (MCI due to AD group: 25.5±2.6 - [range: 24–30]; HC group: 29±1 - [range: 27–30], p < 0.0001) and lower performance during the FCSRT than the control group (sum three free recalls MCI due to AD group: 14.17±9.69; HC group: 32.29±4.79, p < 0.0001; sum three cued recalls MCI due to AD group: 30.33±12; HC group: 46.42±1.93, p < 0.0001).
During the post-inclusion neuropsychological assessment, MCI due to AD participants’ performance on the Doors and People test, digit span forward and Trail Making Test was also lower than that of the control group, as shown in Table 1.
Table 1
Performance during the neuropsychological assessment. Results represent mean±SD. Results that are significant after Bonferroni-Holm correction are in bold. Cohen’s d values were measured for these variables only
| Healthy Controls | MCI due to AD participants | p | Cohen’s d | |
| Doors and People test, set A | 10.78±1.38 | 8.00±2.55 | < 0.0001 | 1.36 |
| Digit span forward | 6.00±1.00 | 5.21±0.98 | 0.009 | 0.80 |
| Digit span backward | 4.83±1.40 | 4.04±0.91 | 0.027 | - |
| Trail Making Test, A | 38.79±12.50 | 51±16.41 | 0.006 | 0.83 |
| Trail Making Test, B-A | 55.13±27.86 | 114.22±81.83 | 0.002 | 0.97 |
| VGEP | 35.26±1.10 | 33.79±2.87 | 0.026 | - |
| Beck | 2.58±2.21 | 3.29±3.28 | 0.384 | - |
| Starkstein | 9.50±4.19 | 11.78±4.60 | 0.082 | - |
Brain atrophy
MCI due to AD participants had significant atrophy in two clusters compared to the control group (see Supplementary Material), with one cluster encompassing the left hippocampus, parahippocampus and thalamus (K voxels = 3278; t = 7.28; pFWE-corr < 0.0), and one cluster involving the contralateral areas (K voxels = 1076; t = 7.40; pFWE-corr < 0.05).
Language evaluation
Standardized assessment
MCI due to AD participants had lower performance during several lexical tasks, as well as syntactic tasks. Results are detailed in Table 2.
Table 2
Performance during the language assessment. Results represent mean±SD. Results that are significant after Bonferroni-Holm correction are in bold. Cohen’s d values were measured for these variables only
| Healthy Controls | MCI due to AD participants | p | Cohen’s d | ||
| Lexical processing | Repetition, words (/10) | 9.38±1.01 | 9.17±1.05 | 0.488 | - |
| Grammatical fluency (category: verbs) | 35.21±11.66 | 27.08±11.23 | 0.018 | - | |
| Semantic fluency (category: fruits) | 19.33±3.38 | 15.04±6.03 | 0.004 | - | |
| Phonemic fluency (letter V) | 17.29±6.12 | 17±8.01 | 0.888 | - | |
| Object naming (/36) | 34.7±1.40 | 32.63±1.91 | < 0.0001 | 1.23 | |
| Action naming (/36) | 33.13±3.25 | 31.13±2.8 | 0.028 | - | |
| Famous face naming (/10) | 8.75±1.15 | 4.83±2.78 | < 0.0001 | 1.84 | |
| Reading, words (/30) | 29.71±.55 | 29.33±.92 | 0.092 | - | |
| Spelling, words (/12) | 11.58±.504 | 10.04±1.33 | < 0.001 | 1.53 | |
| Oral semantic verification (/18) | 17.04±1.27 | 15.96±1.6À | 0.013 | - | |
| Written semantic verification (/18) | 16.3±1.69 | 14±2.21 | < 0.001 | 1.17 | |
| Syntactic processing | Repetition, sentences (/4) | 3.46±.78 | 3.42±.65 | 0.842 | - |
| Order execution (/6) | 5.96±.20 | 5.79±.42 | 0.084 | - | |
| Sentence production (/6) | 5.75±.68 | 5.25±.94 | 0.040 | - | |
| Syntactic comprehension (/24) | 21.25±2.51 | 18.92±3.62 | 0.013 | - | |
| Spelling, sentence (/27) | 25.83±1.05 | 24.25±1.98 | 0.001 | 1.00 | |
| Text comprehension (time in seconds) | 49.3±15.73 | 80.88±30.51 | < 0.0001 | 1.30 | |
| Phonological processing | Repetitions, non-words (/6) | 5.54±.66 | 5.08±.93 | 0.055 | - |
| Reading, non-words (/15) | 14.67±.64 | 13.79±1.06 | 0.001 | 1.00 | |
| Spelling, non-words (/6) | 5.50±.59 | 4.96±1.04 | 0.032 | - |
Connected-speech production
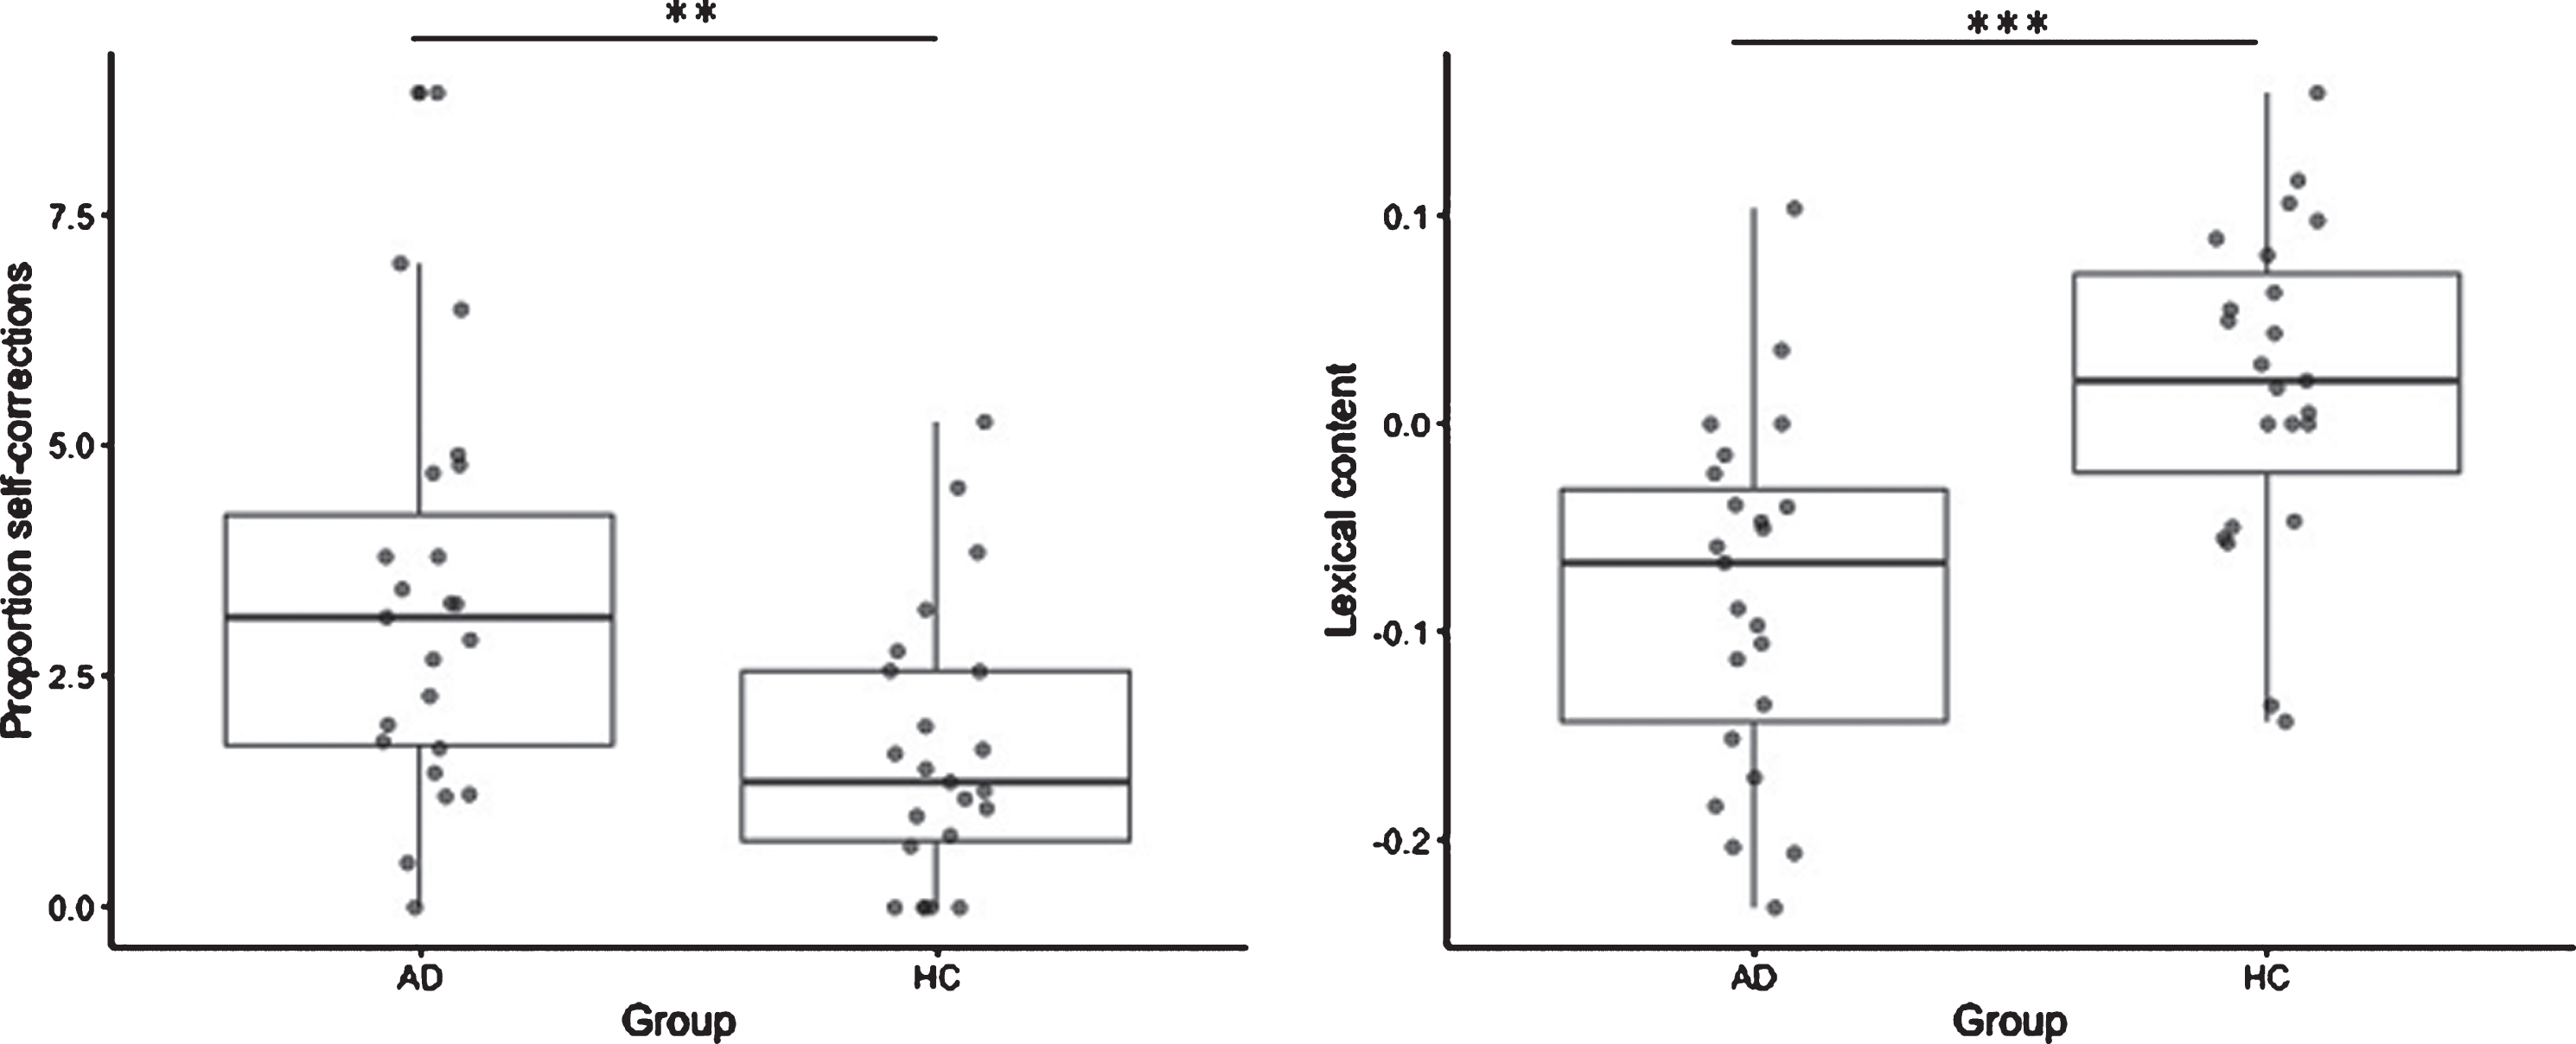
The MCI due to AD group did not produce shorter narratives compared to healthy controls (number of words MCI due to AD group: 172±112; HC group: 146±84, p = 0.4). However, they produced significantly more self-corrections (MCI due to AD group: 3.3±2.1; HC group: 1.7±1.5, p = 0.006, Fig. 1) and more modalizing discourse (MCI due to AD group: 12.1±11.5; HC group: 3.7±7.5, p = 0.005) while performing this task. Their lexical content was also lower than the control group (MCI due to AD group: –0.82±0.8; HC group: 0.19±0.8, p = 0.0001, Fig. 1). On the contrary, the two groups produced the same proportion of repetitions (MCI due to AD group: 1.9±1.9; HC group: 1.2±0.9, p = 0.1) and filled pauses (MCI due to AD group: 4.1±2.8; HC group: 3.5±2.9, p = 0.5).
Fig. 1
Inter-group comparisons for self-corrections (left) and lexical content (right) between MCI due to AD participants (AD) and Healthy Control group (HC). **p < 0.01; ***p < 0.001.
Seed-based analyses
Inferior frontal gyrus
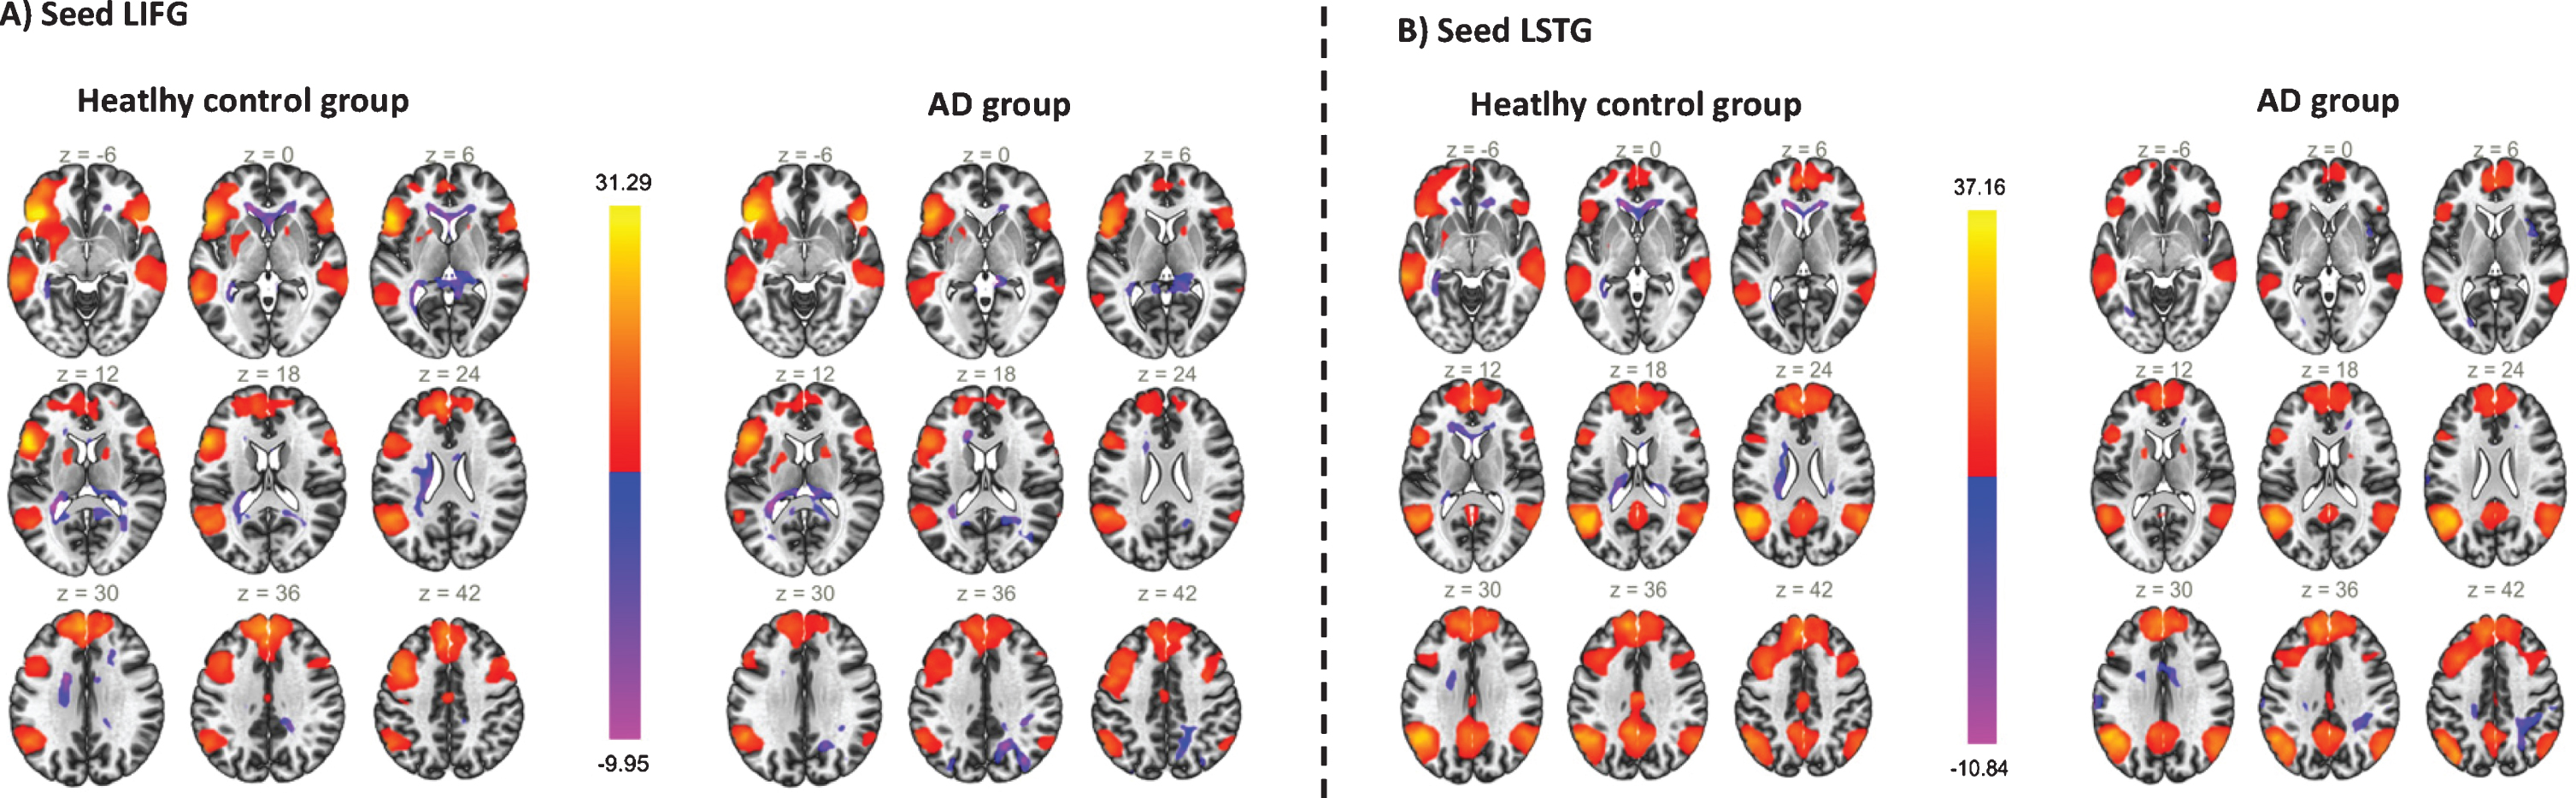
At a group level, connectivity maps show that both groups have extended maps of fronto-temporal areas connected with the LIFG (Fig. 2). They did not reveal any inter-group differences (threshold for second level maps p < 0.05 FWE at the cluster level). As a consequence, we did not perform further correlation analyses. Regions positively and negatively correlated with the LIFG in each group are detailed in the Supplementary Material.
Fig. 2
Cluster map for A) LIFG and B) LSTG in healthy controls and MCI due to AD participants. Yellow to red color for clusters positively correlated to LIGF activity; blue to pink color for clusters negatively correlated to LIFG activity.
Posterior temporal gyrus
Similar to the previous seed-based analysis, both groups had extended map areas connected with the LSTG (Fig. 2). Two sample t-tests did not reveal any inter-group differences (threshold for second level maps p < 0.05 FWE at the cluster level), correlation analyses were therefore not performed. Regions positively and negatively correlated with the LIFG in each group are detailed in the Supplementary Material.
Within- and between-network connectivity
The average connectivity within the language network (t(46) = 1.12, p = 0.13), within the Left ECN (t(46) = 1.35, p = 0.09) and within the right ECN (t(46) = –0.77, p = 0.78) were not lower in the MCI due to AD group compared to the HC group.
Additionally, the strength of connectivity between the language network and the left ECN (t(46) = 1., p = 0.46) or between the language network and the right ECN (t(46) = 0.53, p = 0.3) was not lower in the MCI due to AD group.
Multivariate pattern analyses (MVPA)
Language network
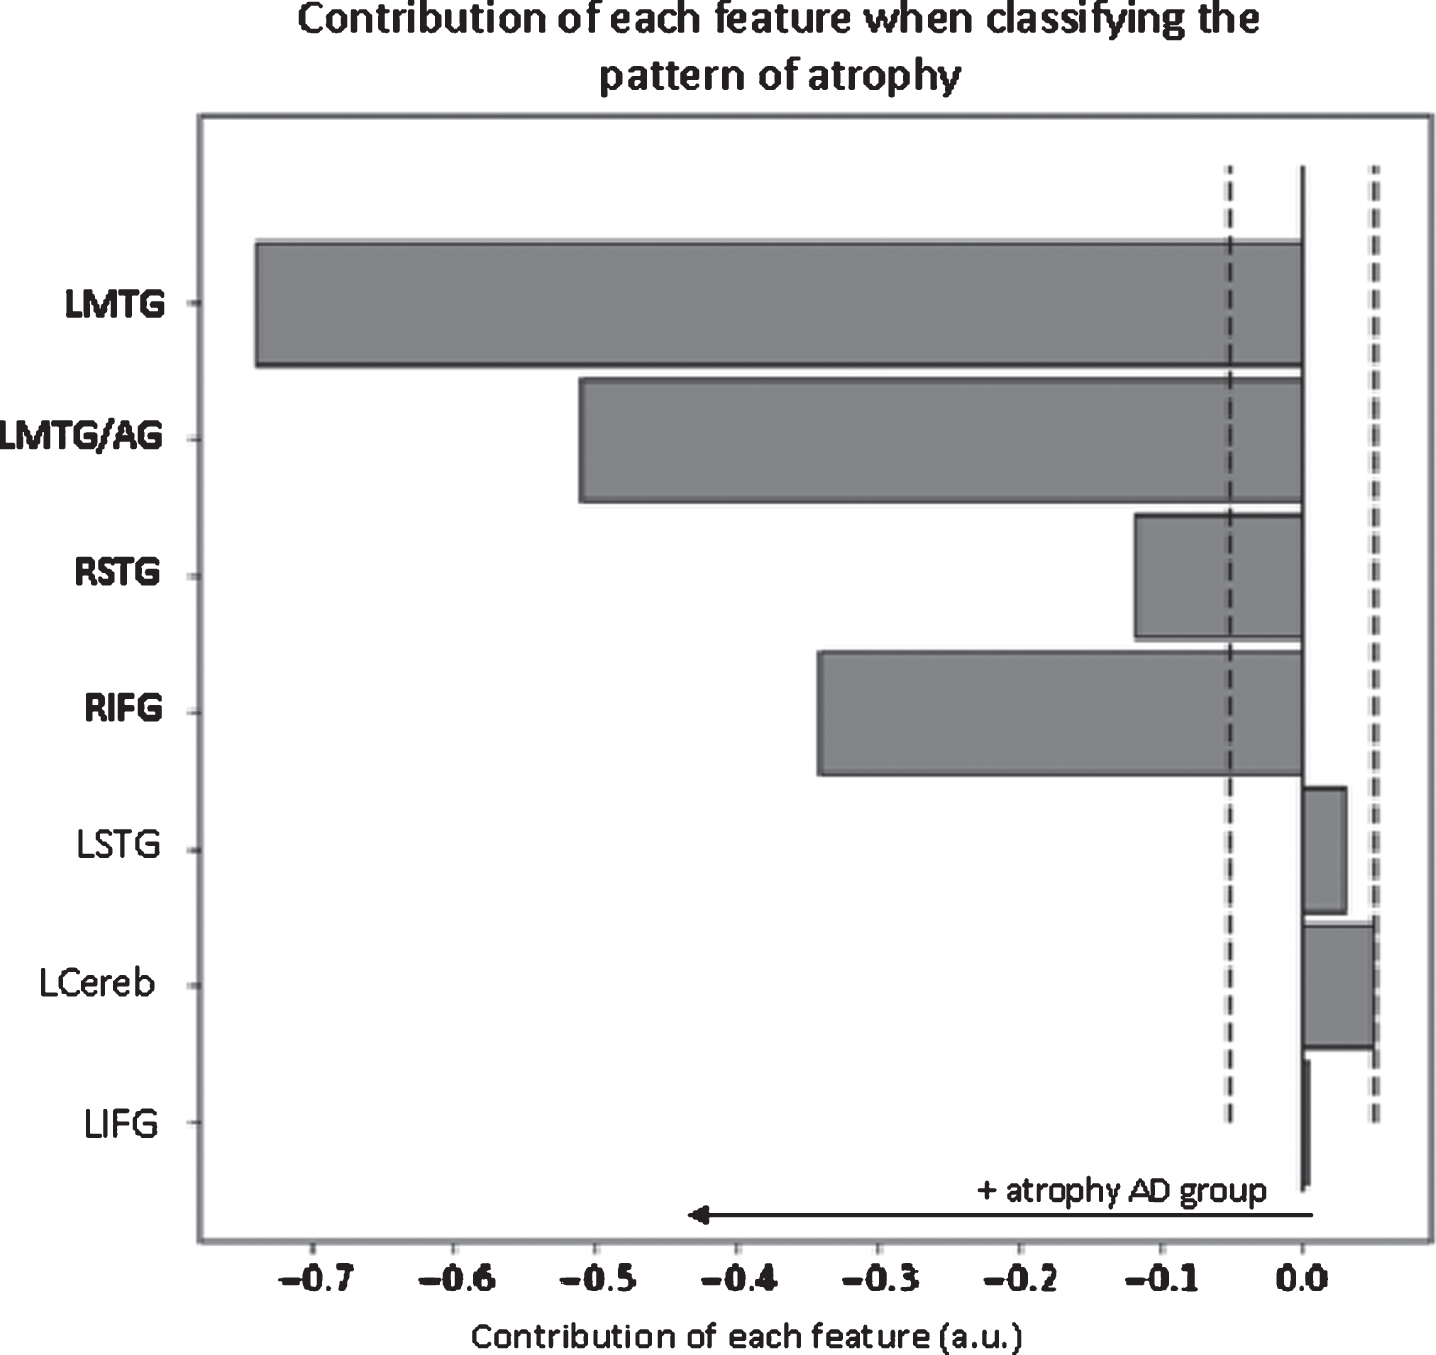
Classification analysis based on language network’s grey matter density yielded an accuracy of 95.8%. The permutation tests indicated that this classification was highly significant (p < 0.0001). Furthermore, it indicated that the discriminative regions included the right inferior frontal gyrus, the right superior temporal gyrus, the left middle temporal gyrus and the left middle temporal gyrus/angular gyrus (Fig. 3).
Fig. 3
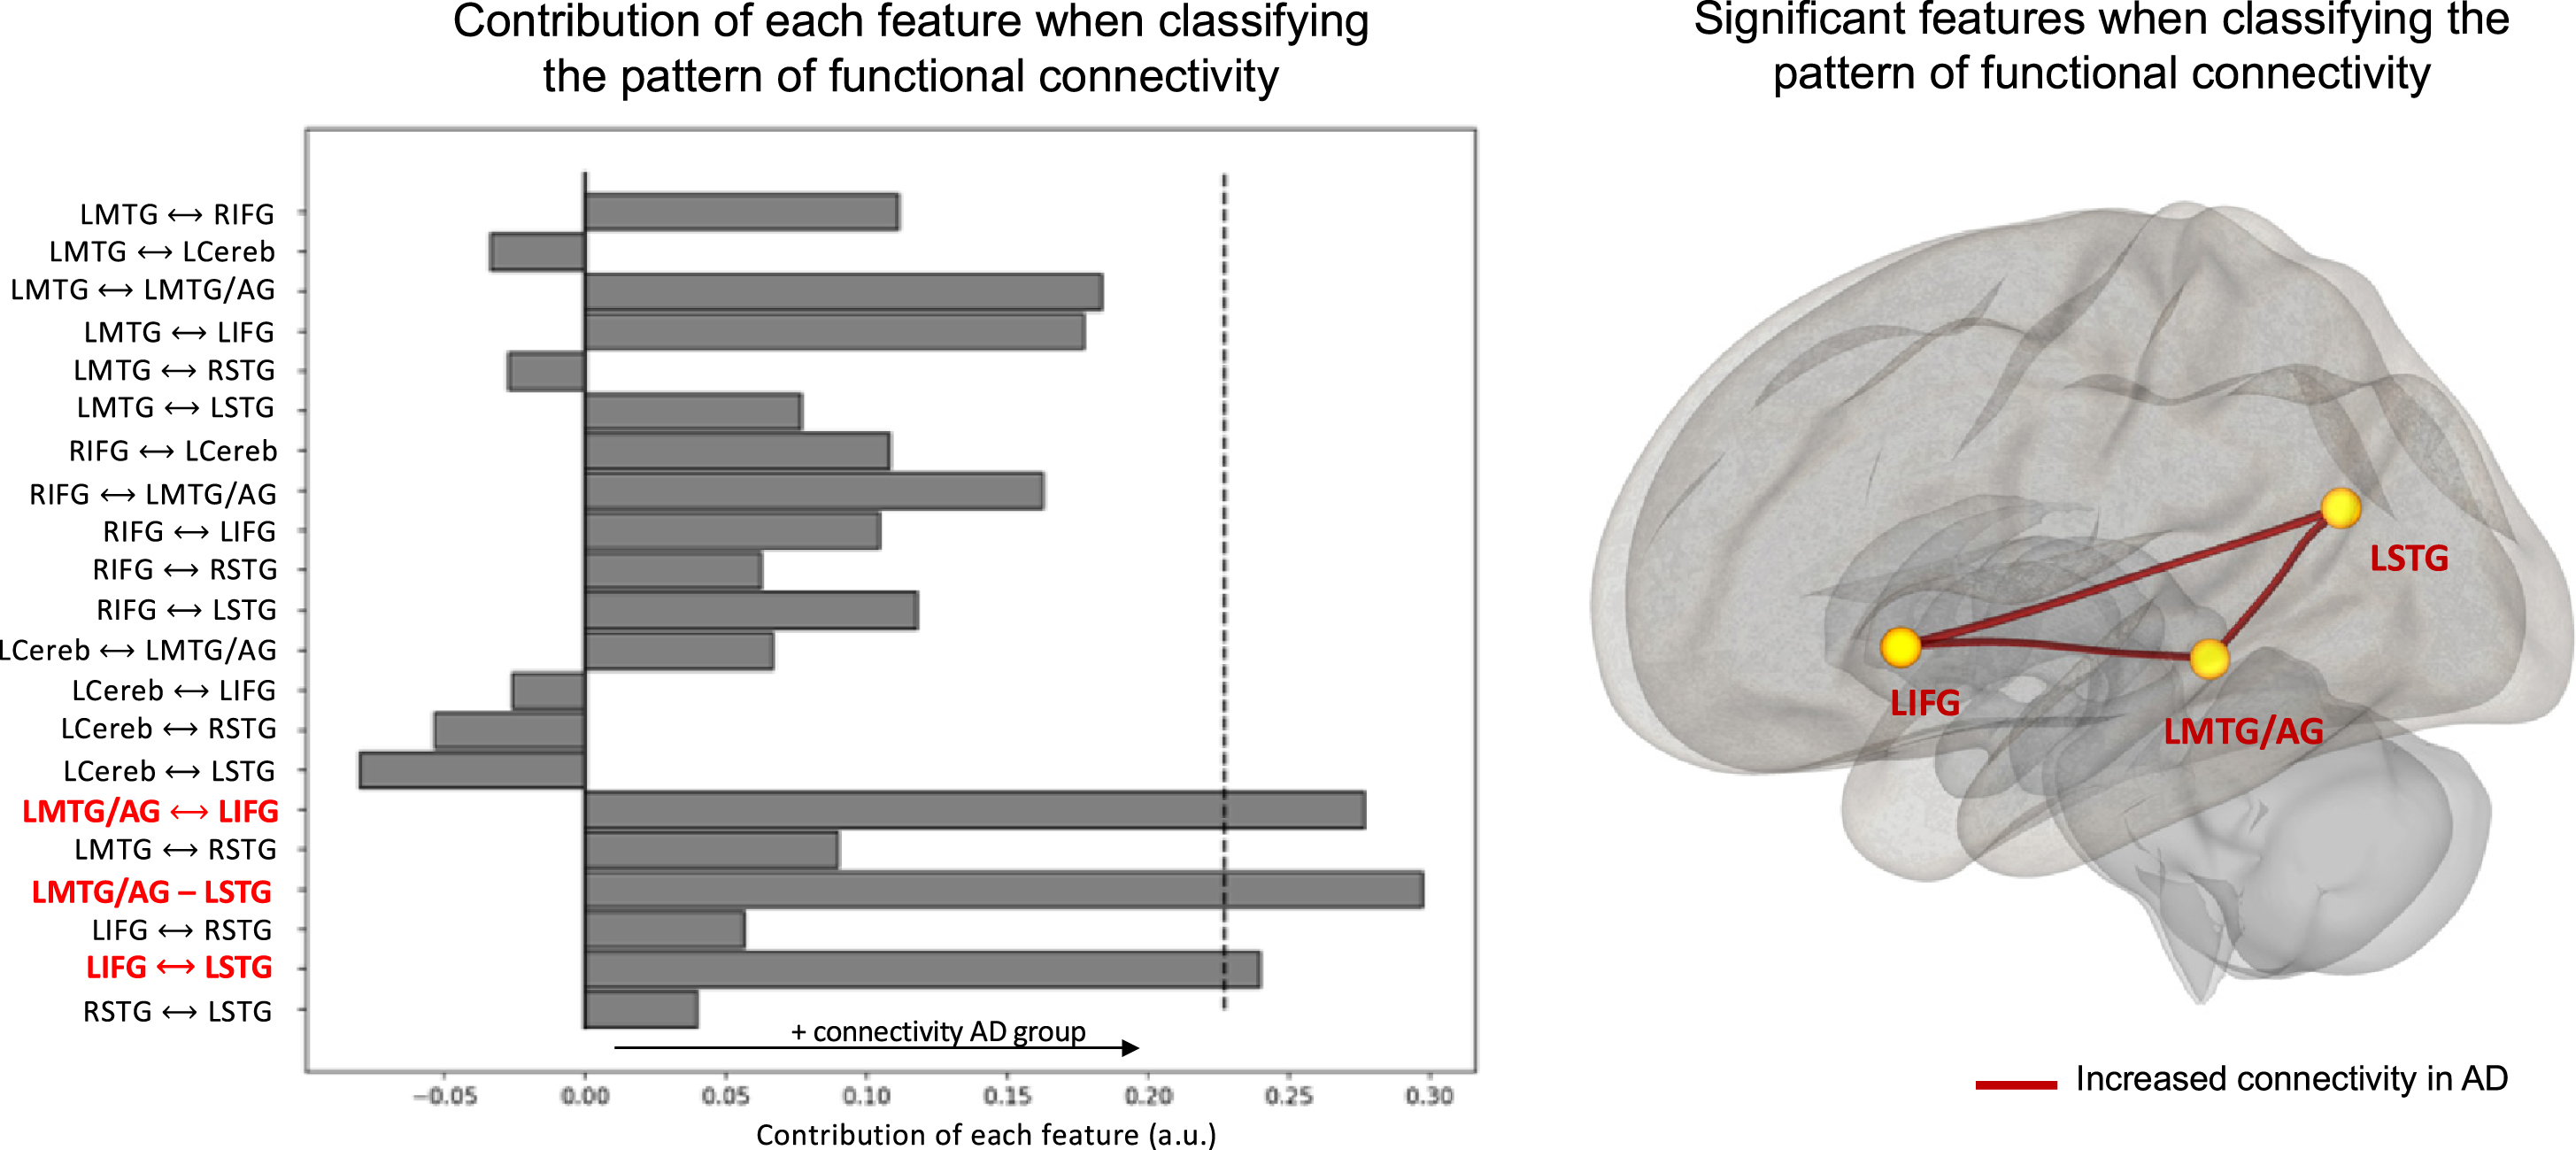
Contribution of each feature when classifying the pattern of functional connectivity within the language network. The dashed lines represent the threshold for significance (p < 0.05) obtained through permutations. Significant features are indicated in bold red on the y-axis. Only the main area of each ROI is displayed on the y-axis. LMTG, left middle temporal gyrus; LMTG/AG, left middle temporal/angular gyrus; LSTG, left middle/superior/supramarginal gyrus; RSTG, right middle/superior/ supramarginal gyrus; LCereb, left cerebellum.
Regarding functional connectivity within the language network, the classification analysis yielded an accuracy of 64.5%(p < 0.05). This pattern revealed a global increase in language functional connectivity in the MCI due to AD group compared to the control group (Fig. 4). There were three significantly discriminative connectivity features: the connectivity between the left inferior frontal gyrus and the left middle temporal gyrus/angular gyrus, the connectivity between the left inferior frontal gyrus and the left superior temporal gyrus and the connectivity between the left middle temporal gyrus/angular gyrus and the left superior temporal gyrus.
Fig. 4
Contribution of each feature when classifying the pattern of atrophy within language network. The dashed lines represent the threshold (p < 0.05) for significance obtained through permutations. Significant features are indicated in bold on the y-axis. Only the main area of each ROI is displayed on the y-axis. LMTG, left middle temporal gyrus; LMTG/AG, left middle temporal/angular gyrus; LSTG, left middle/superior/supramarginal gyrus; RSTG, right middle/superior/ supramarginal gyrus, LCereb, left cerebellum.
Executive control networks
For left ECN, the classification analysis based on structural data yielded an accuracy of 95.8%(p < 0.0001). All the features of this network but one (left IFG/orbitofrontal gyrus) were significantly informative for the classification. For the right ECN, the classification analysis yielded an accuracy of 91.8%(p < 0.0001). All the features of this network were significantly informative for the classification.
Regarding these functional networks, neither of the two networks could significantly discriminate MCI due to AD participants from healthy controls (left ECN: 60.9%; p = 0.09; right ECN: 44%; p = 0.7).
Correlations with language performance
We first extracted a measure of group-typicality from classification analyses to perform intra-group correlations between discriminative patterns and language performance. For each participant, we extracted the confidence score of the classifier to predict the class of this participant (HC or MCI due to AD). This score corresponds to the distance of each participant from the hyperplane that distinguishes the two classes. For instance, a participant whose data represent a point far from the classification hyperplane will have a high confidence score, indicating that they can be confidently classified as a member of the class (depending on which side of the hyperplane they fall). This measure therefore represents a continuous group-typicality measure that allow us to relate multivariate patterns analyses to behavioral performance [40, 41]. For the language network’s gray matter density, confidence scores were not correlated with language performance, in any group. For the language network’s functional data, confidence scores were not correlated with any language task in the MCI due to AD group. There was a positive correlation with the connected speech task in the HC group: participants with high confidence scores had superior lexical content during this task (p = 0.015; r = 0.36). This means that participants that were the most different from the MCI due to AD group in terms of language network’s functional connectivity had richer lexical content during their narrative production. Confidence scores obtained during ECN classifications were not correlated with language performance in any group.
We also tested, in the MCI due to AD group, correlations between pairs of ROIs that showed significant increased connectivity. Connectivity between the left inferior frontal gyrus and the left middle temporal gyrus/angular gyrus was positively correlated with MCI due to AD participants’ phonemic fluency scores (r = 0.35; p = 0.018); connectivity between the left inferior frontal gyrus and the left superior temporal gyrus was positively correlated with MCI due to AD participants’ performance during the sentence production task (r = 0.38; p = 0.016); connectivity between the left middle temporal gyrus/angular gyrus and the left superior temporal gyrus was positively correlated with object naming performance, but not significant after Bonferroni-Holm corrections (r = 0.32; p = 0.039). No significant correlations were found with the narrative task.
DISCUSSION
In the current study, we recruited typical AD participants at the MCI stage who underwent a comprehensive language assessment, a structural 3D-T1 MRI and a resting-state fMRI. We showed that MCI due to AD participants had language impairment during standardized language tasks and connected speech production. Based on MVPA results, we show that an increased functional connectivity within the language network could be a marker of early AD, despite gray matter loss. However, such differences were not noticeable during univariate analyses.
Behavioral level
The MCI due to AD group had lower performance than HC during several lexical tasks: object naming, famous face naming, word spelling and written semantic verification. These results are coherent with previous literature that showed an early semantic and naming impairment in AD [2, 42]. Contrary to what was expected, their verbal fluency was not lower than in HC (contrary to Mueller and colleagues [3]).
During connected-speech production, the two groups did not differ in terms of number of words. Additionally, and similarly to Mueller and colleagues, the MCI due to AD group did not produce more filled pauses than HC. However, we revealed three qualitative differences in MCI due to AD participants’ productions. First, their lexical content was lower than healthy controls, which is similar to what we previously found using the same narrative task [21]. They also produced more modalizing discourse and more self-corrections while speaking. Previous studies [7] also found an increase of modalizing discourse in MCI due to AD patients’ narratives. As mentioned by Duong et al. [43], the fact that AD participants produced modalizing discourse means that their pragmatic abilities are preserved and used to communicate about their productions. It is therefore possible that this variable increases in MCI due to AD but decreases in later stages, when pragmatic and metacognitive processes are altered. Similarly, self-corrections can be seen as evidence that some abilities remain. Indeed, self-corrections are the result of a relatively late process of verbal self-monitoring. Verbal self-monitoring is a cognitive system that inspects the speech plan and overt speech and initiates corrections when necessary [44]. In the current study, the MCI due to AD participants exhibited more errors than the controls. However, they were able to correct themselves, while an impaired monitoring system would lead to uncorrected errors. The significant proportion of modalizing discourse and self-corrections therefore reflects the use of metacognitive abilities in MCI due to AD patients’ discourse production. In sum, in our sample, despite lexical difficulties, MCI due to AD participants present with mostly preserved language/communicational abilities reflected by different compensation mechanisms during discourse production.
Univariate analyses
No inter-group differences were found during seed-based analyses, both when using the LIFG or LSTG as a seed. This result is, however, unsurprising, given the early stage of AD participants that were recruited in the current study. Indeed, Montembeault et al. [13] recruited AD participants with a slightly lower MMSE than AD participants in the current study (24.9±3.1 in their study versus 25.5±2.6 in the current study). They showed that only one cluster (the right posterior temporal gyrus) was significantly less connected to the left posterior temporal gyrus in MCI due to AD, while there was no difference with the control group when the LIFG was used a seed. However, the use of these seeds may not be suitable for MCI due to AD. Using a semantic hub such as the left anterior temporal lobe as a seed could be more sensitive to AD changes, since semantic decline is associated with atrophy in the anterior temporal lobe from the MCI stage [2].
More surprisingly, functional connectivity between the language network and the executive control network was not lower in MCI due to AD participants. Since this type of measure is the result of mean pairwise correlations between several ROIs, it is possible that it is too broad to reveal differences at the MCI stage. Additionally, the MCI due to AD group did not significantly differ from the HC group on fluency tasks during language assessment (i.e., not after corrections for multiple comparisons). Studies that revealed interactions with the executive control network in healthy aging suggested that older adults may rely on these additional attentional resources to maintain successful verbal fluency performance [10, 15]. It is therefore also possible that AD participants at the MCI stage do not differ from HC in the interaction of language and executive resources. However, although the two groups did not differ on any of these univariate measures, the pattern of atrophy or functional connectivity within the language network allowed discriminate the two groups, as shown with multivariate analyses.
Multivariate analyses
MVPA uses machine-learning algorithms that allow information patterns to be extracted from multi-dimensional data and the class of new data to be predicted. Here, we aimed to classify the two groups based on the pattern of atrophy and functional connectivity within the language network and the executive control networks. By doing so, we revealed two main findings. First, MCI due to AD is not characterized by decreased language functional connectivity. Second, language network connectivity could better classify participants than executive control networks.
Regarding language networks, the pattern of atrophy was highly discriminative of MCI due to AD participants from HC. However, this pattern was not correlated with language performance in any group. This discrepancy between atrophy and language performance has already been shown in the literature on healthy aging [15]. Additionally, while MCI due to AD participants could be classified above chance based of their pattern of atrophy, the classifier was also able to discriminate them when examining their pattern of functional connectivity. However, this pattern revealed an overall increased connectivity between most language ROIs in the MCI due to AD group. In other words, despite important gray matter loss, MCI due to AD participants presented increased functional connectivity within language network. Taken individually, connectivity values between each ROI are not informative (i.e., not significantly different in univariate analyses); however, when all the information is considered, this global increase becomes discriminant. In HC, the confidence score of each individual was correlated with higher lexical content during connected-speech production. This means that HC that presented a pattern of connectivity highly different from MCI due to AD participants had superior lexical content in their narrative. On the contrary, this global pattern of connectivity was not correlated with language performance in the MCI due to AD group. Nevertheless, when we tested correlations between language performance and pairs of ROIs that showed significant increased connectivity in the MCI due to AD group, we found positive correlations between the language production network (i.e., correlations with LIFG) and language production tasks (i.e., phonemic fluency and sentence production). This suggests that this pattern of connectivity may compensate for patients’ language difficulties and could therefore explain why the MCI due to AD group did not significantly differ from HC on these tasks.
This pattern of connectivity could have been caused by the fact that AD participants were at the MCI stage. Indeed, increased functional connectivity associated with gray matter loss has already been shown in the literature about subjective cognitive impairment [45] or MCI [46]. Two explanations are developed in the current literature: either this type of mechanism could compensate for cognitive decline, or increased functional connectivity reflects a shift in network properties that may cause further brain damage [47]. Even though, correlations with language performance are in favor of a compensatory mechanism, future work is required to examine whether increased connectivity switches to decreased connectivity at a later stage of AD and how it relates to language decline.
The pattern of atrophy in the left and right ECN was highly discriminative of MCI due to AD participants from HC. However, similarly to the language network, this pattern was not correlated with language performance in any group. Additionally, classification accuracies of MCI due to AD participants and HC based on the functional connectivity within executive control networks were not significant. This suggests that despite significant atrophy, MCI due to AD participants’ functional connectivity patterns within the executive control networks were not different from HC.
Taken together, current findings show that functional connectivity within language network can better discriminate MCI due to AD participants than executive control networks. More precisely, functional connectivity increased within MCI due to AD participants’ language network, in particular between three areas: left IFG, left STG and left MTG/AG. While the language network is usually understudied in AD compared to other networks, it could provide important insight at an early stage.
Limitations
This study has 24 participants in each group, which is comparable to previous studies we mentioned earlier [11], but represent a rather small sample size. Further studies are therefore required to examine structural and functional language network changes in MCI due to AD and to reinforce current findings. Although we adapted our methods to the current sample size (e.g., using feature selection and a cross-validated MVPA procedure), further research on large samples of participants could combine multiple modalities (e.g., language task performance, gray matter, functional connectivity) into a single multivariate pattern classification analysis. Moreover, as mentioned earlier, it would be interesting to replicate current methods on larger longitudinal data to uncover how the patterns we observed evolve over the course of AD.
Additionally, we did not use a functional language task to control that participants were left hemisphere dominant or to define our ROIs. Although we exclusively included right-handed participants, we cannot be sure that their language was left lateralized. Similarly, the use of a predefined atlas might have influenced the results. Nonetheless, we decided to use an atlas that was functionally defined, since these are more likely to represent brain regions effectively involved in language processing than anatomical seeds [9].
CONCLUSIONS
The current study demonstrated that MCI due to AD participants present with language alterations, both when examining standardized language tasks and connected-speech production. It also showed that, when analyzing language functional networks, multivariate pattern analyses could significantly predict the group membership of MCI due to AD participants and HC, while univariate analyses were not able to discriminate participants at this stage. This method therefore represents a useful tool for investigating the functional and structural (re-)organization of the neural bases of language in various populations.
ACKNOWLEDGMENTS
This study was supported by a grant from the Occitania Region and the Toulouse Mind and Brain Institute to MJ (TellMA project grant number: 15050480). We would like to thank the Inserm/UPS UMR1214 Technical Platform for the MRI acquisitions. The authors would also like to thank the patients and control participants who participated in the study, as well as the promoter of the study, Toulouse University Hospital (CHU).
Authors’ disclosures available online (https://www.j-alz.com/manuscript-disclosures/20-1584r2).
SUPPLEMENTARY MATERIAL
[1] The supplementary material is available in the electronic version of this article: https://dx.doi.org/10.3233/JAD-201584.
REFERENCES
[1] | Taler V , Phillips NA ((2008) ) Language performance in Alzheimer’s disease and mild cognitive impairment: A comparative review. J Clin Exp Neuropsychol 30: , 501–556. |
[2] | Joubert S , Brambati SM , Ansado J , Barbeau EJ , Felician O , Didic M , Lacombe J , Goldstein R , Chayer C , Kergoat M-J ((2010) ) The cognitive and neural expression of semantic memory impairment in mild cognitive impairment and early Alzheimer’s disease. Neuropsychologia 48: , 978–88. |
[3] | Mueller KD , Koscik RL , Turkstra LS , Riedeman SK , LaRue A , Clark LR , Hermann B , Sager MA , Johnson SC ((2016) ) Connected language in late middle-aged adults at risk for Alzheimer’s disease. J Alzheimers Dis 54: , 1539–1550. |
[4] | Kemper S , LaBarge E , Farraro R , Cheung H , Storandt M ((1993) ) On the preservation of syntax in Alzheimer’s disease. Arch Neurol 50: , 81–86. |
[5] | Ahmed S , Haigh AF , Jager De CA , Garrard P ((2013) ) Connected speech as a marker of disease progression in autopsy-proven Alzheimer’s disease. Brain 136: (Pt 12), 3727–3737. |
[6] | de Lira JO , Ortiz KZ , Campanha AC , Bertolucci PHF , Minett TSC ((2011) ) Microlinguistic aspects of the oral narrative in patients with Alzheimer’s disease. Int Psychogeriatr 23: , 404–412. |
[7] | Pistono A , Jucla M , Pariente J ((2018) ) Discourse macrolinguistic impairment as a marker of linguistic and extralinguistic functions decline in early Alzheimer’s disease. Int J Lang Commun Disord 54: , 390–400. |
[8] | Melrose RJ , Campa OM , Harwood DG , Osato S , Mandelkern MA , Sultzer DL ((2009) ) The neural correlates of naming and fluency deficits in Alzheimer’s disease: An FDG-PET study. Int J Geriatr Psychiatry 24: , 885–893. |
[9] | Muller AM , Meyer M ((2014) ) Language in the brain at rest: New insights from resting state data and graph theoretical analysis. Front Hum Neurosci 8: , 228. |
[10] | Muller AM , Mérillat S , Jäncke L ((2016) ) Older but still fluent? Insights from the intrinsically active baseline configuration of the aging brain using a data driven graph-theoretical approach. Neuroimage 127: , 346–362. |
[11] | Weiler M , Fukuda A , Massabki L , Lopes T , Franco A , Damasceno B , Cendes F , Balthazar M ((2014) ) Default mode, executive function, and language functional connectivity networks are compromised in mild Alzheimer’s disease. Curr Alzheimer Res 11: , 274–282. |
[12] | Mascali D , DiNuzzo M , Serra L , Mangia S , Maraviglia B , Bozzali M , Giove F ((2018) ) Disruption of semantic network in mild Alzheimer’s disease revealed by resting-state fMRI. Neuroscience 371: , 38–48. |
[13] | Montembeault M , Chapleau M , Jarret J , Boukadi M , Laforce R , Wilson MA , Rouleau I , Brambati SM ((2019) ) Differential language network functional connectivity alterations in Alzheimer’s disease and the semantic variant of primary progressive aphasia. Cortex 117: , 284–298. |
[14] | Hoffman P , Morcom AM ((2018) ) Age-related changes in the neural networks supporting semantic cognition: A meta-analysis of 47 functional neuroimaging studies. Neurosci Biobehav Rev 84: , 134–150. |
[15] | Pistono A , Guerrier L , Péran P , Rafiq M , Gimeno M , Bézy C , Pariente J , Jucla M ((2021) ) Increased functional connectivity supports language performance in healthy aging despite gray matter loss. Neurobiol Aging 98: , 52–62. |
[16] | Haynes J-D , Rees G ((2006) ) Decoding mental states from brain activity in humans. Nat Rev Neurosci 7: , 523–534. |
[17] | Hebart MN , Baker CI ((2018) ) Deconstructing multivariate decoding for the study of brain function. Neuroimage 180: , 4–18. |
[18] | Liu T , Wang Y , Yan T (2018) Classification by a rs-fMRI study. 2018 11th Int Congr Image Signal Process Biomed Eng Informatics, pp. 1-6. |
[19] | Shirer WR , Ryali S , Rykhlevskaia E , Menon V , Greicius MD ((2012) ) Decoding subject-driven cognitive states with whole-brain connectivity patterns. Cereb Cortex 22: , 158–165. |
[20] | Battistella G , Borghesani V , Henry M , Shwe W , Lauricella M , Miller Z , Deleon J , Miller BL , Dronkers N , Brambati SM , Seeley WW , Mandelli ML , Gorno-Tempini ML ((2020) ) Task-free functional language networks: Reproducibility and clinical application. J Neurosci 40: , 1311–1320. |
[21] | Pistono A , Pariente J , Bézy C , Lemesle B , Le Men J , Jucla M ((2019) ) What happens when nothing happens? An investigation of pauses as a compensatory mechanism in early Alzheimer’s disease. Neuropsychologia 124: , 133–143. |
[22] | Graf C ((2008) ) The Lawton instrumental activities of daily living scale. Am J Nurs 108: , 52–62; quiz 62-63. |
[23] | Morris JC ((1993) ) The Clinical Dementia Rating (CDR): Current version and scoring rules. Neurology 43: , 2412–2414. |
[24] | Folstein MF , Folstein SE , McHugh PR ((1975) ) “Mini-mental state”: A practical method for grading the cognitive state of patients for the clinician. J Psychiatr Res 12: , 189–198. |
[25] | Van der Linden M , Coyette F , Poitrenaud J , Kalafat M , Calicis F , Wyns C , Adam S (2004) L’épreuve de rappel libre / rappel indicé à 16 items (RL/RI-16). In L’ évaluation des troubles de la mémoire: Présentation de quatre tests de mémoire épisodique avec leur étalonnage, France, pp. 25-47. |
[26] | Dubois B , Feldman HH , Jacova C , Hampel H , Molinuevo JL , Blennow K , DeKosky ST , Gauthier S , Selkoe D , Bateman R , Cappa S , Crutch S , Engelborghs S , Frisoni GB , Fox NC , Galasko D , Habert MO , Jicha GA , Nordberg A , Pasquier F , Rabinovici G , Robert P , Rowe C , Salloway S , Sarazin M , Epelbaum S , de Souza LC , Vellas B , Visser PJ , Schneider L , Stern Y , Scheltens P , Cummings JL ((2014) ) Advancing research diagnostic criteria for Alzheimer’s disease: The IWG-2 criteria. Lancet Neurol 13: (6), 614–629. |
[27] | Baddeley AD , Emslie H , Nimmo-Smith I (1994) Doors and People: A Test of Visual and Verbal Recall and Recognition. Manual, Thames Valley Test Company. |
[28] | Wechsler D ((1997) ) WAIS-III: Administration and Scoring Manual, The Psychological Corporation, San Antonio: |
[29] | Reitan RM ((1958) ) Validity of the Trail Making Test as an indicator of organic brain damage. Percept Mot Skills 8: , 271–276. |
[30] | Mahieux-Laurent F , Fabre C , Galbrun E , Dubrulle A , Moroni C , groupe de réflexion sur les praxies du CMRR Ile-de-France Sud ((2008) ) Validation d’une batterie brève d’évaluation des praxies gestuelles pour consultation Mémoire. Évaluation chez 419 témoins, 127 patients atteints de troubles cognitifs légers et 320 patients atteints d’une démence. Rev Neurol (Paris) 165: , 560–567. |
[31] | Agniel A , Joanette Y , Doyon B , Duchein C (1992) Protocole Montr&eal-al-Toulouse: Évaluation des gnosies visuelles et auditives. Paris. |
[32] | Starkstein SE , Mayberg HS , Preziosi TJ , Andrezejewski P , Leiguarda R , Robinson RG ((1992) ) Reliability, validity, and clinical correlates of apathy in Parkinson’s disease. J Neuropsychiatry Clin Neurosci 4: , 134–139. |
[33] | Beck AT , Ward CH , Mendelson M , Mock J , Erbaugh J ((1961) ) An inventory for measuring depression. Arch Gen Psychiatry 4: , 561–571. |
[34] | Bézy C , Renard A , Pariente J (2016) GREMOTS Batterie d’ évaluation des troubles du langage dans les maladies neurodégénératives, De Boeck supérieur. |
[35] | Whitfield-Gabrieli S , Nieto-Castanon A ((2012) ) Conn: A functional connectivity toolbox for correlated and anticorrelated brain networks. Brain Connect 2: , 125–141. |
[36] | Pereira F , Mitchell T , Botvinick M ((2009) ) Machine learning classifiers and fMRI: A tutorial overview. Neuroimage 45: (1 Suppl), S199–209. |
[37] | Shahnazian D , Senoussi M , Krebs RM , Verguts T , Holroyd CB (2021) Neural representations of task context and temporal order during action sequence execution. Top Cogn Sci, doi: 10.1111/tops.12533 |
[38] | Pedregosa F , Varoquaux G , Gramfort A , Michel V , Thirion B , Grisel O , Blondel M , Prettenhofer P , Weiss R , Dubourg V , Vanderplas J , Passos A , Cournapeau D , Brucher M , Perrot M , Duchesnay E ((2011) ) Scikit-Learn: Machine learning in Python. J Mach Learn Res 12: , 2825–2830. |
[39] | Haufe S , Meinecke F , Görgen K , Dähne S , Haynes J-D , Blankertz B , Bießmann F ((2014) ) On the interpretation of weight vectors of linear models in multivariate neuroimaging. Neuroimage 87: , 96–110. |
[40] | Ritchie JB , Carlson TA ((2016) ) Neural decoding and “inner” psychophysics: A distance-to-bound approach for linking mind, brain, and behavior. Front Neurosci 10: , 190. |
[41] | Senoussi M , Berry I , VanRullen R , Reddy L ((2016) ) Multivoxel object representations in adult human visual cortex are flexible: An associative learning study. J Cogn Neurosci 28: , 852–868. |
[42] | Barbeau EJ , Didic M , Joubert S , Guedj E , Koric L , Felician O , Ranjeva J-P , Cozzone P , Ceccaldi M ((2012) ) Extent and neural basis of semantic memory impairment in mild cognitive impairment. J Alzheimers Dis 28: , 823–37. |
[43] | Duong A , Tardif A , Ska B ((2003) ) Discourse about discourse: What is it and how does it progress in Alzheimer’s disease? Brain Cogn 53: , 177–180. |
[44] | Hartsuiker R (2014) Monitoring and control of the production system. Oxford Handb Lang Prod, pp. 417-436. |
[45] | Hafkemeijer A , Altmann-Schneider I , Oleksik AM , van de Wiel L , Middelkoop HA , van Buchem MA , van der Grond J , Rombouts SA ((2013) ) Increased functional connectivity and brain atrophy in elderly with subjective memory complaints. Brain Connect 3: , 353–362. |
[46] | Gardini S , Venneri A , Sambataro F , Cuetos F , Fasano F , Marchi M , Crisi G , Caffarra P ((2015) ) Increased functional connectivity in the default mode network in mild cognitive impairment: A maladaptive compensatory mechanism associated with poor semantic memory performance. J Alzheimers Dis 45: , 457–470. |
[47] | Gallagher M , Bakker A , Yassa MA , Stark CEL ((2010) ) Bridging neurocognitive aging and disease modification: Targeting functional mechanisms of memory impairment. Curr Alzheimer Res 7: , 197–199. |
[48] | Dubois B , Feldman HH , Jacova C , Hampel H , Molinuevo JL , Blennow K , DeKosky ST , Gauthier S , Selkoe D , Bateman R , Cappa S , Crutch S , Engelborghs S , Frisoni GB , Fox NC , Galasko D , Habert MO , Jicha GA , Nordberg A , Pasquier F , Rabinovici G , Robert P , Rowe C , Salloway S , Sarazin M , Epelbaum S , de Souza LC , Vellas B , Visser PJ , Schneider L , Stern Y , Scheltens P , Cummings JL ((2014) ) Advancing research diagnostic criteria for Alzheimer’s disease: The IWG-2 criteria. Lancet Neurol 13: (6), 614–629. |


