
Metabolic Profiling of Suprachiasmatic Nucleus Reveals Multifaceted Effects in an Alzheimer’s Disease Mouse Model
Abstract
Background:
Circadian rhythm disturbance is commonly observed in Alzheimer’s disease (AD). In mammals, these rhythms are orchestrated by the superchiasmatic nucleus (SCN). Our previous study in the Tg2576 AD mouse model suggests that inflammatory responses, most likely manifested by low GABA production, may be one of the underlying perpetrators for the changes in circadian rhythmicity and sleep disturbance in AD. However, the mechanistic connections between SCN dysfunction, GABA modulation, and inflammation in AD is not fully understood.
Objective:
To reveal influences of amyloid pathology in Tg2576 mouse brain on metabolism in SCN and to identify key metabolic sensors that couple SCN dysfunction with GABA modulation and inflammation.
Methods:
High resolution magic angle spinning (HR-MAS) NMR in conjunction with multivariate analysis was applied for metabolic profiling in SCN of control and Tg2576 female mice. Immunohistochemical analysis was used to detect neurons, astrocytes, expression of GABA transporter 1 (GAT1) and Bmal1.
Results:
Metabolic profiling revealed significant metabolic deficits in SCN of Tg2576 mice. Reductions in glucose, glutamate, GABA, and glutamine provide hints toward an impaired GABAergic glucose oxidation and neurotransmitter cycling in SCN of AD mice. In addition, decreased redox co-factor NADPH and glutathione support a redox disbalance. Immunohistochemical examinations showed low expression of the core clock protein, Bmal1, especially in activated astrocytes. Moreover, decreased expression of GAT1 in astrocytes indicates low GABA recycling in this cell type.
Conclusion:
Our results suggest that redox disbalance and compromised GABA signaling are important denominators and connectors between neuroinflammation and clock dysfunction in AD.
INTRODUCTION
The suprachiasmatic nucleus (SCN), also referred to as the central or master circadian clock in mammals, is a small part of the brain located in the hypothalamus above the optic chiasm [1, 2]. The SCN functions as a central pacemaker which synchronizes cellular clocks throughout the body to the light-dark cycle, leading to the circadian expression of several genes and proteins and plays an important role in the complex biology of sleep [3–7].
Alzheimer’s disease (AD) is the most common form of dementia with an estimated number of 48 million AD patients worldwide in 2015, which is expected to grow to 131.5 million cases by 2050 [8]. Difficulties getting sleep and poor sleep quality are generally reported by AD patients [9–12]. Evidence by immunocytochemistry and morphometry, showed a decline in both the SCN cell numbers and total volume in AD patients [13]. While some studies show that AD causes degeneration of SCN neurons, it has been hypothesized more recently that, vice versa, the SCN could play an important role in the development of AD [4]. Disturbances in sleep can occur 10–15 years prior to the cognitive symptoms associated with AD [14], and people suffering from insomnia were shown to have a higher risk of developing AD [15]. Furthermore, the SCN of AD mice was found to be involved in disruptive circadian amyloid-β (Aβ) production in various brain regions causing increased formation of Aβ plaques, one of the two hallmarks of AD [16]. However, the exact way the SCN is affected by or prior to AD remains unknown. Tg2576 is a widely used model of AD characterized by memory deficits, Aβ elevation, and amyloid plaque formation [17]. Although no significant loss of neurons was observed in various parts of the Tg2576 brain, such as hippocampus and cortex, significant neurodegeneration in parallel with elevated numbers of astrocytes has been reported in SCN [17]. Moreover, changes in the circadian rhythm and sleep abnormalities have been reported in this mouse model [17].
An in vivo study performed by our group, employing magnetic resonance relaxation measurements, showed degeneration of the SCN in the Tg2576 mouse model of AD [17]. The transverse relaxation time (T2) was used as a specific attribute of spins which depend on their surroundings. T2 relaxation time provides specific information about changes in tissue microstructure such as demyelination, axonal injury, gliosis, and iron deposition. Based on multicomponent analysis of T2 and immunohistology, it was proposed that inflammatory responses, most likely manifested by low γ-aminobutyric acid (GABA) production may be one of the underlying perpetrators for the changes in circadian rhythmicity and sleep disturbance in AD [17]. GABA is the most abundant neurotransmitter in SCN (reviewed by [18]). Among its wide range of functions in the SCN, including the ability to both synchronize and destabilize circadian oscillations [18], GABA is known to possess inhibitory effects on pro-inflammatory processes [19, 20]. The key metabolic sensors that couple SCN dysfunction with GABA modulation and inflammation in AD are not fully established.
To understand the mechanistic role of circadian clock disturbance in AD pathogenesis and to identify key metabolic sensors that couple SCN dysfunction with GABA modulation and inflammation, a systematic study of the metabolism in SCN is necessary. Recently, mass spectrometry was implemented for a metabolomic study of the SCN in control mice [21]. In another study a reverse-phase ultra-high performance liquid chromatography-tandem mass spectrometry was used to study circadian metabolism in SCN affected by nutritional challenge [22]. Although very sensitive, the sample preparation is labor and time-intensive and involves destructive extraction procedures. The development of non-invasive methods for the measurement of metabolites in intact tissues using 1H NMR has been an active area of research in the recent years [23, 24]. High resolution magic angle spinning (HR-MAS) NMR is a form of NMR spectroscopy with the capability of analyzing intact tissue samples, eliminating several sample preparation steps required for other metabolomics approaches [25]. Recently, we applied HR-MAS NMR to resolve several metabolites including GABA in intact brain tissues without any extraction, thus measuring GABA in its native environment in cortex, hippocampus, and thalamus [26].
In the present study, the application of 1H HR-MAS NMR to the SCN represents the first non-invasive metabolomics study of SCN in an AD mouse model. The NMR observations were further supplemented by immunohistology. Based on the data, a unified model of the mechanism of SCN dysfunction and its association with GABA modulation and inflammation in AD is proposed.
MATERIALS AND METHODS
Mouse model
Tg2576 transgenic mice expressing the human amyloid precursor protein APP695 containing the Swedish double mutation in C57B6/SJL breeders as described by Hsiao et al., 1996 [27] were used in this study. Mice were kept in the animal care facility, with food and water available ad libitum and 24 h light–dark cycles with 12 h of light (5:00 a.m. to 5:00 p.m.) and 12 h of darkness. Light intensity during “daytime” was 200 lx in the animal room and 20 to 40 lx inside the closed individually ventilated cages. In a previous in vivo MRI study, we used both male and female mice and found SCN dysfunction being more pronounced in female mice than in male mice especially at older age (18 months). Therefore, in the current paper we extended our studies using 18 months old female transgenic mice and age-matched non-transgenic littermates. Animal experiments performed in this study were approved by the Landesdirektion Sachsen (license T28/16) and UDEC commission Leiden University (license number 14199). All methods were carried out in accordance with the relevant guidelines and regulations.
Brain preparation
For HR-MAS NMR studies, mice (n = 6 per group) were sacrificed precisely at 5 h after the start of light period, by CO2 inhalation. After decapitation, the brain was quickly dissected and coronal slices of 250μm in hypothalamic region containing SCN were cut with a VT 1000S vibratome (Leica). Subsequently, bilateral SCN punches of 500μm diameter were extracted from the slices by a sample corer (19-gauge, Fine Science Tools) [21]). Punches were rapidly frozen by immersing in liquid nitrogen and subsequently stored at –80°C until use. Before HR-MAS NMR studies, the individual SCN was inserted into a 4 mm Zirconium Oxide rotor. 10μL of deuterated phosphate buffer containing 0.1%(w/v) 3-trimetylsilyl-2, 2, 3, 3-tetradeuteropropionic acid (TSP) was added as an NMR reference. The rotor was placed immediately inside the NMR spectrometer.
For histological studies, mice (n = 6 per group) were sacrificed precisely at 5 h after the start of light period, by CO2 inhalation and transcardially perfused with 0.9% NaCl followed by 4%buffered paraformaldehyde (Zinc Formal-Fixx, ThermoShandon, UK) through the left cardiac ventricle. After perfusion brains were dissected and placed in the same fixative for 24 h at 4°C. After cryoprotection in 30%sucrose in 0.1 M phosphate buffer (PB, pH 7.4) for 3 days, coronal sections (30μm) were cut on a sliding microtome and collected in 0.1 M PB.
Immunohistochemistry
For fluorescent immunolabeling, mouse brain slices were pre-treated with 60%methanol (30 min), followed by washes in 0.1 M tris-buffered saline (TBS) and blocked in TBS containing 0.3%TitonX-100 and 5%goat serum for 30 min. Subsequently slices were incubated overnight with 1) a cocktail of the 3 antibodies mouse anti-NeuN/anti-HuC/D/PGP9.5 (for labelling of neurons) (1:1,000 each; Millipore, Darmstadt, Germany); 2) goat anti-GFAP antibody (for labelling of astrocytes) (1:1,000; Invitrogen [PA5–18598]); 3) mouse anti-GAT1 antibody (for GABA transporter 1) (1:4,000; Sigma-Aldrich [AB1570]; and 4) rabbit polyclonal anti-Bmal1 (1:2,000; ThermoFisher Scientific [PA1–46118]). Next day, after washing in TBS three times, sections were incubated with corresponding fluorescence secondary antibodies (namely: Cy3-conjugated donkey anti-rat, Cy2-conjugated donkey anti-rabbit or donkey anti-goat and Cy5-conjugated donkey anti-mouse (1:400 each; Dianova) for 60 min at room temperature. After washing, sections were mounted onto glass slides and coverslipped.
Confocal laser scanning microscopy (LSM 510, Zeiss, Oberkochen, Germany) was performed to reveal co-localization of astrocytes, GAT1, Bmal1, and neuronal labelling. For Cy2-labelled antigens (green fluorescence), an argon laser with 488 nm excitation was used and emission from Cy2 was recorded at 510 nm applying a low-range band pass (505–550 nm). For Cy3-labelled antigens (red fluorescence), a helium–neon laser with 543 nm excitation was used and emission from Cy3 at 570 nm was detected applying high-range band pass (560–615 nm). The Cy5-labelled antigens were visualized using excitation at 650 nm and emission at 670 nm. The specificity of primary antibodies was confirmed by omitting primary antibodies or changing labels of the secondary antibodies.
1H HR-MAS NMR
1H HR-MAS NMR experiments were carried out on a Bruker AVIII 600 MHz NMR spectrometer equipped with a 4 mm HR-MAS dual inverse 1H/13C probe with a magic angle gradient. All measurements were performed at a spinning rate of 6 kHz and a temperature of 277 K. Data was acquired and processed using Bruker TOPSPIN 3.1 software.
The one-dimensional (1D) 1H HR-MAS NMR spectra were recorded using a “zgpr” pulse sequence (from Bruker’s standard pulse program library) with water suppression. Each 1D spectrum was acquired applying a spectral width of 12 kHz, domain data points 4k, number of averages 128 with an acquisition time of 170 ms and a relaxation delay of 2 s. Since NMR measurements were done on intact brain tissue, the relaxation delay was set to a small value to remove short T2 components due to presence of lipids. All spectra were processed by an exponential window function corresponding to a line broadening of 1 Hz and zero-filled prior to Fourier transformation. 1H HR-MAS NMR spectra were phased- and baseline-corrected using TOPSPIN 3.1. The measurement time (including optimization of NMR parameters and data acquisition) of 1H HR-MAS NMR spectroscopy for each sample was approximately 6 min.
Data processing
Quantification of metabolites
All the HR-MAS NMR spectra were referenced, baseline-, phase-corrected and analyzed by using MestReNova v.8.0 (Mestrelab research S.L., Spain). Quantification of metabolites was performed using Chenomx NMR Suite 8.3 (Chenomx Inc., Edmonton, Alberta, Canada), which allowed for qualitative and quantitative analysis of an NMR spectrum by fitting spectral signatures from the Human Metabolome Database (HMDB) to the spectrum. Metabolite concentrations were subsequently calculated as ratio to total creatine (tCr). Since external references might give misleading results, Cr resonance is a reliable internal reference widely used in animal studies.
Statistical analysis was performed using OriginPro v. 8 (Northampton, USA). Differences in individual metabolites were evaluated using one-way analysis of variance (ANOVA) with a Tukey post-hoc correction for multiple comparisons. A p value of < 0.05 was considered significant. Levene’s test was performed for homogeneity of variance analysis, which indicated that the population variations are not significantly different.
Image analysis of brain sections
For quantitative histological analysis, SCN brain regions were outlined according to the “Allen Brain Atlas” with the brain explorer program (http://mouse.brainmap.org) as the reference atlas. The images were exported and further analyzed in ImageJ software (ImageJ, USA). By using the plug-in color deconvolution, the colors were unmixed, and the stained area was selected, and subsequently, the number of particles were calculated by using a plug-in called Image-based Tool for Counting Nuclei (ITCN). Any alterations in brightness and contrast were equally applied to the entire image set. The quantification of astrocytes, neurons, GAT 1 and Bmal1 was performed, and data were exported to Origin Pro v. 8 software for further analysis. The paired and/or unpaired Student’s t-test was used to compare mean values. F-values were calculated and F-values larger than 2.8 (p < 0.05) were considered significant.
Multivariate analysis
Multivariate analysis of HR-MAS NMR data was performed using the SIMCA software package (Version 14.0, Umetrics, Umeå, Sweden). Bucket tables were generated from the one-dimensional spectra of wild-type and Tg2576 mice, after removing the region between 4.20 ppm and 6.00 ppm to exclude the larger water signal using MestReNova v.12.0.4. The one-dimensional spectra were normalized to the total intensity and subdivided into buckets of 0.04 ppm. To compensate for the differences in the overall metabolite concentration between individual samples,the data were mean-centered and scaled using the Pareto method in the SIMCA software package. Furthermore, unsupervised principal component analysis (PCA) was performed on the data using the SIMCA software as described earlier [24].
RESULTS AND DISCUSSION
In this study, high resolution magic angle spinning (HR-MAS) NMR has been used in combination with immunohistology to understand the influence of amyloid pathology on metabolism in SCN and to identify mechanistic connections between compromised GABA signaling, inflammation and clock dysfunction.
HR-MAS NMR-based metabolic profiling of SCN
Representative one-dimensional 1H HR-MAS NMR spectra obtained directly from intact SCN tissue from wild-type and Tg2576 mouse are shown in Fig. 1. Highly resolved spectra were obtained, and the assignment of the metabolites was reinstated by comparing the 1H spectra of reference compounds to existing literature values [28, 29]. The reference compounds in the Biological Magnetic Resonance Data Bank were specifically used for the characterization of the metabolites [30]. Prominent singlet resonances of methyl-protons from total creatine, tCr (creatine and phosphocreatine) were observed at 3.03 ppm. The creatine peak was relatively stable with no differences observed in SCN between WT and Tg2576 mice (Fig. 1A&B). On the other hand, robust changes in several metabolites including glutamate (Glu), glutamine (Gln), GABA, N-acetyl aspartate (NAA), and m-Ins were observed in spectra obtained from SCN of Tg2576 mice as compared to wild-type mice (Fig. 1A&B).
Fig. 1
Representative high-resolution magic angle spin (HR-MAS) NMR spectra showing metabolic profile of SCN from (A) wild-type, and (B) Tg2576 mice. C, D) Multivariate analysis of the HR-MAS NMR spectra (n = 6 per group) using partial least square-discriminant analysis (PLS-DA) modelling (R2 = 0.907, Q2 = 0.989). C) Scores plots (PLS-DA1 versus PLS-DA2). The score plot explains 55.4%of total variance of WT SCN clustering in the negative PLSDA1 scores, and Tg2576 SCN in the positive PLSDA1 scores. D) Loading plots of PLS-DA1 for all buckets containing assigned peaks. Ala, alanine; Asp, aspartate; Chol, cholesterol; FA, fatty acids; GSH, glutathione; GABA, g-aminobutyric acid; Glu, glutamate; Gln, glutamine; GPC, glycerophosphocholine; Gly, glycine; Lac, lactate; m-Ins, myo-inositol; PC, phosphocholine; Tau, taurine; tCr, total creatine.
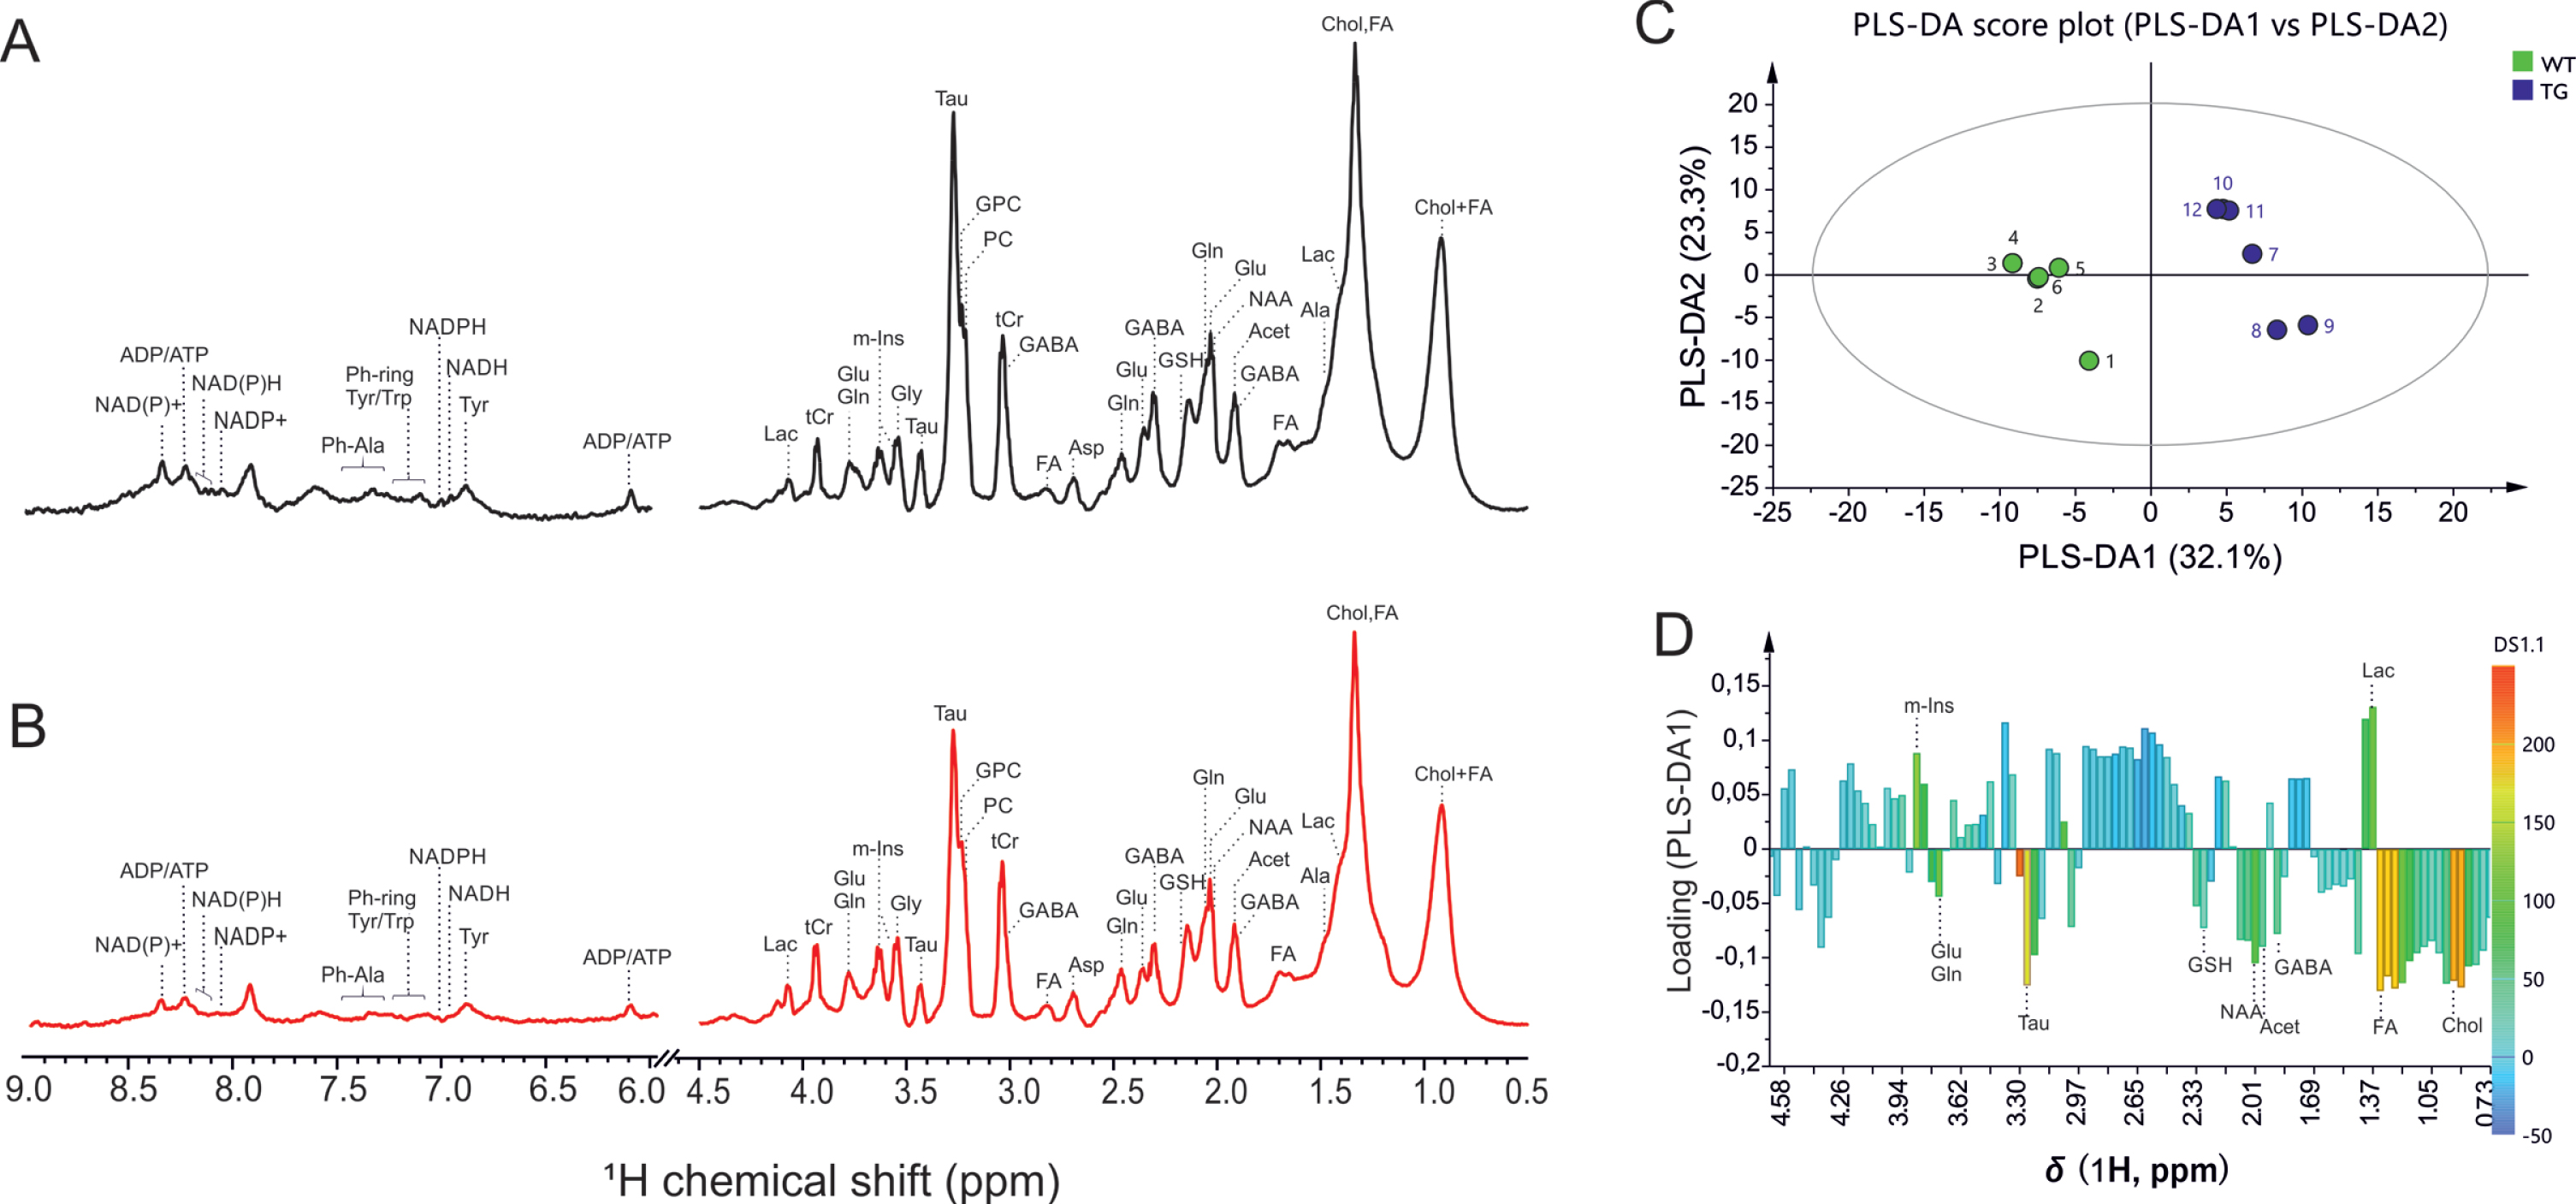
The 1H HR-MAS spectra were investigated by multivariate analysis using partial least square-discriminant analysis (PLS-DA) modelling to probe if SCN of wild-type and Tg2576 mice can be discriminated, and to determine the spectral regions, and corresponding compounds, mainly responsible for distinction. The PLS-DA scores plot, and loading plot, are presented in Fig. 1C-D. The score plot explains 68.7%of total variance of WT SCN clustering in the negative PLSDA1 scores, and Tg2576 SCN in the positive PLSDA1 scores (Fig. 1C). To determine the variables, i.e., metabolites assigned to the corresponding buckets that are mainly responsible for the separation of two groups, the load values of the PLSDA1 were analyzed (Fig. 1D).
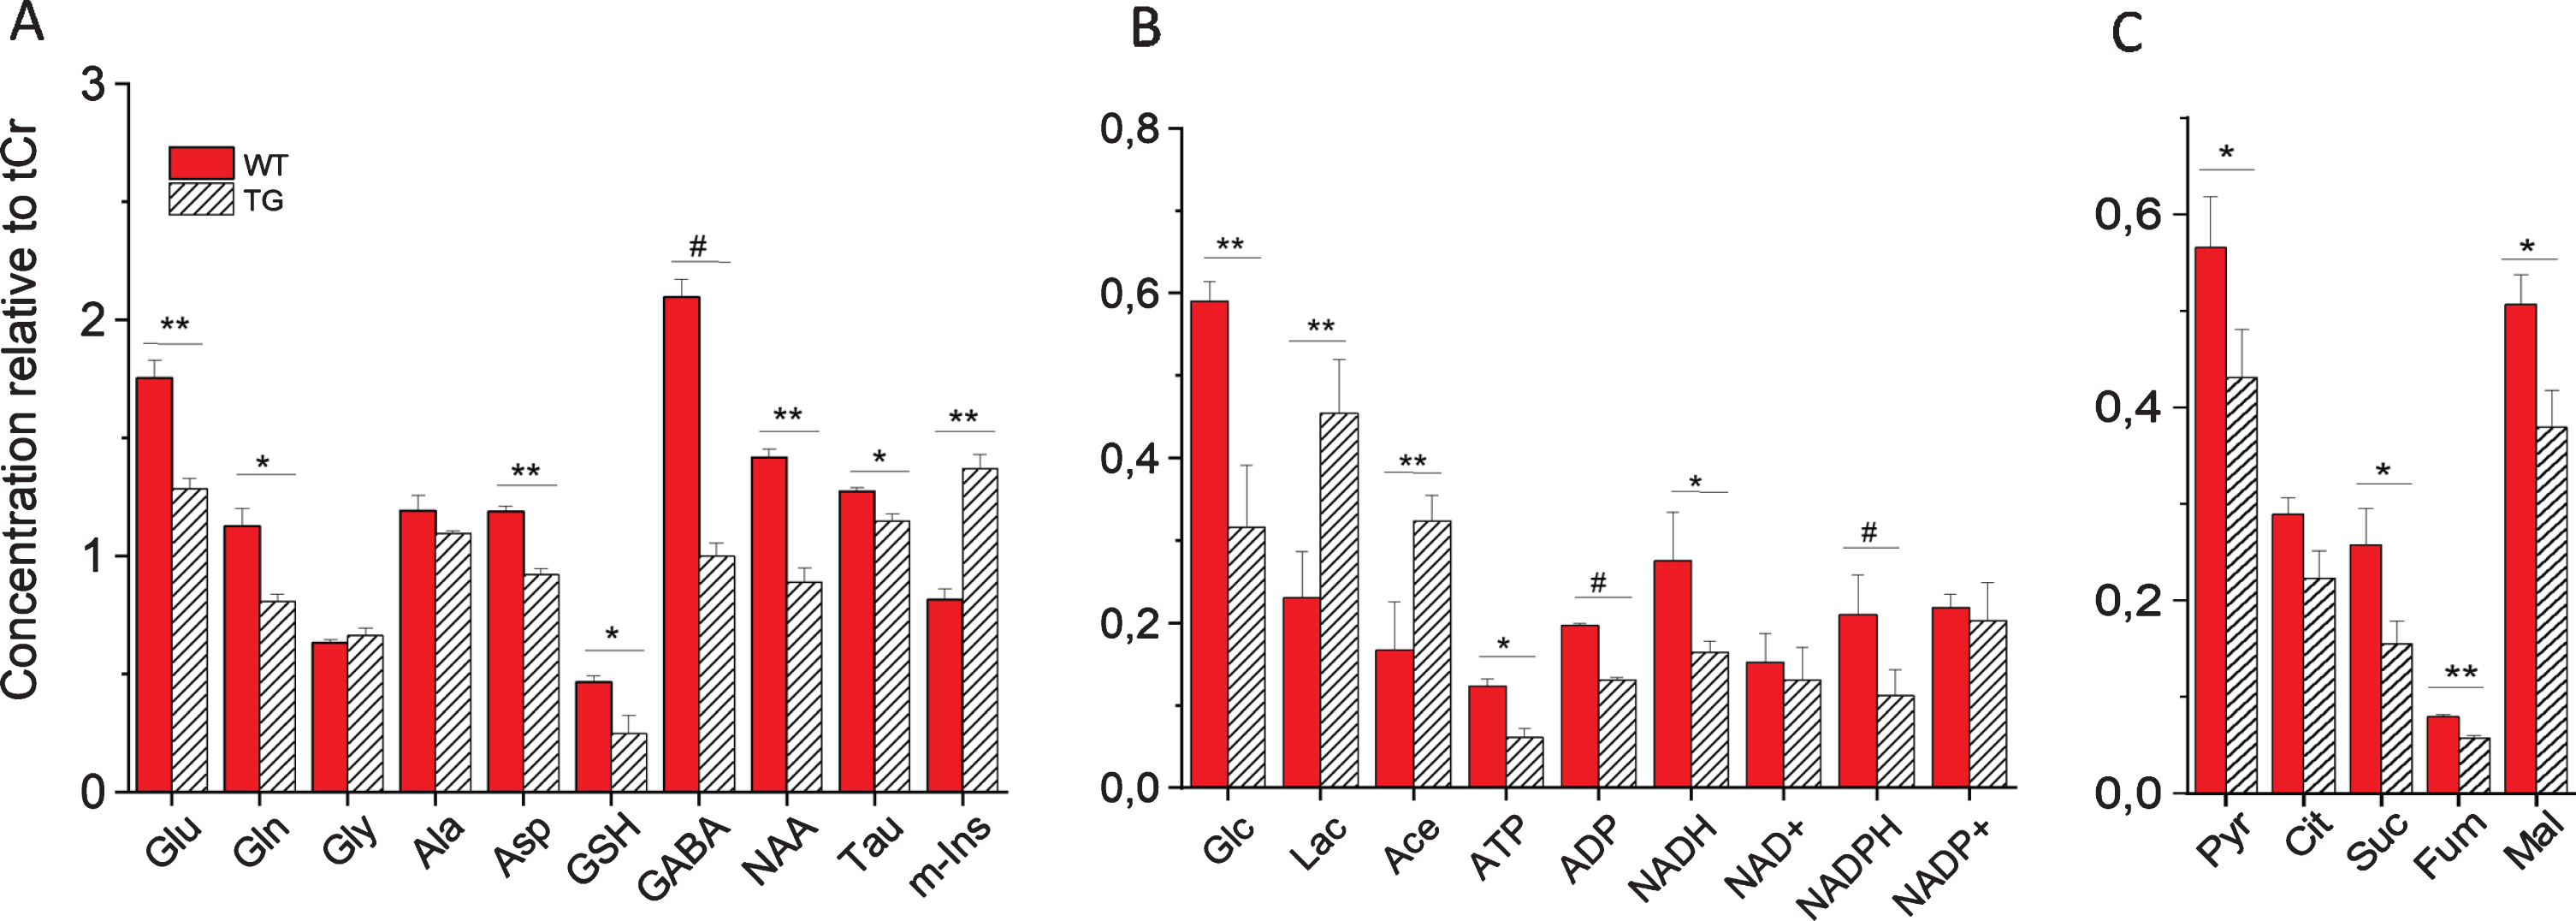
Quantitative analysis of metabolites in SCN of WT and Tg2576 mice is shown in Fig. 2. Statistically significant changes in several identified metabolites were observed in SCN from Tg2576 as compared to WT mice (Fig. 2).
Fig. 2
Metabolic profile of intact SCN from wild-type (WT) and Tg2576 (TG) mice measured by HR-MAS NMR. Shown are concentrations of metabolites relative to total creatine (tCr): A) metabolites including amino acids and neurotransmitters; B) Carbohydrate and energy metabolites; C) Pyruvate and TCA cycle intermediates. For statistical analysis, one-way analysis of variance (ANOVA) with a Tukey post-hoc correction for multiple comparisons were performed using OriginPro v. 8 (Northampton, MA, USA). Values are average±SE of mean (n = 6). #p < 0.001, **p < 0.01, and *p < 0.05. Glu, glutamate; Gln, glutamine; Gly, glycine; Ala, alanine; Asp, aspartate; GSH, glutathione; GABA, γ-aminobutyric acid; NAA, N-acetyl aspartate; Tau, taurine; m-Ins, myo-inositol; Glc, glucose; Lac, lactate; Ace, acetate; ATP, adenosine triphosphate; ADP, adenosine diphosphate; NADH/NAD+, reduced/oxidized nicotinamide adenine dinucleotide; NADPH/NADP+, reduced/oxidized nicotinamide adenine dinucleotide phosphate; Pyr, pyruvate; Cit, citrate; Suc, succinate; Fum, fumarate; Mal, malate.
Increased astrogliosis and decreased neuronal integrity in SCN of Tg2576 mice
As shown in Fig. 2, a dramatic increase in the concentration of myo-inositol (m-Ins) was observed in SCN of Tg2576 mice compared to WT mice. In contrast to m-Ins, a reduction in the levels of NAA was found in SCN of transgenic mice as compared to WT mice. NAA is found almost exclusively in neurons, both in the cell body as well as in neurites and axons [31, 32] and m-Ins is predominantly (though likely not exclusively) found in the astrocytic cell body and branches [33] and increased level of m-Ins has been linked to astrogliosis in wide range of conditions [17, 34–38]. Thus, each metabolite can in principle report on a specific cell population’s environment. Thus, a decrease in NAA in SCN of Tg2576 mice suggest significant loss of neuronal integrity and viability. On the other hand, a dramatic increase in m-Ins reflects an increase in the number of reactive astrocytes in Tg2576 mice. The activation of astrocytes is one of the fundamental events in neuroinflammation [39]. Immunohistochemical examination revealed a significant increase in astrocyte activation as assessed by GFAP immunostaining and a significantly decreased number of neurons by neuronal staining in SCN of Tg2576 mice as compared to age-matched wild-type mice (Supplementary Figure 1). These results are consistent with our previous study which showed an increase in the activated astrocyte to neuron ratio in SCN of transgenic compared to wild-type mice [17].
In addition, increased lactate (Lac) concentrations were observed in SCN of Tg2576 mice as compared to WT mice (Fig. 2). Lactate as a marker of inflammation has been noted clinically across an array of conditions [34, 37, 40–44]. Inflammation is a vastly energy-dependent process with an acute need for sufficient energy supply [45]. Lactate, that is produced from glucose (Glc) in supporting glial cells (i.e., astrocytes, oligodendrocytes)—and supplied to neurons via the so-called “astrocyte-neuron lactate shuttle”—is an important energy source for mitochondrial respiration in neurons, as well as an essential biosynthetic substrate [46]. The increase in Lactate observed in SCN of transgenic mice suggests an increase in glycolysis to fulfill energy requirements to sustain cell functioning, specifically in response to redox/metabolic deficit occurring in SCN of Tg2576 mice.
Bmal1 expression inversely correlates with astrogliosis in SCN of Tg2576 mice
Although astrocyte activation and circadian clock dysfunction are often co-existing features in neurological diseases including AD [12, 47], their interaction is unknown. Recent studies have shown that deletion of core clock gene Bmal1 causes severe, spontaneous astrogliosis throughout the mouse brain which is accompanied by increased oxidative stress, synaptic damage, and inflammation [12]. However, the cellular and molecular mechanisms linking Bmal1 to astrocyte activation and function remain uncertain. Expression of Bmal1 declines in senescent cells [12, 48] as well as in aged rodent brain tissues [49]. Blunting of Bmal1 expression in the SCN has also been reported in two other AD mouse models, 3xTG-AD mice [50] and 5x FAD mice [51].
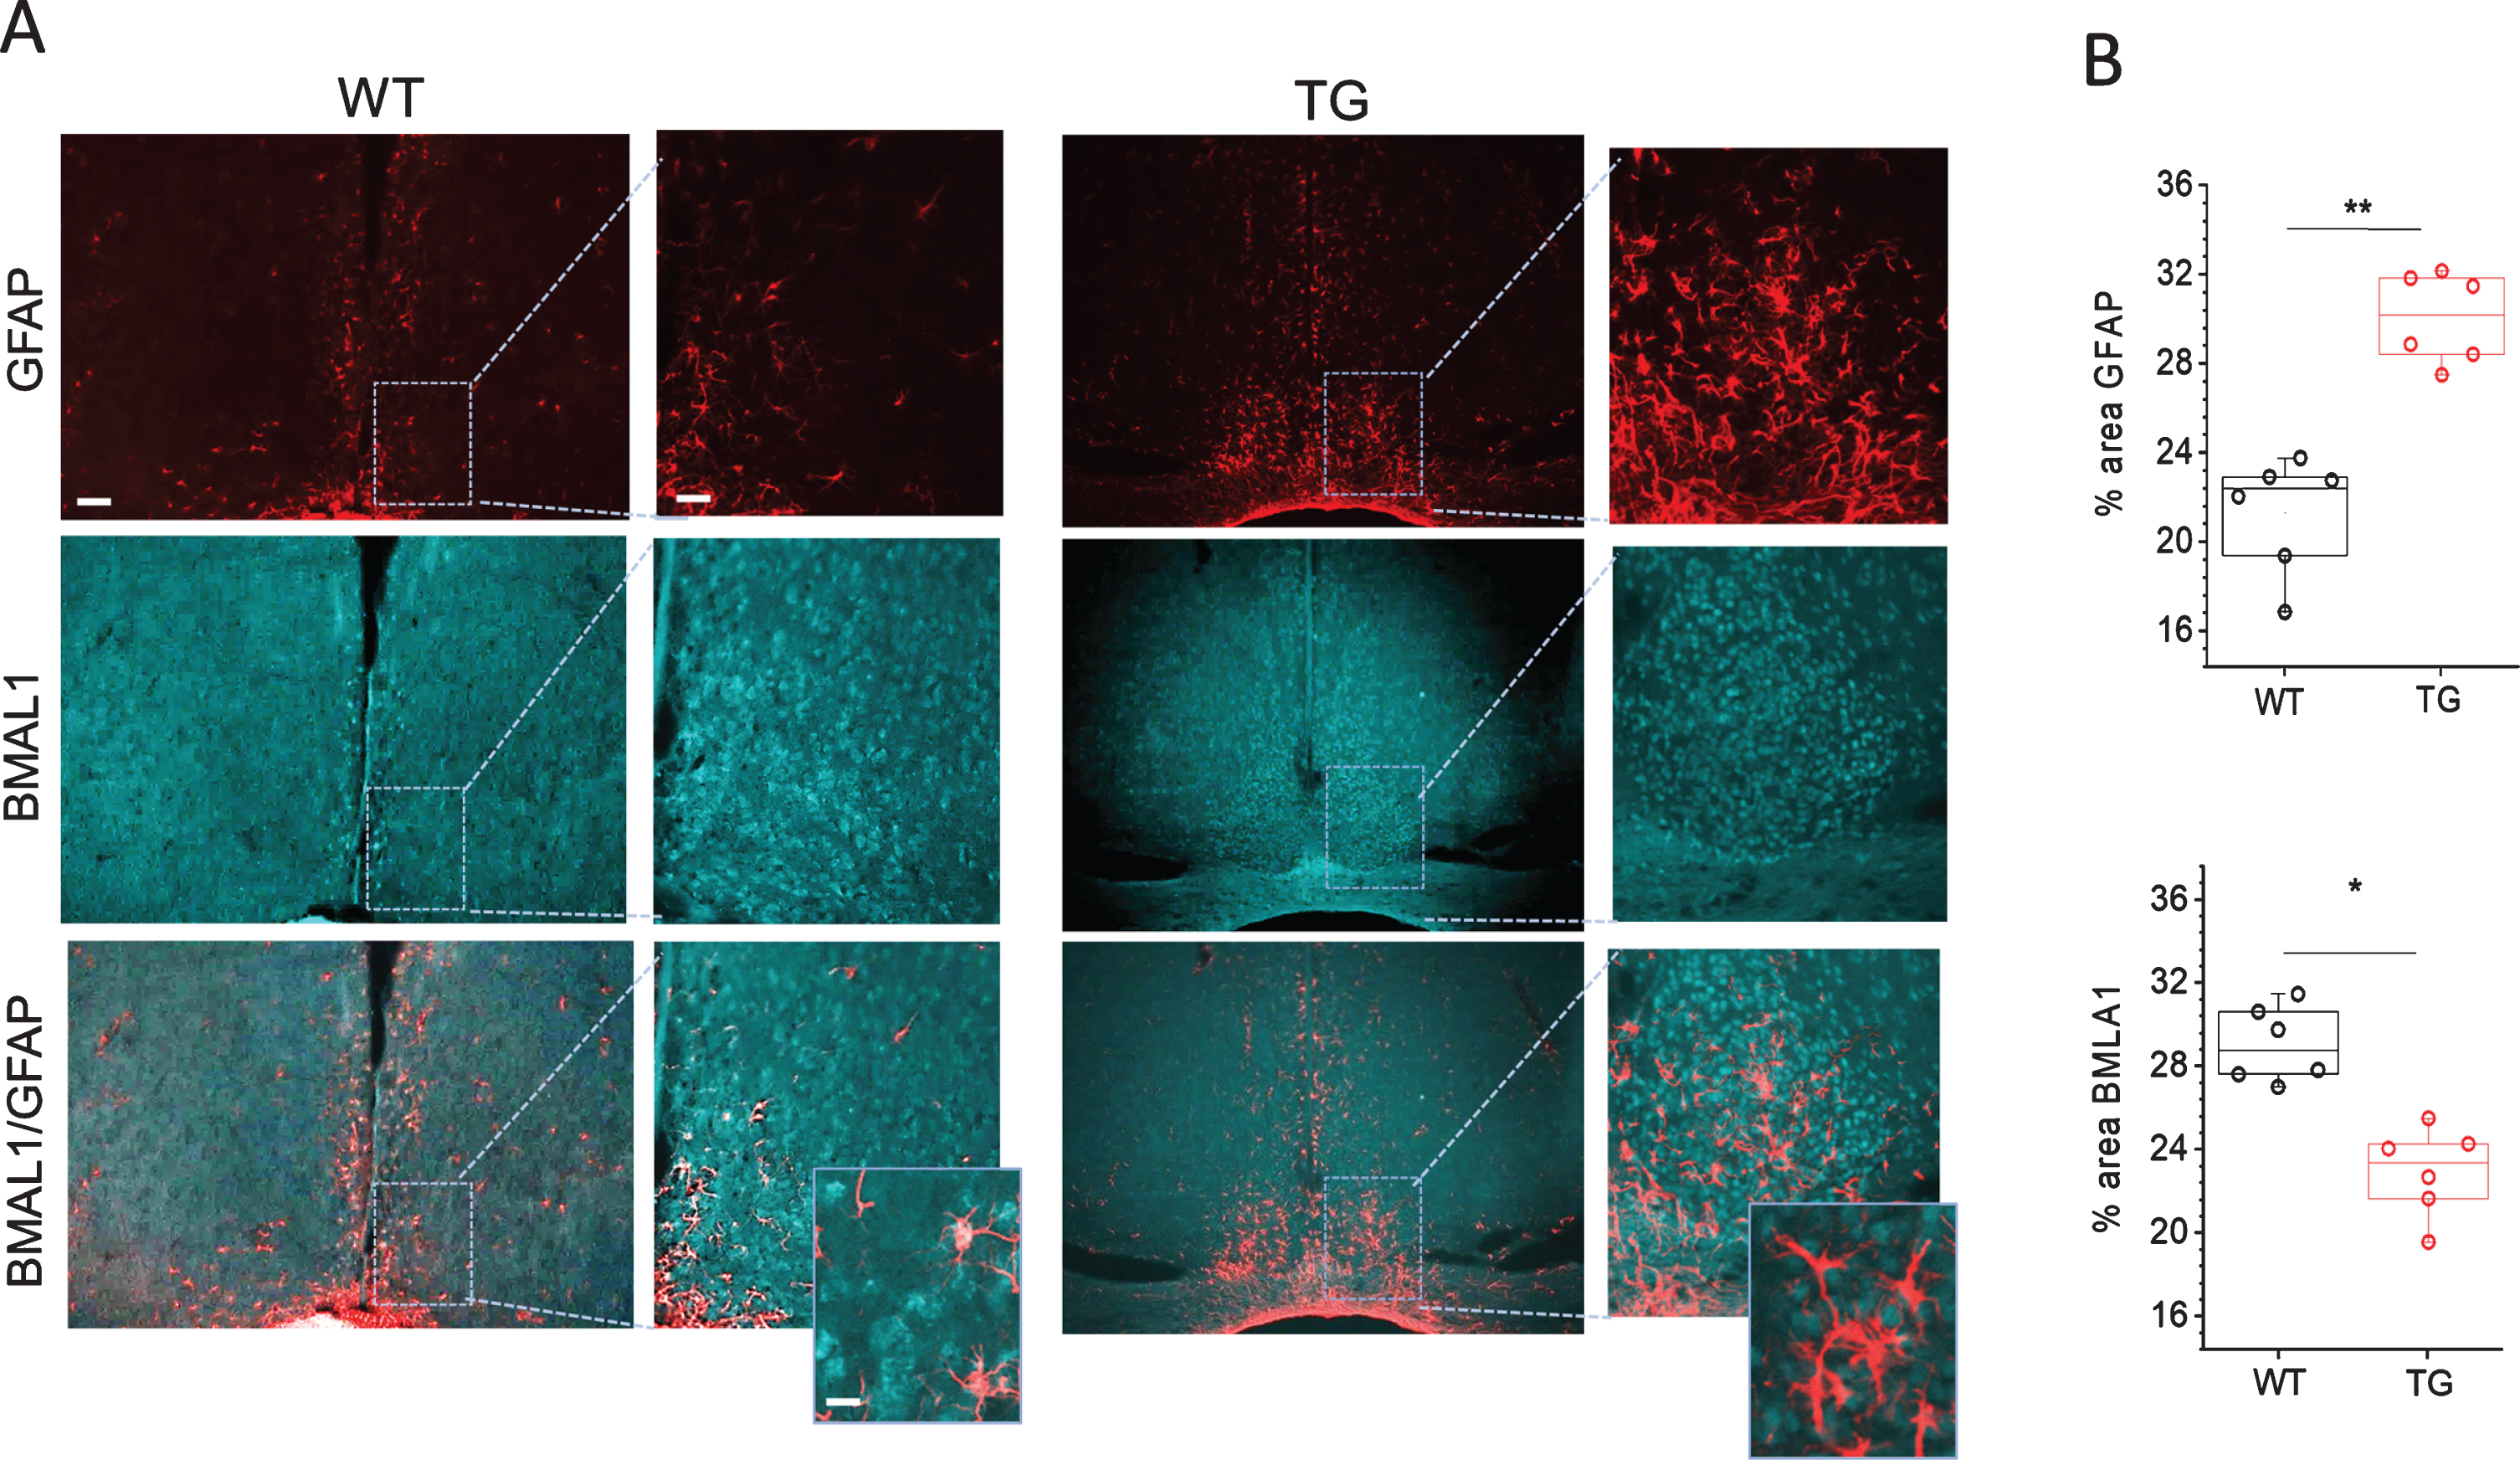
To get further insights in astrocyte activation mechanisms and its association with core clock gene Bmal1 expression in SCN of Tg2576 mice, we analyzed the expression of Bmal1 protein in SCN of WT and Tg2576 mice. As shown in Fig. 3, the expression of Bmal1 was reduced in SCN of Tg2576 mice as compared to WT. Co-localization of GFAP and Bmal1 staining showed that in WT SCN with basal Bmal1 expression, there is little astrocyte activation. On the other hand, SCN of Tg2576 mice with reduced Bmal1 expression displays very high astrocyte activation. High resolution immunohistological images showed very prominent reductions of Bmal1 associated with astrocytes in SCN of AD mice (Fig. 3). Database of mammalian circadian gene expression profiles indicates that Bmal1 mRNA is rhythmic in SCN [52]. As our study was conducted at a single time point, the decrease in Bmal1 expression in Tg2576 mice due to a shift in the Bmal1 rhythm cannot be ruled out completely. Future work on studying the Bmal1 rhythm in wild type and Tg2576 mice will help to resolve this issue. We also performed co-staining of Bmal1 with NeuN,HuC/D and PGP9.5 (for staining neurons). No significant difference in Bmal1 expression was observed in neurons in SCN of Tg2576 as compared to WT mice (data not shown). These results suggest that low Bmal1 expression, especially in astrocytes, may be associated with massive astrocyte activation and inflammation seen in SCN of Tg2576 mice. These results are in line with earlier studies of Lananna et al. 2018 [47] which show that Bmal1 regulates astrogliosis in a cell-autonomous manner. It is, however, currently unknown how reductions in Bmal1 can cause astrocyte activation. In a previous study, Barca-Mayo et al., 2016 [53] showed that deletion of astrocyte Bmal1 has an impact on the neuronal clock through GABA signaling, which lead to severe cognitive defects in mice.
Fig. 3
Immunohistochemical analyses of Bmal1 and GFAP staining in SCN of Tg2576 (TG) and wild-type (WT) mice. A) Representative confocal images of Bmal1 and GFAP stained sections through SCN of 18-month-old WT and TG mice. Scale bar, 250μm (first and third column); 60μm (second and fourth column) and 20μm (in magnifications). B) Quantitative analysis of Bmal1 and GFAP staining in SCN of 18 months old WT and Tg2576 (TG) mice (n = 6 per group). **p < 0.01, *p < 0.05. GFAP, glial fibrillary acidic protein.
Changes in GABA transporter 1 (GAT1) expression in SCN of Tg2576 mice
GABA is the principal neurotransmitter in SCN, 95%of neurons being GABAergic [54]. Remarkably, astrocytes in SCN express GABA transporters [55]. During AD, a considerable reduction in GABA transporter 1 (GAT1) expression in astrocytes and loss of GABAergic synaptosomal uptake has been reported in temporal cortex [56]. It is, however, not known how the GABA transporters are affected in SCN during AD. In an astrocytic-Bmal1 knockout mouse, reduced expression of GABA receptor was observed, suggesting a disruption of GABA signaling due to Bmal1 deletion in astrocytes [53].
Fig. 4
Immunohistochemical analyses of GABA transporter 1 (GAT1) in SCN of Tg2576 (TG) and wild-type (WT) mice. A) Representative confocal images of GAT1 and overlayed images of GAT1 with GFAP stained sections through SCN of TG and WT mice. Scale bar, 250μm (first and third column); 60μm (second and fourth column) and 20μm (in magnifications). B) Quantitative analysis of GAT1 staining in SCN of 18 months old WT and Tg2576 (TG) mice (n = 6 per group). *p < 0.05.
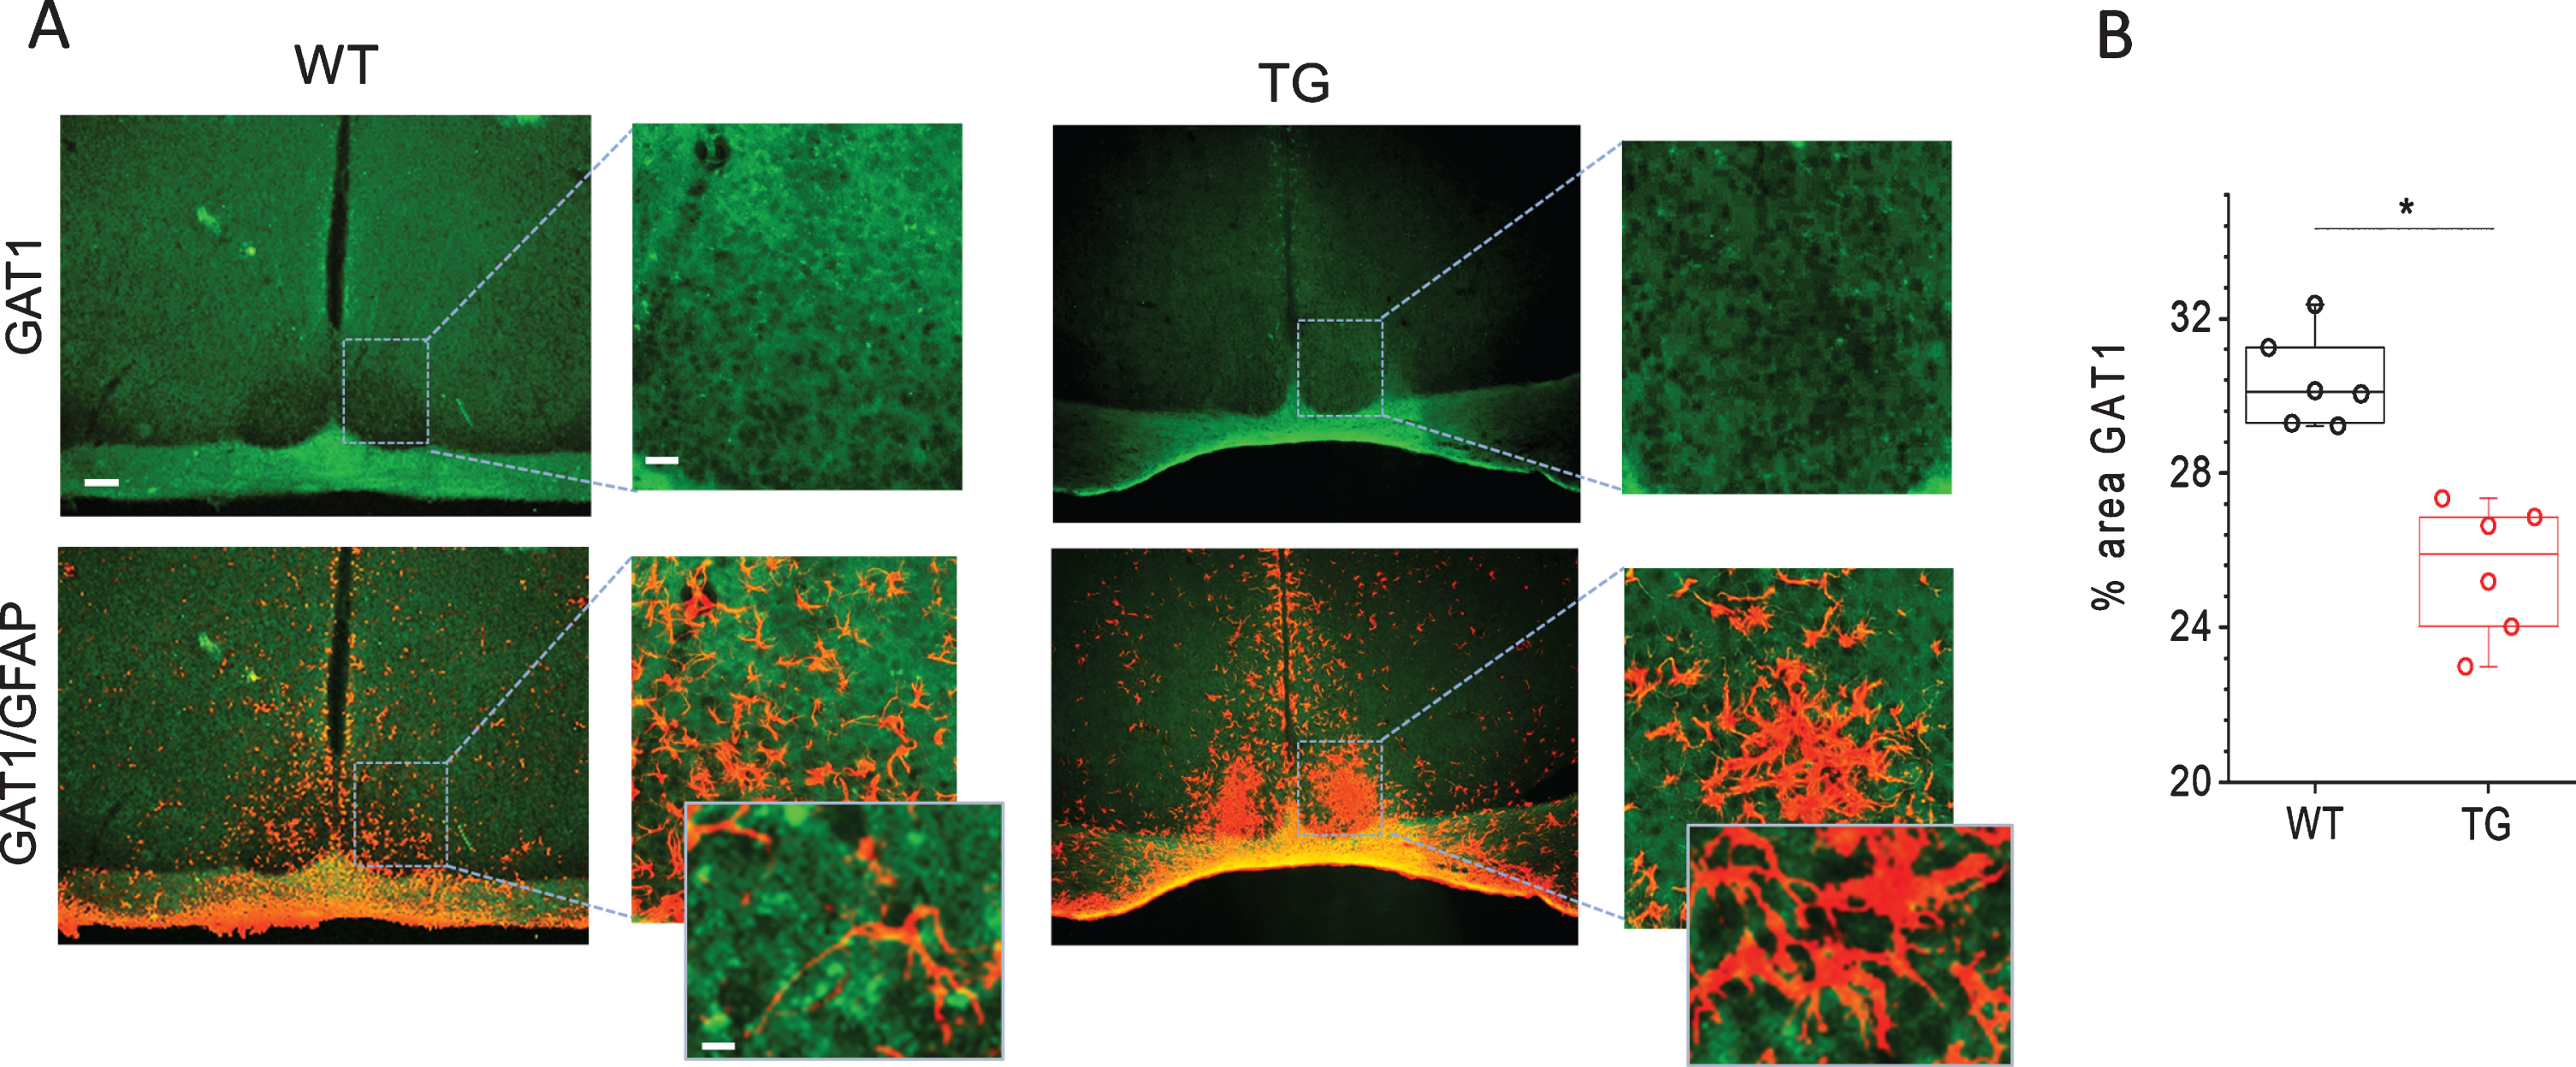
To reveal the importance of GABA uptake for the functioning of SCN and how its expression is affected in Tg2576 mice, we analyzed the expression of GAT1 in SCN of WT and Tg2576 mice. Immunohistological examination show fairly even GAT1 immunofluorescence throughout the SCN in WT mice (Fig. 4). High resolution immunofluorescent images show GAT1 labelling encircling cell perikaryal in the SCN. To determine, whether GAT1 is expressed by neurons or glial cells, we used antibodies to NeuN, HuC/D and PGP9.5 for staining neurons and anti-GFAP for astrocyte labelling. GAT1 staining was not detected in neurons (data not shown). These results are in line with earlier studies which show no GAT1 expression in SCN neurons stained by variety of neuronal markers [55]. Interestingly, large processes of GFAP-immunopositive astrocytes were encompassed by GAT1 staining. The fine processes of astrocytes are too thin to be visible in these images. Thus, in merged images occasional co-localization of GAT1- and GFAP-immunostaining were clearly seen (Fig. 4A). As the ratio of astroglia to neurons in SCN is 1 to 3, each glial cell enwraps on average four neuronal somata, suggesting that astrocytes expressing GAT1 can efficiently take up GABA and regulate the extracellular GABA concentration around neurons [55]. GABA uptake by astrocytes has been shown to play an important role in inhibiting proinflammatory responses [19, 20]. In astrocytes as well as in microglia, GABA has been shown to suppress the reactive responses to the inflammatory stimulants by inhibiting induction of inflammatory pathways mediated by NF-κB and P38 MAP kinase, which in turn causes a reduced release of the inflammatory cytokines TNFα and IL-6 and an attenuation of neurotoxicity [19]. Interestingly, the expression of GAT1 in SCN of Tg2576 mice was found to be significantly reduced as compared to WT mice (Fig. 4). The reduced GAT1 expression reflects reduced GABA uptake and compromised GABA signaling that may be associated with astrocytes activation and inflammatory responses in SCN in AD.
Fig. 5
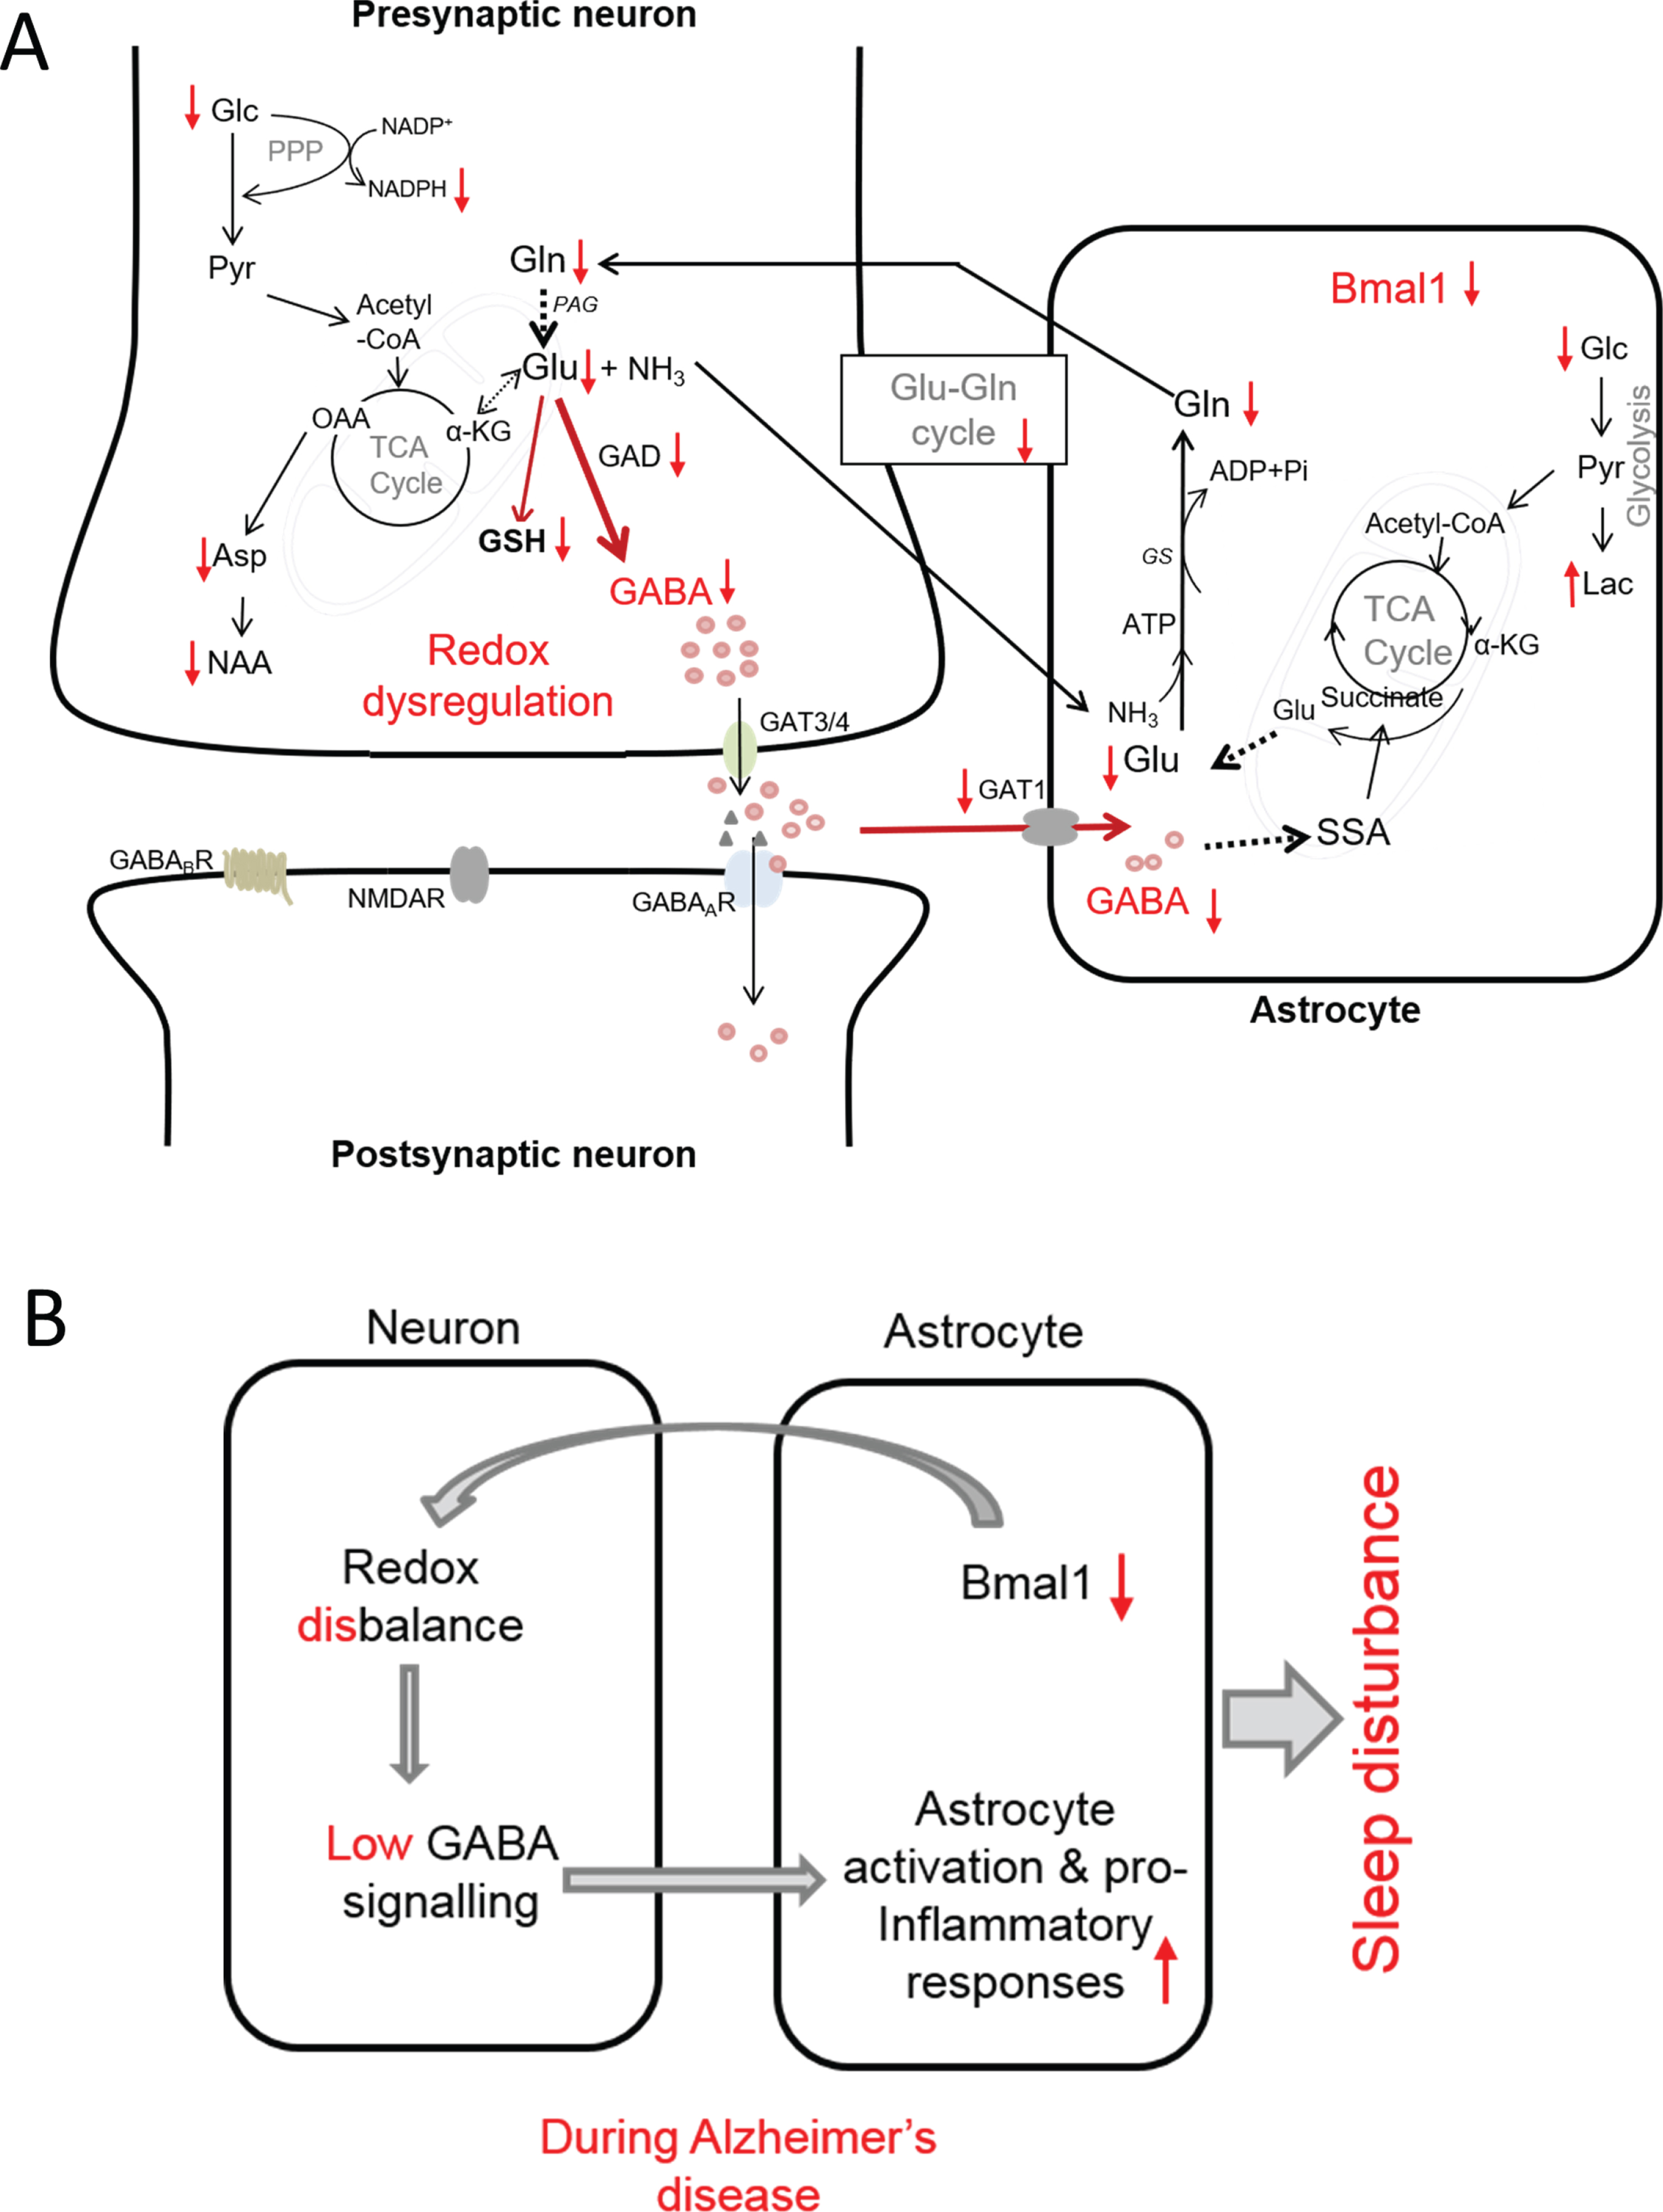
Proposed model of interconnection between redox dysregulation, compromised GABA signaling, neuroinflammation and SCN dysfunction in AD as evidenced by observed changes in metabolic profile and immunohistology in the present study. A) Observed increases and decreases in metabolites in SCN of AD mice is shown by arrows (i.e., ↑ and ↓, respectively). B) Summarized view of the interconnection between reduced Bmal1, redox disbalance, dysregulation of GABA signaling and inflammation that may be at the root of circadian rhythm disruption leading to sleep disturbance in AD. αKG, α-ketoglutarate; Asp, aspartate; GABAA GABAB, GABA receptors; GAT1 and GAT3/4, specific GABA transporter; GAD, glutamic acid decarboxylase; Glc, glucose; Gln, glutamine; Glu, glutamate; GS, glutamine synthetase; GSH, glutathione; Lac, lactate; NAA, N-acetyl aspartate; NMDAR, N-methyl-D-aspartate receptor (Glu receptor): OA, oxaloacetic acid; PPP, pentose phosphate pathway; SSA, succinate semialdehyde; TCA cycle, tricarboxylic acid cycle.
Low GABA levels might be a driving force for neuroinflammation
The direct measurement of GABA in intact SCN tissues has not been attempted so far, as GABA has a complex resonance peak pattern, which extensively overlaps with other more intense resonance peaks. In a recent HR-MAS NMR study we accurately resolved the peaks of GABA in intact brain tissues such as prefrontal cortex, parietal cortex, hippocampus, and thalamus regions without any extraction, thus measuring GABA in its native environment [26]. In this study HR-MAS NMR allowed us to measure GABA in SCN of WT and Tg2576 mice. Comparison of GABA levels in SCN of WT and Tg2576 mice shows that GABA is significantly reduced in SCN of Tg2576 mice (Fig. 2). Decrease in GABA in SCN of Tg2576 mice may be due to reduction of its synthesis from glutamate (Glu) which is catalyzed by glutamic acid decarboxylase (GAD) an enzyme involved in synthesizing GABA from glutamate. A low expression of GAD has been observed in SCN of Tg2576 mice as compared to WT in our previous study [17]. Furthermore, we observed a decrease in glucose as well as Glu and Gln in SCN of AD mice (Fig. 2). Such decrease in glucose, Glu, GABA, and Gln in SCN of Tg2576 mice compared to WT provide hints toward an impaired glutamatergic and GABAergic glucose oxidation and neurotransmitter cycle in SCN of Tg2576 mice [57, 58]. This is further supported by the observation of a significant decline in the metabolites directly involved in the TCA cycle. As can be seen in Fig. 2, TCA cycle metabolites such as citrate, succinate, fumarate, and malate show significant reductions in SCN of Tg2576 as compared to WT mice. The decrease in GABA in SCN of Tg2576 mice may also be partly linked to the marked reduction in the number of SCN neurons compared to WT mice. Nevertheless, our results suggest that metabolic dysfunction in SCN and low GABA production may be a driving force for neuroinflammation.
A redox disbalance in SCN of Tg2576 mice
A significant reduction in a redox co-factor NADH and NADPH has been observed in SCN of Tg2576 mice as compared to WT mice (Fig. 2). In central carbon metabolism, the pentose phosphate pathway (PPP) is the main source of NADPH. Importance of PPP in regulating circadian oscillations through NADPH metabolism has been recognized in disparate organisms ranging from bacteria to human [59]. Our results suggest that PPP is most likely disturbed in SCN from Tg2576 mice, which may be accountable for redox disbalance.
We have also observed a decline in glutathione (GSH) in SCN of Tg2576 mice. GSH is a major antioxidant and redox regulator in cells. Deficits in GSH have been linked to multiple neurodegenerative and neuropsychiatric disorders [60–64]. Depletion of GSH in astrocytes and neurons lead to an increase in H2O2 [58]. Elevated H2O2 is known to stimulate inhibitory pathways such as JNK and IκB kinase (IKK), which may be involved in inflammation in SCN. Mitochondria-derived H2O2 is key to the activation of NFκB [58, 65], which initiates and amplifies inflammatory responses. Although GABA dysregulation-induced microglia activation may be a driving force for neuroinflammation, redox dysregulation may be a common denominator and connector between clock disturbance and neuroinflammation.
Based on our results of changes in metabolites and immunohistology, a proposed model of interconnection between redox dysregulation, compromised GABA signaling, neuroinflammation and SCN dysfunction in AD is presented in Fig. 5. According to this model, in AD, reductions in astrocytic Bmal1 compel neuronal redox disbalance and metabolic deficits which affects GABA synthesis and neurotransmitter cycling. Reductions in glucose, glutamate, GABA, and glutamine provide support for an impaired GABAergic glucose oxidation. In addition, reduction in redox co-factor NADPH and glutathione support a redox disbalance. Reduced expression of GABA transporter 1 in astrocytes indicates low GABA recycling in this cell type. The compromised GABA signaling, in turn, may be the driving force for pro-inflammatory responses leading to neuroinflammation and circadian rhythm disturbance (Fig. 5B). In conclusion, our results indicate that in AD, GABA dysfunction in SCN entails interconnected cross-talks of energy metabolism, redox control, and inflammation, which may be at the root of SCN dysfunction and circadian rhythm disturbance in AD. In future studies, circadian profile for each key metabolite will have to be established in order to get full understanding of functional aberration in SCN metabolome and its association with sleep disturbance.
ACKNOWLEDGMENTS
We are grateful to Dr. Karen Hsiao Ashe (University of Minnesota, USA) for providing the initial Tg2576 mice for further breeding. Muhamed N. H. Eeza acknowledges the support by the Deutscher Akademischer Austauschdienst (DAAD) for fellowship.
Authors’ disclosures available online (https://www.j-alz.com/manuscript-disclosures/20-1575r2).
REFERENCES
[1] | Moore RY , Lenn NJ ((1972) ) A retinohypothalamic projection in the rat. J Comp Neurol 146: , 1–14. |
[2] | Stephan FK , Zucker I ((1972) ) Circadian rhythms in drinking behavior and locomotor activity of rats are eliminated by hypothalamic lesions. Proc Natl Acad Sci U S A 69: , 1583–1586. |
[3] | Foster RG ((2020) ) Sleep, circadian rhythms and health. Interface Focus 10: , 20190098. |
[4] | Uddin MS , Tewari D , Mamun AA , Kabir MT , Niaz K , Wahed MII , Barreto GE , Ashraf GM ((2020) ) Circadian and sleep dysfunction in Alzheimer’s disease. Ageing Res Rev 60: , 1568–1637. |
[5] | Gillette MU , Reppert SM ((1987) ) The hypothalamic suprachiasmatic nuclei: Circadian patterns of vasopressin secretion and neuronal activity in vitro. Brain Res Bull 19: , 135–139. |
[6] | Nishino H , Koizumi K , Brooks CMC ((1976) ) The role of suprachiasmatic nuclei of the hypothalamus in the production of circadian rhythm. Brain Res J 112: , 45–59. |
[7] | Lucas RJ , Foster RG ((1999) ) Neither functional rod photoreceptors nor rod or cone outer segments are required for the photic inhibition of pineal melatonin. Endocrinology 140: , 1520–1524. |
[8] | Prince M , Wimo A , Guerchet M , Ali GC , Wu YT , Prina M (2015) World Alzheimer Report 2015. The global impact of dementia. Alzheimer’s Disease International, London. |
[9] | Beaulieu-Bonneau S , Hudon C ((2009) ) Sleep disturbances in older adults with mild cognitive impairment. Int Psychogeriatr 21: , 654–666. |
[10] | Moran M , Lynch CA , Walsh C , Coen R , Coakley D , Lawlor BA ((2005) ) Sleep disturbance in mild to moderate Alzheimer’s disease. Sleep Med 6: , 347–352. |
[11] | Palmer K , Mitolo M , Burgio F , Meneghello F , Venneri A ((2018) ) Sleep disturbance in mild cognitive impairment and association with cognitive functioning. A case-control study. Front Aging Neurosci 10: , 360. |
[12] | Musiek ES , Xiong DD , Holtzman DM ((2015) ) Sleep, circadian rhythms, and the pathogenesis of Alzheimer disease. Exp Mol Med 47: , e148. |
[13] | Zhou JN , Hofman MA , Swaab DF ((1994) ) VIP neurons in the human SCN in relation to sex, age, and Alzheimer’s disease. Neurobiol Aging 16: , 571–576. |
[14] | Ju YE , Lucey BP , Holtzman DM ((2014) ) Sleep and Alzheimer disease pathology–a bidirectional relationship. Nat Rev Neurol 10: , 115–119. |
[15] | Shi L , Chen SJ , Ma MY , Bao YP , Han Y , Wang YM , Shi J , Vitiello MV , Lu L ((2018) ) Sleep disturbances increase the risk of dementia: A systematic review and meta-analysis. Sleep Med Rev 40: , 4–16. |
[16] | Kress GJ , Liao F , Dimitry J , Cedeno MR , FitzGerald GA , Holtzman DM , Musiek ES ((2018) ) Regulation of amyloid-beta dynamics and pathology by the circadian clock. J Exp Med 215: , 1059–1068. |
[17] | Roy U , Heredia-Munoz MT , Stute L , Hofling C , Matysik J , Meijer JH , Rossner S , Alia A ((2019) ) Degeneration of the suprachiasmatic nucleus in an Alzheimer’s disease mouse model monitored by in vivo magnetic resonance relaxation measurements and immunohistochemistry. J Alzheimers Dis 69: , 363–375. |
[18] | Albers HE , Walton JC , Gamble KL , McNeill JK , Hummer DL ((2017) ) The dynamics of GABA signaling: Revelations from the circadian pacemaker in the suprachiasmatic nucleus. Front Neuroendocrinol 44: , 35–82. |
[19] | Lee M , Schwab C , McGeer PL ((2010) ) Astrocytes are GABAergic cells that modulate microglial activity. Glia 59: , 152–165. |
[20] | Prud’homme GJ , Glinka Y , Hasilo C , Paraskevas S , Li X , Wang Q ((2013) ) GABA protects human islet cells against the deleterious effects of immunosuppressive drugs and exerts immunoinhibitory effects alone. Transplantation 96: , 616–623. |
[21] | Buijink MR , van Weeghel M , Gulersonmez MC , Harms AC , Rohling JHT , Meijer JH , Hankemeier T , Michel S ((2018) ) The influence of neuronal electrical activity on the mammalian central clock metabolome. Metabolomics 14: , 122. |
[22] | Tognini P , Samad M , Kinouchi K , Liu Y , Helbling JC , Moisan MP , Eckel-Mahan KL , Baldi P , Sassone-Corsi P ((2020) ) Reshaping circadian metabolism in the suprachiasmatic nucleus and prefrontal cortex by nutritional challenge. Proc Natl Acad Sci U S A 117: , 29904–29913. |
[23] | Zuberi Z , Eeza MNH , Matysik J , Berry JP , Alia A ((2019) ) NMR-based metabolic profiles of intact zebrafish embryos exposed to aflatoxin B1 recapitulates hepatotoxicity and supports possible neurotoxicity. Toxins (Basel) 11: , 258. |
[24] | Roy U , Conklin L , Schiller J , Matysik J , Berry JP , Alia A ((2017) ) Metabolic profiling of zebrafish (Danio rerio) embryos by NMR spectroscopy reveals multifaceted toxicity of beta-methylamino-L-alanine (BMAA). Sci Rep 7: , 17305. |
[25] | Gogiashvili M , Nowacki J , Hergenroder R , Hengstler JG , Lambert J , Edlund K ((2019) ) HR-MAS NMR based quantitative metabolomics in breast cancer. Metabolites 9: , 19. |
[26] | Roy U , Stute L , Hofling C , Hartlage-Rubsamen M , Matysik J , Robetaner S , Alia A ((2018) ) Sex- and age-specific modulation of brain GABA levels in a mouse model of Alzheimer’s disease. Neurobiol Aging 62: , 168–179. |
[27] | Hsiao K , Chapman P , Nilsen S , Eckman C , Harigaya Y , Younkin S , Yang F , Cole G ((1996) ) Correlative memory deficits, AP3 elevation, and amyloid plaques in transgenic mice. Science 274: , 99–102. |
[28] | Govindaraju V , Young K , Maudsley AA ((2000) ) Proton NMR chemical shifts and coupling constants for brain metabolites. NMR Biomed 13: , 129–153. |
[29] | Akhtar MT , Mushtaq MY , Verpoorte R , Richardson MK , Choi YH ((2016) ) Zebrafish as a model for systems medicine R&D: Rethinking the metabolic effects of carrier solvents and culture buffers determined by (1)H NMR metabolomics. OMICS 20: , 42–52. |
[30] | Markley JL , Anderson ME , Cui Q , Eghbalinia HR , Lewis IA , Hegeman AD , Schulte CF , Sussman MR , Westler WM , Ulrich EL , Zolnai Z ((2007) ) New bioinformatics resources for metabolomics. Pac Symp Biocomput 12: , 157–168. |
[31] | Simmons ML , Frondoza CG , Coyle JT ((1991) ) Immunocytochemical localization of N-acetyl-aspartate with monoclonal antibodies. Neuroscience 45: , 37–45. |
[32] | Moffett JR , Ross B , Arun P , Madhavarao CN , Namboodiri AM ((2007) ) N-Acetylaspartate in the CNS: From neurodiagnostics to neurobiology. Prog Neurobiol 81: , 89–131. |
[33] | Brand A , Richter-Landsberg C , Leibfritz D ((1993) ) Multinuclear NMR studies on the energy metabolism of glial and neuronal cells. Dev Neurosci 15: , 289–298. |
[34] | Bitsch A , Bruhn H , Vougioukas V , Stringaris A , Lassmann H , Frahm J , Bruck W ((1999) ) Inflammatory CNS demyelination: Histopathologic correlation with in vivo quantitative proton MR spectroscopy. Am J Neuroradiol 9: , 1619–1627. |
[35] | Chard DT , Griffin CM , McLean MA , Kappeller P , Kapoor R , Thompson AJ , Miller DH ((2002) ) Brain metabolite changes in cortical grey and normal-appearing white matter in clinically early relapsing-remitting multiple sclerosis. Brain 125: , 2342–2352. |
[36] | Sastre-Garriga J , Ingle GT , Chard DT , Ramio-Torrenta L , McClean MA , Miller DH , Thompson AJ ((2005) ) Metabolite changes in normal-appearing gray and white matter are linked with disability in early primary progressive multiple sclerosis. Arch Neurol 62: , 569–573. |
[37] | Mader I , Rauer S , Gall P , Klose U ((2008) ) (1)H MR spectroscopy of inflammation, infection and ischemia of the brain. Eur J Radiol 67: , 250–257. |
[38] | Sira BL , Miller E , Artzi M , Fattal-Valevski A , Constantini S , Ben Bashat D ((2009) ) 1H-MRS for the diagnosis of acute disseminated encephalomyelitis: Insight into the acute-disease stage. Pediatr Radiol 40: , 106–113. |
[39] | Li K , Li J , Zheng J , Qin S ((2019) ) Reactive astrocytes in neurodegenerative diseases. Aging Dis 10: , 664–675. |
[40] | Young SP , Kapoor SR , Viant MR , Byrne JJ , Filer A , Buckley CD , Kitas GD , Raza K ((2013) ) The impact of inflammation on metabolomic profiles in patients with arthritis. Arthritis Rheum 65: , 2015–2023. |
[41] | Cocco E , Murgia F , Lorefice L , Barberini L , Poddighe S , Frau J , Fenu G , Coghe G , Murru MR , Murru R , Del Carratore F , Atzori L , Marrosu MG ((2016) ) (1)H-NMR analysis provides a metabolomic profile of patients with multiple sclerosis. Neurol Neuroimmunol Neuroinflamm 3: , e185. |
[42] | Kim HH , Jeong IH , Hyun JS , Kong BS , Kim HJ , Park SJ ((2017) ) Metabolomic profiling of CSF in multiple sclerosis and neuromyelitis optica spectrum disorder by nuclear magnetic resonance. PLoS One 12: , e0181758. |
[43] | Battini S , Bund C , Moussallieh FM , Cicek AE , De Seze J , Namer IJ ((2018) ) Metabolomics approaches in experimental allergic encephalomyelitis. J Neuroimmunol 314: , 94–100. |
[44] | French CD , Willoughby RE , Pan A , Wong SJ , Foley JF , Wheat LJ , Fernandez J , Encarnacion R , Ondrush JM , Fatteh N , Paez A , David D , Javaid W , Amzuta IG , Neilan AM , Robbins GK , Brunner AM , Hu WT , Mishchuk DO , Slupsky CM ((2018) ) NMR metabolomics of cerebrospinal fluid differentiates inflammatory diseases of the central nervous system. PLoS Negl Trop Dis 12: , e0007045. |
[45] | Jutley GS , Young SP ((2015) ) Metabolomics to identify biomarkers and as a predictive tool in inflammatory diseases. Best Pract Res Clin Rheumatol 29: , 770–782. |
[46] | Belanger M , Allaman I , Magistretti PJ ((2011) ) Brain energy metabolism: Focus on astrocyte-neuron metabolic cooperation. Cell Metab 14: , 724–738. |
[47] | Lananna BV , Nadarajah CJ , Izumo M , Cedeno MR , Xiong DD , Dimitry J , Tso CF , McKee CA , Griffin P , Sheehan PW , Haspel JA , Barres BA , Liddelow SA , Takahashi JS , Karatsoreos IN , Musiek ES ((2018) ) Cell-autonomous regulation of astrocyte activation by the circadian clock protein BMAL1. Cell Rep 25: , 1–9.e5. |
[48] | Kunieda T , Minamino T , Katsuno T , Tateno K , Nishi J , Miyauchi H , Orimo M , Okada S , Komuro I ((2006) ) Cellular senescence impairs circadian expression of clock genes in vitro and in vivo. Circ Res 98: , 532–539. |
[49] | Wyse CA , Coogan AN ((2010) ) Impact of aging on diurnal expression patterns of CLOCK and BMAL1 in the mouse brain. Brain Res 1337: , 21–31. |
[50] | Bellanti F , Iannelli G , Blonda M , Tamborra R , Villani R , Romano A , Calcagnini S , Mazzoccoli G , Vinciguerra M , Gaetani S , Giudetti AM , Vendemiale G , Cassano T , Serviddio G , Babiloni C ((2017) ) Alterations of clock gene RNA expression in brain regions of a triple transgenic model of Alzheimer’s disease. J Alzheimers Dis 59: , 615–631. |
[51] | Song H , Moon M , Choe HK , Han DH , Jang C , Kim A , Cho S , Kim K , Mook-Jung I ((2015) ) Abeta-induced degradation of BMAL1 and CBP leads to circadian rhythm disruption in Alzheimer’s disease. Mol Neurodegener 10: , 13. |
[52] | Pizarro A , Hayer K , Lahens NF , Hogenesch JB ((2013) ) CircaDB: A database of mammalian circadian gene expression profiles. Nucleic Acids Res 41: , D1009–D1013. |
[53] | Barca-Mayo O , Pons-Espinal M , Follert P , Armirotti A , Berdondini L , De Pietri Tonelli D ((2017) ) Astrocyte deletion of Bmal1 alters daily locomotor activity and cognitive functions via GABA signalling. Nat Commun 8: , 14336. |
[54] | Abrahamson EE , Moore RY ((2001) ) Suprachiasmatic nucleus in the mouse: Retinal innervation, intrinsic organization and efferent projections. Brain Res 916: , 172–191. |
[55] | Moldavan M , Cravetchi O , Williams M , Irwin RP , Aicher SA , Allen CN ((2015) ) Localization and expression of GABA transporters in the suprachiasmatic nucleus. Eur J Neurosci 42: , 3018–3032. |
[56] | Fuhrer TE , Palpagama TH , Waldvogel HJ , Synek BJL , Turner C , Faull RL , Kwakowsky A ((2017) ) Impaired expression of GABA transporters in the human Alzheimer’s disease hippocampus, subiculum, entorhinal cortex and superior temporal gyrus. Neuroscience 351: , 108–118. |
[57] | Tiwari V , Patel AB ((2012) ) Impaired glutamatergic and GABAergic function at early age in AbetaPPswe-PS1dE9 mice: Implications for Alzheimer’s disease. J Alzheimers Dis 28: , 765–769. |
[58] | Yin F , Sancheti H , Patil I , Cadenas E ((2016) ) Energy metabolism and inflammation in brain aging and Alzheimer’s disease. Free Radic Biol Med 100: , 108–122. |
[59] | Rey G , Valekunja UK , Feeney KA , Wulund L , Milev NB , Stangherlin A , Ansel-Bollepalli L , Velagapudi V , O’Neill JS , Reddy AB ((2016) ) The pentose phosphate pathway regulates the circadian clock. Cell Metab 24: , 462–473. |
[60] | Srinivasan R , Ratiney H , Hammond-Rosenbluth KE , Pelletier D , Nelson SJ ((2010) ) MR spectroscopic imaging of glutathione in the white and gray matter at 7 T with an application to multiple sclerosis. Magn Reson Imaging 28: , 163–170. |
[61] | Choi IY , Lee P , Hughes AJ , Denney DR , Lynch SG ((2016) ) Longitudinal changes of cerebral glutathione (GSH) levels associated with the clinical course of disease progression in patients with secondary progressive multiple sclerosis. Mult Scler J 23: , 956–962. |
[62] | Calabrese V , Giordano J , Crupi R , Di Paola R , Ruggieri M , Bianchini R , Ontario ML , Cuzzocrea S , Calabrese EJ ((2017) ) Hormesis, cellular stress response and neuroinflammation in schizophrenia: Early onset versus late onset state. J Neurosci Res 95: , 1182–1193. |
[63] | Sedlak TW , Paul BD , Parker GM , Hester LD , Snowman AM , Taniguchi Y , Kamiya A , Snyder SH , Sawa A ((2019) ) The glutathione cycle shapes synaptic glutamate activity. Proc Natl Acad Sci U S A 116: , 2701–2706. |
[64] | Shukla D , Mandal PK , Tripathi M , Vishwakarma G , Mishra R , Sandal K ((2020) ) Quantitation of in vivo brain glutathione conformers in cingulate cortex among age-matched control, MCI, and AD patients using MEGA-PRESS. Hum Brain Mapp 41: , 194–217. |
[65] | Weinberg SE , Sena LA , Chandel NS ((2015) ) Mitochondria in the regulation of innate and adaptive immunity. Immunity 42: , 406–417. |


