
Impact of the Severity of Alzheimer’s Disease on the Quality of Life, Activities of Daily Living, and Caregiving Costs for Institutionalized Patients on Anti-Alzheimer Medications in Japan
Abstract
Background:
Alzheimer’s disease (AD) increases societal costs and decreases the activities of daily living (ADL) and quality of life (QoL) of the affected individuals.
Objective:
We assess the impact of AD severity on ADL, QoL, and caregiving costs in Japanese facilities for the elderly.
Methods:
Patients with AD in facilities for the elderly were included (47 facilities, N = 3,461). The QoL, ADL, and disease severity of patients were assessed using Barthel Index (BI), EuroQoL-5D-5L (EQ-5D-5L), and Mini-Mental State Examination (MMSE), respectively. Annual caregiving costs were estimated using patients’ claims data. The patients were subcategorized into the following three groups according to the MMSE score: mild (21≤MMSE≤30), moderate (11≤MMSE≤20), and severe (0≤MMSE≤10). Changes among the three groups were evaluated using the Jonckheere-Terpstra test.
Results:
Four hundred and one participants were on anti-AD medicines, of whom 287 (age: 86.1±6.4 years, 76.7% women) in the mild (n = 53, 84.0±6.9 years, 71.7%), moderate (n = 118, 86.6±5.9 years, 76.3%), and severe (n = 116, 86.6±6.5 years, 79.3%) groups completed the study questionnaires. The mean BI and EQ-5D-5L scores for each group were 83.6, 65.1, and 32.8 and 0.801, 0.662, and 0.436, respectively. The mean annual caregiving costs were 2.111, 2.470, and 2.809 million JPY, respectively. As AD worsened, the BI and EQ-5D-5L scores decreased and annual caregiving costs increased significantly.
Conclusion:
AD severity has an impact on QoL, ADL, and caregiving costs.
INTRODUCTION
Dementia adversely affects mental functions such as thinking and memory as well as daily functioning. It is mainly categorized into four types: Alzheimer’s disease (AD), vascular dementia, dementia with Lewy bodies, and others [1]. Patients with dementia are mostly categorized as having AD; the proportion of these patients has been reported to be 60% –80% worldwide and 68% in Japan [2, 3]. The risk factors of AD include age, genetics, and smoking [4, 5].
The world’s population is gradually aging. As of 2019, the world’s population was estimated to be 7.7 billion, and individuals aged 65 years or higher accounted for approximately 9.1% of this population. By 2030, the world’s population is expected to be 8.5 billion and the≥65-year age group is expected to account for 11.7% of the population [6]. With the increased aging of the global population, the number of patients with AD is increasing. In 2015, there were 46.8 million patients with AD worldwide, and this number is expected to reach 74.7 million in 2030 [7]. Japan has one of the most aged populations in the world. The proportion of aged population is the highest in Japan globally [8]. The proportion of Japanese aged 65 years or higher was 28.4% as of 2019 and is expected to reach 31.2% by 2030 [9]. Consistent with this finding, the number of patients with AD in Japan is expected to increase. This number was 3 million in Japan in 2012 and will reach 5–6 million in 2030 [3, 10, 11].
The societal costs of dementia are increasing, in line with the increase in the number of AD patients in Japan. This cost was 14.5 trillion Japanese yen (JPY) in 2014, of which the caregiving cost was 6.4 trillion JPY and was higher than medical or informal care cost [12]. The long-term care insurance system in Japan is managed by the Ministry of Health, Labour and Welfare. Payment limits for caregiving services are determined by support/care levels. These support/care levels are classified into seven groups: support levels 1 and 2 and care levels 1–5 [13]. One of the most frequent reasons for care level certification in Japan is dementia, which is the number one cause of certifications of care levels 1, 2, and 3 and the second highest cause of those of care levels 4 and 5 [14].
The burden on caregivers increases with the severity of AD [15]. When the severity of AD increases to an extent that it badly affects daily functioning, patients’ activities of daily living (ADL) are impaired and they need help from others in managing their daily lives [16, 17]. As the severity of AD increases, patients’ ADL decreases and the burden on caregivers increases [18, 19]. Furthermore, the quality of life (QoL) of both patients and caregivers decreases [20, 21].
A few cross-sectional studies on the relationship between the severity of AD and ADL, QoL, and any cost have been conducted in Japan. One such study investigated the burden on caregivers and QoL of residents in nursing homes [22]. Moreover, there are fewer cohort studies about AD in Japan [3, 23], and to the best of our knowledge, thus far, no cohort study on the relationship between the severity of AD and outcomes such as ADL and QoL has been conducted in Japan. Therefore, in this study, we aimed to evaluate the impact of AD severity on QoL, ADL, and caregiving costs and their changes among facilities for the elderly in Japan.
METHODS
Study design
We enrolled people admitted to nursing homes or residential facilities with health and caregiving services for the elderly under Life Company Limited between March 2019 and March 2020 (47 facilities, N = 3,461). We focused only on patients who were on prescribed medicines for AD, specifically those who received donepezil, galantamine, rivastigmine, or memantine. Patients’ baseline demographic information, such as age, sex, and care level required, were derived from the database managed by Life Company Limited. Patients’ QoL, ADL, and severity of dementia were assessed in March 2019 and March 2020 by the staff working at the facilities using the Barthel Index (BI), EuroQoL-5D-5L-proxy (EQ-5D-5L), and Mini-Mental State Examination (MMSE), respectively.
Caregiving costs for residents were basically covered by the national caregiving insurance system, which was separated from the national health insurance system in 2000. Claims data for caregiving insurance system were stored in each institute. Monthly caregiving costs were derived from claims data of Life Company Limited in March 2019 and March 2020. The annual caregiving costs were estimated using monthly data in March 2019.
Questionnaire
Barthel Index
BI is an index used to assess ADL. BI was first used in 1955 and was published in 1965. Using BI, ADL was measured on a scale of 0 to 100, with higher scores indicating more independence from physical assistance [24].
EuroQoL-5D-5L-proxy
The EQ-5D-5L questionnaire was used to evaluate health-related QoL and was developed by the task force of the EuroQoL Group. Using EQ-5D-5L, health-related QoL was assessed on a scale of a negative value to 1, with 0 indicating death and 1 indicating a healthy status [25, 26]. Japanese tariff was developed in 2015. [27]. A fewer number of questions would be preferred, as the survey would be conducted during caregivers’ routine work. In a previous study, which was conducted in Japan, EQ-5D-5L was used to measure the QoL in relation to AD [15]. It is possible that QoL in relation to AD could be detected through EQ-5D-5L, and therefore, EQ-5D-5L was used in this study.
Mini-Mental State Examination
MMSE was used to measure cognitive ability. It was also used to assess the severity of dementia. The maximum score that could be achieved in MMSE is 30 [28]. MMSE has been introduced in the guidelines for the diagnosis of dementia in Japan [29]. Accordingly, patients with MMSE scores of 21–23, 11–20, and 0–10 were classified as having mild, moderate, and severe AD, respectively. Patients with scores of 24–27 were suspected of having mild cognitive impairment (MCI) [30, 31].
Data analysis
Overall, patients with MMSE scores of 24–30 were considered to have a mild disease because medicines for AD were prescribed for them, and score volatility was a possibility (Supplementary Figure 1). After classifying the patients based on their MMSE score, BI scores, EQ-5D-5L scores, and annual caregiving costs in March 2019 were assessed using the Jonckheere-Terpstra test [32–34]. A multiple regression analysis was performed after all variables were standardized using two combinations of variables. In the first combination, the EQ-5D-5L scores were considered the objective variable, and age, sex, BI scores, and MMSE scores were the explanatory variables. In the other combination, the annual caregiving cost was the objective variable, whereas age, sex, support/care level needed, BI scores, and MMSE scores were considered explanatory variables. Average differences in the EQ-5D-5L scores, BI scores, and annual caregiving costs between March 2019 and March 2020 were evaluated according to the classifications in March 2019 and March 2020 for residents who did not leave the facilities during this period. Statistical significance was set at a p-value of < 0.05 and all analyses were performed using Python version 3.7.7.
Ethics
This study was approved by the ethics committee of the Graduate School of Pharmaceutical Science, Faculty of Pharmaceutical Science, The University of Tokyo and informed consent was obtained from all participants when they decided to shift to facilities for the elderly run by Life Company Limited. If individuals were not capable of providing consent, as in the case of patients with severe AD, informed consent was obtained by a proxy from their family.
RESULTS
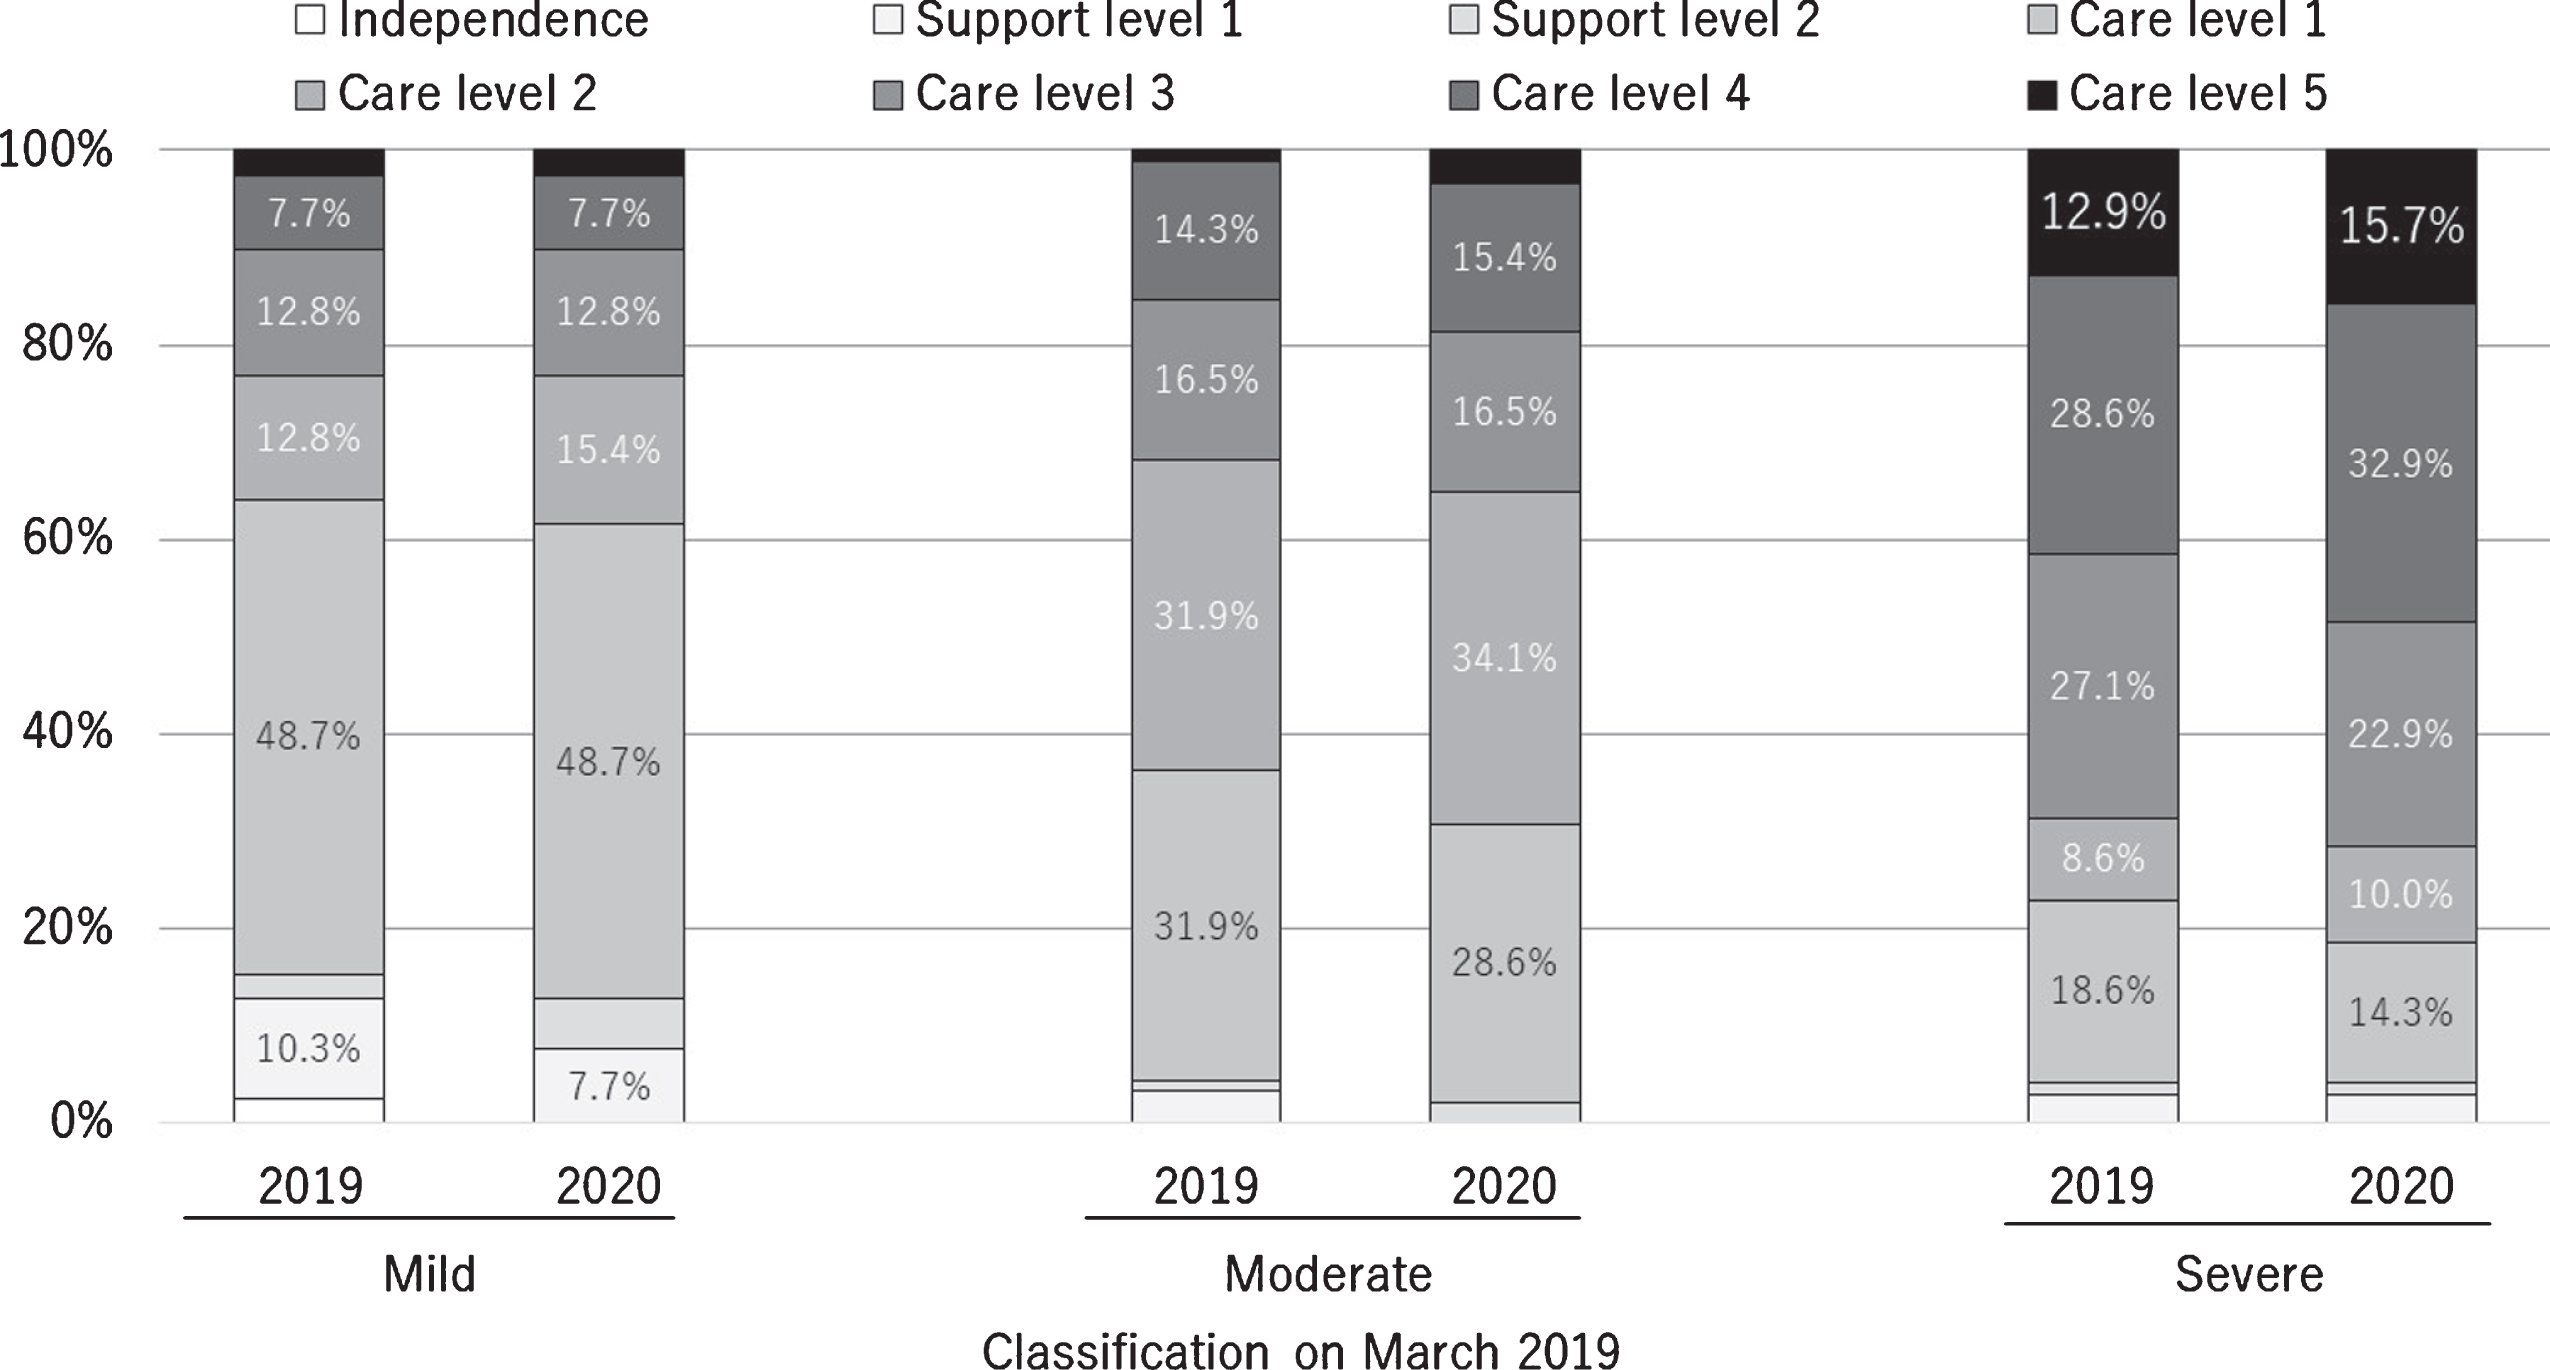
According to the patients’ prescriptions, 401 out of the 3,461 patients enrolled were prescribed medicines for AD in March 2019, and 287 (71.2%) of these completed the entire questionnaire. Two hundred seventy-five (71.1%) of the 401 records of caregiving activities were obtained in March 2019. The mean age of the patients in the mild, moderate, and severe groups and the corresponding proportions of women in these groups are shown in Table 1. The number of people according to disease severities in March 2019 and March 2020 is shown in Table 2. The changes in certification for support or care level are shown in Fig. 1.
Table 1
Characteristic of patients according to the severity of AD
| All | Mild | Moderate | Severe | |
| Number of people | 287 | 53 | 118 | 116 |
| Sex (Women %) | 76.7% | 71.7% | 76.3% | 79.3% |
| Age (y) (mean±SD) | 86.1±6.4 | 84.0±6.9 | 86.6±5.9 | 86.6±6.5 |
| Care level (level > 3, %) | 47.4% | 28.3% | 32.2% | 71.6% |
| Concomitant drugs (%) | ||||
| Antidiabetic | 17.1% | 15.1% | 16.9% | 18.1% |
| Antihypertensive | 67.9% | 64.2% | 75.4% | 62.1% |
| Antithrombotic | 27.5% | 26.4% | 27.1% | 28.4% |
| Laxative | 60.3% | 47.2% | 64.4% | 62.1% |
| Psychotropic | 47.4% | 47.2% | 47.5% | 47.% |
Table 2
Distribution of patients according to AD severity in March 2019 and 2020
| Classification in March 2020 | ||||
| Classification in March 2019 | Mild | Moderate | Severe | All |
| Mild | 11 | 9 | 3 | 23 |
| Moderate | 7 | 31 | 11 | 49 |
| Severe | 0 | 3 | 47 | 50 |
Fig. 1
Certifications for long-term care or support need in March 2019 and 2020 according to the severity of dementia in March 2019.
BI
The Jonckheere-Terpstra test showed that as AD severity worsened, the BI scores significantly decreased. The mean BI scores for the mild, moderate, and severe groups are shown in Table 3. The average difference in the BI scores between March 2019 and March 2020 (n = 112) are shown in Table 4.
EQ-5D-5L
The Jonckheere-Terpstra test revealed that as AD severity worsened, the EQ-5D-5L scores significantly decreased. The mean EQ-5D-5L scores for the mild, moderate, and severe groups are shown in Table 3. Based on the results of the multiple regression analysis, formula (1) was obtained (Table 5). The BI score was a significant variable, whereas sex, age, and MMSE scores were not. The average differences in the EQ-5D-5L score between March 2019 and March 2020 (n = 119) for the three groups are shown in Table 4.
(1)
Caregiving costs
The Jonckheere-Terpstra test showed that as the severity of AD worsened, annual caregiving costs significantly increased. The mean annual caregiving costs for the three groups are listed in Table 3. Based on the results of the multiple regression analysis, formula (2) was obtained (Table 5). Support/care level and MMSE scores were significant variables, whereas sex, age, and BI scores were not. The average differences in the annual caregiving costs between March 2019 and March 2020 (n = 95) for the three groups are shown in Table 4.
(2)
Table 3
Summary of the results in March 2019
| Jonckheere-Terpstra test | ||||||
| All | Mild | Moderate | Severe | z statistics | p | |
| BI score (mean±SD) | 55.4±33.8 | 83.6±20.2 | 65.1±26.9 | 32.8±30.7 | 10.25 | p < 0.001 |
| Number of patients | 287 | 53 | 118 | 116 | ||
| EQ-5D-5L score (mean±SD) | 0.596±0.265 | 0.801±0.223 | 0.662±0.229 | 0.436±0.222 | 9.22 | p < 0.001 |
| Number of patients | 287 | 53 | 118 | 116 | ||
| Caregiving costs (million JPY, mean) | 2.540±0.724 | 2.111±0.906 | 2.470±0.637 | 2.809±0.591 | 6.52 | p < 0.001 |
| Number of patients | 275 | 52 | 111 | 112 | ||
Table 4
Average differences in EQ-5D-5L scores, BI score, and caregiving costs between March 2019 and March 2020
| Classification in March 2020 | ||||
| All | Mild | Moderate | Severe | |
| BI score (mean) | ||||
| Mild | –9.8 | –2.3 | –11.1 | –33.3 |
| Number of patients | 23 | 11 | 9 | 3** |
| Moderate | –7.5 | 2.9 | –7.0 | –15.5 |
| Number of patients | 46 | 7 | 28 | 11 |
| Severe | –9.7 | NA* | 8.3 | –11.0 |
| Number of patients | 43 | 0 | 3** | 40 |
| EQ-5D-5L score (mean) | ||||
| Mild | –0.0778 | –0.00415 | –0.151 | –0.126 |
| Number of patients | 23 | 11 | 9 | 3** |
| Moderate | 0.00468 | 0.0561 | 0.0415 | –0.132 |
| Number of patients | 49 | 7 | 31 | 11 |
| Severe | –0.0152 | NA* | 0.124 | –0.0247 |
| Number of patients | 47 | 0 | 3** | 44 |
| Annual caregiving costs (JPY, mean) | ||||
| Mild | –3,356 | 79,794 | –41,027 | –102,210 |
| Number of patients | 16 | 6 | 8 | 2** |
| Moderate | 187,770 | 262,718 | 40,092 | 533,135 |
| Number of patients | 37 | 6 | 23 | 8 |
| Severe | 112,031 | NA* | 40,748 | 117,514 |
| Number of patients | 42 | 0 | 3** | 39 |
*Not available because no one was transferred from the severe group to the mild group. **Only few (less than 5) patients were observed.
Table 5
Results of the multiple regression analysis in March 2019
| Independent variable | Dependent variable | Coefficient | p |
| EQ-5D-5L | |||
| Sex* | 0.00564 | 0.844 | |
| Age | –0.0442 | 0.125 | |
| BI | 0.880 | < 0.001 | |
| MMSE | –0.00533 | 0.883 | |
| Constant | 4.163×10⁻¹⁷ | 1.000 | |
| Caregiving costs | |||
| Sex | 0.0672 | 0.190 | |
| Age | 0.0735 | 0.154 | |
| BI | –0.102 | 0.157 | |
| MMSE | –0.207 | 0.00130 | |
| Care-level-01*** | 0.279 | < 0.001 | |
| Care-level-02*** | 0.302 | < 0.001 | |
| Constant | –1.388×10⁻¹⁷ | 1.000 |
*Female: 1, Male: 0. **Dummy variables. Care need level_01, Care need level_02) = (1, 0) indicates independence, support level 1 or 2, (Care need level_01, Care need level_02) = (0, 1) indicates care level 1 or 2, and (Care need level_01, Care need level_02) = (1, 1) indicates care level 3, 4, or 5.
DISCUSSION
The objective of our study to evaluate the effects of severity of AD on ADL, QoL, and caregiving costs in Japanese facilities for the elderly. We found that as AD severity increased, ADL and QoL significantly decreased, and caregiving costs significantly increased. Moreover, it is possible that AD progression impaired ADL and QoL and increased caregiving costs with some exceptions.
The findings of our study are consistent with those reported previously, that is, ADL and QoL decrease according to the severity of AD [17–20]. However, the multiple regression analysis revealed that the MMSE score, which is the benchmark of AD severity, did not significantly affect the EQ-5D-5L score. It is known that the BI score strongly correlates with the EQ-5D-5L score [35, 36]. Moreover, the MMSE score correlates with the BI score. The effects of MMSE score on the EQ-5D-5L score are relatively lower than those of the BI score. Therefore, the MMSE scores were not significant (Table 5). Regardless of the severity of AD at the start of the study, ADL and QoL decreased as AD progressed (Table 4).
To our knowledge, this is the first study to show that caregiving costs in facilities for the elderly in Japan increase according to the severity of AD. The caregiving insurance systems in Japan are mainly of two types: in-home based service and institution-based service. The types of service are not defined via locations where services are provided but via location where patients’ daily lives are based on. Subsequently, some institutionalized individuals might be categorized to “in-home” services, as long as a regulatory agency regarded that their daily lives would be better in their homes.
Participants enrolled in our cohort were “institutionalized”; however, their services were provided via “in-home” service. The annual “in-home” care service per patient with dementia is reportedly 1.572 million JPY [12], which is lower than 2.540 million JPY in the present study. This is because Sado et al. included the type of service provided to patients in their homes.
The mean annual caregiving costs of nursing homes or residential facilities with health and caregiving services for the elderly were estimated to be 2.388 million JPY using the statistics from the Ministry of Health, Labour and Welfare [37]. Caregiving costs reported in this study are consistent with this value. Further studies on the relationship between the caregiving costs of various types of care services and AD progression are warranted.
The result of the statistical test, that is, caregiving costs increase according to the severity of AD, is consistent with the result of the multiple regression analysis, in which caregiving cost was the objective variable. As the MMSE score decreases, indicating worsening of AD, the caregiving costs increase (Table 5). The caregiving costs of the moderate and severe groups in March 2019 increased as AD progressed. However, that of the mild group did not increase. This is partially because the number of patients in each group classified by AD severity in March 2019 and 2020 was not sufficient to detect the effect of disease progression on the caregiving costs. The extent of increase in the caregiving costs for the moderate group was higher than that for the remaining two groups. This is partially due to the existence of the “ceiling” or the upper limit of monthly caregiving costs covered by the public caregiving insurance system. The ceiling value varies depending on one’s caregiving level. The difference in value was higher between levels 2 and 3 (73,000 JPY) than between levels 3 and 4 (39,000 JPY) and between levels 4 and 5 (52,000 JPY) [13]. Given that more people were already receiving care of level 3 or higher initially in the severe group, the annual difference in caregiving costs might be higher for the moderate group. The range of change was likely to be smaller in the severe group, which already had a higher proportion.
Our study focused only on patients who were prescribed medicines for AD. This is because we excluded the other causes of cognitive impairment, such as schizophrenia and depression [29]. We found that some patients were prescribed AD medications while they showed MCI or were normal based on their MMSE scores. This finding is attributable to various reasons, such as the volatility of the MMSE score (i.e., MMSE scores might occasionally be higher for “true” AD patients) or false-positive results, whereby patients without AD might be misdiagnosed with AD and receive anti-AD medications (Supplementary Table 1).
There were four main limitations to our study. First, patients with AD were defined based on the prescription of anti-AD medications. Therefore, patients with AD not taking medications would be excluded. On the contrary, patients with dementias other than AD, such as vascular dementia or dementia with Lewy bodies, prescribed with anti-AD medications would be included as patients with AD. While not so many patients would be misclassified into AD patients, generalizability issues should be considered when the results extrapolated to a broader setting. Second, this study was conducted in facilities for the elderly in Japan. It has been reported that the QoL of patients with AD differs from that of patients who receive care services [38]. The care service cost also differs based on the type of service [13]. Therefore, the results of this study should be interpreted carefully before considering their application in all patients with AD. Third, there could be confounding factors other than the severity of AD. According to the prescription data in March 2019, there was no significant difference in comorbidities among the three groups. Furthermore, there was no significant difference in the health statuses between March 2019 and March 2020 (Table 1, Supplementary Table 2). However, it is impossible to assert that there are no factors other than those derived from prescriptions that could significantly affect the study results. Finally, some residents who participated in this study in March 2019 moved out of the residential facilities by March 2020. This could have affected the study results.
In conclusion, as AD worsens, outcomes such as ADL and QoL worsen and caregiving costs increase. This study is unique in that it is the first study in Japan to evaluate the impact of the severity of AD on outcomes and caregiving costs over time, in addition to conducting a cross-sectional evaluation. Despite the limitations, the findings of this study are significant. Further research is warranted to provide epidemiological or economic evidence for the impact of dementia, which could facilitate a discussion on the allocation of scarce healthcare resources in a super-aged society in the near future.
ACKNOWLEDGMENTS
We are grateful to the residents and caregivers of the facilities run by Life Company Limited included in this study. We are also grateful to Hiroshi Yoshihara, researcher in the University of Tokyo, for the support in digitizing prescription data by developing the image recognition program.
This study was funded by Eisai Co., Ltd. and Biogen Inc.
Authors’ disclosures available online (https://www.j-alz.com/manuscript-disclosures/20-1514r1).
SUPPLEMENTARY MATERIAL
[1] The supplementary material is available in the electronic version of this article: https://dx.doi.org/10.3233/JAD-201514.
REFERENCES
[1] | World Health Organization (2020) ICD-11. https://icd.who.int/en, Last updated September, 2020, Accessed on October 15, 2020. |
[2] | Alzheimer’s Association ((2016) ) Alzheimer’s disease facts and figures. Alzheimers Dement 12: , 459–509. |
[3] | Toshiharu N , Yutaka K ((2015) ) A study on the estimated future population of the elderly with dementia in Japan. https://mhlw-grants.niph.go.jp/niph/search/NIDD00.do?resrchNum=201405037A, Last updated 13 March 2015, Accessed on October 15, 2020. |
[4] | Hersi M , Irvine B , Gupta P , Gomes J , Birkett N , Krewski D ((2017) ) Risk factors associated with the onset and progression of Alzheimer’s disease: A systematic review of the evidence. Neurotoxicology 61: , 143–187. |
[5] | Armstrong R ((2019) ) Risk factors for Alzheimer’s disease. Folia Neuropathol 57: , 87–105. |
[6] | United Nations (2019) World Population Prospects 2019. https://population.un.org/wpp/, Accessed on October 15, 2020. |
[7] | Alzheimer’s Disease International (2015) World Alzheimer Report 2015 The Global Impact of Dementia. https://www.alz.co.uk/research/world-report-2015, Accessed on October 15, 2020. |
[8] | Statistics of Bureau of Japan (2018) Elderly people in international comparison, https://www.stat.go.jp/data/topics/topi1135.html Last updated 16 September 2018, Accessed on October 15, 2020. |
[9] | Statistics of Bureau of Japan (2018) Elderly population, https://www.stat.go.jp/data/topics/topi1131.html, Last updated 16 September 2018, Accessed on October 15, 2020. |
[10] | Sekita A , Ninomiya T , Tanizaki Y , Doi Y , Hata J , Yonemoto K , Arima H , Sasaki K , Iida M , Iwaki T , Kanba S , Kiyohara Y ((2010) ) Trends in prevalence of Alzheimer’s disease and vascular dementia in a Japanese community: The Hisayama Study. Acta Psychiatr Scand 122: , 319–325 |
[11] | Asada T ((2012) ) Prevalence of dementia in Japan: Past, present and future. Rinsho Shinkeigaku 52: , 962–964. Japanese. |
[12] | Sado M , Ninomiya A , Shikimoto R , Ikeda B , Baba T , Yoshimura K , Mimura M ((2018) ) The estimated cost of dementia in Japan, the most aged society in the world. PLoS One 13: , e0206508. |
[13] | Ministry of Health, Labour and Welfare (2010) Annual Health, Labour and Welfare Report 2009-2010 10. Health and Welfare Services for the Elderly. https://www.mhlw.go.jp/english/wp/wp-hw4/10.html, Accessed on October 15, 2020. |
[14] | Ministry of Health, Labour andWelfare (2019) Comprehensive survey of living conditions 2019. https://www.mhlw.go.jp/toukei/saikin/hw/k-tyosa/k-tyosa19/, Accessed on October 15, 2020. |
[15] | Nakanishi M , Igarashi A , Ueda K , Brnabic AJM , Treuer T , Sato M , Kahle-Wrobleski K , Meguro K , Yamada M , Mimura M , Arai H ((2020) ) Costs and resource use associated with community-dwelling patients with Alzheimer’s disease in Japan: Baseline results from the prospective observational GERAS-J study.. J Alzheimers Dis 74: , 127–138. |
[16] | American Psychiatric Association (2013) Diagnostic and Statistical Manual of Mental Disorders, Fifth Edition. Arlington, VA, American Psychiatric Association. |
[17] | McKhann GM , Knopman DS , Chertkow H , Hyman BT , Jack CR Jr , Kawas CH , Klunk WE , Koroshetz WJ , Manly JJ , Mayeux R , Mohs RC , Morris JC , Rossor MN , Scheltens P , Carrillo MC , Thies B , Weintraub S , Phelps CH ((2011) ) The diagnosis of dementia due to Alzheimer’s disease: Recommendations from the National Institute on Aging-Alzheimer’s Association workgroups on diagnostic guidelines for Alzheimer’s disease. Alzheimers Dement 7: , 263–269. |
[18] | Kawaharada R , Sugimoto T , Matsuda N , Tsuboi Y , Sakurai T , Ono R ((2019) ) Impact of loss of independence in activities of daily living on caregiver burden in patients with Alzheimer’s disease: A retrospective cohort study. Geriatr Gerontol Int 19: , 1243–1247 basic. |
[19] | Sun M , Mainland BJ , Ornstein TJ , Mallya S , Fiocco AJ , Sin GL , Shulman KI , Herrmann N ((2018) ) The association between cognitive fluctuations and activities of daily living and quality of life among institutionalized patients with dementia. Int J Geriatr Psychiatry 33: , e280–e285. |
[20] | Montgomery W , Goren A , Kahle-Wrobleski K , Nakamura T , Ueda K ((2018) ) Alzheimer’s disease severity and its association with patient and caregiver quality of life in Japan: Results of a community-based survey. BMC Geriatr 18: , 141. |
[21] | Cordner Z , Blass DM , Rabins PV , Black BS ((2010) ) Quality of life in nursing home residents with advanced dementia. J Am Geriatr Soc 58: , 2394–400. |
[22] | Nakanishi M , Nakashima T , Sawamura K ((2012) ) Quality of life of residents with dementia in a group-living situation: An approach to creating small, homelike environments in traditional nursing homes in Japan. Nihon Koshu Eisei Zasshi 59: , 3–10. |
[23] | Dodge HH , Buracchio TJ , Fisher GG , Kiyohara Y , Meguro K , Tanizaki Y , Kaye JA ((2102) ) Trends in the prevalence of dementia in Japan. Int J Alzheimers Dis 2012: , 956354. |
[24] | Mahoney F , Barthel DW ((1965) ) Functional evaluation: The Barthel Index. Md State Med J 14: , 61–65. |
[25] | Herdman M , Gudex C , Lloyd A , Janssen M , Kind P , Parkin D , Bonsel G , Badia X ((2011) ) Development and preliminary testing of the new five-level version of EQ-5D (EQ-5D-5L). Qual Life Res 20: , 1727–1736. |
[26] | Brooks R ((1996) ) EuroQol: The current state of play. Health Policy 37: , 53–72. |
[27] | Ikeda S , Shiroiwa T , Igarashi A , Shinichi N , Fukuda T , Saito S , Shimozuma K ((2015) ) Developing a Japanese version of the EQ-5D-5L value set. J Natl Inst Public Health 64: , 47–55. |
[28] | Folstein MF , Folstein SE , McHugh PR ((1975) ) “Mini-mental state.” A practical method for grading the cognitive state of patients for clinicians. J Psychiatr Res 12: , 189–198. |
[29] | Japanese Society of Neurology (2017) Diagnostic Guidelines for Dementia. https://www.neurology-jp.org/guidelinem/nintisyo_2017.html, Last updated 2017. Accessed on October 15, 2020 |
[30] | Perneczky R , Wagenpfeil S , Komossa K , Grimmer T , Diehl J , Kurz A ((2006) ) Mapping scores onto stages: Mini-Mental State Examination and Clinical Dementia Rating. Am J Geriatr Psychiatry 14: , 139–144. |
[31] | Saxton J , Morrow L , Eschman A , Archer G , Luther J , Zuccolotto A ((2009) ) Computer assessment of mild cognitive impairment. Postgrad Med 121: , 177–185. |
[32] | Jonckheere AR ((1954) ) A distribution-free k-sample test against ordered alternatives. Biometrika 41: , 133–145. |
[33] | Terpstra TJ ((1952) ) The asymptotic normality and consistency of Kendall’s test against trend, when ties are present in one ranking. Indagationes Math 55: , 327–333. |
[34] | Pirie W ((2006) ) Ordered Alternatives, Jonckheere Tests for. In Encyclopedia of Statistical Sciences. John Wiley & Sons, Inc. |
[35] | Kaambwa B , Billingham L , Bryan S ((2013) ) Mapping utility scores from the Barthel index.. Eur J Health Econ 14: , 231–241. |
[36] | Singh J , Pokhrel S , Longworth L ((2018) ) Can social care needs and well-being be explained by the EQ-5D? Analysis of the Health Survey for England. Value Health 21: , 830–838. |
[37] | Ministry of Health, Labour and Welfare (2019) Statistics of Long-term Care Benefit Expenditure March 2019. https://www.mhlw.go.jp/toukei/saikin/hw/kaigo/kyufu/2019/03.html, Accessed on January 19, 2021. |
[38] | Heßmann P , Seeberg G , Reese JP , Dams J , Baum E , Müller MJ , Dodel R , Balzer-Geldsetzer M ((2016) ) Health-related quality of life in patients with Alzheimer’s disease in different German health care settings. J Alzheimers Dis 51: , 545–561. |


