
Characterizing Global and Regional Brain Structures in Amnestic Mild Cognitive Impairment Among Rural Residents: A Population-Based Study
Abstract
Background:
Structural brain magnetic resonance imaging (MRI) scans may provide reliable neuroimaging markers for defining amnestic mild cognitive impairment (aMCI).
Objective:
We sought to characterize global and regional brain structures of aMCI among rural-dwelling older adults with limited education in China.
Methods:
This population-based study included 180 participants (aged≥65 years, 42 with aMCI and 138 normal controls) in the Shandong Yanggu Study of Aging and Dementia during 2014–2016. We defined aMCI following the Petersen’s criteria. Global and regional brain volumes were automatically segmented on MRI scans and compared using a region-of-interest approach. Data were analyzed using general linear regression models.
Results:
Multi-adjusted β-coefficient (95% confidence interval) of brain volumes (cm3) associated with aMCI was –12.07 (–21.49, –2.64) for global grey matter (GM), –18.31 (–28.45, –8.17) for global white matter (WM), 28.17 (12.83, 44.07) for cerebrospinal fluid (CSF), and 2.20 (0.24, 4.16) for white matter hyperintensities (WMH). Furthermore, aMCI was significantly associated with lower GM volumes in bilateral superior temporal gyri, thalamus and right cuneus, and lower WM volumes in lateral areas extending from the frontal to the parietal, temporal, and occipital lobes, as well as right hippocampus (p < 0.05).
Conclusion:
Brain structure of older adults with aMCI is characterized by reduced global GM and WM volumes, enlarged CSF volume, increased WMH burden, reduced GM volumes in bilateral superior temporal gyri, thalamus, and right cuneus, and widespread reductions of lateral WM volumes.
INTRODUCTION
Mild cognitive impairment (MCI) is usually consi-dered a transitional stage between normal aging and dementia [1]. Amnestic MCI (aMCI) is the most com-mon form of MCI, characterized by low performance in episodic memory isolated or in combination with other cognitive domains in elderly people [2]. The in-sidious onset of aMCI complicates clinical detection in early stage, thus preventing effective interventions from its progression to dementia or Alzheimer’s disease. Structural magnetic resonance imaging (MRI) may provide reliable brain imaging markers for timely detection and differentiation of MCI subtypes, thus, facilitating early therapeutic and preventive in-terventions [3].
The quantitative volumetric analysis on selected brain regions has revealed that people with aMCI show reduced volumes in the bilateral hippocampi, amygdalae, frontal, occipital, and temporal lobes, cingulate gyrus, and insular region [4]. Likewise, voxel-based case-control studies have indicated that, compared to normal controls, patients with aMCI showed reduced grey matter (GM) volume mainly confined to the hippocampus, thalamus, and parahippocampal gyrus [5–7]. In addition, the region of interest (ROI) approach has been used to capture subtle structural brain alterations associated with MCI [8, 9]. Indeed, the atlas-based ROI approach can be applied to quantifying the global and regional volumes of GM, white matter (WM), and cerebro-spinal fluid (CSF). A ROI-based case-control study has identified GM atrophy in patients with MCI in the hippocampus, parahippocampal cortex, cingulate, amygdala, and frontal and precentral regions [10]. By contrast, studies on WM volumetric alterations in patients with aMCI have yielded conflicting results, with some studies showing no differences in WM volumes between patients with aMCI and healthy controls [11], whereas others indicating smaller WM volume in the temporal region in patients with aMCI compared to normal controls [12]. Furthermore, patients with aMCI showed higher loads of periventricular white matter hyperintensities (WMHs) than cognitively normal controls [13]. Most of the previous studies on structural brain alterations of aMCI have been conducted among highly educated elderly patients in clinical settings, where the findings may not be generalizable to the community-dwelling older adults with no to little formal education. It has been well established that cognitive phenotypes in older adults vary with educational attainment at a given load of structural brain damage [14]. In addition, brain structures of older adults may vary by different educational attainments. For instance, the cross-sectional data from the French Three-Cities Study showed that higher educational attainment was associated with larger volumes of GM in tem-poroparietal and frontal lobes, and WM [15]. Therefore, characterizing brain structures of aMCI among rural-dwelling older adults with no or limited education is highly relevant.
Thus, in this population-based study, we sought to characterize the global and regional brain structures of people with aMCI who were living in the rural communities with limited educational attainment in China.
METHODS
Study design and participants
This is a population-based case-control study. The study participants were derived from the Shandong Yanggu Study of Aging and Dementia that targeted people who were aged 65 years and older and living in the rural communities of Yanlou Town, Yanggu County, western Shandong Province, China. Briefly, the two-phase examination procedure was implemented in the study in August 2014-September 2015. At phase I (a screening phase, August-December 2014), 3,277 eligible participants underwent face-to-face interviews and clinical examination, during which the Mini-Mental State Examination (MMSE) and the Ascertain Dementia 8-item Questionnaire (AD8) were used to screen for global cognitive im-pairment. The MMSE score ≤24 or AD8 score ≥2 was considered screening positive [16, 17]. Then, a total of 1,981 participants who were positive in either screening test at phase I were eligible for phase II examination (a clinical phase) that included comprehensive clinical and neuropsychological ass-essments. From December 2014 to September 2015, 997 (50.3% of participants who were positive in either screening test at phase I) eventually accomplished the phase II assessment. Neuropsychological assessments at phase II included administration of the Auditory Verbal Learning Test (short-term delayed recall, long-term delayed recall, category-cued recall and recognition) for episodic memory, the Fuld Object Memory Evaluation, the Category Verbal Fluency test and the Boston Naming Test for language, the Trail Making Test and Stroop interference test for executive function, the Wechsler Memory Scale-III Forward Digit Span and Backward Digit Span for attention, the Wechsler block design test and the Clock Drawing Test for visuospatial ability, the Functional Activities Questionnaire (FAQ) for instrumental activities of daily living, the Hamilton Depression Rating Scale, and the Hachinski Ischemic Score.
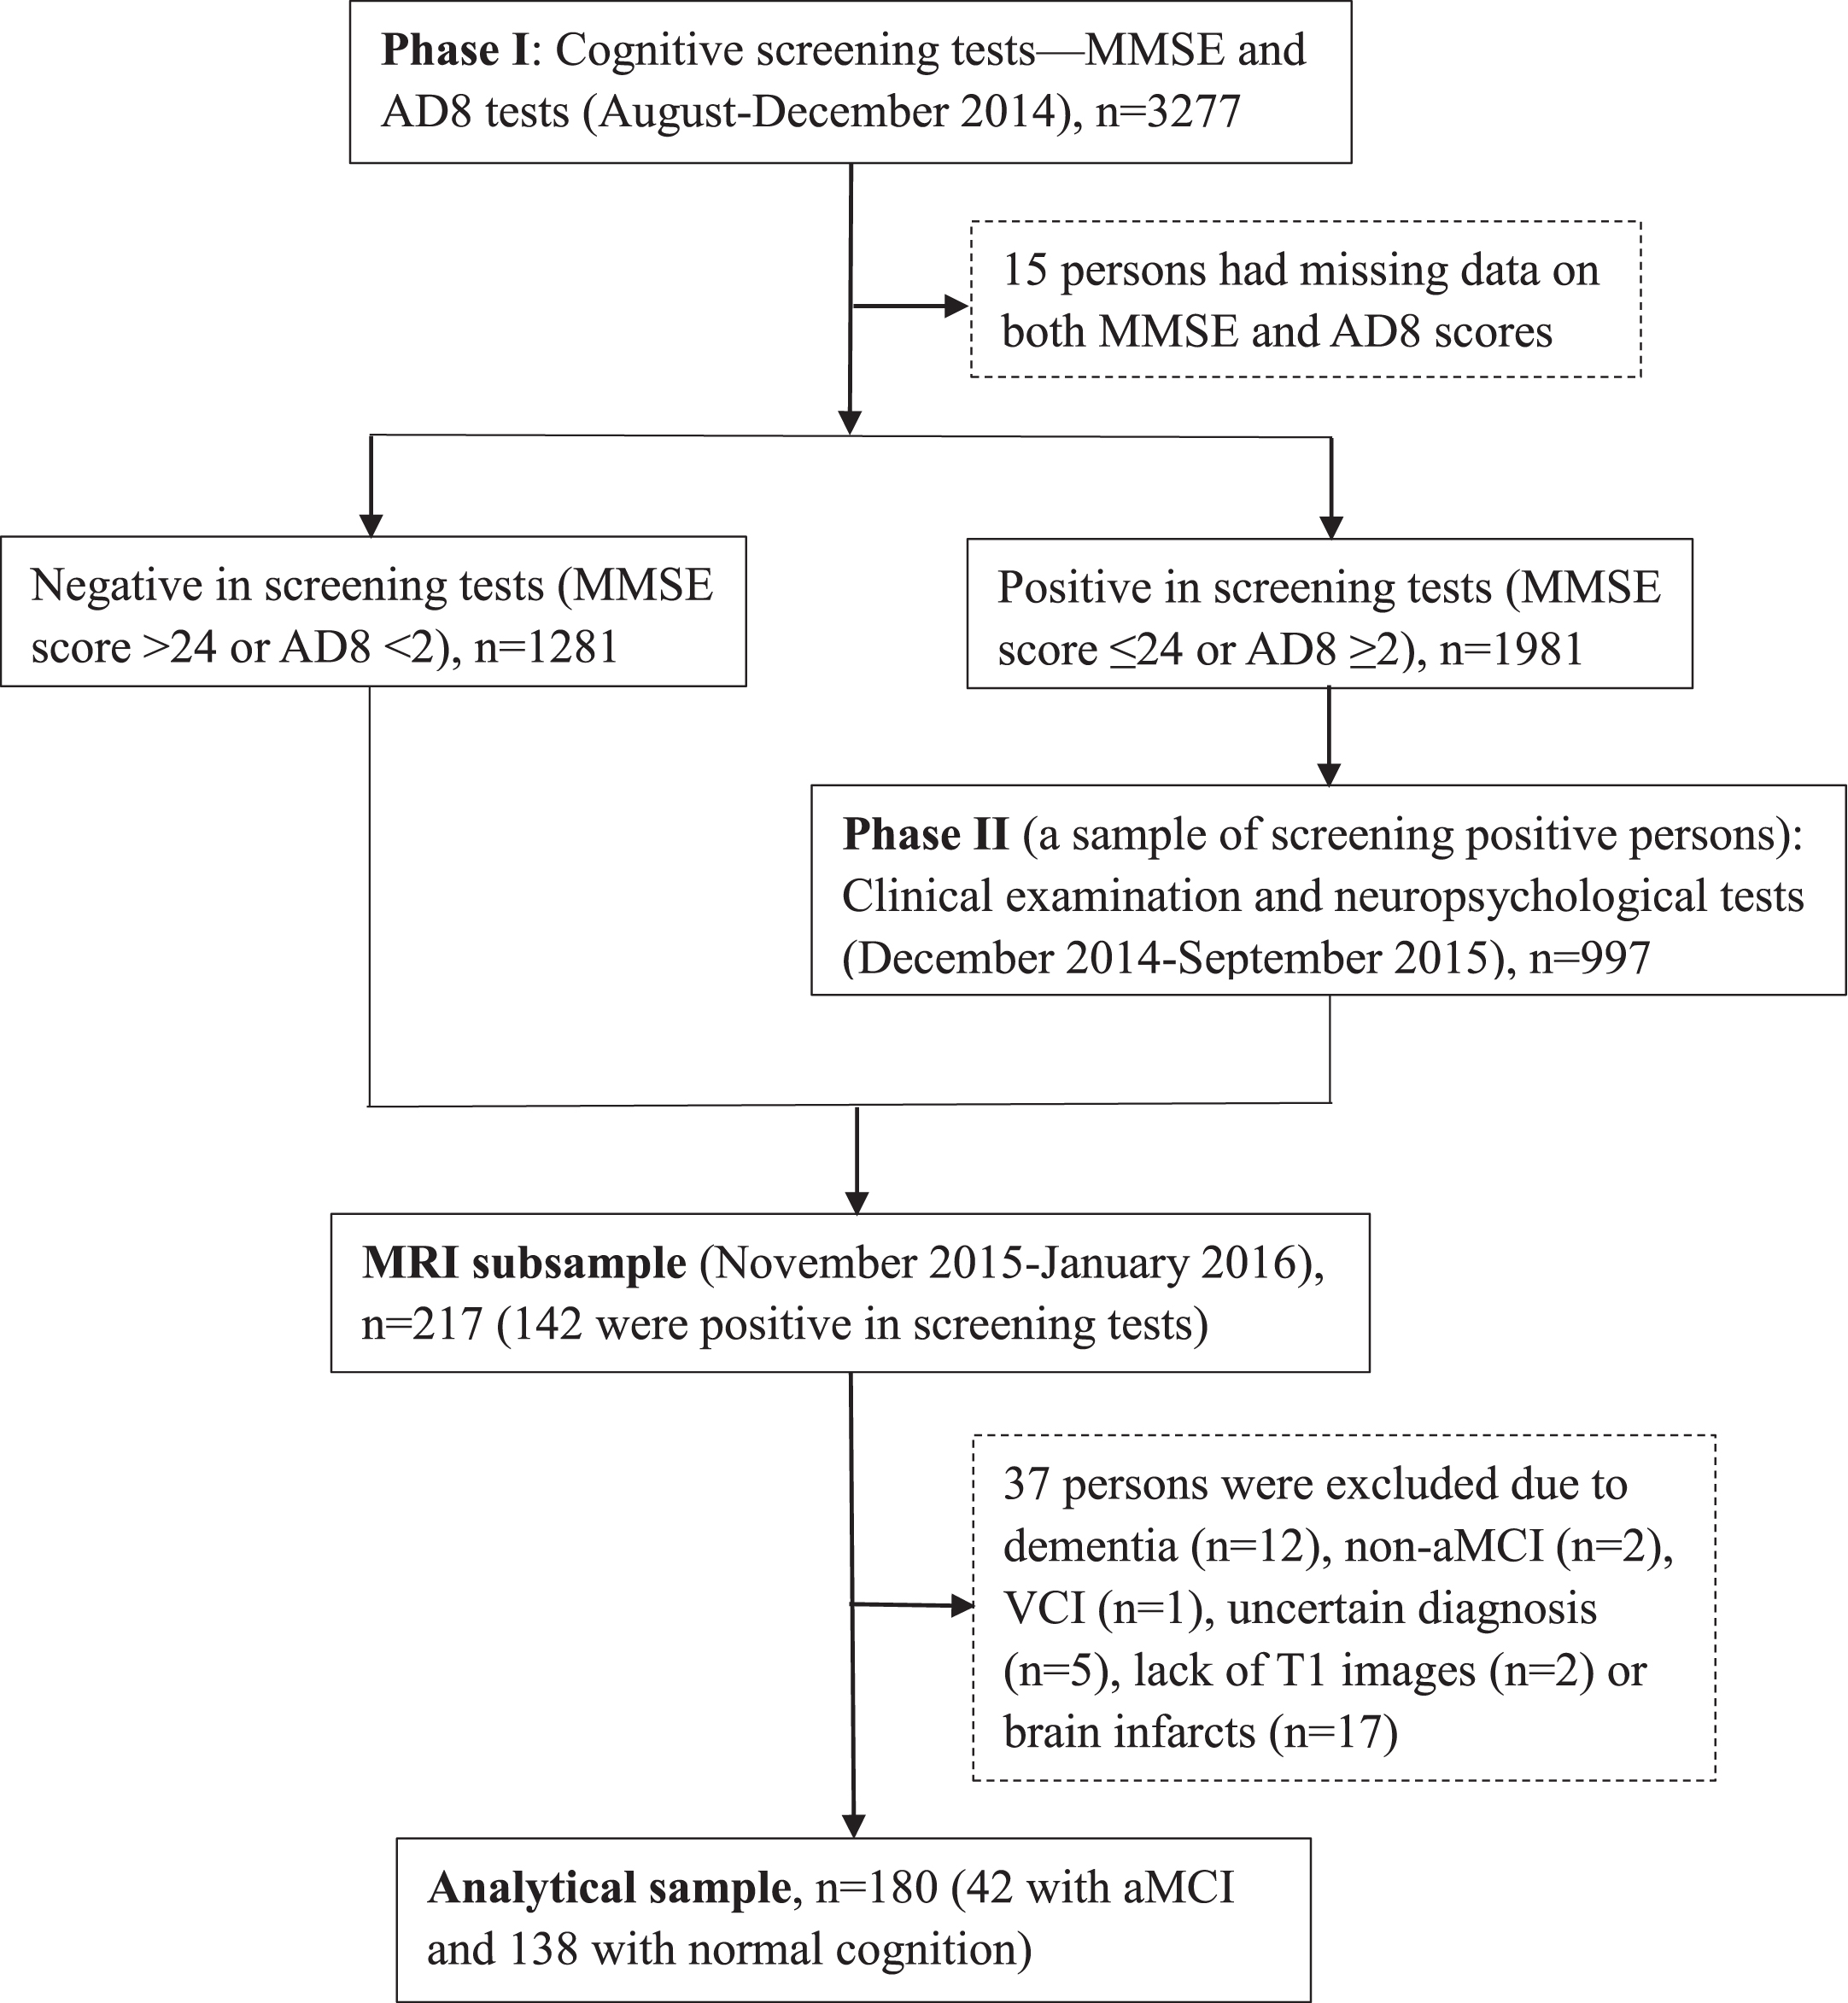
Following the clinical phase, 217 individuals were invited and agreed to undertake brain MRI scan in November 2015-January 2016. Of these, 37 persons were excluded due to dementia (n = 12), non-aMCI (n = 2), vascular cognitive impairment (n = 1), uncertain diagnosis (n = 5), lack of T1-weighted images (n = 2) or brain infarcts on FLAIR and T2-weighted images (n = 17, 2 with dementia and 1 with uncertain diagnosis) that might affect the reliable assessment of brain tissue volumes, leaving 180 persons for the current analysis. Figure 1 shows the flowchart of the study participants.
Fig. 1
Flowchart of the study participants. MMSE, Mini-Mental State Examination; AD8, Ascertain Dementia 8-item Questionnaire; MRI, magnetic resonance imaging; aMCI, amnestic mild cognitive impairment; VCI, vascular cognitive impairment.
The protocol of the Shandong Yanggu Study of Aging and Dementia was reviewed and approved by the Ethics Committee on Human Experimentation at Shandong Provincial Hospital affiliated to Shandong University in Jinan, Shandong. Written informed consents were obtained from all participants, or if the participants were not able to give the consent, from the informants.
Data collection and assessments
Trained medical staff collected data through face-to-face interviews and neuropsychological testing. Data included demographics (e.g., age, sex, and edu-cation), lifestyles (e.g., smoking, alcohol consumption, and physical exercise), health history (e.g., hypertension, diabetes, and high cholesterol level). We categorized education as illiterate, elementary school, and middle school or above, smoking and alcohol intake as ever versus never, and physical exercise as at least weekly versus less than weekly. We measured arterial blood pressure on the right upper arm in a seated position after a 5 min rest using an electronic blood pressure monitor. We defined hypertension as systolic pressure ≥140 mm Hg or diastolic pressure ≥90 mm Hg, or having the self-reported history of hypertension. We defined diabetes according to the self-reported history of diabetes diagnosed by a physician or fasting blood glucose ≥7.0 mmol/L. We defined hyperlipidemia as total serum cholesterol ≥6.2 mmol/L or triglyceride ≥2.3 mmol/L, or low-density lipoprotein cholesterol ≥4.1 mmol/L, or high-density lipoprotein cholesterol <1.0 mmol/L, or having a self-reported history of hyperlipidemia.
Following the phase II examination, senior neurologists specialized in dementia care and treatment made diagnosis of dementia according to the Diagnostic and Statistical Manual of Mental Disorders, 4th edition, criteria (DSM-IV) [18], after reviewing all records from face-to-face interviews, clinical examination, and neuropsychological testing, as previously reported [19].
aMCI was defined by the two neurologists (L.C. and H.T.) via reviewing all records from the face-to-face interviews, clinical examination, and compre-hensive assessments of sub-cognitive domains, following the Petersen’s criteria [20]: 1) Memory complaint or concern corroborated by the subject or an informant, assessed by response to the question: “Do you have daily problems with thinking or memory”; 2) Objective memory impairment beyond normal aging, according to performance of memory test (Auditory Verbal Learning Test) and consensus agreement among the two neurologists; 3) Preserved global cognitive function assessed by the education-based MMSE score (MMSE score > 17 for illiteracy, >20 for elementary school, or >22 for middle school or above) [21]; 4) Normal functional activities assessed by FAQ (FAQ score <6) [19]; and 5) Absence of dementia according to the DSM-IV criteria [18].
MRI acquisition and imaging assessment protocols
All participants were scanned at one of the three MRI centers in Liaocheng, Shandong. The common core MRI protocol included the 3D T1-weighted, T2-weighted, and 3D fluid attenuated inversion re-covery (FLAIR) sequences. In the Liaocheng Third People’s Hospital (GE Healthcare-Signa 1.5T, USA), the parameters for the T1-weighted sequence were: repetition time (TR) = 10.12 ms, echo time (TE) = 3.25 ms, thickness = 1.20 mm, spatial resolution = 0.60×0.60×0.60 mm3. In the Liaocheng People’s Hospital (Philips-Achieva 3.0T, The Netherlands), the T1-weighted sequence parameters were: TR = 6.90 ms, TE = 3.20 ms, thickness = 1.10 mm, spatial resolution = 1.10×1.10×1.10 mm3. In the Liaoch-eng Brain Hospital (Siemens-Magnetom Avanto 1.5T, Germany), we used the following parameters: TR = 2400 ms, TE = 3.60 ms, thickness = 1.20 mm, spatial resolution = 1.30×1.30×1.20 mm3.
We used the 3D T1-weighted images to quantify the global and regional brain volumes. Global and regional brain volumes were segmented via the Computational Anatomy Toolbox (CAT12) in Matlab (http://dbm.neuro.uni-jena.de/cat12/). CAT12 used the a standard brain template of Montreal Neurolo-gical Institute to automatically normalize the skull-st-ripping brain, estimate the total intracranial volumes (ICV), and segment brain tissues into GM, WM, and CSF based on the Adaptive Maximum A Posteriori technique [22, 23], and automatically detect the WMHs. Then, we extracted the regional volumes of GM and WM according to the Hammers atlas for external analysis [24].
Statistical analysis
Table 1
Characteristics of the study participants
| Characteristics | Total sample (n = 180) | Normal controls (n = 138) | People with aMCI (n = 42) | p* |
| Age (y), mean (SD) | 69.23 (3.73) | 68.86 (3.51) | 70.43 (4.20) | 0.219 |
| Female | 72 (40.00) | 47 (34.06) | 25 (59.52) | 0.003 |
| Education levels | <0.001 | |||
| Illiterate | 43 (23.89) | 24 (17.39) | 19 (45.24) | |
| Primary school | 74 (41.11) | 58 (42.03) | 16 (38.10) | |
| Middle school or above | 63 (35.00) | 56 (40.58) | 7 (16.67) | |
| Occupation | 0.015 | |||
| Farmers | 149 (82.78) | 109 (78.99) | 40 (95.24) | |
| Non-farmers | 31 (17.22) | 29 (21.01) | 2 (4.76) | |
| Physical exercise | 0.031 | |||
| Weekly | 99 (55.00) | 82 (59.42) | 17 (40.48) | |
| Less than weekly | 81 (45.00) | 56 (40.58) | 25 (59.52) | |
| Ever smoking | 88 (48.89) | 74 (53.62) | 14 (33.33) | 0.021 |
| Ever alcohol intake | 101 (56.11) | 83 (60.14) | 18 (42.86) | 0.048 |
| Hypertension | 121 (67.22) | 89 (64.49) | 32 (76.19) | 0.157 |
| Hyperlipidemia | 47 (26.11) | 35 (25.36) | 12 (28.57) | 0.678 |
| Diabetes mellitus | 28 (15.56) | 21 (15.22) | 7 (16.67) | 0.820 |
| MRI center | 0.956 | |||
| Liaocheng 3rd People’s Hospital | 67 (37.22) | 52 (37.68) | 15 (35.71) | |
| Liaocheng Brain Hospital | 61 (33.89) | 46 (33.33) | 15 (35.71) | |
| Liaocheng People’s Hospital | 52 (28.89) | 40 (28.99) | 12 (28.57) | |
| MMSE score, mean (SD) | 25.21 (4.77) | 26.50 (4.21) | 20.98 (4.02) | <0.001 |
| AD8 score, mean (SD) | 1.79 (1.43) | 1.58 (1.35) | 2.48 (1.49) | 0.006 |
Data were n (%), unless otherwise specified. aMCI, amnestic mild cognitive impairment; MMSE, Mini-Mental State Examination; AD8, Ascertain Dementia 8-item Questionnaire. *p-value was for the test of differences between people with aMCI and cognitively normal controls.
We compared the characteristics of study participants by aMCI status using nonparametric Kol-mogorov-Smirnov test for continuous variables and χ2 tests for categorical variables. We used the gen-eral linear regression models to estimate β coefficient and 95% confidence interval of global measures of brain volumes (i.e., ICV, GM, WM, CSF, and WMH) associated with aMCI, in which we reported the main results from two models: model 1 was adjusted for age, sex, education, occupation, scan centers, and, if applicable, for ICV; model 2 was additionally adjusted for physical exercise, smoking, alcohol intake, hypertension, diabetes and hyperli-pidemia. Furthermore, we performed the full-fac-torial design model (masking threshold = 0.001) to compare the differences of voxel-based volumetric brain measures by aMCI status, while controlling for age, sex, education, occupation, ICV, MRI centers, physical exercise, smoking, alcohol intake, hypertension, diabetes, and hyperlipidemia. Then, we performed the ROI-based analysis to identify the brain regions with significant differences in voxel-based volumes between people with and without aMCI, in which the significance level was controlled for false discovery rate (FDR). Finally, for all significant group-difference brain regions, we employed multiple general linear regression models to further assess the volumetric differences between the two groups of persons with and without aMCI.
CAT12 Toolbox was used for both the full factorial design and the ROI-based analyses. Stata Statistical Software: Release 16 for Windows (StataCorp LLC., College Station, TX, USA) was used for the other statistical procedures.
RESULTS
Characteristics of study participants
The mean age of the 180 participants was 69.23 (3.73) years, 40% were female, and nearly two-thirds attended no formal school or only primary school. Compared to the normal controls, people with aMCI were more likely to be female and farmers, less educated, and were less likely to do physical exercise, smoke, and consume alcohol (p < 0.050). As expected, the aMCI group had a lower mean MMSE score and a higher mean AD8 score than the control group (p≤0.006). The two groups did not differ significantly in mean age and the distribution of MRI centers and chronic diseases (p > 0.050).
Global measures of brain structure
Compared to normal controls, people with aMCI had reduced volumes of total GM and total WM but higher volumes of CSF and WMH, even when controlling for multiple potential confounders (p < 0.005, Table 2). The two groups did not differ significantly in ICV.
Table 2
Associations of amnestic mild cognitive impairment with global measures of brain structure
| Brain measures | Brain volumes (cm3), mean (SD) | β coefficient (95% confidence interval) | ||
| Normal controls (n = 138) | People with aMCI (n = 42) | Model 1a | Model 2a | |
| Total ICV | 1359.50 (133.55) | 1298.20 (141.48) | –11.81 (–50.53, 26.91) | –11.04 (–49.82, 27.74) |
| GM volume | 533.75 (53.94) | 500.30 (48.78) | –12.05 (–21.23, –2.87)* | –12.07 (–21.49, –2.64)* |
| WM volume | 464.25 (51.49) | 423.86 (45.07) | –18.22 (–28.19, –8.24)‡ | –18.31 (–28.45, –8.17)‡ |
| CSF volume | 358.39 (62.82) | 367.38 (76.55) | 27.70 (12.11, 43.28)‡ | 28.17 (12.83, 44.07)‡ |
| WMH volume | 4.11 (5.11) | 6.66 (7.52) | 2.57 (0.65, 4.49)† | 2.20 (0.24, 4.16)* |
aMCI, amnestic mild cognitive impairment; ICV, intracranial volume; GM, grey matter; WM, white matter; CSF, cerebrospinal fluid; WMH, white matter hyperintensities. aModel 1 was controlled for age, sex, education, occupation, MRI centers, and, if applicable, for total intracranial volume; model 2 was additionally adjusted for ever smoking, alcohol intake, physical exercise, hypertension, diabetes, and hyperlipidemia. *p < 0.05, †p < 0.01, ‡p < 0.001.
Regional grey matter and white matter volumes
After controlling for multiple potential confou-nders, people with aMCI had significantly reduced GM volumes in the bilateral superior temporal reg-ions and thalamus, and right cuneus (FDR corrected p < 0.05, Table 3 and Fig. 2A).
Table 3
Associations of amnestic mild cognitive impairment with regional grey and white matter volume
| Brain regions | Brain volumes (cm3), mean (SD) | β coefficient (95% confidence interval)a | FDR corrected p-value | |
| Normal controls (n = 138) | People with aMCI (n = 42) | |||
| Grey matter | ||||
| Superior temporal gyrus | ||||
| Left | 5.55 (0.79) | 4.96 (0.68) | –0.40 (–0.64, –0.16)† | 0.016 |
| Right | 6.10 (0.96) | 5.51 (0.63) | –0.40 (–0.68, –0.12)† | 0.025 |
| Cuneus | ||||
| Right | 4.48 (0.59) | 4.06 (0.52) | –0.28 (–0.46, –0.09)† | 0.025 |
| Thalamus | ||||
| Left | 5.04 (0.64) | 4.66 (0.65) | –0.31 (–0.54, –0.09)† | 0.025 |
| Right | 5.17 (0.64) | 4.70 (0.59) | –0.38 (–0.60, –0.17)‡ | 0.008 |
| White matter | ||||
| Superior frontal | ||||
| Left | 21.43 (3.01) | 19.21 (2.34) | –1.04 (–1.83, –0.25)* | 0.025 |
| Right | 20.56 (2.93) | 18.45 (2.31) | –1.07 (–1.83, –0.32)† | 0.023 |
| Middle frontal | ||||
| Left | 21.18 (2.87) | 18.72 (2.29) | –1.33 (–2.05, –0.61)‡ | 0.005 |
| Right | 20.58 (3.19) | 18.28 (2.33) | –1.22 (–1.98, –0.46)† | 0.009 |
| Inferior frontal | ||||
| Left | 5.41 (0.73) | 4.76 (0.62) | –0.40 (–0.62, –0.18)‡ | 0.005 |
| Right | –0.29 (–0.54, –0.04)‡ | 0.037 | ||
| Orbito-frontal | ||||
| Left | 5.48 (0.74) | 4.95 (0.64) | –0.23 (–0.42, –0.04)* | 0.037 |
| Right | 5.73 (0.82) | 5.14 (0.75) | –0.27 (–0.47, –0.07)† | 0.023 |
| Superior temporal | ||||
| Left | 5.46 (0.75) | 4.90 (0.58) | –0.37 (–0.57, –0.17)‡ | 0.005 |
| Right | 5.48 (0.85) | 4.91 (0.56) | –0.36 (–0.59, –0.14)† | 0.009 |
| Posterior temporal | ||||
| Left | 17.03 (1.93) | 15.48 (1.78) | –0.81 (–1.30, –0.32)† | 0.009 |
| Right | 16.75 (2.45) | 15.26 (1.80) | –0.67 (–1.27, –0.07)* | 0.044 |
| Inferior lateral parietal | ||||
| Left | 14.40 (1.87) | 12.94 (1.59) | –0.79 (–1.29, –0.30)† | 0.009 |
| Right | 14.34 (2.23) | 12.90 (1.79) | –0.74 (–1.34, –0.14)* | 0.031 |
| Lateral occipital | ||||
| Left | 16.31 (2.14) | 14.97 (1.88) | –0.64 (–1.18, –0.09)* | 0.037 |
| Right | 16.13 (2.53) | 14.71 (1.67) | –0.81 (–1.41, –0.20)* | 0.025 |
| Lingual | ||||
| Left | 4.24 (0.61) | 3.83 (0.59) | –0.23 (–0.42, –0.04)* | 0.031 |
| Precentral | ||||
| Left | 18.10 (2.44) | 16.59 (1.69) | –0.79 (–1.43, –0.15)* | 0.031 |
| Right | 17.72 (2.61) | 16.07 (1.79) | –0.82 (–1.42, –0.22)† | 0.023 |
| Postcentral | ||||
| Right | 13.08 (1.93) | 11.80 (1.29) | –0.62 (–1.06, –0.18)† | 0.023 |
| Hippocampus | ||||
| Right | 2.27 (0.30) | 2.08 (0.28) | –0.02 (–0.03, 0.00)† | 0.023 |
aMCI, amnestic mild cognitive impairment; FDR, false discovery rate. aThe general linear regression model was adjusted for age, sex, education, occupation, ever smoking, alcohol intake, hypertension, diabetes, hyperlipidemia, total intracranial volume, and MRI centers. *p < 0.05, †p < 0.01, ‡p < 0.001.
Fig. 2
Voxel-wise comparisons of regional grey matter and white matter volumes between people with and without amnestic mild cognitive impairment. Regional volumes were lower in the aMCI group (n = 42) compared with normal controls (n = 138) after controlling for age, sex, education, occupation, ever smoking, alcohol intake, physical exercise, hypertension, diabetes, hyperlipidemia, total intracranial volume, and MRI centers. A) Regional GM volume (e.g., bilateral temporal gyri and thalamus) was reduced in the aMCI group compared with normal controls after FDR correction. B) Regional WM volume (e.g., bilateral frontal and superior temporal areas) was reduced in the aMCI group compared with cognitively normal controls.
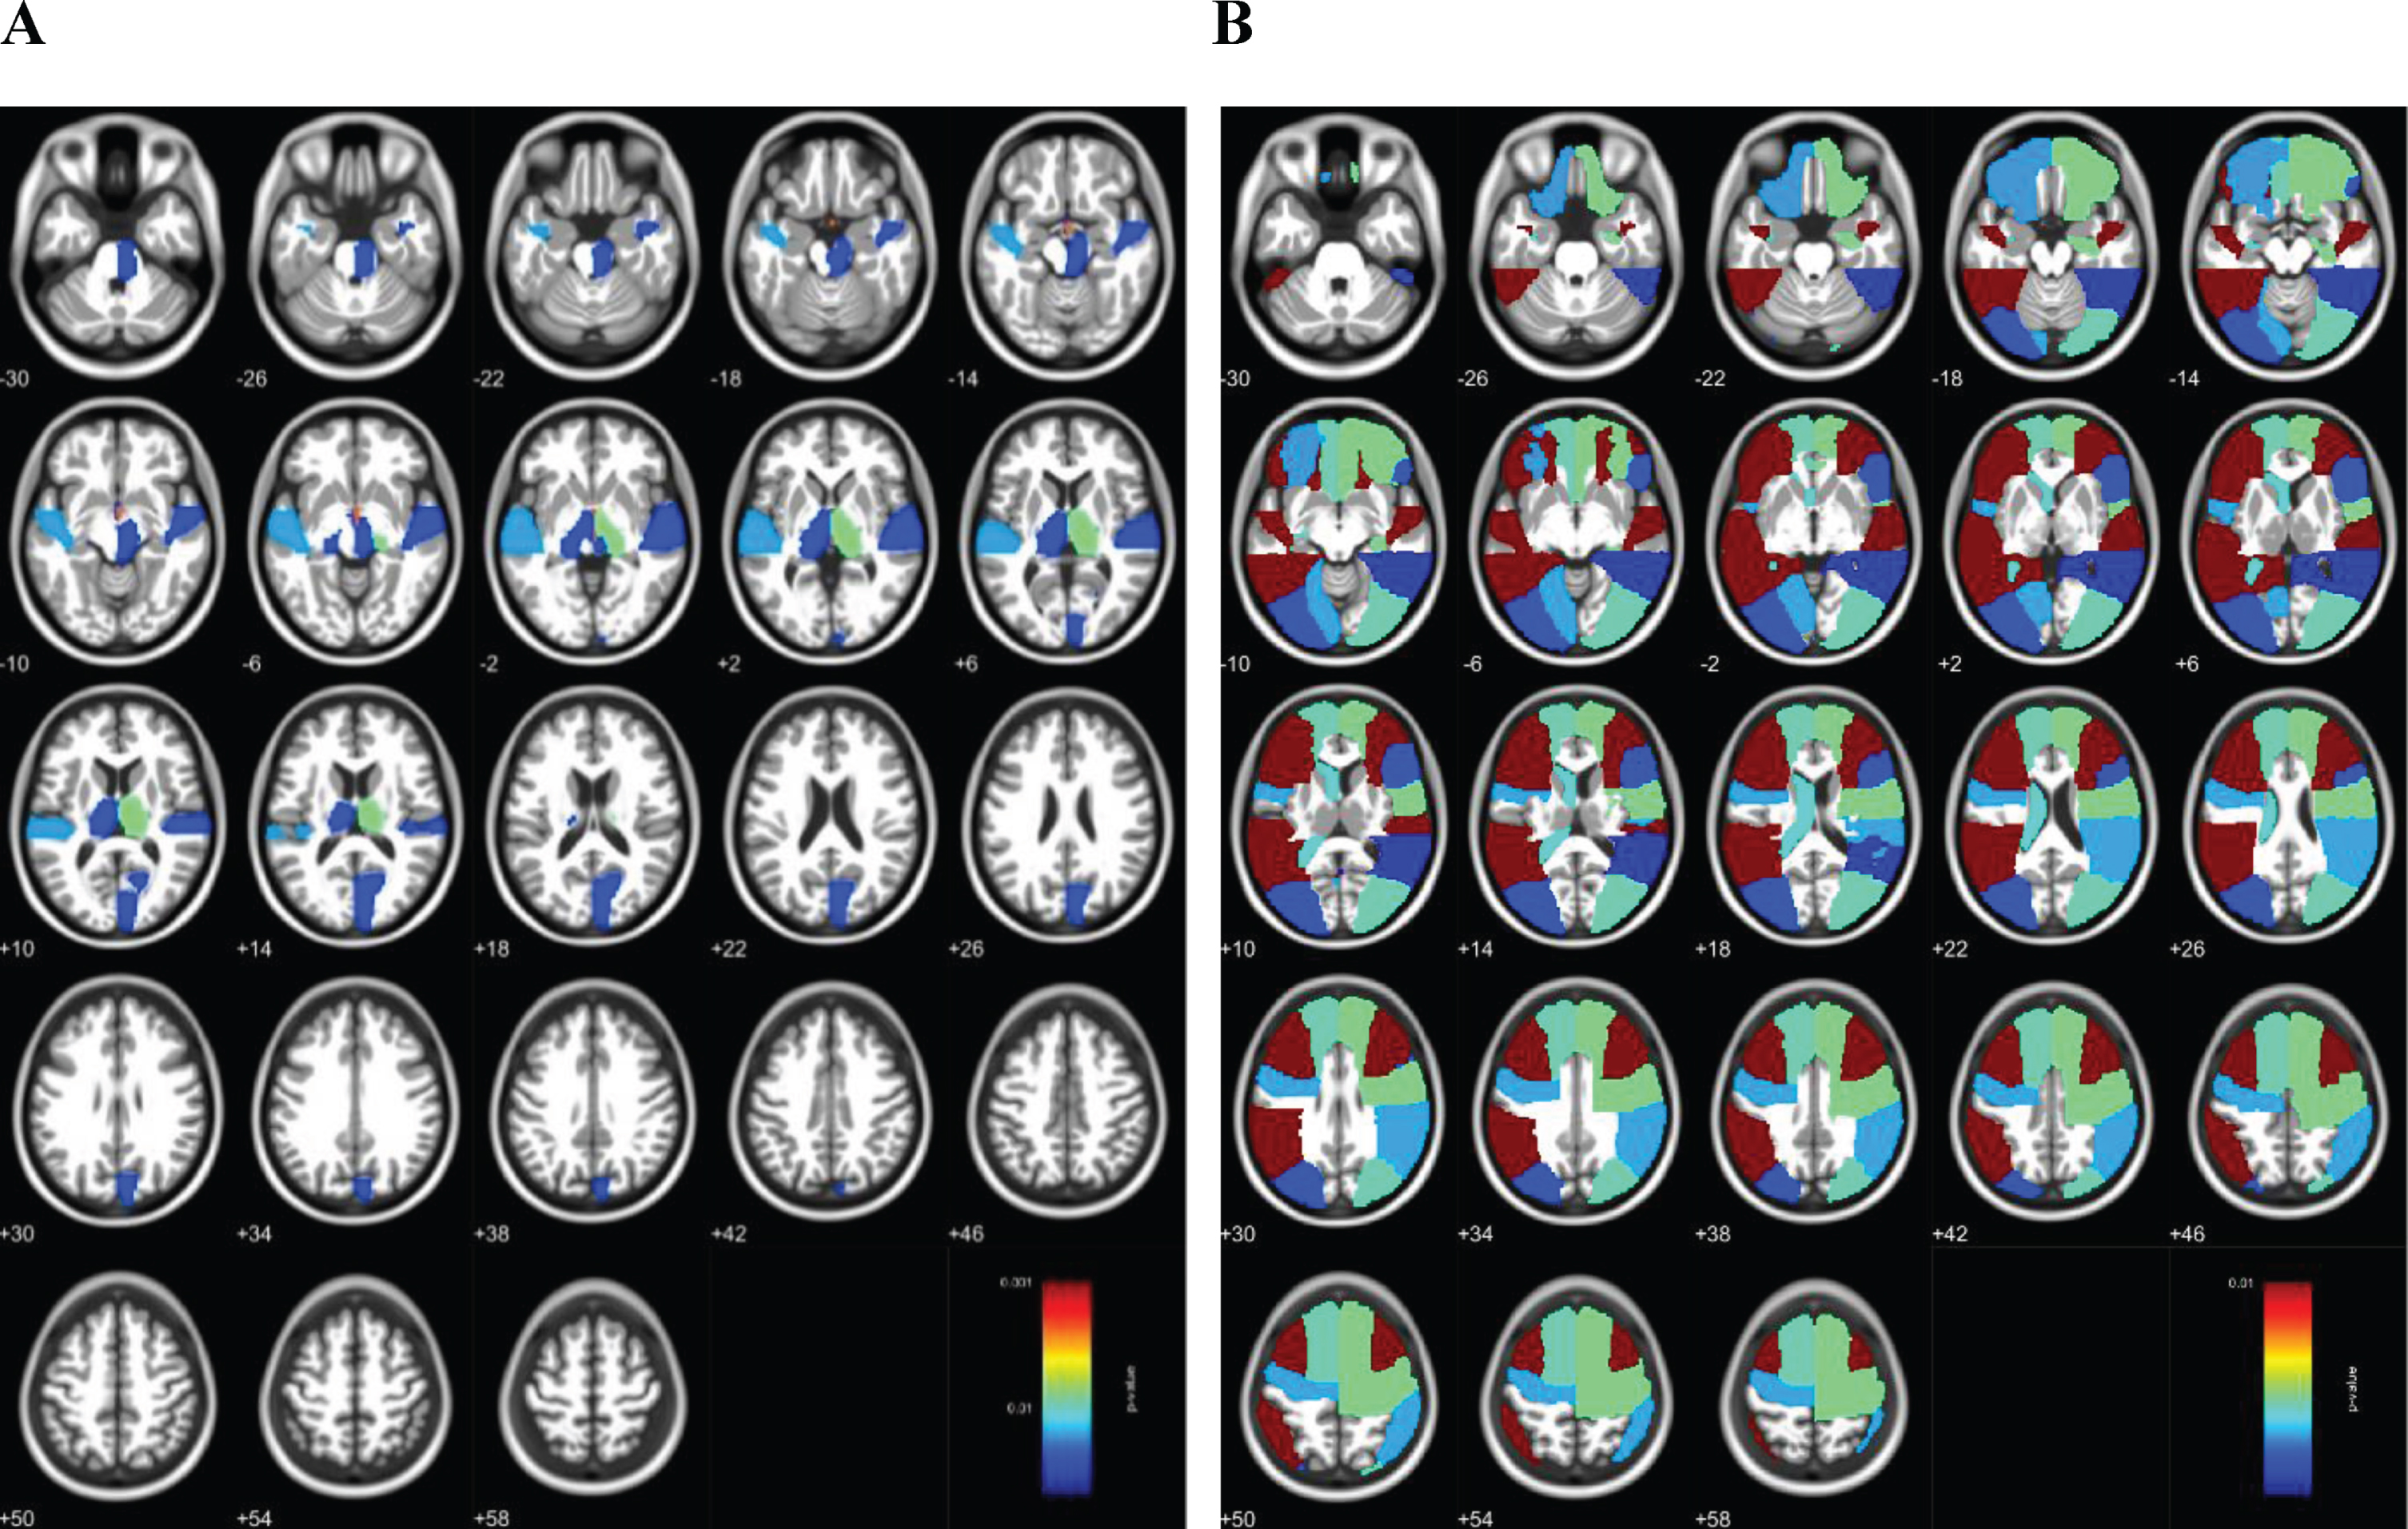
Compared to normal controls, the aMCI group had significantly lower WM volumes primarily in bilateral superior, middle, inferior and orbito-frontal areas, bilateral superior temporal gyri, posterior temporal lobes, inferior lateral parietal lobes, lateral occipital lobes, left lingual gyrus, bilateral precentral and right postcentral gyri, and right hippocampus in both the ROI-based analysis and the multiple-variable adjusted general linear regression analysis (FDR corrected p < 0.05, Table 3 and Fig. 2B).
DISCUSSION
In this population-based study of rural-dwelling older adults with no or limited education in China, we found that people with aMCI displayed lower global GM and WM volumes, enlarged CSF volume, and higher WMH burden compared to cognitively normal controls. Furthermore, GM volumes of people with aMCI were lower than controls in the bilateral superior temporal gyri and thalamus, and right cuneus. Finally, people with aMCI had reduced WM volume mainly in widespread lateral regions, encompassing frontal to parietal, temporal, and occipital lobes, which were more extensive compared to the reduced GM volumes in the lateral cortical regions.
Previously, the population-based Sydney Memory and Ageing Study of highly educated older adults (e.g., average years of formal education >10) indicated that the atrophic GM regions in patients with aMCI involved the hippocampus bilaterally and temporal lobes [7]. Likewise, a clinical-based study of Chinese elderly (average years of formal education >9) found an association of aMCI with reduced GM volume mainly in frontal, temporal, and parietal lobes, as well as precuneus and cingulate gyrus [25], but not in the hippocampus and thalamus that are often considered as the early signs of aMCI [26]. A meta-analysis of 22 case-control studies showed a similar pattern of brain atrophy between MCI and aMCI in the amygdalae and hippocampi, left medial temporal pole, as well as the precuneus bilaterally, but patients with aMCI exhibited additional atrophy in left superior temporal gyrus and left thalamus [27]. Overall, our population-based study showed reduced GM volumes in the superior temporal gyrus and thalamus of people with aMCI, which was in line with the previous studies, and further identified additional GM regions that were affected in older adults with aMCI who were living in the rural communities and had limited educational attainments.
Our population-based study indicated the regional WM alterations in patients with aMCI, such as red-uced volumes in frontal, temporal, and parietal lobes. Population-based studies of regional WM volumetric alterations in aMCI are rare. The diffusion tensor imaging data from the Sydney Memory and Ageing Study suggested that older adults who would develop aMCI in the subsequent two years presented reduced WM integrity in frontal, parietal, and subcortical regions, compared to those who remained cognitively normal [28], which was consistent with our findings of volumetric analysis. This study also suggested that loss of WM integrity might occur at the pre-aMCI stage. Nevertheless, the potential mechanisms and usefulness of structural WM alterations in defining aMCI among older adults deserves further inve-stigation.
This population-based study showed that people with aMCI had a heavier global WMH burden than cognitively normal controls, independent of vascular risk factors. WMH load has been linked with impairment in cognitive domains such as attention, processing speed, and executive function, but the correlation of WMH load with memory impairment seems less consistent [29, 30]. A community-based case-control study from the Mayo Clinic also suggested that patients with aMCI had a greater WMH burden than cognitively normal people [31]. Additionally, WMH load was related to conversion from normal cognition to MCI [32]. Thus, the severity of WMH may be associated with aMCI, although this association may be less prominent than that of brain atrophy [33, 34].
A neuropathological study suggested that patients with aMCI showed increased neuritic plaques and neurofibrillary tangles in frontal, parietal, temporal lobes, and hippocampal and entorhinal regions [35], which supports the view that aMCI represents a transitional stage from normal brain aging to Alzheimer’s disease. In addition, a fluorodeoxyglucose-positron emission tomography (FDG-PET) imaging study indicated that patients with aMCI showed hypom-etabolism in the medial temporal lobe and fronto-limbic regions [36]. Taken together, evidence from the neuropathological and metabolic imaging studies support the characteristics of structural brain alterations identified in our study.
This population-based study targeted the rural-dwelling older adults with no to little formal educ-ation, to whom the research communities have paid little attention so far. Furthermore, the population-based design allowed to capture very mild aMCI cases compared with studies performed in clinical settings. In addition, aMCI was defined based on clinical examination and comprehensive neuropsychological assessments. Our study also has limitations. First, the relatively small sample size as well as inclusion of mild aMCI cases from the general elderly population setting limited the potential to detect subtle differences in some measures of global and regional brain structures between people with aMCI and healthy controls. In addition, we do not have any biomarkers (e.g., CSF or plasma amyloid-β) or molecular imaging markers (e.g., brain amyloid PET imaging) to characterize the neuropathological basis of structural brain differences between people with aMCI and healthy controls. Finally, volumetric brain measures were assessed using three different MRI scanners with different parameters, which might affect the results, although the distributions of aMCI cases and healthy controls did not differ across the centers and we also controlled for the MRI centers in our analyses.
CONCLUSION
This population-based study of the rural-dwelling older adults with limited educational attainments revealed that brain structure of people with aMCI was characterized by reduced global GM and WM volumes, enlarged CSF volume, higher WMH load, lower GM volumes in bilateral superior temporal gyri, thalamus and right cuneus, and lower WM volume in widespread lateral regions. These findings may have implications for early detection of aMCI among rural residents with limited education.
ACKNOWLEDGMENTS
We would like to thank all the study participants. We are grateful to the staff of the Yanlou Town Hospital of Yanggu County, the Liaocheng People’s Hospital, the Liaocheng Third People’s Hospital, and the Liaocheng Brain Hospital in Shandong for their collaborations in the data collection and brain MRI examinations.
The Shandong Yanggu Study of Aging and Dem-entia was financially supported by the Science and Technology Program for Public Wellbeing of Shandong Province, China (grant no. 2013kjhm180405). The present work was supported in part by additional grants from the National Key Research & Develo-pment Program of China (grant no.: 2017YFC1310100), the Shandong Provincial Key Research & Development Plan (Y.D., grant no.: 2016ZDJS07A11), the Natural Science Foundation of Shandong Province (Y.D., grant no.: ZR2015HM011; Y.W., grant no.: BS2015YY001), the National Natural Science Foundation of China (Y.W., grant no.: 81501099, the Sino-Sweden Joint Project (Y.D. grant no.: 81861138008), the China Postdoctoral Science Foundation (Y.W., grant no.: 2015M580593), and the Taishan Scholar Program of Shandong Province, China. C.Q. received grants from the Swedish Research Council (grants no.: 2017-00740, 2017-05819, and 2020-01574) for the Sino-Sweden Network and Research Projects, the Swedish Foundation for International Cooperation in Research and Higher Education (grant no.: CH2019-8320) for the Joint China-Sweden Mobility program, and Karolinska Institutet, Stockholm, Sweden.
Authors’ disclosures available online (https://www.j-alz.com/manuscript-disclosures/20-1372r1).
REFERENCES
[1] | Gauthier S , Reisberg B , Zaudig M , Petersen RC , Ritchie K , Broich K , Belleville S , Brodaty H , Bennett D , Chertkow H , Cummings JL , de Leon M , Feldman H , Ganguli M , Hampel H , Scheltens P , Tierney MC , Whitehouse P , Winblad B ((2006) ) Mild cognitive impairment. Lancet 367: , 1262–1270. |
[2] | Mufson EJ , Binder L , Counts SE , DeKosky ST , deToledo-Morrell L , Ginsberg SD , Ikonomovic MD , Perez SE , Scheff SW ((2011) ) Mild cognitive impairment: Pathology and mechanisms. Acta Neuropathol 123: , 13–30. |
[3] | Teipel S , Kilimann I , Thyrian JR , Kloppel S , Hoffmann W ((2018) ) Potential role of neuroimaging markers for early diagnosis of dementia in primary care. Curr Alzheimer Res 15: , 18–27. |
[4] | Zhao W , Luo Y , Zhao L , Mok V , Su L , Yin C , Sun Y , Lu J , Shi L , Han Y ((2019) ) Automated brain MRI volumetry differentiates early stages of Alzheimer’s disease from normal aging. J Geriatr Psychiatry Neurol 32: , 354–364. |
[5] | Bharath S , Joshi H , John JP , Balachandar R , Sadanand S , Saini J , Kumar KJ , Varghese M ((2017) ) A multimodal structural and functional neuroimaging study of amnestic mild cognitive impairment. Am J Geriatr Psychiatry 25: , 158–169. |
[6] | Barbeau EJ , Ranjeva JP , Didic M , Confort-Gouny S , Felician O , Soulier E , Cozzone PJ , Ceccaldi M , Poncet M ((2008) ) Profile of memory impairment and gray matter loss in amnestic mild cognitive impairment. Neuropsychologia 46: , 1009–1019. |
[7] | Zhang H , Sachdev PS , Wen W , Kochan NA , Crawford JD , Brodaty H , Slavin MJ , Reppermund S , Draper B , Zhu W , Kang K , Trollor JN ((2012) ) Gray matter atrophy patterns of mild cognitive impairment subtypes. J Neurol Sci 315: , 26–32. |
[8] | Fujishima M , Maikusa N , Nakamura K , Nakatsuka M , Matsuda H , Meguro K ((2014) ) Mild cognitive impairment, poor episodic memory, and late-life depression are associated with cerebral cortical thinning and increased white matter hyperintensities. Front Aging Neurosci 6: , 306. |
[9] | Martinez-Murcia FJ , Górriz JM , Ramírez J , Segovia F , Salas-Gonzalez D , Castillo-Barnes D , Ortiz A ; Alzheimer’s Disease Neuroimaging Initiative ((2018) ) Assessing mild cognitive impairment progression using a spherical brain mapping of magnetic resonance imaging. J Parkinsons Dis 65: , 713–729. |
[10] | Long Z , Huang J , Li B , Li Z , Li Z , Chen H , Jing B ((2018) ) A comparative atlas-based recognition of mild cognitive impairment with voxel-based morphometry. Front Neurosci 12: , 916. |
[11] | Balthazar ML , Yasuda CL , Pereira FR , Pedro T , Damasceno BP , Cendes F ((2009) ) Differences in grey and white matter atrophy in amnestic mild cognitive impairment and mild Alzheimer’s disease. Eur J Neurol 16: , 468–474. |
[12] | Serra L , Cercignani M , Lenzi D , Perri R , Fadda L , Caltagirone C , Macaluso E , Bozzali M ((2010) ) Grey and white matter changes at different stages of Alzheimer’s disease. J Alzheimers Dis 19: , 147–159. |
[13] | Casado Naranjo I , Portilla Cuenca JC , Duque de San Juan B , Garcia AF , Sevilla RR , Serrano Cabrera A , Hijon CC , Romero Chala S , Fuentes JM , Ramirez Moreno JM ((2015) ) Association of vascular factors and amnestic mild cognitive impairment: A comprehensive approach. J Alzheimers Dis 44: , 695–704. |
[14] | Wang Y , Du Y , Li J , Qiu C ((2019) ) Lifespan intellectual factors, genetic susceptibility, and cognitive phenotypes in aging: Implications for interventions. Front Aging Neurosci 11: , 129. |
[15] | Foubert-Samier A , Catheline G , Amieva H , Dilharreguy B , Helmer C , Allard M , Dartigues JF ((2012) ) Education, occupation, leisure activities, and brain reserve: A population-based study. Neurobiol Aging 33: , 423.e15–25. |
[16] | Toffanello ED , Coin A , Perissinotto E , Zambon S , Sarti S , Veronese N , De Rui M , Bolzetta F , Corti MC , Crepaldi G , Manzato E , Sergi G ((2014) ) Vitamin D deficiency predicts cognitive decline in older men and women: The Pro.V.A. Study. Neurology 83: , 2292–2298. |
[17] | Galvin JE , Roe CM , Powlishta KK , Coats MA , Muich SJ , Grant E , Miller JP , Storandt M , Morris JC ((2005) ) The AD8: A brief informant interview to detect dementia. Neurology 65: , 559–564. |
[18] | American Psychiatric Association ((1994) ) Diagnostic and Statistical Manual of Mental Disorders, Fourth Edition (DSM-IV). American Psychiatric Association, Washington, D.C. |
[19] | Yin L , Ren Y , Wang X , Li Y , Hou T , Liu K , Cong L , Zhang Q , Wang Y , Jiang Z , Du Y ((2020) ) The power of the Functional Activities Questionnaire for screening dementia in rural-dwelling older adults at high-risk of cognitive impairment. Psychogeriatrics 20: , 427–436. |
[20] | Petersen RC ((2004) ) Mild cognitive impairment as a diagnostic entity. J Intern Med 256: , 183–194. |
[21] | Qu Y , Zhuo L , Li N , Hu Y , Chen W , Zhou Y , Wang J , Tao Q , Hu J , Nie X , Zhan S ((2015) ) Prevalence of post-stroke cognitive impairment in china: A community-based, cross-sectional study. PLoS One 10: , e0122864. |
[22] | Ashburner J ((2007) ) A fast diffeomorphic image registration algorithm. Neuroimage 38: , 95–113. |
[23] | Rajapakse JC , Giedd JN , Rapoport JL ((1997) ) Statistical approach to segmentation of single-channel cerebral MR images. IEEE Trans Med Imaging 16: , 176–186. |
[24] | Hammers A , Allom R , Koepp MJ , Free SL , Myers R , Lemieux L , Mitchell TN , Brooks DJ , Duncan JS ((2003) ) Three-dimensional maximum probability atlas of the human brain, with particular reference to the temporal lobe. Hum Brain Mapp 19: , 224–247. |
[25] | Xie Y , Cui Z , Zhang Z , Sun Y , Sheng C , Li K , Gong G , Han Y , Jia J ((2015) ) Identification of amnestic mild cognitive impairment using multi-modal brain features: A combined structural MRI and diffusion tensor imaging study. J Alzheimers Dis 47: , 509–522. |
[26] | Zidan M , Boban J , Bjelan M , Todorovic A , Stankov Vujanic T , Semnic M , Boban N , Kozic D ((2019) ) Thalamic volume loss as an early sign of amnestic mild cognitive impairment. J Clin Neurosci 68: , 168–173. |
[27] | Nickl-Jockschat T , Kleiman A , Schulz JB , Schneider F , Laird AR , Fox PT , Eickhoff SB , Reetz K ((2012) ) Neuroanatomic changes and their association with cognitive decline in mild cognitive impairment: A meta-analysis. Brain Struct Funct 217: , 115–125. |
[28] | Zhuang L , Sachdev PS , Trollor JN , Kochan NA , Reppermund S , Brodaty H , Wen W ((2012) ) Microstructural white matter changes in cognitively normal individuals at risk of amnestic MCI. Neurology 79: , 748–754. |
[29] | Langen CD , Cremers LGM , de Groot M , White T , Ikram MA , Niessen WJ , Vernooij MW ((2018) ) Disconnection due to white matter hyperintensities is associated with lower cognitive scores. Neuroimage 183: , 745–756. |
[30] | van den Berg E , Geerlings MI , Biessels GJ , Nederkoorn PJ , Kloppenborg RP ((2018) ) White matter hyperintensities and cognition in mild cognitive impairment and Alzheimer’s disease: A domain-specific meta-analysis. J Alzheimers Dis 63: , 515–527. |
[31] | Kantarci K , Petersen RC , Przybelski SA , Weigand SD , Shiung MM , Whitwell JL , Negash S , Ivnik RJ , Boeve BF , Knopman DS , Smith GE , Jack CR Jr ((2008) ) Hippocampal volumes, proton magnetic resonance spectroscopy metabolites, and cerebrovascular disease in mild cognitive impairment subtypes. Arch Neurol 65: , 1621–1628. |
[32] | Bangen KJ , Preis SR , Delano-Wood L , Wolf PA , Libon DJ , Bondi MW , Au R , DeCarli C , Brickman AM ((2018) ) Baseline white matter hyperintensities and hippocampal volume are associated with conversion from normal cognition to mild cognitive impairment in the Framingham Offspring Study. Alzheimer Dis Assoc Disord 32: , 50–56. |
[33] | Rhodius-Meester HFM , Benedictus MR , Wattjes MP , Barkhof F , Scheltens P , Muller M , van der Flier WM ((2017) ) MRI visual ratings of brain atrophy and white matter hyperintensities across the spectrum of cognitive decline are differently affected by age and diagnosis. Front Aging Neurosci 9: , 117. |
[34] | Wang R , Laveskog A , Laukka EJ , Kalpouzos G , Backman L , Fratiglioni L , Qiu C ((2018) ) MRI load of cerebral microvascular lesions and neurodegeneration, cognitive decline, and dementia. Neurology 91: , 1487–1497. |
[35] | Dugger BN , Davis K , Malek-Ahmadi M , Hentz JG , Sandhu S , Beach TG , Adler CH , Caselli RJ , Johnson TA , Serrano GE , Shill HA , Belden C , Driver-Dunckley E , Caviness JN , Sue LI , Jacobson S , Powell J , Sabbagh MN ((2015) ) Neuropathological comparisons of amnestic and nonamnestic mild cognitive impairment. BMC Neurol 15: , 146. |
[36] | Cerami C , Dodich A , Iannaccone S , Magnani G , Santangelo R , Presotto L , Marcone A , Gianolli L , Cappa SF , Perani D ((2018) ) A biomarker study in long-lasting amnestic mild cognitive impairment. Alzheimers Res Ther 10: , 42. |


