
In vitro Characterization of the Regional Binding Distribution of Amyloid PET Tracer Florbetaben and the Glia Tracers Deprenyl and PK11195 in Autopsy Alzheimer’s Brain Tissue
Abstract
Background:
Emerging evidence indicates a central role of gliosis in Alzheimer’s disease (AD) pathophysiology. However, the regional distribution and interaction of astrogliosis and microgliosis in association with amyloid-β (Aβ) still remain uncertain.
Objective:
Here we studied the pathological profiles in autopsy AD brain by using specific imaging tracers.
Methods:
Autopsy brain tissues of AD (n = 15, age 70.4±8.5 years) and control cases (n = 12, age 76.6±10.9) were examined with homogenate binding assays, autoradiography for Aβ plaques (3H-florbetaben/3H-PIB), astrogliosis (3H-L-deprenyl), and microgliosis (3H-PK11195/3H-FEMPA), as well as immunoassays.
Results:
In vitro saturation analysis revealed high-affinity binding sites of 3H-florbetaben, 3H-L-deprenyl, and 3H-PK11195/3H-FEMPA in the frontal cortex of AD cases. In vitro 3H-florbetaben binding increased across cortical and subcortical regions of AD compared to control with the highest binding in the frontal and parietal cortices. The in vitro 3H-L-deprenyl binding showed highest binding in the hippocampus (dentate gyrus) followed by cortical and subcortical regions of AD while the GFAP expression was upregulated only in the hippocampus compared to control. The in vitro 3H-PK11195 binding was solely increased in the parietal cortex and the hippocampus of AD compared to control. The 3H-florbetaben binding positively correlated with the 3H-L-deprenyl binding in the hippocampus and parietal cortex of AD and controls. Similarly, a positive correlation was observed between 3H-florbetaben binding and GFAP expression in hippocampus of AD and control.
Conclusion:
The use of multi-imaging tracers revealed different regional pattern of changes in autopsy AD brain with respect to amyloid plaque pathology versus astrogliosis and microgliosis.
INTRODUCTION
Alzheimer’s disease (AD) involves complex pathophysiology, featured by amyloid-β (Aβ) deposits, neurofibrillary tangles, gliosis, and neural loss. Emer-ging evidence implies that Aβ, astrogliosis, and mi-crogliosis play important roles at early phases of AD [1–5]. However, the regional distribution, consequence of gliosis in relation to Aβ deposits, whether beneficial or harmful, as well as accurate imaging biomarker for gliosis remains elusive.
Autopsy analysis and in vivo positron emission tomography (PET) with Aβ tracers in AD and non-demented control cases [6] have shown that different brain regions develop Aβ pathology following the hierarchy of neocortical, limbic, and subcortical areas [7–9]. Higher cortical Aβ loads (retentions) were observed in patients with AD and mild cognitive impairment (MCI) due to AD compared with control [6, 10] by PET using Aβ tracers such as 11C-PIB [11], 18F-flutemetamol [12], 18F-florbetapir [13], 18F-florbetaben [14–16], and 11C-AZD2184/18F-AZD4694 [17]. Robust correlations between PET and Aβ pathology at autopsy support the specific detection by Aβ imaging tracers [18–22]. 18F-florbetaben binding in vivo correlated strongly with neuritic plaques detected by Bielschowsky-silver staining and 6E10 immunostaining in AD brain [14], and showed no binding to alpha-synuclein or tau pathologies [23]. The in vitro regional distribution of 3H-florbetaben in autopsy AD brain remains to be characterized.
Accurate detection of neuroinflammation and gliosis in vivo has been challenging [4, 24]. One reason is that astrocytes and microglia are highly dynamic and heterogeneous in their subtypes, locations, and activation statuses [25]. 11C-deuterium-L-deprenyl (DED) binds to monoamine oxidase-B (MAO-B) overexpressed in reactive astrocytes and has been evaluated as a biomarker for astrogliosis [26–29]. 11C-DED binding increased in MCI with high 11C-PIB retention compared to AD and control subjects. Longitudinal study in patients with autosomal \nobreak dominant AD showed that 11C-DED binding elevated at initial disease stage and declined with increasing 11C-PIB binding during progression, suggesting astrogliosis as an early event [3, 30].
Microglia activation has been assessed by PET using translocator protein (TSPO) tracers [31, 32], such as first-generation 11C-PK11195 [33], second-generation 11C-DAA1106 [34], 11C-PBR28 [35], 18F-FEMPA [36], 11C-GE180 [37], and 18F-DPA-714 [38]. Results from TSPO imaging in MCI and AD have been inconclusive: increase or no change in TSPO retention comparing AD to control group has been reported [33, 39–41]. This could be due to several reasons, including 1) tracer specificity [42]; 2) TSPO rs6971 genetic polymorphism [25, 43]; 3) heterogeneous and dynamic activation status of microglia [44]; and 4) various cellular expression of TSPO.
To understand the regional distribution of fibrillar Aβ deposits in relation to astro- and microgliosis, we determined the binding of 3H-florbetaben/3H-PIB, 3H-L-deprenyl, and 3H-PK11195/3H-FEMPA in autopsy brain tissues from AD and control cases by using homogenate binding assays, autoradiography, enzyme-linked immunosorbent assay (ELISA) for astrocyte marker glial fibrillary acidic protein (GFAP). This study demonstrates a clear regional correlation between amyloid plaque deposition and astrogliosis in AD.
MATERIALS AND METHODS
AD and control autopsy brains
Fifteen AD cases (mean age 70.4±8.5 years; mean postmortem delay 5.1±0.9 h), each with a clinical diagnosis confirmed by pathological examination (NINCDS-ADRDA criteria), and twelve control cases (mean age 76.6±10.9 years; mean postmortem delay 7.0±3.8 h) were included in this study (Table 1). Early-onset AD (EOAD) and late-onsetAD (LOAD) were classified based on the age of on-set of the clinical symptoms (before or after 65 years of age). Autopsy brain tissues from the frontal, parietal and temporal cortics, hippocampus, caudate nucleus, and cerebellum were obtained from the Netherlands Brain Bank (NBB), Netherlands. The disease relevant cortical and subcortical brain regions, as well as the reference brain region in amyloid PET imaging (cerebellum) were selected. All materials had been collected from donors or from whom a written informed consent for a brain autopsy and the use of the materials and clinical information for research purposes had been obtained by the NBB. Frozen brain tissues from the left hemisphere (all cases) were homogenized in ice-cold 5×0.32 M sucrose containing 10μl/ml protease inhibitor; brain tissues from 4 AD and 4 control cases were cryostat sectioned at 10μm and stored at –80°C. Protein concentration was determined using DC protein assay (Bio-Rad Laboratories AB, Sweden). The apolipoprotein E (APOE) genotype was determined using an INNO-LIPA ApoE-kit (Innogenetics, Belgium) with genomic DNA extracted from the thalamic tissue of AD and control cases (QIAamp DNA mini kit, Qiagen, Germany).
Table 1
Demographics
| Group | No. of brains | Age (y) | Sex (F/M) | Disease duration (y) | PM delay (h) | APOE ɛ4 (0/1/2) | Braak stage (0–6) |
| AD | 15 | 70.4±8.5 | 9/6 | 6.7±2.7 | 5.1±0.9 | 4/5//6 | 4/5/6 |
| EOAD | 8 | 63.8±5.4 | 5/3 | 7.4±2.3 | 4.8±0.9 | 3/3/2 | 4/5/6 |
| LOAD | 7 | 78.0±4.4 | 4/3 | 5.7±3.0 | 5.4±0.9 | 1/2/4 | 4/5/6 |
| Control | 12 | 76.6±10.9 | 6/6 | 7.0±3.8 | 12/0/0 | 1/2 |
EOAD, early onset Alzheimer’s disease; LOAD, late onset Alzheimer’s disease; PM, postmortem.
The study was conducted according to the principles of the Declaration of Helsinki and subsequent revisions. All experiments on autopsied human brain tissue were carried out in accordance with ethical permission obtained from the regional human ethics committee in Stockholm (permission number 2011/962/31-1), the medical ethics committee of the VU Medical Center for the Netherlands Brain Bank tissue (permission no. 1998-06/5).
Materials
3H-florbetaben ([N-methyl-3H]4-[(E)-2-(4-{2-[2-(2-fluoroethoxy)ethoxy]ethoxy}phenyl) ethenyl]-aniline), specific activity(SA) 63.0 Ci/mmol; 3H-FEMPA ([N-methyl-3H][2-(2-Fluoroethoxy)-5-met-hoxybenzyl]-N-{2-[(4-methoxyphenyl)oxy]pyridin-e-3-yl}-acetamide), SA 38.7 Ci/mmol; and unlabeled florbetaben were custom synthesized by Bayer AG, Germany. 3H-L-deprenyl (N-Methyl-3H Hydro-chloride), SA 80.0 Ci/mmol, was purchased from American radiolabeled chemicals, USA. 3H-PK11195 (1-(2-Chlorophenyl)-N-methyl-N-(1-methylpro-pyl)-3-isoquinolinecarbox-amide), SA 81.7 Ci/mmol, was purchased from Perkin Elmer, USA. 3H-PIB [N-methyl-3H]2-(4’-Methylaminophenyl)-6-hydroxybenzo-thiazole), SA 85.0 Ci/mmol, was custom synthesized by GE Healthcare, UK. Unlabelled L-deprenyl, unlabelled PK11195 and 2-(4’-Methylaminophenyl)benzothiazole (BTA-1), bovine serum albumin (BSA) were purchased from Sigma-Aldrich, USA.
Characterization of 3H-florbetaben, 3H-L-deprenyl, 3H-FEMPA, and 3H-PK11195 binding properties in AD and control brains
Saturation binding assays with 3H-florbetaben (SA 63.0 Ci/mmol) were performed in the frontal cortex homogenates of AD (n = 3) and control cases (n = 3) by incubation in 0.1 M PBS + 0.1 % BSA buffer (pH 7.4) containing 0.01–40 nM 3H-florbetaben for 3 h in tubes at room temperature (RT). Incubations were terminated by filtering samples through Whatman GF/C glass filters pre-soaked with 0.3% polyetylenamine solution. The filters were then washed 3×ice-cold 0.1 M PBS buffer (pH 7.4), transferred to scintillation vials and the radioactivity counted in a LS-6500 liquid scintillation counter (Beckman Coulter AB, Sweden) [45]. All assays were run in triplicates. The 3H-florbetaben specific binding was calculated as the difference between total (Non-specific (NSP) binding in the presence of 0.75μM unlabelled florbetaben) and expressed as pmol/g tissue.
Saturation binding assays with 3H-L-deprenyl (SA 80.0 Ci/mmol) were performed in the frontal cortex homogenate of AD cases (n = 7) by incubation in ice-cold 0.1 M Na+-K+ buffer (pH 7.4) containing 0.01–25 nM 3H-L-deprenyl for 2 h at 37°C (NSP binding in the presence of 1μM unlabelled L-deprenyl). The termination of incubation and counting is the same as aforementioned, except washing 3×ice-cold 0.1 M Na+-K+ buffer (pH 7.4). Saturation binding assays with 3H-PK11195 (SA 81.7 Ci/mmol) and 3H-FEMPA (SA 38.7 Ci/mmol) were performed in the frontal cortex homogenates of AD cases (n = 6) by incubation in 0.1 M Tris-HCl buffer (pH 7.4) containing 0.1–30 nM 3H-FEMPA or 0.5–120 nM 3H-PK11195 for 2 h at RT (NSP binding in the presence 10μM unlabeled PK11195). The termination of incubation is the same as aforementioned, except washing 3×ice-cold 0.1 M Tris-HCl buffer (pH 7.4). The specific binding of 3H-L-deprenyl, 3H-FEMPA and 3H-PK11195 were calculated as the difference between total and NSP binding and expressed as pmol/g protein.
Measurements of regional 3H-florbetaben (5 nM), 3H-L-deprenyl (6 nM), 3H-PK11195 (2.5 nM), and 3H-FEMPA (2.5 nM) binding were performed in the frontal, parietal, temporal cortex, hippocampus, caudate nucleus, and cerebellum of 12 AD and 12 control cases. The incubation time, incubation buffer, and washing buffers were same as in aforementioned saturation assay respectively. Measurement of 3H-PIB (1 nM, SA 85.0 Ci/mmol) binding was performed in the frontal and parietal cortex of the same 12 AD and 12 control cases by incubating in 0.1 M PBS + 0.1% BSA buffer (pH 7.4) for 2 h at RT. NSP binding was determined in the presence of 1μM BTA-1. The termination and counting procedure for 3H-PIB is the same as that for 3H-florbetaben assay. The 3H-PIB specific binding was calculated as the difference between total and NSP binding and expressed as pmol/g tissue.
ELISA measurement of GFAP level
The level of GFAP expression was determined by using ELISA as described previously [46] in the frontal, parietal, temporal cortex, hippocampus, caudate nucleus of 12 AD and 12 control cases. Brain tissue homogenates were sequentially incubated with monoclonal anti-GFAP antibody (Merck KGaA, Germany), alkaline phosphatase-conjugated anti-mouse IgG (Vector, USA), AP and substrate (p-nitro-phenyl-phosphate; Bio-Rad) in a rabbit anti-GFAP antibody pre-coated (Dako, Denmark) microtiter plate. Optical density was assessed in a microtiter plate reader (Tecan, Switzerland) at 405 nm. The level of GFAP was analyzed using Soft Max Pro Plus software (Molecular Devices, USA).
Autoradiography using 3H-florbetaben, 3H-L-deprenyl and 3H-FEMPA in AD brain tissue slices
Adjacent slices (10μm) from the frontal cortex (n = 4 each) and hippocampus (n = 3 each) of AD and control were dried in RT for 20 min and incubated with 2.5 nM 3H-florbetaben in 0.1 M PBS + 0.5 % BSA buffer (pH 7.4) buffer, 10 nM 3H-L-deprenyl, and 2.5 nM 3H-FEMPA in 0.1 M Tris-HCl buffer (pH 7.4) for 1 h with NSP binding determined in the presence of unlabeled 0.75μM florbetaben, 1μM L-deprenyl, and 10μM PK11195, respectively. After incubation, the brain slices were washed in corresponding ice-cold buffer 2×5 min and once in ice-cold dd water. The sections were dried in the hood and were exposed to Fuji BAS-TR2040 phosphor imaging plates (Science Imaging Scandinavia AB, Sweden) together with tritium microscale \nobreak standards (American Radiolabeled Chemicals); 4 days for 3H-florbetaben, 20 days for 3H-FEMPA, and 10 days for 3H-L-deprenyl. The plates were developed with a Fujifilm BAS-5000 phosphorimager (Fuji, Japan). Binding density was measured using Multigauge software V3.0 (Fuji, Japan).
Statistical analyses
Data was analyzed using GraphPad Prism software 7.0 (GraphPad Software Inc, USA). Kd and Bmax values from saturation binding curves were determined using a one-site non-linear fitting model. Non-parametric t-test (Mann-Whitney) were used for comparisons between AD and control cases. Two-way ANOVA was used to compare early onset AD, late onset AD and control group. Correlation analyses were performed using Pearson’s r correlation analysis. Significance level was set at *p < 0.05, **p < 0.01, ***p < 0.001.
RESULTS
Demographic information
Fifteen AD (9 female/6 male) and twelve control cases (6 female/6 male) were included in this study (Table 1). Among the AD cases, 8 were EOAD and the other 7 were LOAD cases. Among the control cases, 2 were younger than 65 years old, and 10 were older than 65 years old. Age and gender did not significantly differ between AD and control groups analyzed by using Chi-squared test. APOE ɛ4 genotyping results showed that AD group consisting of seven ɛ4/4 carriers, five ɛ 3/4 carriers, and four ɛ4 non-carriers. All control cases are APOE ɛ4 non-carriers.
Binding characterization
Saturation binding studies with 3H-florbetaben at 0.01–40 nM revealed a high-affinity binding site of Kd = 11.8±1.4 nM in the frontal cortex of AD by non-linear fitting (Table 2). Saturation binding studies with 3H-L-deprenyl at 0.01–25 nM revealed a high-affinity binding site of Kd = 10.2±0.8 nM in the frontal cortex of AD cases (n = 7) (Table 2). The non-specific binding was approx. 5% for 3H-L-deprenyl. Saturation binding studies with 3H-PK11195 at 0.5–40 nM and 3H-FEMPA at 0.1–30 nM revealed similar high-affinity binding site of 1.8±0.6 nM and 3.3±0.1 nM respectively in the frontal cortex of AD cases (n = 6) by non-linear fitting (Table 2, Supplementary Figure 1). The non-specific binding was less than 10% for both 3H-PK11195 and 3H-FEMPA.
Fig. 1
Regional 3H-florbetaben, 3H-L-deprenyl, 3H-PK11195 binding and level of GFAP expression in AD and control brain. a) 3H-florbetaben (5 nM) binding in the brain homogenate from AD and control cases. b) 3H-L-deprenyl (6 nM) binding in brain tissue homogenates from AD and control cases. c) 3H-PK11195 (2.5 nM) binding in brain tissue homogenates from AD and control cases. d) Level of GFAP expression in the same AD and control cases; Significant differences between AD and control groups are indicated by *p < 0.05, **p < 0.01, ***p < 0.001.
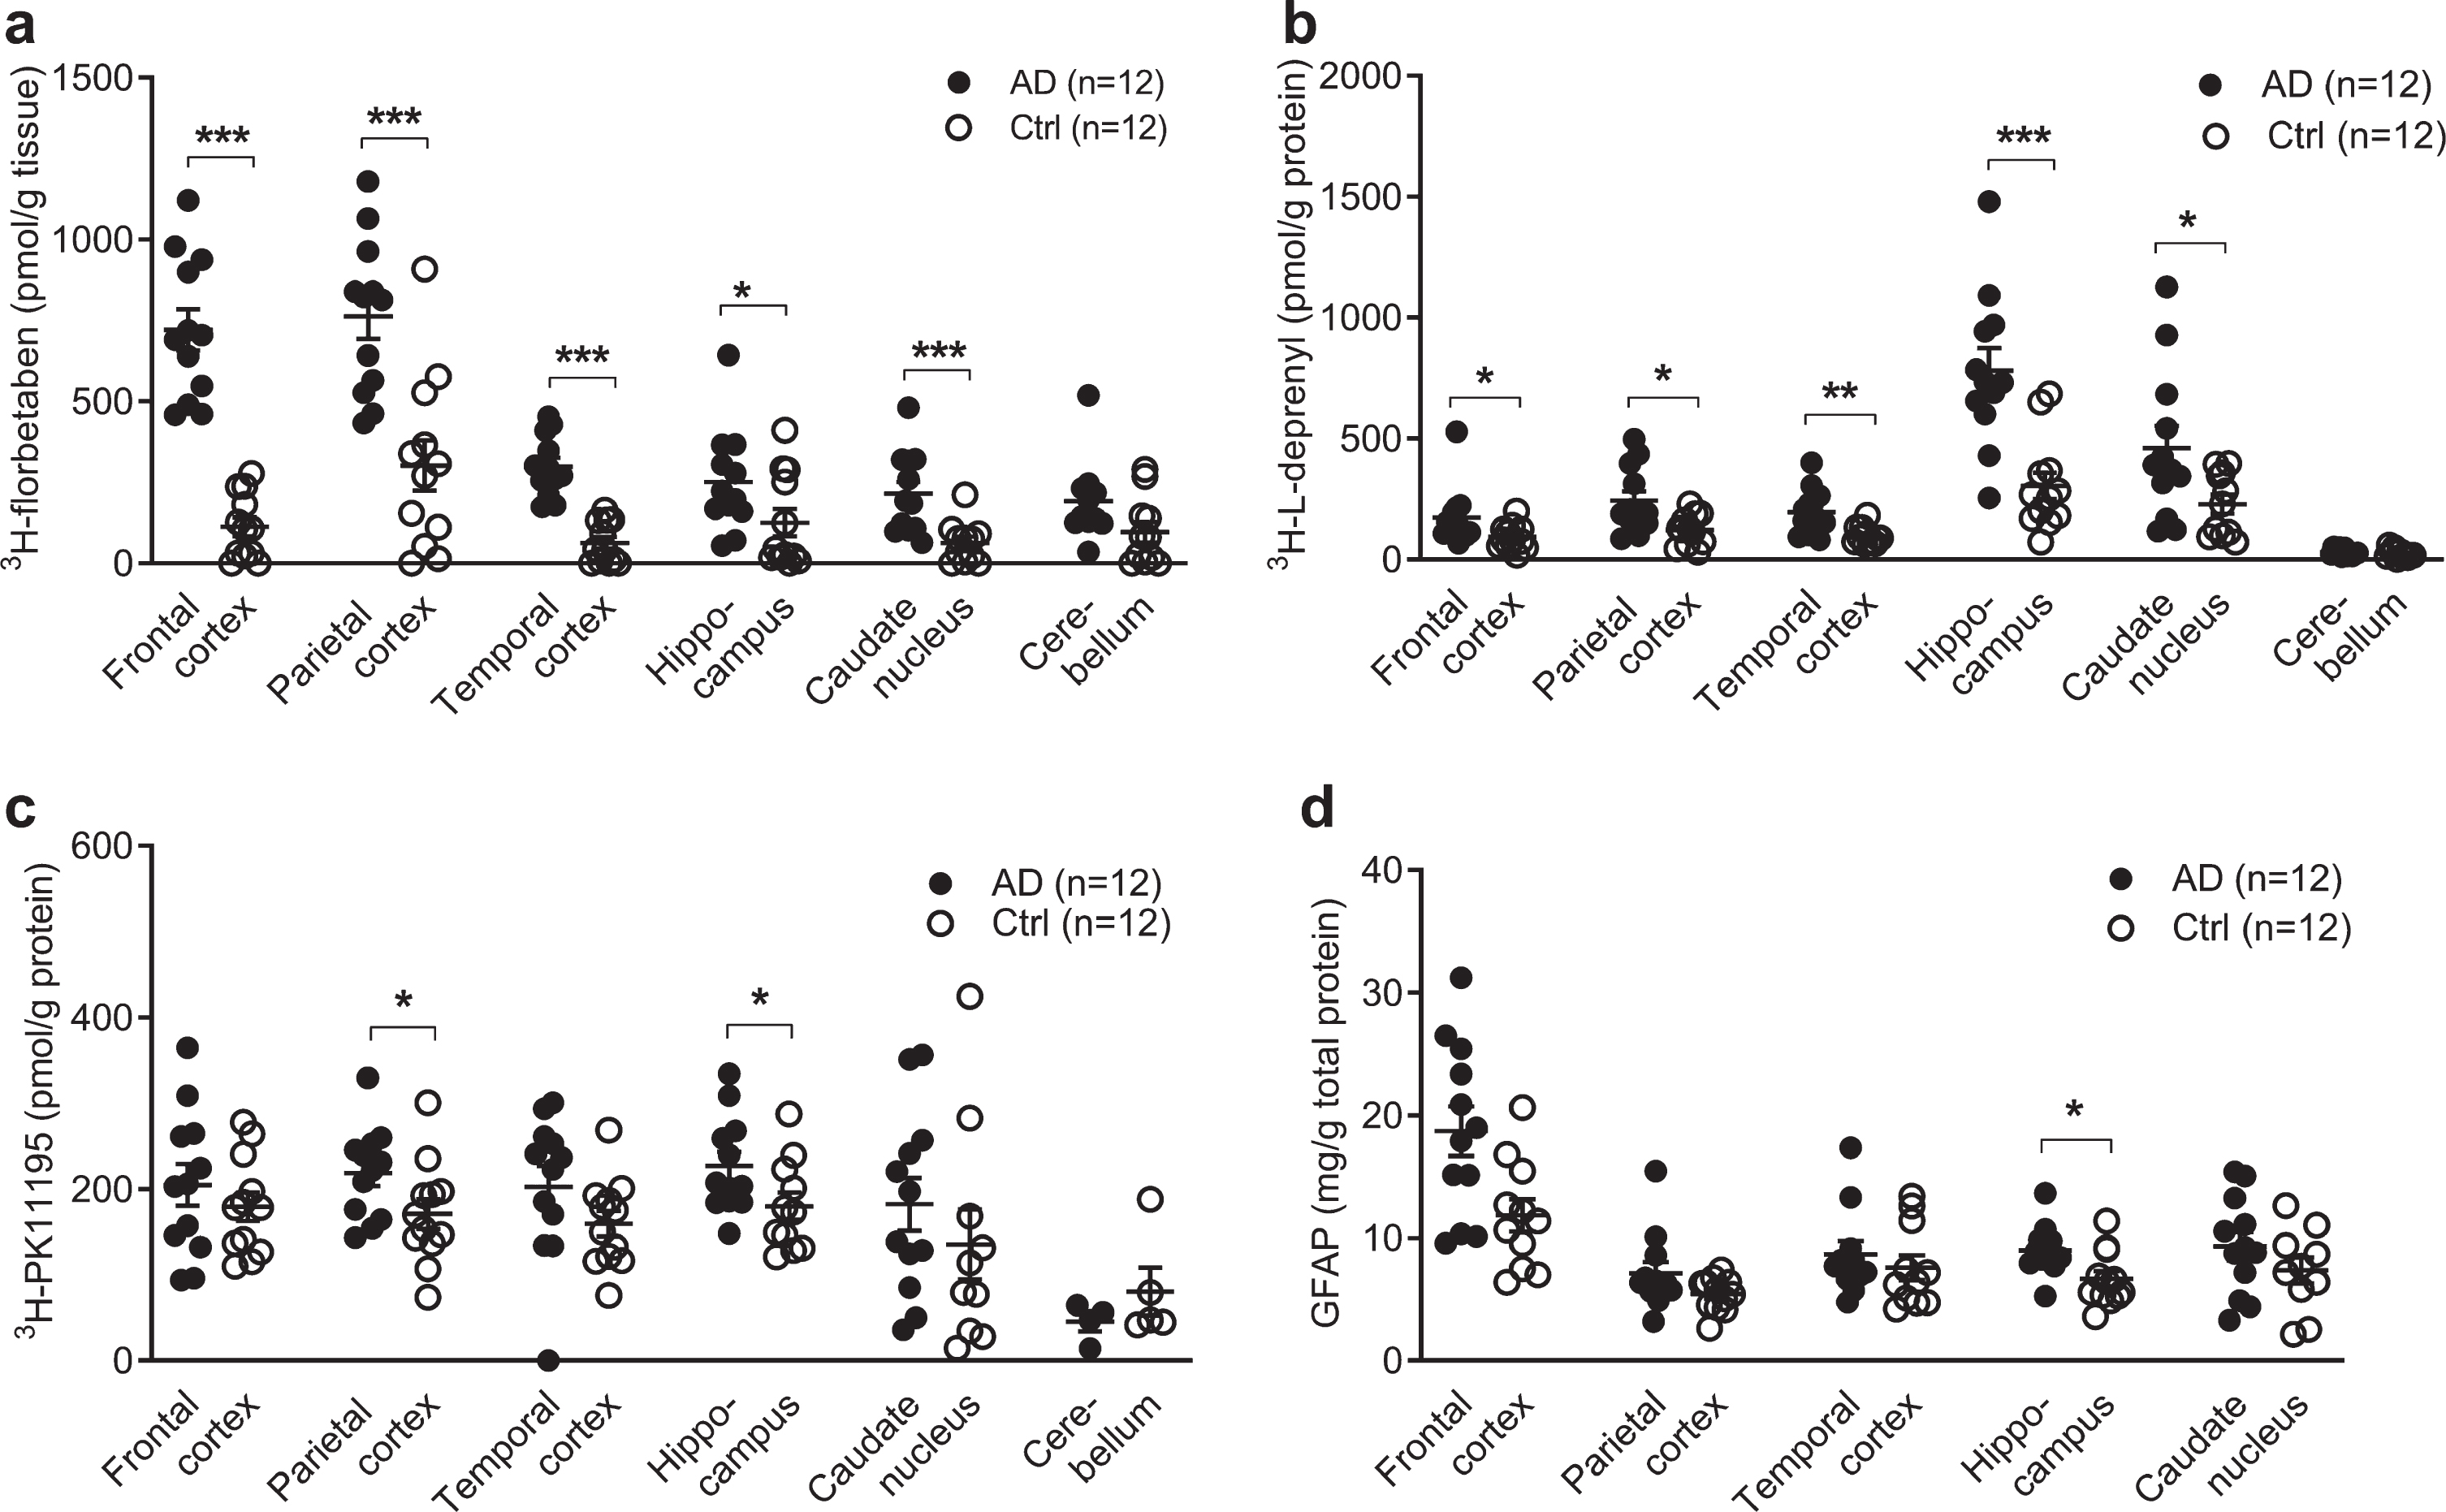
Table 2
Binding properties for 3H-florbetaben, 3H-L-deprenyl, 3H-FEMPA, and 3H-PK11195 in the frontal cortex of AD cases
| Tracer | Kd (nM) | Bmax (pmol/g tissue or protein) |
| 3H-florbetaben (n = 3) | 11.8±1.4 | 2146±964 |
| 3H-L-deprenyl (n = 7) | 10.2±0.8 | 322±47 |
| 3H-FEMPA (n = 6) | 3.3±0.1 | 251±147 |
| 3H-PK11195 (n = 6) | 1.8±0.6 | 355±139 |
Kd, dissociation constant; Bmax, maxium number of binding sites. Results are expressed as mean±standard deviation.
Different regional 3H-florbetaben, 3H-L-deprenyl, 3H-PK11195, and GFAP distribution in AD and control brain
3H-florbetaben (5 nM) showed significant increa-ses in the frontal cortex (p < 0.001), followed by the parietal cortex (p < 0.001), temporal cortex (p < 0.001), caudate nucleus (p < 0.001), and hippo-campus (p = 0.0387) of AD (n = 12) compared to control (n = 12) (Fig. 1a). 3H-L-deprenyl (6 nM) showed significant increases in the hippocampus (p = 0.0002) followed by the temporal cortex (p = 0.0014), the frontal and parietal cortex (p = 0.0284, p = 0.0121), and caudate nucleus (p = 0.0374) of AD (n = 11-12) compared to control cases (n = 12) (Fig. 1b). 2.5 nM 3H-PK11195 showed significantly increases in the parietal cortex (p = 0.0332) and hippocampus (p = 0.0317) of AD (n = 12) compared with control (n = 12) (Fig. 1c). In comparison, another TSPO tracer 3H-FEMPA (2.5 nM) did not show difference in any brain regions between AD and control (Supplementary Figure 1). The levels of GFAP expression were determined by ELISA in five brain regions of the same AD (n = 12) and control (n = 12) cases included in binding assays. The levels of GFAP expression significantly increased in the hippocampus (p = 0.0280) of AD compared to control (Fig. 1d), and not in the other regions.
The difference between EOAD, LOAD, and control group was analyzed using two-way ANOVA comparison (Table 3). High 3H-florbetaben binding was observed in in all three cortical regions in EOAD and LOAD compared to control. The 3H-L-deprenyl binding was higher in the hippocampus while lower in the caudate nucleus of LOAD compared to EOAD. No difference was observed in the regional 3H-florbetaben, or 3H-PK11195 binding between EOAD and LOAD group.
Table 3
Comparison of 3H-florbetaben, 3H-L-deprenyl, 3H-FEMPA, and 3H-PK11195 binding between EOAD, LOAD and control
| Tracer | Region | Group | p | ||||
| EOAD (n = 7) | LOAD (n = 5) | Ctrl (n = 12) | EOAD versus Ctrl | LOAD versus Ctrl | EOAD versus LOAD | ||
| 3H-L-deprenyl | PC | 187±66 | 322±175 | 138±55 | ns | 0.0183 | ns |
| HIP | 662±214 | 946±387 | 301±191 | < 0.0001 | < 0.0001 | 0.0004 | |
| CN | 546±381 | 342±153 | 245±125 | < 0.0001 | ns | 0.0168 | |
| 3H-florbetaben | FC | 737±210 | 698±256 | 113±100 | < 0.0001 | < 0.0001 | Ns |
| PC | 804±200 | 705±302 | 302±269 | < 0.0001 | < 0.0001 | Ns | |
| TC | 315±95 | 277±97 | 64±64 | 0.0001 | 0.0047 | Ns | |
| HIP | 274±171 | 210±118 | 125±145 | 0.0366 | ns | Ns | |
CN, caudate nucleus; Ctrl, control; EOAD, early onset Alzheimer’s disease; HIP, hippocampus; LOAD, late onset Alzheimer’s disease; ns, not significant; PC, parietal cortex; TC, temporal cortex. Values represent Mean±standard deviation.
Autoradiography showed high 3H-florbetaben in the cortex, and 3H-L-deprenyl signal in the dental gyrus
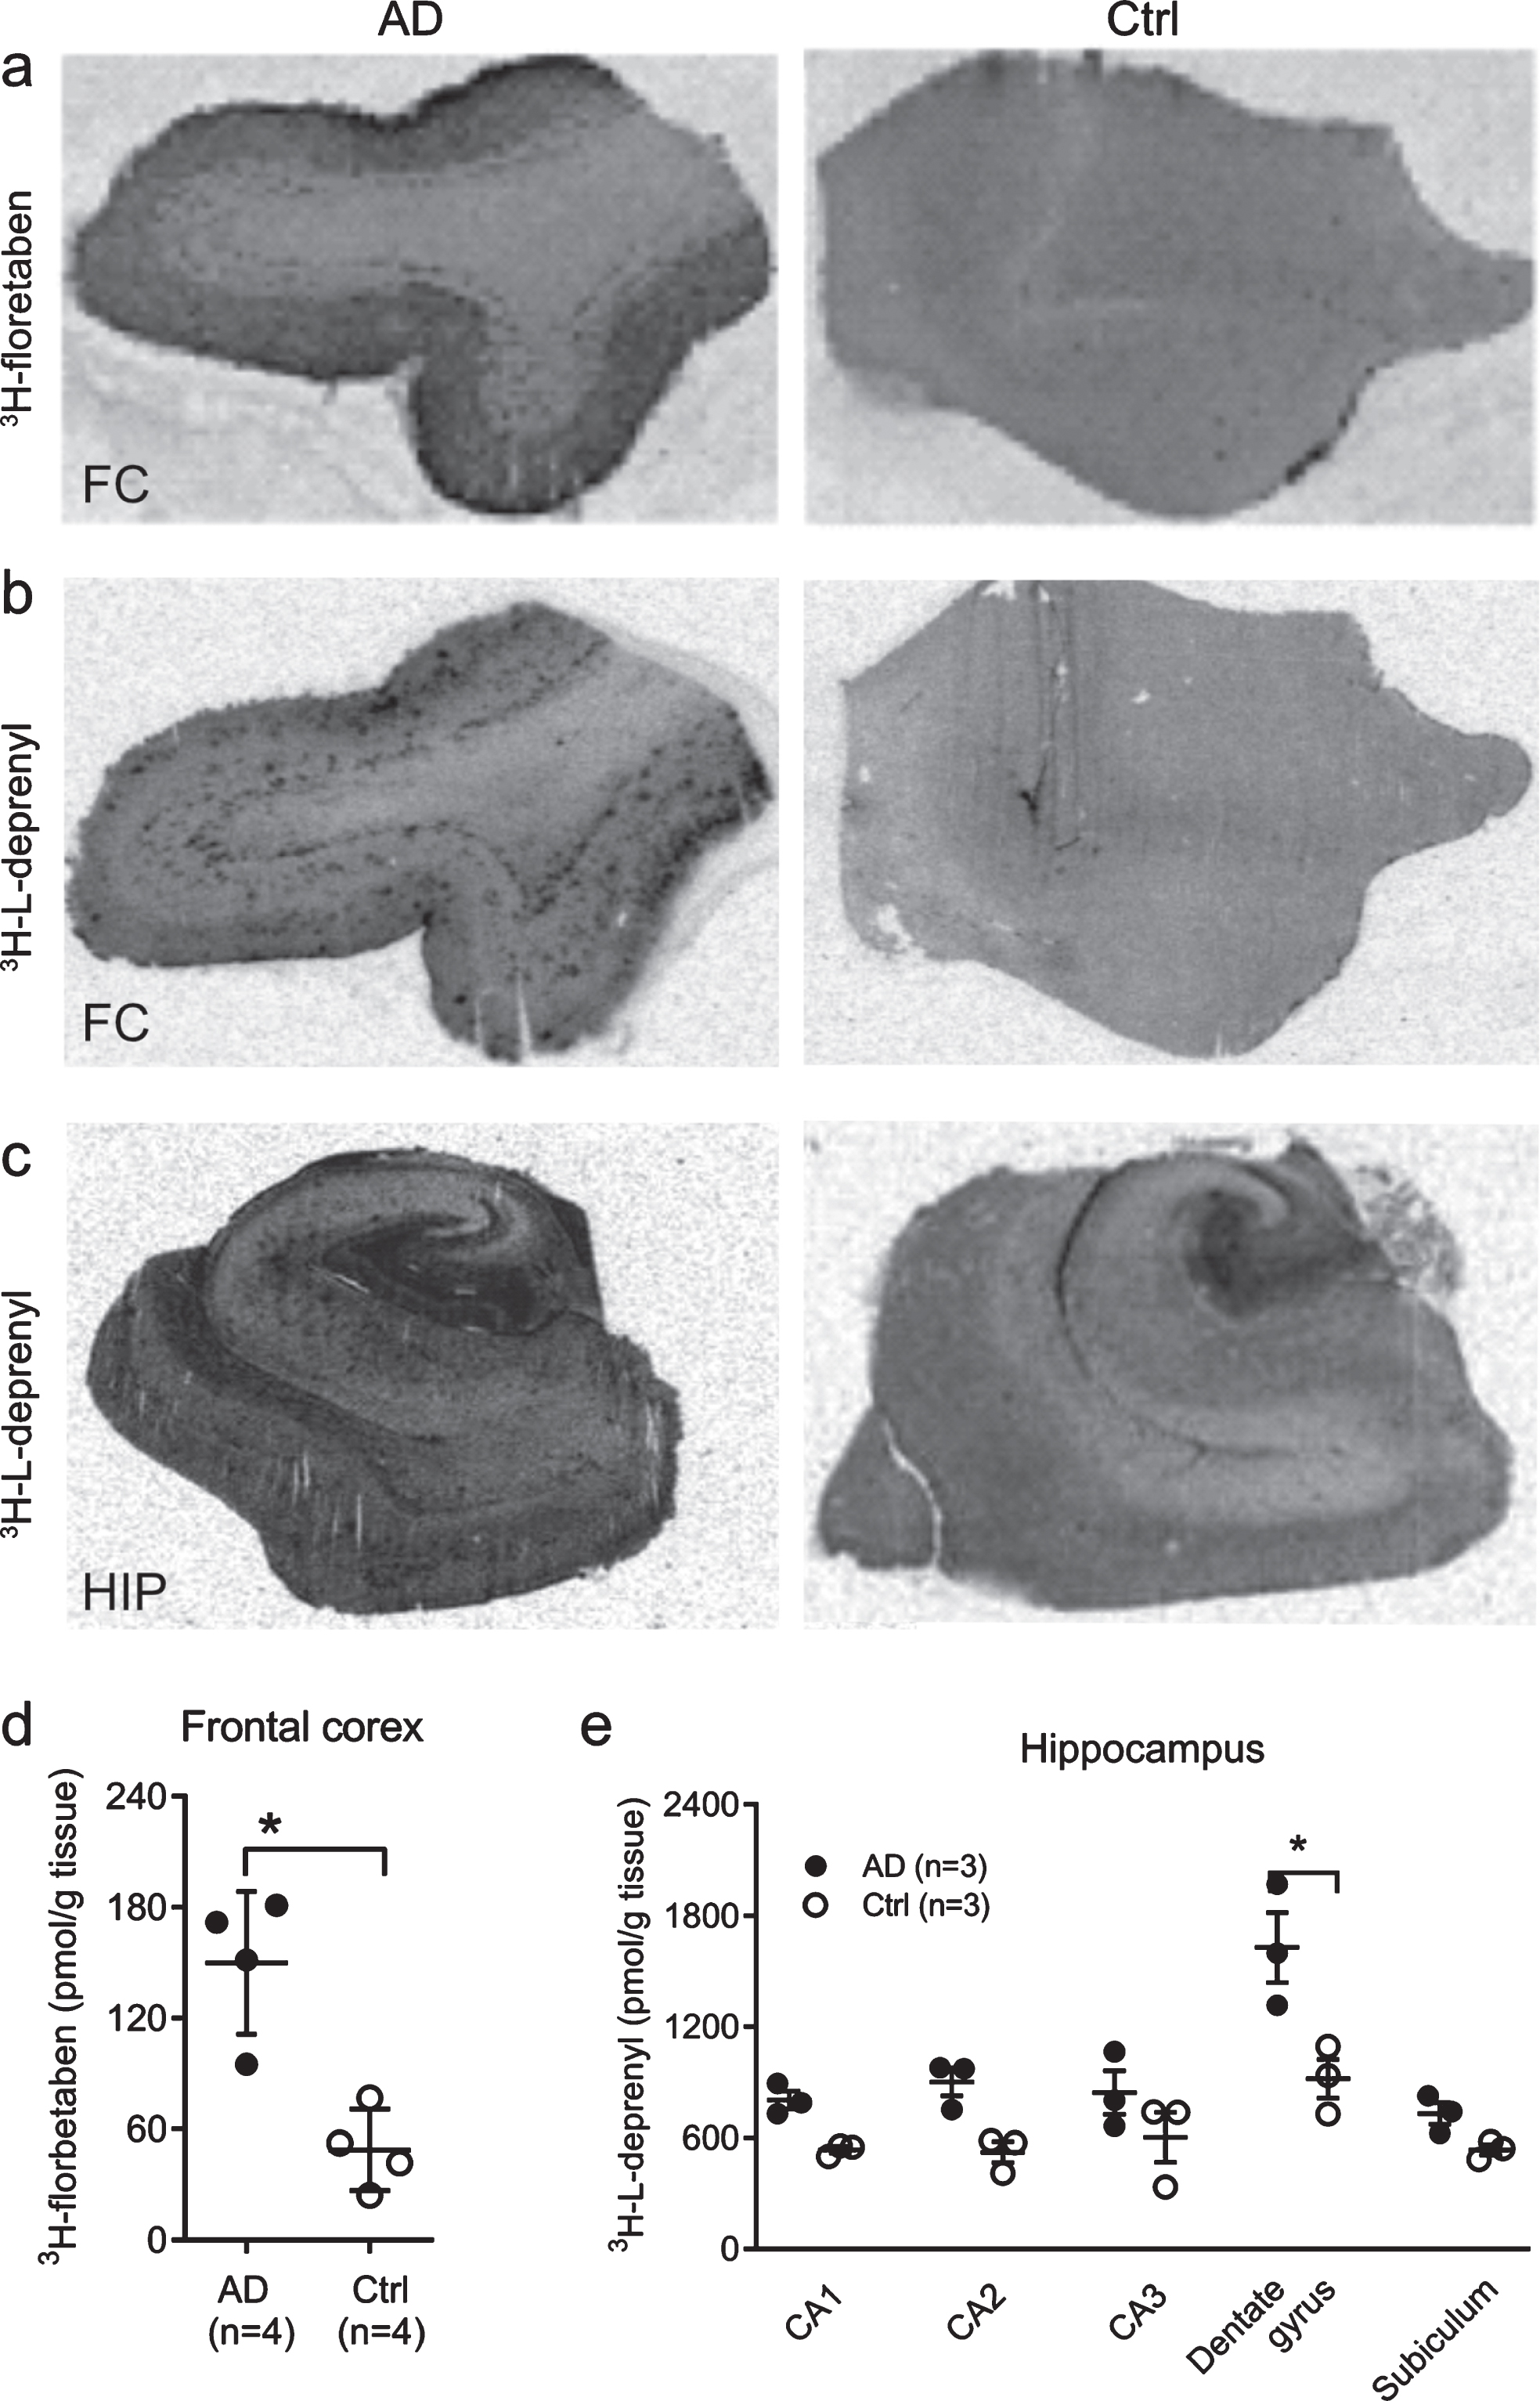
Autoradiography using 3H-florbetaben (2.5 nM) showed increased signal in the grey matter in the frontal cortex slices from AD compared to control cases (p < 0.05) (Fig. 2a, d). To further analyze the sub-regional distribution of 3H-L-deprenyl binding, autoradiography using 3H-L-deprenyl (10 nM) was performed in the frontal cortex and hippocampus slices from three AD and three control cases (Fig. 2b, c). 3H-L-deprenyl binding was higher in the dentate gyrus of AD compared to control cases (p = 0.0306, Fig. 2e). A laminar pattern of 3H-L-deprenyl binding was observed in the frontal cortex (Fig. 2b) which was not observed for 3H-florbetaben (Fig. 2a).
Fig. 2
Autoradiography using 3H-florbetaben and 3H-L-deprenyl in AD and control brain. Autoradiography and quantification in AD (n = 3) and control cases (n = 3), using (a, d) 3H-florbetaben (5 nM) in the frontal cortex slices; (b-c, e) using 3H-L-deprenyl (10 nM) in the frontal cortex and the hippocampus slices; Significant differences between AD and control groups are indicated by *p < 0.05.
Correlation analysis
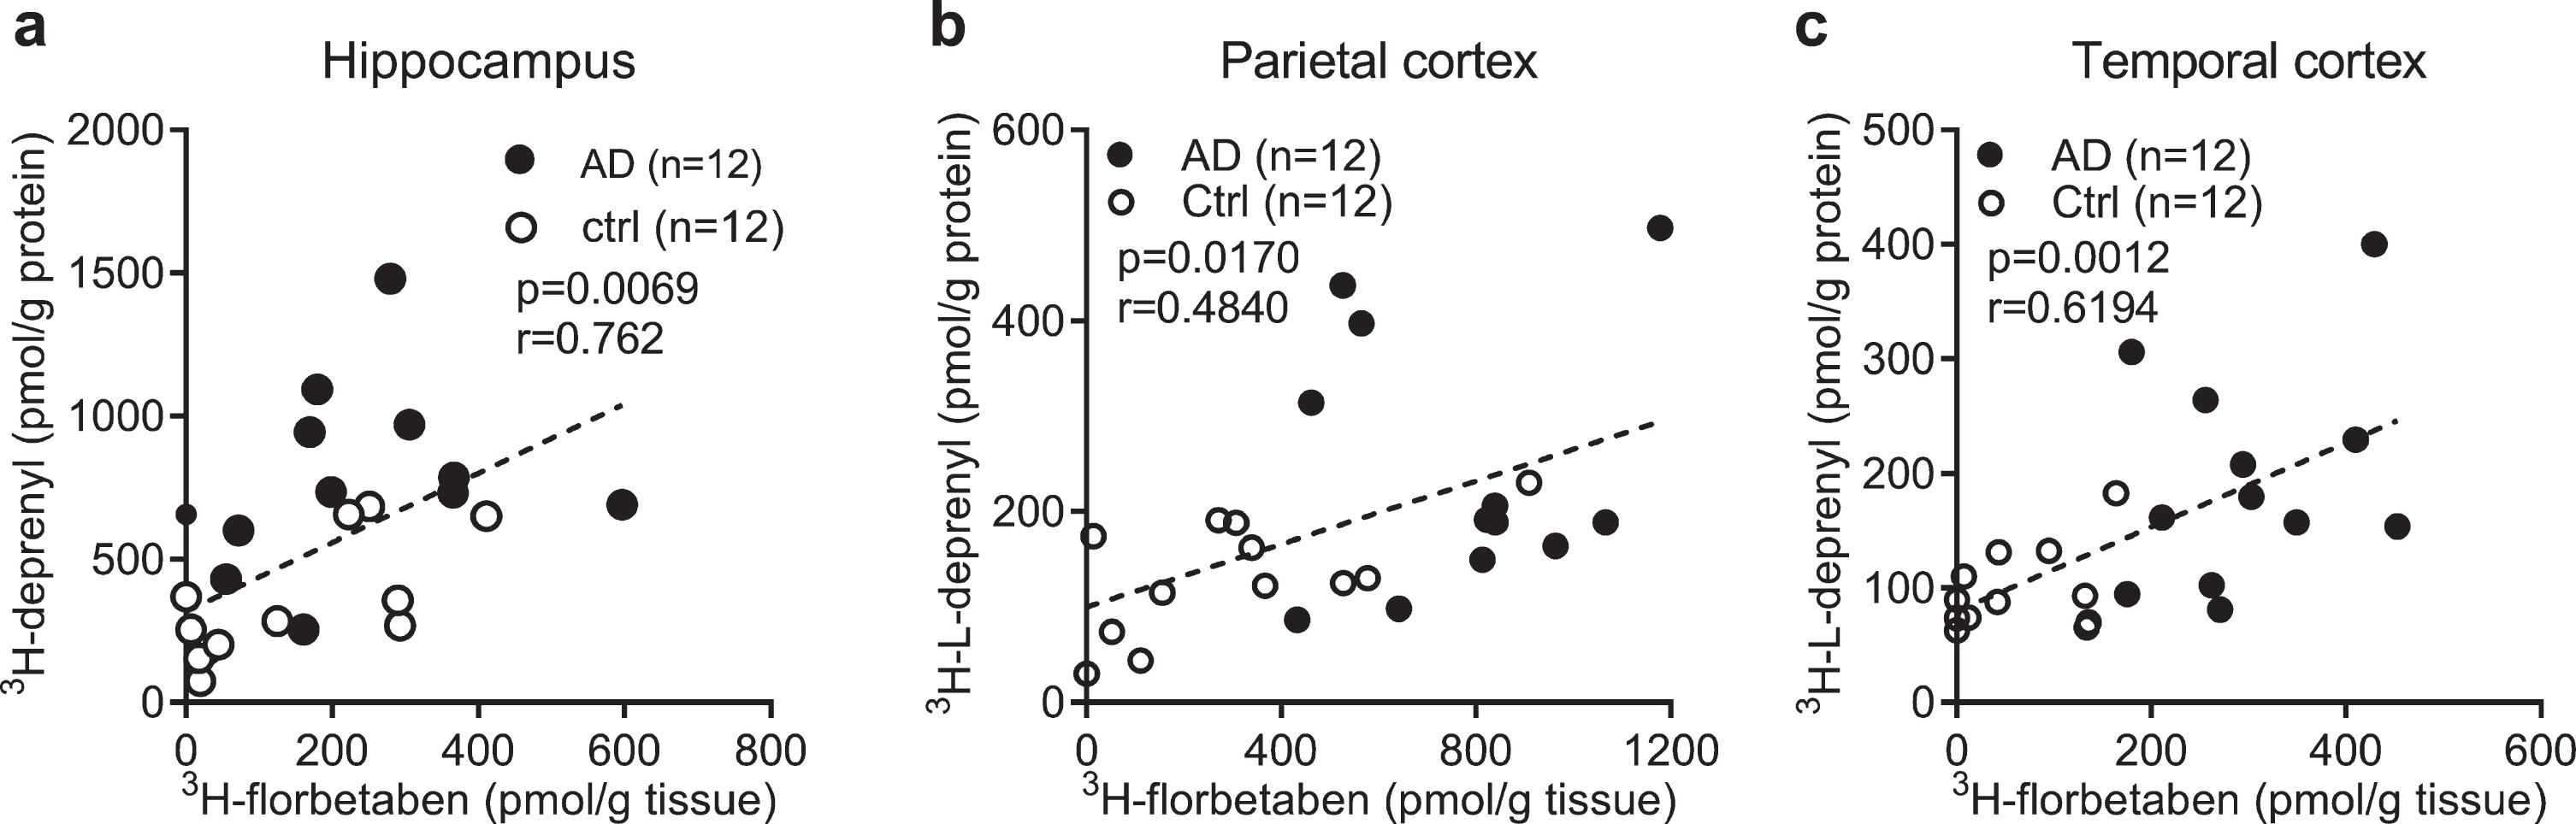
To investigate the relation between the levels of different readouts in AD and control, Pearson’s r correlation analysis was performed. The 3H-florbetaben binding positively correlated with 3H-L-deprenyl binding in the hippocampus, parietal and temporal cortex of AD and control cases (Fig. 3a-c). No significant correlation was observed between 3H-florbetaben and 3H-PK11195 binding in the hippocampus (data not shown). 3H-PIB (1 nM) binding measured in the frontal cortex and parietal cortex showed significant increases in AD (n = 12) compared to control cases (n = 12, p < 0.001); and correlating with 3H-florbetaben binding respectively (Supplementary Figure 2a, b).
Fig. 3
Correlation between regional 3H-florbetaben, 3H-L-deprenyl binding and level of GFAP expression in AD and control brain. a-c) Correlation between 3H-L-deprenyl (6 nM) and 3H-florbetaben (5 nM) binding in the hippocampus, parietal and temporal cortex of AD and control cases.
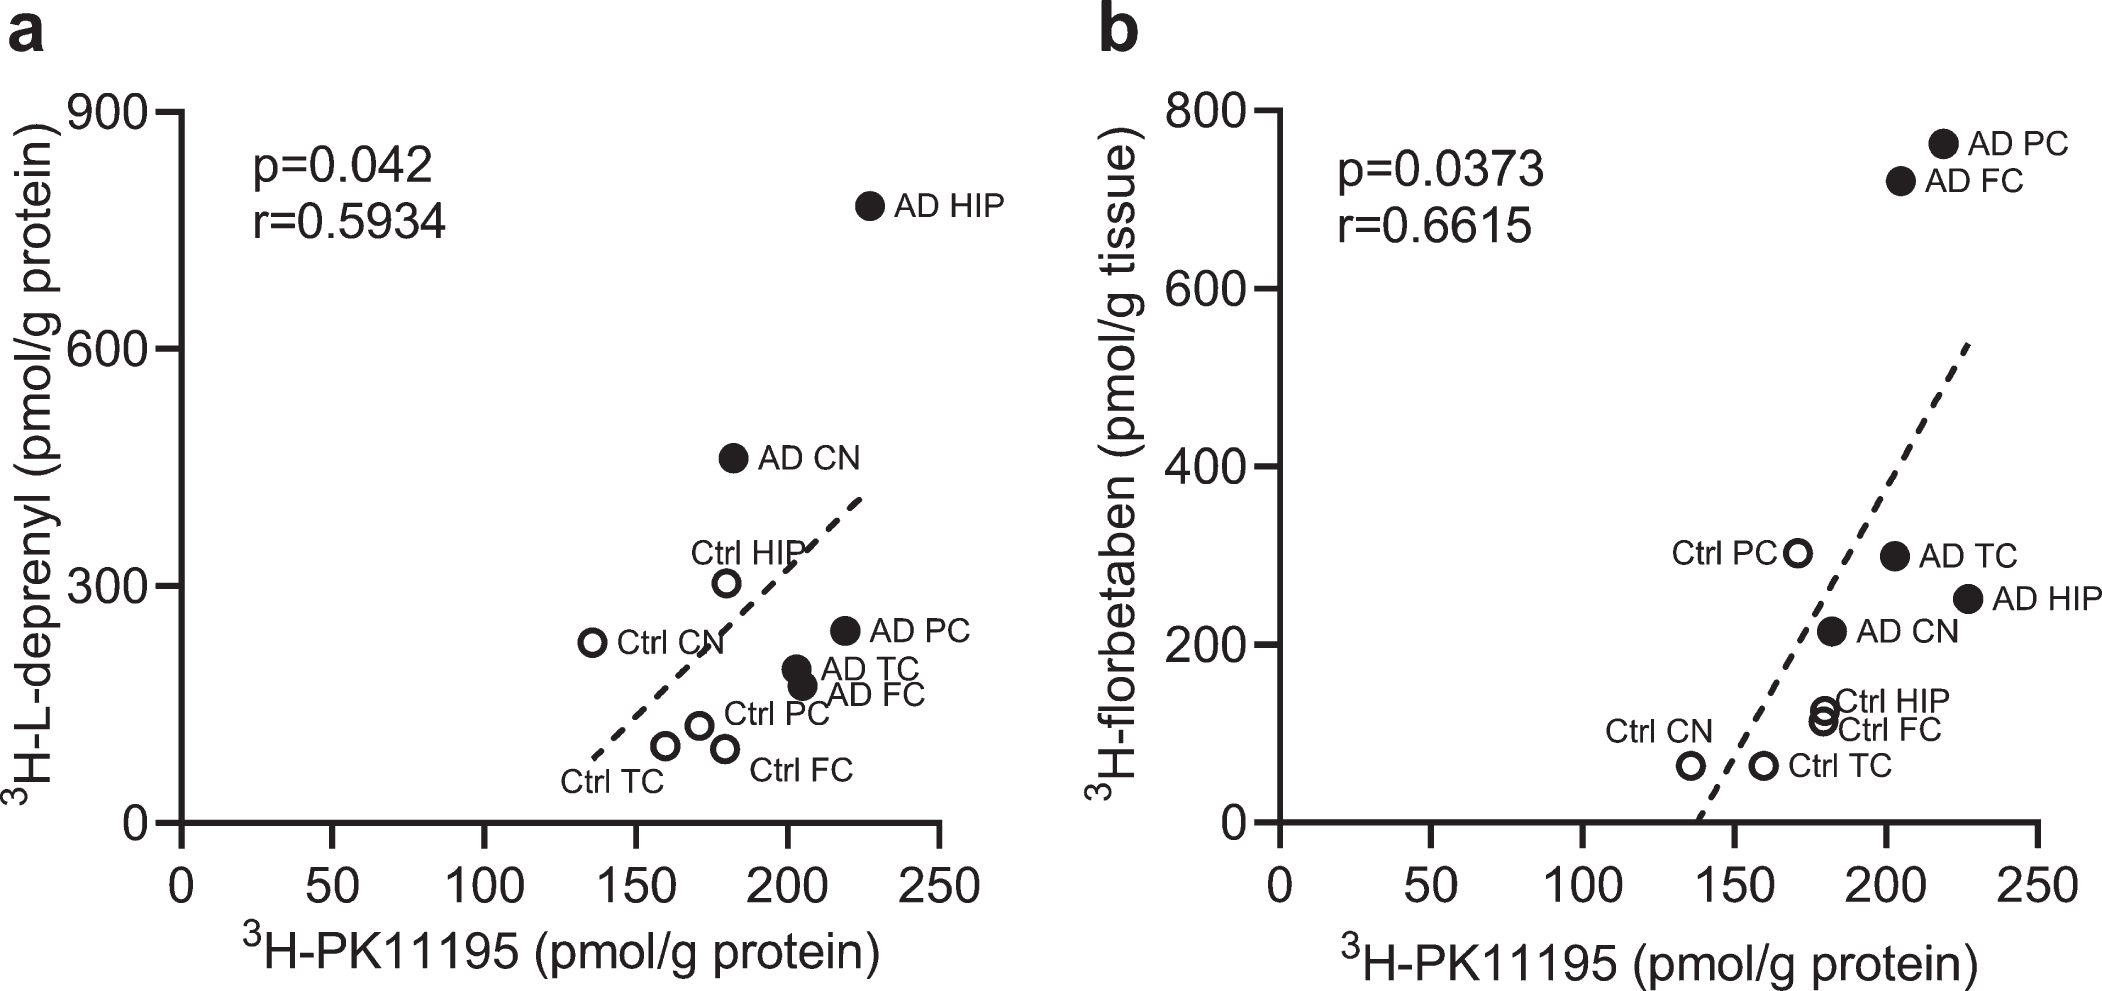
We analyzed the correlation between different readouts across the whole brain. Correlations were observed between 3H-PK11195 and 3H-L-deprenyl binding (p = 0.042, r = 0.5934) in the six brain regions (frontal, parietal, temporal cortex, hippocampus, caudate nucleus and cerebellum) as well as between 3H-PK11195 and 3H-florbetaben binding in AD and control groups across five brain regions (frontal, parietal, temporal cortex, hippocampus, and caudate nucleus) (Fig. 4a, b).
Fig. 4
Correlation between regional 3H-PK11195, 3H-florbetaben, and 3H-L-deprenyl binding in AD and control brain. a) Correlation between 3H-PK11195 (2.5 nM) and 3H-L-deprenyl (6 nM) binding across the six brain regions: frontal cortex (FC), parietal cortex (PC), temporal cortex (TC), hippocampus (HC), caudate Nucleus (CN), and cerebellum (CN). b) Correlation between 3H-PK11195 (2.5 nM) and 3H-florbetaben (5 nM) binding across the five brain regions: FC, PC, TC, HC, and CN.
DISCUSSION
Cellular events such as abnormal Aβ and tau ac-cumulation, dystrophic neurites, reactive astrocytes, and microglia contribute to the pathogenesis of AD. Different pathological subtypes of AD, with/without abnormal Aβ accumulation have been documented [2, 47, 48]. Regional characterization of different molecular pathology profiles in autopsy AD brain thus provides insights into the disease mechanism [49] as well as validation for imaging biomarkers. Here we demonstrated distinct region-spe-cific distributions of Aβ deposits (3H-florbetaben), astrogliosis (3H-L-deprenyl, GFAP) and activated microglia (3H-PK11195) in AD brain.
We showed that regional 3H-florbetaben binding corresponded to the known high cortical and low hippocampal Aβ deposits pattern in AD brain. Good in vivo 18F-florbetaben PET-Aβ histopathology correspondence, specific detection of cerebral Aβ deposits in AD [14, 51–53] has been reported from recent phase III studies. Our results of strong correlation of 3H-florbetaben and 3H-PIB binding is in line with reported comparable binding properties of the tracers [54, 55], and in vivo 11C-PIB and 18F-florbetaben PET head-to-head comparison results [56, 57]. The low hippocampal 3H-florbetaben binding in this study has been observed by in vivo PET using 18F-florbetaben [14] and 11C-PIB [58]. The amyloid tracer binding might differ from the pathological observations on the autopsy brain tissues that Aβ deposits accumulate in hippocampus at early phase II Thal stage [9]. One possible explanation is that the hippocampal Aβ deposits consist of more diffuse and oliogmeric Aβ with lower amount of β-sheet structures. Thus the β-sheet binding amyloid PET tracers show mainly low-affinity binding site as compared to the major high-affinity binding sites in the cortical AD brain tissues [9, 54].
Astrocytes play an important role in the brain physiology, as well as in learning and memory formation [59]. Reactive astrogliosis are dynamic and heterogeneous in their location, subtypes, hypertrophy/proliferation, and upregulation of different markers such as GFAP, vimentin, nestin, MAO-B, and gamma-amino butyric acid [60, 61]. Reactive astrocytes have been shown play an important role early in the development of AD [62, 63]. Elevated 3H-L-deprenyl (MAO-B) measures of astrogliosis was observed in the hippocampus especially in the dentate gyrus, followed by the cortical regions of AD, consistent with autopsy [50, 64, 65] and in vivo 11C-DED PET evidence [3]. The similar regional distribution pattern for amyloid plaques (3H-florbetaben) and astrogliosis (3H-L-deprenyl) may suggest a close relationship in AD pathology. However, a regional difference was observed with high astrogliosis measured in the hippocampus (dentate gyrus), a region with low amyloid plaque load. 3H-L-deprenyl showed a laminar binding pattern in the frontal cortex of AD which was absent for the amyloid plaque tracer 3H-florbetaben binding. This observation is consistent with earlier studies using 3H-L-deprenyl/3H-PIB [50] in the autopsy AD brain: 3H-L-deprenyl binding distributes in all layer in hippocampus and superficial layer in frontal cortex of AD brain, while 3H-PIB binding spreads in the all layers in the frontal cortex.
Regional GFAP expression seems to differ from 3H-L-deprenyl binding in AD brains. In comparison to 3H-L-deprenyl binding, the GFAP expression is most elevated in the frontal cortex of AD and a positive correlation with 3H-L-deprenyl was only observed in the hippocampus. Different distribution patterns of GFAP and 3H-L-deprenyl were also observed in brain of Tg2576 mouse model of AD [66]. These two methods might detect different status/types of astrogliosis, as 1) GFAP is expressed non-uniformly on subtypes of astrocytes [67]; 2) change in glia phenotype profiles but not number of GFAP + astrocytes in AD brain; 3) MAO-B expressed in astrocytes as well as in dopaminergic neurons mainly in subcortical regions.
We found similar high affinities of 3H-PK11195 and 3H-FEMPA in the cortex of AD, in line with reported high-affinity binding sites of 3H-PK11195 [43] and 18F-FEMPA [36]. The presence of subjects with mixed binding sites of 3H-FEMPA may lead to the observed larger variation in binding distribution compared to 3H-PK11195. 3H-PK11195 shows highest binding in the temporal cortex and hippocampus that is markedly affected by tau aggregates as shown by histopathology [68] and in PET investigations [69, 70]. 11C-PK11195 is the first PET tracer for TSPO imaging. Despite its limitations including a short half-life, relatively low brain uptake, suboptimal metabolic profile, high non-specific binding, 11C-PK11195 is still currently the most used TSPO tracer in AD research. The level of 11C-PK11195 and amyloid load measured by 11C-PIB in AD patients were positively correlated within the frontal, parietal and temporal cortices [71, 72]. Recent study using autopsy brain tissues suggest an overlap in the levels of TSPO protein and mRNA between AD and healthy-control, and a limited influence by TSPO rs6971 polymorphism [43]. Novel TSPO tracers with improved binding specificity, SNR and higher brain uptake was pursued, such as 18F-GE-180 [73], 11C-PBR28 [74], 11C-DAA1106 [34], 11C-vinpocetine [75], 18F-DPA-714 [76], 18F-FEPPA [77], and 11C-AC5216 [78]. In addition, new tracers for imaging neuroinflammation beyond TSPO are under development for microgliosis [79, 80] and astrogliosis [4] (including novel MAO-B tracer [81]). Elucidating the cellular origin of the radiotracer binding such as TSPO binding [82] and whether they are selective for pro-inflammatory astrocytes and microglia will be critical [83].
We observe a similar higher regional 3H-florbetaben binding in EOAD and LOAD cases, compared to control cases. This is in line with previous observation by in vivo 11C-PIB imaging in EOAD and LOAD patients showing comparable amyloid load [84]. Interestingly the 3H-L-deprenyl binding was higher in the hippocampus of LOAD compared to EOAD, and lower in the caudate nucleus of LOAD compared to EOAD. For cerebral glucose metabolism (18F-FDG PET), a more pronounced hypometabolism has been reported in EOAD compared to LOAD [84]. Similarly, a higher in vivo binding of tau PET tracers as well as in vitro tau tracer binding have been observed in EOAD compared to LOAD patients [85]. Both FDG and tau tracer binding could be explained by a more pronounced AD pathology in EOAD compared to LOAD. It can be speculated that the finding in this study of higher astrogliosis (higher 3H-L-deprenyl binding) in the hippocampus of LOAD compared to EOAD might be due to more hippocampus sparing cases [86] in the EOAD group which might explain the lower astrogliosis in EOAD compared to LOAD. An increased 11C-DED binding has also been demonstrated in brain by PET in aging [87].
Positive correlations between 3H-florbetaben-GFAP and 3H-florbetaben-3H-L-deprenyl were observed in the hippocampus, parietal cortex, and temporal cortex in the current study. This corresponds to the reported 3H-PIB-GFAP correlation in sporadic AD autopsy brain [19]. However, negative Aβ40-GFAP correlation in both sporadic and familial AD have also been reported [49]. In addition, 3H-PK11195 binding positively correlates with 3H-florbetaben in five brain regions and 3H-L-deprenyl binding in all six brain regions. This corresponds to the reported positive 11C-PIB-11C-PK11195 correlation in AD cases [88]. The regional link between 3H-florbetaben-3H-L-deprenyl appears stronger than 3H-florbetaben-3H-PK11195 (Fig. 3). Reactive astrocytes and activated microglia were observed in the vicinity of Aβ plaques in the AD frontal cortex [89]. Microglial innate immune responses are highly versatile in AD, producing an array of proinflammatory cytokines and mediators in response to Aβ. These proinflammatory changes activates astrocytes, which in turn secretes cytokines such as interleukin-1 and TNF-alpha. Thus, a vicious neuroinflammatory cycle occurs that initiates and propels disease forward to widespread circuits that undergo dysfunction at a later stage.
Regions within the default-mode network (DMN) are highly overlapping with the spatial distribution of both Aβ and tau pathologies detected by using PET [90–94]. The degree of alterations to DMN connectivity has also been found relating to disease progression [92]. The spread of amyloid pathology from the medial temporal lobe has been found associated with glucose metabolism measured by 18F-FDG PET [95, 96].
This study presents the binding properties of different PET tracers for detecting different AD pathologies. We have to conclude that investigations in autopsy AD brain tissues represent the status at final stage of AD. This is in contrast to in vivo PET and MRI studies [3, 4], where the regional rate of deposit of different pathological markers including amyloid plaque load, tau, astrogliosis, and microglia activation, and neurodegeneration in form of hypoglucose metabolism and structural changes (atrophy) can be measured during the time course of the disease from preclinical stages, defined also by the ATN criteria [10]. In addition, there is a rapid development in the field of imaging biomarkers in AD for amyloid-beta, tauopathy [97, 98], neuroinflammation as well as synaptic density measurement [99]. Magnetic resonance imaging diffusion basis spectrum imaging has been used to detect indicators of neuroinflammation in AD, provide further insight into white matter microstructural integrity [100, 101].
There are several limitations of the study. Firstly, additional TSPO gene rs6971 polymorphism data could be useful for categorizing 3H-FEMPA high/mixed/low-affinity binders. Secondly, with regards to astrocyte and microglia subtypes [82], immunohistochemical staining with multiple antibodies such as glutamate synthases for astrocyte and MHC-II for microglia, as well as morphology study for resting versus activating subtypes. Thirdly, difference between the binding properties measured in autoradiography and homogenate assays remains unclear. One explanation is that TSPO and MAO-B, which both locates in the mitochondria, exposes to tracers at different degrees depending on the method adopted [65]. Parallel regional characterization with tau tracers and additional tracers for neuroinflammation will provide with a more comprehensive picture of the pathology in AD brain [69, 70, 102]. Fourthly, regional binding studies with tau PET tracers would have most probably provided valuable data especially regarding binding properties in AD hippocampus and temporal cortices. Unfortunately, we did not have access to any 3H-labelled tau tracer when the studies were performed.
CONCLUSIONS
Our results showed a different regional profile of Aβ plaque deposits versus astrogliosis and microgliosis; and supported the specific measurement by 3H-florbetaben, 3H-L-deprenyl, GFAP expression, and 3H-PK11195 binding in AD and control brains. A clear relationship was observed between Aβ plaque deposition and astrogliosis in AD hippocampus which was not observed for microgliosis. Developing of more specific tracers for disease-relevant gliosis will improve the development of new PET tracers for studies of neuroglia in AD and thereby provide a further understanding of early disease mechanisms important early detection and diagnosis and new treatment targets in AD.
ACKNOWLEDGMENTS
This work was financially supported by a research agreement between Karolinska Institutet and Bayer AG, Pharmaceuticals, Berlin, Germany, the Swedish Foundation for Strategic Research (RB13-0192), the Swedish Research Council (project 05817, 2017-0295, 2017-06086), the Stockholm County Council-Karolinska Institutet regional agreement on medical training and clinical research (ALF grant), the Swedish Brain Foundation, the Alzheimer Foundation in Sweden, and Center for Innovative Medicine, Karolinska Institutet (CIMED).
Authors’ disclosures available online (https://www.j-alz.com/manuscript-disclosures/20-1344r2).
SUPPLEMENTARY MATERIAL
[1] The supplementary material is available in the electronic version of this article: https://dx.doi.org/10.3233/JAD-201344.
REFERENCES
[1] | Heneka MT , Carson MJ , El Khoury J , Landreth GE , Brosseron F , Feinstein DL , Jacobs AH , Wyss-Coray T , Vitorica J , Ransohoff RM , Herrup K , Frautschy SA , Finsen B , Brown GC , Verkhratsky A , Yamanaka K , Koistinaho J , Latz E , Halle A , Petzold GC , Town T , Morgan D , Shinohara ML , Perry VH , Holmes C , Bazan NG , Brooks DJ , Hunot S , Joseph B , Deigendesch N , Garaschuk O , Boddeke E , Dinarello CA , Breitner JC , Cole GM , Golenbock DT , Kummer MP ((2015) ) Neuroinflammation in Alzheimer’s disease, Lancet Neurol 14: , 388–405. |
[2] | Serrano-Pozo A , Betensky RA , Frosch MP , Hyman BT ((2016) ) Plaque-associated local toxicity increases over the clinical course of Alzheimer disease, Am J Pathol 186: , 375–384. |
[3] | Rodriguez-Vieitez E , Saint-Aubert L , Carter SF , Almkvist O , Farid K , Scholl M , Chiotis K , Thordardottir S , Graff C , Wall A , Langstrom B , Nordberg A ((2016) ) Diverging longitudinal changes in astrocytosis and amyloid PET in autosomal dominant Alzheimer’s disease., Brain 139: , 922–936. |
[4] | Carter SF , Herholz K , Rosa-Neto P , Pellerin L , Nordberg A , Zimmer ER ((2019) ) Astrocyte biomarkers in Alzheimer’s disease, Trends Mol Med 25: , 77–95. |
[5] | Arranz AM , De Strooper B ((2019) ) The role of astroglia in Alzheimer’s disease: Pathophysiology and clinical implications, Lancet Neurol 18: , 406–414. |
[6] | Villemagne VL , Burnham S , Bourgeat P , Brown B , Ellis KA , Salvado O , Szoeke C , Macaulay SL , Martins R , Maruff P , Ames D , Rowe CC , Masters CL ((2013) ) Amyloid beta deposition, neurodegeneration, and cognitive decline in sporadic Alzheimer’s disease: A prospective cohort study, Lancet Neurol 12: , 357–367. |
[7] | Thal DR , Rub U , Orantes M , Braak H ((2002) ) Phases of A beta-deposition in the human brain and its relevance for the development of AD, Neurology 58: , 1791–1800. |
[8] | Murray ME , Lowe VJ , Graff-Radford NR , Liesinger AM , Cannon A , Przybelski SA , Rawal B , Parisi JE , Petersen RC , Kantarci K , Ross OA , Duara R , Knopman DS , Jack CR , Jr. , Dickson DW ((2015) ) Clinicopathologic and 11C-Pittsburgh compound B implications of Thal amyloid phase across the Alzheimer’s disease spectrum. Brain 138: , 1370–1381. |
[9] | Thal DR , Rüb U , Schultz C , Sassin I , Ghebremedhin E , Del Tredici K , Braak E , Braak H ((2000) ) Sequence of Aβ-protein deposition in the human medial temporal lobe, J Neuropathol Exp Neurol 59: , 733–748. |
[10] | Jack CR , Jr. , Bennett DA , Blennow K , Carrillo MC , Dunn B , Haeberlein SB , Holtzman DM , Jagust W , Jessen F , Karlawish J , Liu E , Molinuevo JL , Montine T , Phelps C , Rankin KP , Rowe CC , Scheltens P , Siemers E , Snyder HM , Sperling R ((2018) ) NIA-AA Research Framework: Toward a biological definition of Alzheimer’s disease, Alzheimers Dement 14: , 535–562. |
[11] | Klunk WE , Engler H , Nordberg A , Wang Y , Blomqvist G , Holt DP , Bergstrom M , Savitcheva I , Huang GF , Estrada S , Ausen B , Debnath ML , Barletta J , Price JC , Sandell J , Lopresti BJ , Wall A , Koivisto P , Antoni G , Mathis CA , Langstrom B ((2004) ) Imaging brain amyloid in Alzheimer’s disease with Pittsburgh Compound-B, Ann Neurol 55: , 306–319. |
[12] | Curtis C , Gamez JE , Singh U , Sadowsky CH , Villena T , Sabbagh MN , Beach TG , Duara R , Fleisher AS , Frey KA , Walker Z , Hunjan A , Holmes C , Escovar YM , Vera CX , Agronin ME , Ross J , Bozoki A , Akinola M , Shi J , Vandenberghe R , Ikonomovic MD , Sherwin PF , Grachev ID , Farrar G , Smith AP , Buckley CJ , McLain R , Salloway S ((2015) ) Phase 3 trial of flutemetamol labeled with radioactive fluorine 18 imaging and neuritic plaque density, JAMA Neurol 72: , 287–294. |
[13] | Johnson KA , Sperling RA , Gidicsin CM , Carmasin JS , Maye JE , Coleman RE , Reiman EM , Sabbagh MN , Sadowsky CH , Fleisher AS , Murali Doraiswamy P , Carpenter AP , Clark CM , Joshi AD , Lu M , Grundman M , Mintun MA , Pontecorvo MJ , Skovronsky DM , AV45-A11 study group ((2013) ) Florbetapir (F18-AV-45) PET to assess amyloid burden in Alzheimer’s disease dementia, mild cognitive impairment, and normal aging.S, Alzheimers Dement 9: (5 Suppl), 72–83. |
[14] | Sabri O , Sabbagh MN , Seibyl J , Barthel H , Akatsu H , Ouchi Y , Senda K , Murayama S , Ishii K , Takao M , Beach TG , Rowe CC , Leverenz JB , Ghetti B , Ironside JW , Catafau AM , Stephens AW , Mueller A , Koglin N , Hoffmann A , Roth K , Reininger C , Schulz-Schaeffer WJ , Florbetaben Phase 3 Study Group ((2015) ) Florbetaben PET imaging to detect amyloid beta plaques in Alzheimer’s disease: Phase 3 study, Alzheimers Dement 11: , 964–974. |
[15] | Ceccaldi M , Jonveaux T , Verger A , Krolak-Salmon P , Houzard C , Godefroy O , Shields T , Perrotin A , Gismondi R , Bullich S , Jovalekic A , Raffa N , Pasquier F , Semah F , Dubois B , Habert M-O , Wallon D , Chastan M , Payoux P , Ceccaldi M , Guedj E , Ceccaldi M , Felician O , Didic M , Gueriot C , Koric L , Kletchkova-Gantchev R , Guedj E , Godefroy O , Andriuta D , Devendeville A , Dupuis D , Binot I , Barbay M , Meyer M-E , Moullard V , Magnin E , Chamard L , Haffen S , Morel O , Drouet C , Boulahdour H , Goas P , Querellou-Lefranc S , de la Sayette V , Cogez J , Branger P , Agostini D , Manrique A , Rouaud O , Bejot Y , Jacquin-Piques A , Dygai-Cochet I , Berriolo-Riedinger A , Moreaud O , Sauvee M , Crépin CG , Pasquier F , Bombois S , Lebouvier T , Mackowiak-Cordoliani M-A , Deramecourt V , Rollin-Sillaire A , Cassagnaud-Thuillet P , Chen Y , Semah F , Petyt G , Krolak-Salmon P , Federico D , Danaila KL , Guilhermet Y , Magnier C , Makaroff Z , Rouch I , Xie J , Roubaud C , Coste M-H , David K , Sarciron A , Waissi AS , Scheiber C , Houzard C , Gabelle-Deloustal A , Bennys K , Marelli C , Touati L , Mariano-Goulart D , de Verbizier-Lonjon D , Jonveaux T , Benetos A , Kearney-Schwartz A , Perret-Guillaume C , Verger A , Vercelletto M , Boutoleau-Bretonniere C , Pouclet-Courtemanche H , Wagemann N , Pallardy A , Hugon J , Paquet C , Dumurgier J , Millet P , Queneau M , Dubois B , Epelbaum S , Levy M , Habert M-O , Novella J-L , Jaidi Y , Papathanassiou D , Morland D , Belliard S , Salmon A , Lejeune F , Hannequin D , Wallon D , Martinaud O , Zarea A , Chastan M , Pariente J , Thalamas C , Galitzky-Gerber M , Tricoire Ricard A-M , Calvas F , Rigal E , Payoux P , Hitzel A , Delrieu J , Ousset P-J , Lala F , Sastre-Hengan N , Stephens A , Guedj E ((2018) ) Added value of 18F-florbetaben amyloid PET in the diagnostic workup of most complex patients with dementia in France: A naturalistic study., Alzheimers Dement 14: , 293–305. |
[16] | Rowe CC , Ackerman U , Browne W , Mulligan R , Pike KL , O’Keefe G , Tochon-Danguy H , Chan G , Berlangieri SU , Jones G , Dickinson-Rowe KL , Kung HP , Zhang W , Kung MP , Skovronsky D , Dyrks T , Holl G , Krause S , Friebe M , Lehman L , Lindemann S , Dinkelborg LM , Masters CL , Villemagne VL ((2008) ) Imaging of amyloid beta in Alzheimer’s disease with 18F-BAY94-9172, a novel PET tracer: Proof of mechanism, Lancet Neurol 7: , 129–135. |
[17] | Cselenyi Z , Jonhagen ME , Forsberg A , Halldin C , Julin P , Schou M , Johnstrom P , Varnas K , Svensson S , Farde L ((2012) ) Clinical validation of 18F-AZD4694, an amyloid-beta-specific PET radioligand, J Nucl Med 53: , 415–424. |
[18] | Ikonomovic MD , Klunk WE , Abrahamson EE , Mathis CA , Price JC , Tsopelas ND , Lopresti BJ , Ziolko S , Bi W , Paljug WR , Debnath ML , Hope CE , Isanski BA , Hamilton RL , DeKosky ST ((2008) ) Post-mortem correlates of} PiB-PET amyloid imaging in a typical case of Alzheimer’s disease, Brain 131: , 1630–1645. |
[19] | Kadir A , Marutle A , Gonzalez D , Scholl M , Almkvist O , Mousavi M , Mustafiz T , Darreh-Shori T , Nennesmo I , Nordberg A ((2010) ) Positron emission tomography imaging and clinical progression in relation to molecular pathology in the first Pittsburgh Compound B positron emission tomography patient with Alzheimer’s disease, Brain 134: , 301–317. |
[20] | Clark CM , Pontecorvo MJ , Beach TG , Bedell BJ , Coleman RE , Doraiswamy PM , Fleisher AS , Reiman EM , Sabbagh MN , Sadowsky CH , Schneider JA , Arora A , Carpenter AP , Flitter ML , Joshi AD , Krautkramer MJ , Lu M , Mintun MA , Skovronsky DM , Group A-AS ((2012) ) Cerebral PET with florbetapir compared with neuropathology at autopsy for detection of neuritic amyloid-beta plaques: A prospective cohort study, Lancet Neurol 11: , 669–678. |
[21] | Thal DR , Beach TG , Zanette M , Heurling K , Chakra-barty A , Ismail A , Smith AP , Buckley C ((2015) ) [(18)F]flutemetamol amyloid positron emission tomography in preclinical and symptomatic Alzheimer’s disease: Specific detection of advanced phases of amyloid-beta pathology, Alzheimers Dement 11: , 975–985. |
[22] | La Joie R , Ayakta N , Seeley WW , Borys E , Boxer AL , DeCarli C , Doré V , Grinberg LT , Huang E , Hwang J-H , Ikonomovic MD , Jack C , Jagust WJ , Jin L-W , Klunk WE , Kofler J , Lesman-Segev OH , Lockhart SN , Lowe VJ , Masters CL , Mathis CA , McLean CL , Miller BL , Mungas D , O’Neil JP , Olichney JM , Parisi JE , Petersen RC , Rosen HJ , Rowe CC , Spina S , Vemuri P , Villemagne VL , Murray ME , Rabinovici GD ((2019) ) Multisite study of the relationships between antemortem [11C]PIB-PET Centiloid values and postmortem measures of Alzheimer’s disease neuropathology, Alzheimers Dement 15: , 205–216. |
[23] | Fodero-Tavoletti MT , Brockschnieder D , Villemagne VL , Martin L , Connor AR , Thiele A , Berndt M , McLean CA , Krause S , Rowe CC , Masters CL , Dinkelborg L , Dyrks T , Cappai R ((2012) ) } characterization of [18F]-florbetaben, an Abeta imaging radiotracer, Nucl Med Biol 39: , 1042–1048. |
[24] | Calsolaro V , Edison P ((2016) ) Neuroinflammation in Alzheimer’s disease: Current evidence and future directions, Alzheimers Dement 12: , 719–732. |
[25] | Jacobs AH , Tavitian B ((2012) ) Noninvasive molecular imaging of neuroinflammation, J Cereb Blood Flow Metab 32: , 1393–1415. |
[26] | Ekblom J , Jossan SS , Bergstrom M , Oreland L , Walum E , Aquilonius SM ((1993) ) Monoamine oxidase-B in astrocytes, Glia 8: , 122–132. |
[27] | Saura J , Luque JM , Cesura AM , Da Prada M , Chan-Palay V , Huber G , Loffler J , Richards JG ((1994) ) Increased monoamine oxidase B activity in plaque-associated astrocytes of Alzheimer brains revealed by quantitative enzyme radioautography, Neuroscience 62: , 15–30. |
[28] | Fowler JS , Logan J , Shumay E , Alia-Klein N , Wang G-J , Volkow ND ((2015) ) Monoamine oxidase: Radiotracer chemistry and human studies, J Labelled Compd Rad 58: , 51–64. |
[29] | Gulyás B , Pavlova E , Kása P , Gulya K , Bakota L , Várszegi S , Keller É , Horváth MC , Nag S , Hermecz I , Magyar K , Halldin C ((2011) ) Activated MAO-B in the brain of Alzheimer patients, demonstrated by [11C]-l-deprenyl using whole hemisphere autoradiography, Neurochem Int 58: , 60–68. |
[30] | Carter SF , Chiotis K , Nordberg A , Rodriguez-Vieitez E ((2019) ) Longitudinal association between astrocyte function and glucose metabolism in autosomal dominant Alzheimer’s disease, Eur J Nucl Med Mol Imaging 46: , 348–356. |
[31] | Banati RB , Newcombe J , Gunn RN , Cagnin A , Turkheimer F , Heppner F , Price G , Wegner F , Giovannoni G , Miller DH , Perkin GD , Smith T , Hewson AK , Bydder G , Kreutzberg GW , Jones T , Cuzner ML , Myers R ((2000) ) The peripheral benzodiazepine binding site in the brain in multiple sclerosis: Quantitative} imaging of microglia as a measure of disease activity.(Pt 11), Brain 123: , 2321–2337. |
[32] | Papadopoulos V , Baraldi M , Guilarte TR , Knudsen TB , Lacapere JJ , Lindemann P , Norenberg MD , Nutt D , Weizman A , Zhang MR , Gavish M ((2006) ) Translocator protein (18kDa): New nomenclature for the peripheral-type benzodiazepine receptor based on its structure and molecular function., Trends Pharmacol Sci 27: , 402–409. |
[33] | Cagnin A , Brooks D , Kennedy A , Gunn R , Myers R , Turkheimer F , Jones T , Banati R ((2001) ) In-vivo measurement of activated microglia in dementia, Lancet 358: , 461–467. |
[34] | Yasuno F , Ota M , Kosaka J , Ito H , Higuchi M , Doronbekov TK , Nozaki S , Fujimura Y , Koeda M , Asada T , Suhara T ((2008) ) Increased binding of peripheral benzodiazepine receptor in Alzheimer’s disease measured by positron emission tomography with [11C]DAA1106, Biol Psychiatry 64: , 835–841. |
[35] | Kreisl WC , Lyoo CH , McGwier M , Snow J , Jenko KJ , Kimura N , Corona W , Morse CL , Zoghbi SS , Pike VW , McMahon FJ , Turner RS , Innis RB ((2013) ) } radioligand binding to translocator protein correlates with severity of Alzheimer’s disease.2228-, Brain 136: , 2238. |
[36] | Varrone A , Oikonen V , Forsberg A , Joutsa J , Takano A , Solin O , Haaparanta-Solin M , Nag S , Nakao R , Al-Tawil N , Wells LA , Rabiner EA , Valencia R , Schultze-Mosgau M , Thiele A , Vollmer S , Dyrks T , Lehmann L , Heinrich T , Hoffmann A , Nordberg A , Halldin C , Rinne JO ((2015) ) Positron emission tomography imaging of the 18-kDa translocator protein (TSPO) with [18F]FEMPA in Alzheimer’s disease patients and control subjects, Eur J Nucl Med Mol Imaging 42: , 438–446. |
[37] | Fan Z , Calsolaro V , Atkinson RA , Femminella GD , Waldman A , Buckley C , Trigg W , Brooks DJ , Hinz R , Edison P ((2016) ) Flutriciclamide (18F-GE180) PET: First-in-human PET study of novel third-generation} marker of human translocator protein, J Nucl Med 57: , 1753–1759. |
[38] | Hamelin L , Lagarde J , Dorothee G , Leroy C , Labit M , Comley RA , de Souza LC , Corne H , Dauphinot L , Bertoux M , Dubois B , Gervais P , Colliot O , Potier MC , Bottlaender M , Sarazin M , Clinical IMABio3 team ((2016) ) Early and protective microglial activation in Alzheimer’s disease: A prospective study using 18F-DPA-714 PET imaging, Brain 139: , 1252–1264. |
[39] | Wiley CA , Lopresti BJ , Venneti S , Price J , Klunk WE , DeKosky ST , Mathis CA ((2009) ) Carbon 11-labeled Pittsburgh Compound B and carbon 11-labeled (R)-PK11195 positron emission tomographic imaging in Alzheimer disease, Arch Neurol 66: , 60–67. |
[40] | Okello A , Edison P , Archer HA , Turkheimer FE , Kennedy J , Bullock R , Walker Z , Kennedy A , Fox N , Rossor M , Brooks DJ ((2009) ) Microglial activation and amyloid deposition in mild cognitive impairment: A PET study, Neurology 72: , 56–62. |
[41] | Schuitemaker A , Kropholler MA , Boellaard R , van der Flier WM , Kloet RW , van der Doef TF , Knol DL , Windhorst AD , Luurtsema G , Barkhof F , Jonker C , Lammertsma AA , Scheltens P , van Berckel BN ((2013) ) Microglial activation in Alzheimer’s disease: An (R)-[(11)C]PK11195 positron emission tomography study, Neurobiol Aging 34: , 128–136. |
[42] | Venneti S , Lopresti BJ , Wang G , Hamilton RL , Mathis CA , Klunk WE , Apte UM , Wiley CA ((2009) ) PK11195 labels activated microglia in Alzheimer’s disease and} in a mouse model using PET, Neurobiol Aging 30: , 1217–1226. |
[43] | Owen DR , Yeo AJ , Gunn RN , Song K , Wadsworth G , Lewis A , Rhodes C , Pulford DJ , Bennacef I , Parker CA , StJean PL , Cardon LR , Mooser VE , Matthews PM , Rabiner EA , Rubio JP ((2012) ) An 18-kDa translocator protein (TSPO) polymorphism explains differences in binding affinity of the PET radioligand PBR28, J Cereb Blood Flow Metab 32: , 1–5. |
[44] | Fan Z , Okello AA , Brooks DJ , Edison P ((2015) ) Longitudinal influence of microglial activation and amyloid on neuronal function in Alzheimer’s disease, Brain 138: , 3685–3698. |
[45] | Ni R , Marutle A , Nordberg A ((2013) ) Modulation of α7 nicotinic acetylcholine receptor and fibrillar amyloid-β interactions in Alzheimer’s disease brain, J Alzheimers Dis 33: , 841–851. |
[46] | O’Callaghan JP (2002) Measurement of glial fibrillary acidic protein. Curr Protoc Toxicol Chapter 12, Unit 12.8. |
[47] | Whitwell JL , Dickson DW , Murray ME , Weigand SD , Tosakulwong N , Senjem ML , Knopman DS , Boeve BF , Parisi JE , Petersen RC , Jack CR Jr. , Josephs KA ((2012) ) Neuroimaging correlates of pathologically defined subtypes of Alzheimer’s disease: A case-control study, Lancet Neurol 11: , 868–877. |
[48] | Perez-Nievas BG , Stein TD , Tai HC , Dols-Icardo O , Scotton TC , Barroeta-Espar I , Fernandez-Carballo L , de Munain EL , Perez J , Marquie M , Serrano-Pozo A , Frosch MP , Lowe V , Parisi JE , Petersen RC , Ikonomovic MD , Lopez OL , Klunk W , Hyman BT , Gomez-Isla T ((2013) ) Dissecting phenotypic traits linked to human resilience to Alzheimer’s pathology, Brain 136: , 2510–2526. |
[49] | Shinohara M , Fujioka S , Murray ME , Wojtas A , Baker M , Rovelet-Lecrux A , Rademakers R , Das P , Parisi JE , Graff-Radford NR , Petersen RC , Dickson DW , Bu G ((2014) ) Regional distribution of synaptic markers and APP correlate with distinct clinicopathological features in sporadic and familial Alzheimer’s disease, Brain 137: , 1533–1549. |
[50] | Marutle A , Gillberg PG , Bergfors A , Yu W , Ni R , Nennesmo I , Voytenko L , Nordberg A ((2013) ) (3)H-deprenyl and (3)H-PIB autoradiography show different laminar distributions of astroglia and fibrillar beta-amyloid in Alzheimer brain, J Neuroinflammation 10: , 90. |
[51] | Sabbagh MN , Schauble B , Anand K , Richards D , Murayama S , Akatsu H , Takao M , Rowe CC , Masters CL , Barthel H , Gertz HJ , Peters O , Rasgon N , Jovalekic A , Sabri O , Schulz-Schaeffer WJ , Seibyl J ((2016) ) Histopathology and florbetaben PET in patients incorrectly diagnosed with Alzheimer’s disease, J Alzheimers Dis 56: , 441–446. |
[52] | Catafau AM , Bullich S , Seibyl JP , Barthel H , Ghetti B , Leverenz J , Ironside JW , Schulz-Schaeffer WJ , Hoffmann A , Sabri O ((2016) ) Cerebellar amyloid-beta plaques: How frequent are they, and do they influence 18F-Florbetaben SUV ratios? J Nucl Med 57: , 1740–1745. |
[53] | Doré V , Bullich S , Rowe CC , Bourgeat P , Konate S , Sabri O , Stephens AW , Barthel H , Fripp J , Masters CL , Dinkelborg L , Salvado O , Villemagne VL , De Santi S ((2019) ) Comparison of (18)F-florbetaben quantification results using the standard Centiloid, MR-based, and MR-less CapAIBL(®) approaches: Validation against histopathology, Alzheimers Dement 15: , 807–816. |
[54] | Ni R , Gillberg PG , Bergfors A , Marutle A , Nordberg A ((2013) ) Amyloid tracers detect multiple binding sites in Alzheimer’s disease brain tissue, Brain 136: , 2217–2227. |
[55] | Ni R , Gillberg PG , Bogdanovic N , Viitanen M , Myllykangas L , Nennesmo I , Langstrom B , Nordberg A ((2017) ) Amyloid tracers binding sites in autosomal dominant and sporadic Alzheimer’s disease., Alzheimers Dement 13: , 419–430. |
[56] | Villemagne VL , Mulligan RS , Pejoska S , Ong K , Jones G , O’Keefe G , Chan JG , Young K , Tochon-Danguy H , Masters CL , Rowe CC ((2012) ) Comparison of 11C-PiB and 18F-florbetaben for Abeta imaging in ageing and Alzheimer’s disease, Eur J Nucl Med Mol Imaging 39: , 983–989. |
[57] | Rowe CC , Doré V , Jones G , Baxendale D , Mulligan RS , Bullich S , Stephens AW , De Santi S , Masters CL , Dinkelborg L , Villemagne VL ((2017) ) (18)F-Florbetaben PET beta-amyloid binding expressed in Centiloids, Eur J Nucl Med Mol Imaging 44: , 2053–2059. |
[58] | Ossenkoppele R , Jansen WJ , Rabinovici GD , Knol DL , van der Flier WM , van Berckel BN , Scheltens P , Visser PJ , Verfaillie SC , Zwan MD , Adriaanse SM , Lammertsma AA , Barkhof F , Jagust WJ , Miller BL , Rosen HJ , Landau SM , Villemagne VL , Rowe CC , Lee DY , Na DL , Seo SW , Sarazin M , Roe CM , Sabri O , Barthel H , Koglin N , Hodges J , Leyton CE , Vandenberghe R , van Laere K , Drzezga A , Forster S , Grimmer T , Sanchez-Juan P , Carril JM , Mok V , Camus V , Klunk WE , Cohen AD , Meyer PT , Hellwig S , Newberg A , Frederiksen KS , Fleisher AS , Mintun MA , Wolk DA , Nordberg A , Rinne JO , Chetelat G , Lleo A , Blesa R , Fortea J , Madsen K , Rodrigue KM , Brooks DJ Amyloid PET Study Group ((2015) ) Prevalence of amyloid PET positivity in dementia syndromes: A meta-analysis, JAMA 313: , 1939–1949. |
[59] | Kol A , Adamsky A , Groysman M , Kreisel T , London M , Goshen I ((2020) ) Astrocytes contribute to remote memory formation by modulating hippocampal–cortical communication during learning, Nat Neurosci 23: , 1229–1239. |
[60] | Verkhratsky A , Marutle A , Rodriguez-Arellano JJ , Nordberg A ((2014) ) Glial asthenia and functional paralysis: A new perspective on neurodegeneration and Alzheimer’s disease, Neuroscientist 21: , 552–568. |
[61] | Srinivasan K , Friedman BA , Larson JL , Lauffer BE , Goldstein LD , Appling LL , Borneo J , Poon C , Ho T , Cai F , Steiner P , van der Brug MP , Modrusan Z , Kaminker JS , Hansen DV ((2016) ) Untangling the brain’s neuroinflammatory and neurodegenerative transcriptional responses, Nat Commun 7: , 11295. |
[62] | Habib N , McCabe C , Medina S , Varshavsky M , Kitsberg D , Dvir-Szternfeld R , Green G , Dionne D , Nguyen L , Marshall JL , Chen F , Zhang F , Kaplan T , Regev A , Schwartz M ((2020) ) Disease-associated astrocytes in Alzheimer’s disease and aging, Nat Neurosci 23: , 701–706. |
[63] | Chun H , Im H , Kang YJ , Kim Y , Shin JH , Won W , Lim J , Ju Y , Park YM , Kim S , Lee SE , Lee J , Woo J , Hwang Y , Cho H , Jo S , Park J-H , Kim D , Kim DY , Seo J-S , Gwag BJ , Kim YS , Park KD , Kaang B-K , Cho H , Ryu H , Lee CJ ((2020) ) Severe reactive astrocytes precipitate pathological hallmarks of Alzheimer’s disease via H2O2–production, Nat Neurosci 23: , 1555–1566. |
[64] | Jossan SS , Gillberg PG , d’Argy R , Aquilonius SM , Langstrom B , Halldin C , Oreland L ((1991) ) Quantitative localization of human brain monoamine oxidase B by large section autoradiography using L-[3H]deprenyl, Brain Res 547: , 69–76. |
[65] | Tong J , Meyer JH , Furukawa Y , Boileau I , Chang LJ , Wilson AA , Houle S , Kish SJ ((2013) ) Distribution of monoamine oxidase proteins in human brain: Imlications for brain imaging studies. J Cereb Blood Flow Metab 33: , 863–871. |
[66] | Rodriguez-Vieitez E , Ni R , Gulyas B , Toth M , Haggkvist J , Halldin C , Voytenko L , Marutle A , Nordberg A ((2015) ) Astrocytosis precedes amyloid plaque deposition in Alzheimer APPswe transgenic mouse brain: A correlativeositron emission tomography and in vitro imaging study. Eur J Nucl Med Mol Imaging 42: , 1119–1132. |
[67] | Kamphuis W , Middeldorp J , Kooijman L , Sluijs JA , Kooi EJ , Moeton M , Freriks M , Mizee MR , Hol EM ((2014) ) Glial fibrillary acidic protein isoform expression in plaque related astrogliosis in Alzheimer’s disease, Neurobiol Aging 35: , 492–510. |
[68] | Braak H , Braak E ((1991) ) Neuropathological stageing of Alzheimer-related changes., Acta Neuropathol 82: , 239–259. |
[69] | Lemoine L , Saint-Aubert L , Nennesmo I , Gillberg PG , Nordberg A ((2017) ) Cortical laminar tau deposits and activated astrocytes in Alzheimer’s disease visualised by (3)H-THK5117 and (3)H-deprenyl autoradiography, Sci Rep 7: , 45496. |
[70] | Villemagne VL , Fodero-Tavoletti MT , Masters CL , Rowe CC ((2015) ) Tau imaging: Early progress and future directions, Lancet Neurol 14: , 114–124. |
[71] | Parbo P , Ismail R , Hansen KV , Amidi A , Mårup FH , Gottrup H , Brændgaard H , Eriksson BO , Eskildsen SF , Lund TE , Tietze A , Edison P , Pavese N , Stokholm MG , Borghammer P , Hinz R , Aanerud J , Brooks DJ ((2017) ) Brain inflammation accompanies amyloid in the majority of mild cognitive impairment cases due to Alzheimer’s disease, Brain 140: , 2002–2011. |
[72] | Fan Z , Aman Y , Ahmed I , Chetelat G , Landeau B , Ray Chaudhuri K , Brooks DJ , Edison P ((2015) ) Influence of microglial activation on neuronal function in Alzheimer’s and Parkinson’s disease dementia, Alzheimers Dement 11: , 608–621.e607. |
[73] | James ML , Belichenko NP , Shuhendler AJ , Hoehne A , Andrews LE , Condon C , Nguyen TV , Reiser V , Jones P , Trigg W , Rao J , Gambhir SS , Longo FM ((2017) ) [(18)F]GE-180 PET detects reduced microglia activation after LM11A-31 therapy in a mouse model of Alzheimer’s disease, Theranostics 7: , 1422–1436. |
[74] | Kreisl WC , Lyoo CH , Liow JS , Wei M , Snow J , Page E , Jenko KJ , Morse CL , Zoghbi SS , Pike VW , Turner RS , Innis RB ((2016) ) (11)C-PBR28 binding to translocator protein increases with progression of Alzheimer’s disease, Neurobiol Aging 44: , 53–61. |
[75] | Gulyás B , Vas A , Tóth M , Takano A , Varrone A , Cselényi Z , Schain M , Mattsson P , Halldin C ((2011) )Neuroimage 56: , 1111–1121 Age and disease related changes in the translocator protein (TSPO) system in the human bra, ositron emission tomography measurements with [11C]vinpocetine. |
[76] | Hamelin L , Lagarde J , Dorothée G , Potier MC , Corlier F , Kuhnast B , Caillé F , Dubois B , Fillon L , Chupin M , Bottlaender M , Sarazin M ((2018) ) Distinct dynamic profiles of microglial activation are associated with progression of Alzheimer’s disease, Brain 141: , 1855–1870. |
[77] | Ghadery C , Koshimori Y , Coakeley S , Harris M , Rusjan P , Kim J , Houle S , Strafella AP ((2017) ) Microglial activation in Parkinson’s disease using [18F]-FEPPA, J Neuroinflammation 14: , 8. |
[78] | Zhang MR , Kumata K , Maeda J , Yanamoto K , Hatori A , Okada M , Higuchi M , Obayashi S , Suhara T , Suzuki K ((2007) ) 11C-AC-5216: A novel PET ligand for peripheral benzodiazepine receptors in the primate brain, J Nucl Med 48: , 1853–1861. |
[79] | Boche D , Gerhard A , Rodriguez-Vieitez E ((2019) ) Prospects and challenges of imaging neuroinflammation beyond TSPO in Alzheimer’s disease, Eur J Nucl Med Mol Imaging 46: , 2831–2847. |
[80] | Zanotti-Fregonara P , Pascual B , Veronese M , Yu M , Beers D , Appel SH , Masdeu JC ((2019) ) Head-to-head comparison of (11)C-PBR28 and (11)C-ER176 for quantification of the translocator protein in the human brain, Eur J Nucl Med Mol Imaging 46: , 1822–1829. |
[81] | Harada R , Hayakawa Y , Ezura M , Lerdsirisuk P , Du Y , Ishikawa Y , Iwata R , Shidahara M , Ishiki A , Kikuchi A , Arai H , Kudo Y , Yanai K , Furumoto S , Okamura N ((2020) ) (18)F-SMBT-1: A selective and reversible positron-emission tomography tracer for monoamine oxidase-B imaging, J Nucl Med 62: , 253–258. |
[82] | Pannell M , Economopoulos V , Wilson TC , Kersemans V , Isenegger PG , Larkin JR , Smart S , Gilchrist S , Gouverneur V , Sibson NR ((2020) ) Imaging of translocator protein upregulation is selective for pro-inflammatory polarized astrocytes and microglia, Glia 68: , 280–297. |
[83] | Tournier BB , Tsartsalis S , Ceyzériat K , Medina Z , Fraser BH , Grégoire MC , Kövari E , Millet P ((2020) ) Fluorescence-activated cell sorting to reveal the cell origin of radioligand binding, J Cereb Blood Flow Metab 40: , 1242–1255. |
[84] | Rabinovici GD , Furst AJ , Alkalay A , Racine CA , O’Neil JP , Janabi M , Baker SL , Agarwal N , Bonasera SJ , Mormino EC , Weiner MW , Gorno-Tempini ML , Rosen HJ , Miller BL , Jagust WJ ((2010) ) Increased metabolic vulnerability in early-onset Alzheimer’s disease is not related to amyloid burden, Brain 133: , 512–528. |
[85] | Schöll M , Ossenkoppele R , Strandberg O , Palmqvist S , Jögi J , Ohlsson T , Smith R , Hansson O ((2017) ) Distinct 18F-AV-1451 tau PET retention patterns in early- and late-onset Alzheimer’s disease, Brain 140: , 2286–2294. |
[86] | Ferreira D , Nordberg A , Westman E ((2020) ) Biological subtypes of Alzheimer disease. A systematic review and meta-analysis, Neurology 94: , 436–448. |
[87] | Fowler JS , Volkow ND , Wang GJ , Logan J , Pappas N , Shea C , MacGregor R ((1997) ) Age-related increases in brain monoamine oxidase B in living healthy human subjects, Neurobiol Aging 18: , 431–435. |
[88] | Fan Z , Brooks DJ , Okello A , Edison P ((2017) ) An early and late peak in microglial activation in Alzheimer’s disease trajectory, Brain 140: , 792–803. |
[89] | Nagele RG , Wegiel J , Venkataraman V , Imaki H , Wang K-C , Wegiel J ((2004) ) Contribution of glial cells to the development of amyloid plaques in Alzheimer’s disease, Neurobiol Aging 25: , 663–674. |
[90] | Palmqvist S , Schöll M , Strandberg O , Mattsson N , Stomrud E , Zetterberg H , Blennow K , Landau S , Jagust W , Hansson O ((2017) ) Earliest accumulation of β-amyloid occurs within the default-mode network and concurrently affects brain connectivity, Nat Commun 8: , 1214. |
[91] | Buckner RL , Sepulcre J , Talukdar T , Krienen FM , Liu H , Hedden T , Andrews-Hanna JR , Sperling RA , Johnson KA ((2009) ) Cortical hubs revealed by intrinsic functional connectivity: Mapping, assessment of stability, and relation to Alzheimer’s disease, J Neurosci 29: , 1860–1873. |
[92] | Sepulcre J , Schultz AP , Sabuncu M , Gomez-Isla T , Chhatwal J , Becker A , Sperling R , Johnson KA ((2016) ) } tau, amyloid, and gray matter profiles in the aging brain, J Neurosci 36: , 7364–7374. |
[93] | Petrella JR , Sheldon FC , Prince SE , Calhoun VD , Doraiswamy PM ((2011) ) Default mode network connectivity in stable vs progressive mild cognitive impairment, Neurology 76: , 511–517. |
[94] | Pereira JB , Ossenkoppele R , Palmqvist S , Strandberg TO , Smith R , Westman E , Hansson O ((2019) ) Amyloid and tau accumulate across distinct spatial networks and are differentially associated with brain connectivity. eLife 8: , e50830. |
[95] | Hoenig MC , Bischof GN , Seemiller J , Hammes J , Kukolja J , Onur ÖA , Jessen F , Fliessbach K , Neumaier B , Fink GR , van Eimeren T , Drzezga A ((2018) ) Networks of tau distribution in Alzheimer’s disease, Brain 141: , 568–581. |
[96] | Passamonti L , Tsvetanov KA , Jones PS , Bevan-Jones WR , Arnold R , Borchert RJ , Mak E , Su L , O’Brien JT , Rowe JB ((2019) ) Neuroinflammation and functional connectivity in Alzheimer’s disease: Interactive influences on cognitive performance, J Neurosci 39: , 7218–7226. |
[97] | Leuzy A , Chiotis K , Lemoine L , Gillberg PG , Almkvist O , Rodriguez-Vieitez E , Nordberg A ((2019) ) Tau PET imaging in neurodegenerative tauopathies-still a challenge, Mol Psychiatry 24: , 1112–1134. |
[98] | Ono M , Sahara N , Kumata K , Ji B , Ni R , Koga S , Dickson DW , Trojanowski JQ , Lee VMY , Yoshida M , Hozumi I , Yoshiyama Y , van Swieten JC , Nordberg A , Suhara T , Zhang M-R , Higuchi M ((2017) ) Distinct binding of PET ligands PBB3 and AV-1451 to tau fibril strains in neurodegenerative tauopathies, Brain 140: , 764–780. |
[99] | Chen MK , Mecca AP , Naganawa M , Finnema SJ , Toyonaga T , Lin SF , Najafzadeh S , Ropchan J , Lu Y , McDonald JW , Michalak HR , Nabulsi NB , Arnsten AFT , Huang Y , Carson RE , van Dyck CH ((2018) ) Assessing synaptic density in Alzheimer disease with synaptic vesicle glycoprotein 2A positron emission tomographic imaging, JAMA Neurol 75: , 1215–1224. |
[100] | Wang Y , Wang Q , Haldar JP , Yeh FC , Xie M , Sun P , Tu TW , Trinkaus K , Klein RS , Cross AH , Song SK ((2011) ) Quantification of increased cellularity during inflammatory demyelination, Brain 134: , 3590–3601. |
[101] | Wang Q , Wang Y , Liu J , Sutphen CL , Cruchaga C , Blazey T , Gordon BA , Su Y , Chen C , Shimony JS , Ances BM , Cairns NJ , Fagan AM , Morris JC , Benzinger TLS ((2019) ) Quantification of white matter cellularity and damage in preclinical and early symptomatic Alzheimer’s disease, Neuroimage Clin 22: , 101767. |
[102] | Ismail R , Parbo P , Madsen LS , Hansen AK , Hansen KV , Schaldemose JL , Kjeldsen PL , Stokholm MG , Gottrup H , Eskildsen SF , Brooks DJ ((2020) ) The relationships between neuroinflammation, beta-amyloid and tau deposition in Alzheimer’s disease: A longitudinal PET study, J Neuroinflammation 17: , 151–151. |


