
Current and Future Prevalence Estimates of Mild Cognitive Impairment, Dementia, and Its Subtypes in a Population-Based Sample of People 70 Years and Older in Norway: The HUNT Study
Abstract
Background:
Having accurate, up-to-date information on the epidemiology of mild cognitive impairment (MCI) and dementia is imperative.
Objective:
To determine the prevalence of MCI and dementia in Norway using data from a large population-based study.
Methods:
All people 70 + years of age, n = 19,403, in the fourth wave of the Trøndelag Health Study (HUNT4) were invited to participate in the study HUNT4 70 + . Trained health personnel assessed participants using cognitive tests at a field station, at homes, or at their nursing home. Interviewers also completed a structured carer questionnaire in regard to participants suspected of having dementia. Clinical experts made diagnoses according to DSM-5 criteria. We calculated prevalence weighing the data to ensure population representativeness.
Results:
A total of 9,930 (51.2%) of the possible 19,403 people participated, and 9,663 of these had sufficient information for analysis. Standardized prevalence of dementia and MCI was 14.6% (95% confidence interval (CI) 13.9–15.4) and 35.3% (95% CI 34.3–36.4), respectively. Dementia was more prevalent in women and MCI more prevalent in men. The most prevalent dementia subtype was Alzheimer’s disease (57%). By adding data collected from a study of persons < 70 years in the same region, we estimate that there are 101,118 persons with dementia in Norway in 2020, and this is projected to increase to 236,789 and 380,134 in 2050 and 2100, respectively.
Conclusion:
We found a higher prevalence of dementia and MCI than most previous studies. The present prevalence and future projections are vital for preparing for future challenges to the healthcare system and the entire society.
INTRODUCTION
Dementia is a progressive syndrome caused by various illnesses and affecting cognitive functions, behavior, and the ability to manage everyday activities [1]. Globally, over 46 million people have de-mentia, and this number is expected to nearly triple, increasing to 131.5 million by 2050 [2]. Dementia causes distress for those who have it and for their families, and the costs of dementia care worldwide were US$ 1 trillion in 2018 [3]. Due to its social and economic impacts, the World Health Organization (WHO) has made dementia a public health priority [4].
Four meta-analyses and reviews of prevalence studies conducted from the 1980s until recently [5–8] found a consistent increase of dementia with age, with prevalence nearly doubling with every 5–6 years of age from age 65 on. Most of the included studies found a higher prevalence in women, and in the studies reporting on subtypes of dementia, the most common cause for both men and women was Alzheimer’s disease (AD).
The increase in the number of people with dementia is due to an aging population worldwide. However, some studies have reported declines in the prevalence and incidence of dementia in Europe and the United States [9–12]. In contrast, two recent Scandinavian studies found a higher prevalence than reported in earlier European studies [13, 14]. Differences in met-hodology can explain some of the variation across prevalence studies, and this calls for a methodological consensus in order to acquire more-reliable prevalence estimates of dementia [6, 15, 16].
Ascertaining the prevalence of dementia requires multidomain test batteries, informant interviews, a structured assessment of daily function, and a clinical interview and assessment to rule out other reasons for cognitive impairment in large population-representative cohorts, preferably in a one-phase design [17]. Most previous studies fail to meet these standards. Many of the studies that had two-phased designs did not sample screen negatives; studies rarely had a sample size >1000 and often did not include the oldest old and people in long-term care [18, 19].
Monitoring secular trends in dementia epidemi-ology is of key importance for providing decision-makers with adequate tools for meeting the immense challenges that the rising prevalence of dementia entails. However, descriptive population-based rese-arch into dementia in high-income countries has decreased sharply after peaking in the 1990s, al-though accurate, up-to-date figures are required for planning and policy-making [6].
Mild cognitive impairment (MCI) is defined as an absence of dementia, no or minimal functional im-pairment, subjective cognitive complaint or concern, and cognitive impairment based on previously at-tained levels, as measured using a cognitive test or assessment scale [20, 21]. MCI is important clinically as it may be a predementia syndrome, and individuals who have it are at high risk for dementia; however, many do not show progression and may even revert to normal cognition [22, 23]. Prevalence estimates for MCI show large variations but applying uniform criteria for data harmonization may reduce these considerably [24]. Persons with MCI can be classified into two subcategories: amnestic MCI with impaired episodic memory and non-amnestic with impairment in cognitive domains other than memory, such as executive function, language, or visuospatial abilities [25]. Some studies have indicated that those with amnestic MCI have a higher risk of progressing to dementia than those with non-amnestic MCI, but results are inconclusive [26]. Previous studies have indicated that amnestic MCI has a high likelihood of progressing to AD, whereas non-amnestic MCI is likely to progress to other types of dementia [21, 27].
The present population-based prevalence study is part of the Norwegian Dementia Plan 2020 and was initiated by the Norwegian government [28]. The aim of this paper is to present national prevalence estimates for dementia and MCI, as well as future projections of dementia prevalence based on a large-scale population-based data collection, including nursing home patients and home-dwelling older adults.
MATERIAL AND METHODS
Participants
The present study includes persons 70 years + recruited from the county of Trøndelag in Central Norway as part of the fourth wave of the Trøndelag Health Study (HUNT) [29]. The present study is called HUNT4 70 + . The HUNT Study has invited the entire adult population in the same geographic area to participate in four waves: HUNT1 (1984–1986), HUNT2 (1995–1997), HUNT3 (2006–2008), and HUNT4 (2017–2019). The study comprises questionnaires, clinical measurements, and collections of biological samples [30]. The data collection for HUNT4 70 + took place from September 2017 until March 2019.
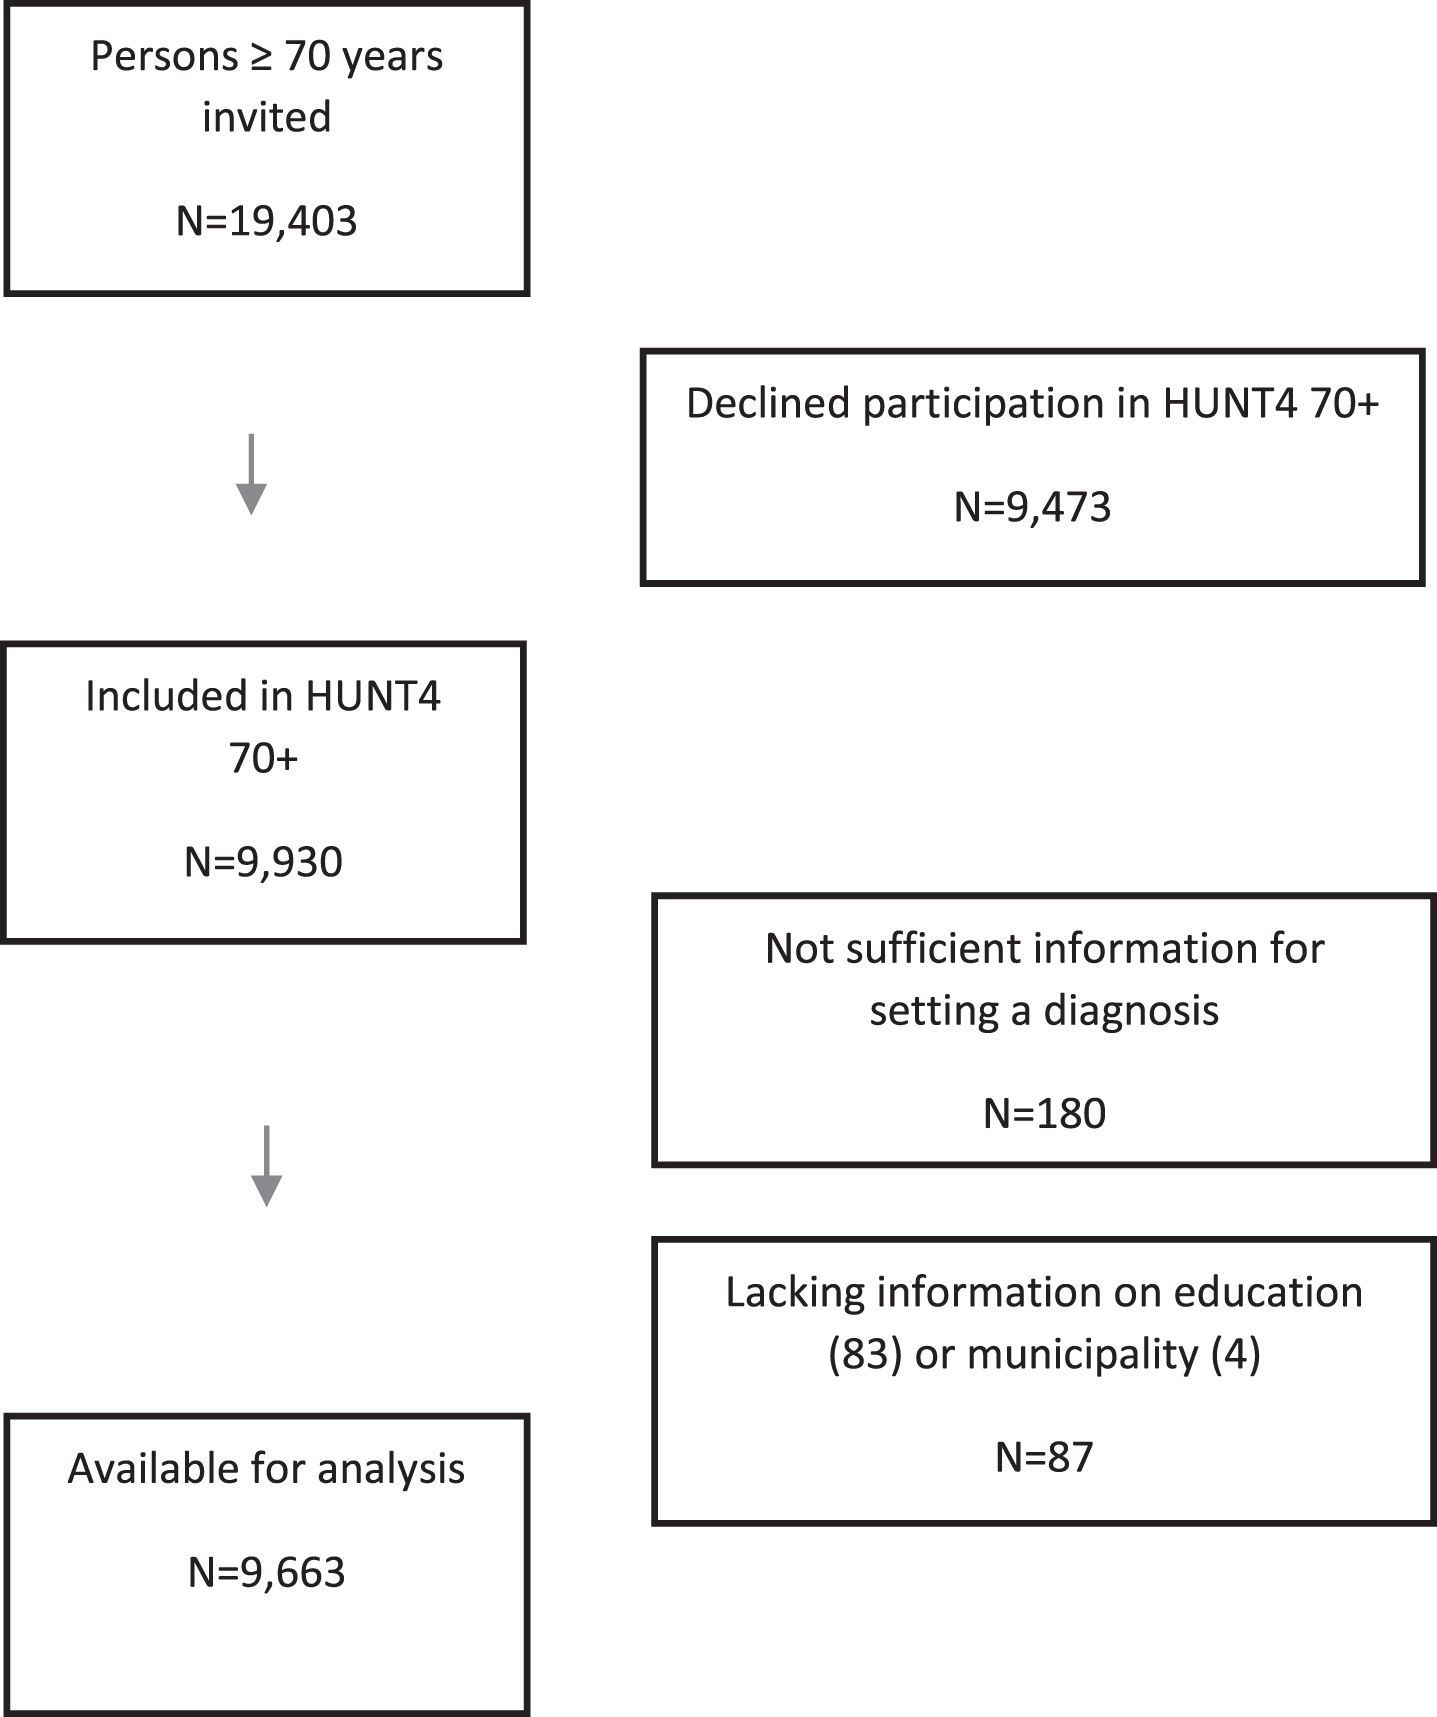
The northern area of Trøndelag, where the HUNT Studies have taken place, consists of rural areas and small towns (less than 25,000 inhabitants). The number of immigrants and proportion of people with higher educational levels in this part of Trøndelag are below the national average [31]. However, cause-specific mortality, general health, unemployment rate, and disability insurance differ little from the national average, and the population composition in this area reflects the rest of the country with both coastal, inland, and small-town populations [31, 32]. All persons age 70 and older (19,403) with registered residence in one of the 23 municipalities in the catchment area were eligible for inclusion in the study. No further inclusion or exclusion criteria were applied. In all, 9,930 persons (51.2%) consented to participation in the HUNT4 70 + Study. When assessing the participants, information was not sufficient for categorization of cognitive status of 180 participants, and for 87 participants, information on education (n = 83) and municipality (n = 4), which were essential for the weighting procedure, was lacking. Thus, the sample for analysis included 9,663 participants (Fig. 1). Those who were excluded from the analysis because of insufficient information (n = 267) were older (83.1 years versus 77.9 years, p < 0.001) than those who were included, but there was no difference in regard to sex.
Fig. 1
Flow chart.
Estimates of the prevalence of dementia in persons < 70 years of age were based on data from a population-based study of young-onset dementia conducted in the same region [33].
Ethics
The HUNT4 70 + data collection was approved by the Norwegian Data Protection Authority. Participation was based on an informed written consent. When a participant’s ability to consent was reduced, based on the judgment of health personnel in nursing homes and assessors, informed written consent was provided by the closest proxy. The present study was also approved by the Regional Committee for Medical and Health Research Ethics in Norway (REK South East D 82985) and the Norwegian Centre for Research Data (NSD 791342). It has been registered in ClinicalTrials.gov with the identification number NCT04289389.
Study design
We used a one-phase design. All participants un-derwent a comprehensive clinical evaluation. Based on each participant’s preference, health personnel assessed individuals at a field station (86.9%), in the participant’s home (7.2%), or at the nursing home (5.9%). In each municipality, a field station was es-tablished where all participants came to have their health examination and standardized interviews. The assessors received a standardized two-day training in dementia assessment and other assessment-related topics prior to the data collection.
All participants at the field stations and at home were assessed using the same protocol. In the nursing home, a protocol adapted to the functional level of the participant was applied, with more of the information being obtained from healthcare personnel. Participants at the field stations and at their homes who reported subjective cognitive decline or who scored below age-adjusted cut-offs on the cognitive tests (see Supplementary Material) were asked if we could conduct a structured telephone interview with their choice of their next of kin. In all participants living in nursing homes, permission to conduct an interview with the next of kin was requested. The telephone interview with the next of kin was conducted to obtain more information about any cognitive changes, level of functioning, and neuropsychiatric symptoms and the onset and course of possible dementia symptoms (see Supplementary Material).
Assessments
Table 1 provides an overview of the assessments that were used to establish a diagnosis of MCI or dementia. They cover cognition, function in daily life, neuropsychiatric symptoms, subjective cognitive decline, symptom debut, and course of the condition. We collected demographic data regarding living situation, marital status, and education. Education was categorized as primary (<10 years), secondary (10–12 years), and tertiary (>12 years), based on information from the participant or his or her next of kin.
Table 1
Assessment tools and questionnaires applied in the diagnostic process
| Assessment tools and questionnaires | Field station | Home visit | Nursing home | Next of kin |
| Montreal Cognitive Assessment (MoCA) [34] | X | X | X | |
| CERAD Word List test (WLMT) [35] | X | X | ||
| Severe Impairment Battery-8 (SIB-8) [36] | X | |||
| Core symptoms for dementia subtypes, debut and course | X | X | X | X |
| Subjective cognitive decline** | X | X | X | X |
| Family history of dementia | X | X | X | |
| Former dementia assessment and diagnosis | X | X | X | X |
| Instrumental Activities in Daily Living Scale (I-ADL) [58] | X* | |||
| Physical Self-Maintenance Scale (PSMS) [58] | X | X* | ||
| Neuropsychiatric Inventory Questionnaire (NPI-Q) [59] | X | X | ||
| Clinical Dementia Rating Scale (CDR) [60] | X | X | ||
| Hospital Anxiety and Depression Scale (HADS) [61] | X | X | X |
*A confirmation of difficulties in Instrumental or Personal ADL was defined as having problems with at least one of the activities described in the I-ADL or PSMS scale, respectively; **Questionnaire for rating of subjective cognitive decline in the Supplementary Material.
The cognitive assessment protocol comprised the Montreal Cognitive Assessment (MoCA) scale [34] and the Word List Memory Task (WLMT) from the Consortium to Establish a Registry of Alzheimer’s disease [35]. The MoCA scale is a multidomain cog-nitive screening instrument that tests memory, visuospatial and executive functions, naming, attention, abstraction, language, and orientation with scores from 0–30; higher scores indicate better cognitive function. We additionally conducted the WLMT with those scoring ≥22 on MoCA. The WLMT tests memory with a list of 10 words that the person being tested is asked to recall after each of three initial presentations (immediate recall) (score 0–30) and again after 10 min (delayed recall) (score 0–10). We used it to gain additional information about memory for those with mild memory difficulties not detected by the MoCA.
For nursing home residents, an adapted interview protocol was applied. Health personnel who knew the participants well provided information about the participants’ cognition and dementia symptoms. For participants who were considered to have moderate to severe dementia, the Severe Impairment Battery-8 (SIB-8) [36] was used instead of the MoCA. The SIB-8 is a short version of the Severe Impairment Battery [37], a well-validated instrument designed to assess cognition in moderate to severe dementia.
Diagnosis of dementia or mild cognitive impairment
For each individual, two experts from a diagnostic work-up group of nine medical doctors with comprehensive scientific and clinical expertise (geriatrics, old-age psychiatry, or neurology) made independent diagnoses of dementia and mild cognitive impairment by applying the DSM-5 diagnostic criteria [38]. If no consensus was reached after comparing the diagnosis between the two experts, a third was consulted. The diagnostic work-up group had access to all the available data.
Participants were categorized into one of four gr-oups: no cognitive impairment, amnestic MCI, non-amnestic MCI, or dementia. Amnestic MCI was diagnosed when the predominant cognitive symptom was memory impairment, whereas non-amnestic MCI was diagnosed when other cognitive symptoms were dominant, with a relative sparing of memory [25]. Furthermore, people with a diagnosis of dementia were categorized as having Alzheimer’s disease (AD), vascular dementia (VaD), Lewy body dementia (including dementia with Lewy bodies and Parkinson’s disease dementia) (LBD), frontotemporal dementia (FTD), mixed dementia, other specified dementia, or unspecified dementia. We did not have access to any biological data, so dementia subtypes were mainly determined based on information about clinical symptoms and symptom course from the next of kin (Supplementary Material). Standard diagnostic criteria according to the DSM-5 were applied for MCI (mild neurocognitive disorder), dementia (major neurocognitive disorder), and all the dementia subtypes [38]. Mixed dementia was defined as dementia due to multiple etiologies in line with the DSM-5 criteria for Major Neurocognitive Disorder due to Multiple Etiologies.
Before starting the diagnostic procedure, the clinical experts attended a seminar where the rules for diagnosis, including diagnostic criteria, were revi-ewed, and consensus was established. At a meeting prior to the diagnostic work-ups, the clinical experts independently classified 50 cases as no cognitive impairment, mild cognitive impairment, dementia, or “could not be classified” according to DSM-5 criteria. The Fleiss’ kappa overall was 0.70, with a 95% confidence interval (CI) 0.66, 0.74, and for dementia, it was 0.90; 95% CI 0.79, 0.90. These results were subsequently discussed in order to harmonize the classification between the experts. The entire group had frequent web-based discussions around the procedure and concerning specific complicated cases. We did not apply any specific cutoff scores for the cognitive tests as this differs across studies according to level of education and age. However, to assist in the diagnostic process, z-scores for the present sample normalized by mean and standard deviations (SD) of other recent norm materials for MoCA [39, 40] and WLMT recall [41, 42] were generated.
Dementia prevalence in persons below 70 years of age
Data for prevalence estimates for persons below 70 years of age were collected from another population-based study of dementia that was conducted in Nord-Trøndelag. The inclusion period for this project was July 2014–June 2018. Dementia teams, residential living facilities, and nursing homes in each municipality were contacted by phone and were asked to identify all known cases of dementia in individuals younger than 70 years. Relevant departments of all the hospitals in the region were contacted; med-ical records were investigated; and dementia di-agnoses were verified. The project was approved by the Regional Ethics Committee Mid-Norway (2014/487). Results for the group below 65 years of age have been published earlier [33], whereas the results for the group ages 65–69, applying the same methodology, have been made available for the present study.
Statistical analysis
Basic descriptive statistics such as mean, standard deviation, and proportion were calculated, and crude differences between groups were assessed using the chi-squared test for discrete variables and the t-test for continuous variables.
The prevalence of dementia and MCI was estimated using weighting in two steps [43]: First, we applied inverse probability weighting (IPW) to adjust the prevalence estimates for non-response (responders comprised our study sample (n = 9,663) and non-responders comprised all eligible participants for inclusion in the study not being part of the study sample (n = 19,403-9,663 = 9,740)); secondly, the estimates were calibrated using post-stratification weights and registry data for the total Norwegian population by age and sex, and by education in three groups (<10 years; 10–12 years; >12 years). This last step allowed us to develop population estimates for all of Norway based on the regional estimates. The sample and Norway differed according to educational level; among men in the study sample, 31% had primary education (<10 years) compared to 25% in all of Norway. Corresponding numbers in women were 51% with primary education in the study sample and 33% in all of Norway.
The non-response weights used for IPW were created based on probability of participation and pre-dicted from a logistic regression model where a dichotomous response variable was regressed against sex, age, and municipality. Men had slightly lower odds for participation, but this difference was not significant. Odds for participation fell significantly with age, and there were differences in participation across the municipalities. For the participants, the weights were then calculated as the inverse of the predicted probability of participation. These weights were further adjusted to correspond to the nursing home pre-valence in Nord-Trøndelag County in 2019 for the population age 70 and above (5.1% in the Nord-Trøndelag County versus 5.9% in the study sample). Since we did not have nursing home information for the non-participants, the IPW weights for participants were multiplied by 0.051/0.059 for nursing home residents and by (1–0.051)/(1–0.059) for community home dwellers. The weights had a mean of 1.96 (SD 0.24; min 1.01; max 3.04). In the calculation of dementia and MCI prevalence in Nord-Trøndelag, the analysis was weighted applying these weights and using the ‘svy’ command in Stata. To estimate the prevalence of dementia and MCI for the Norwegian population, post-stratification weights for Norway for the year 2019 by age, sex, and education were added to the model in addition to IPW. Prevalence differences between groups were assessed using a design-based chi-squared test, and trend in prevalence across age was estimated in logistic regression. In both settings, the survey design (non-response weighting and calibration) was taken into account by applying the svy command in Stata.
To predict the number of dementia cases for the years 2020, 2050, and 2100, the estimated prevalence by age groups and sex was multiplied by the population sizes for 2020 and the predicted population sizes for Norway in 2050 and 2100, respectively, using the main alternative from Statistics Norway, which is the most likely scenario based on future fertility, mortality, emigration, and immigration [44].
We performed a range of sensitivity analyses. Wit-hout the non-response and nursing home corrections, the overall dementia prevalence was elevated by 0.4 percentage points. Without any calibration against Norway, the prevalence increased by 0.8 percentage points. Finally, without non-response weighting and calibration, the prevalence was elevated by 0.6 percentage points.
RESULTS
Table 2 presents demographic and clinical characteristics of the sample; 8,399 participants (86.9%) were assessed at the field stations, 695 (7.2%) in their homes, and 569 (5.9%) in nursing homes. We interviewed the closest family proxy of 2,565 participants (26.5%), and 970 (10.0%) confirmed that there had been a substantial decline in the participant’s memory over the past five years. Men had a higher level of education (p < 0.001); women were older (p < 0.001) and had higher scores on the MoCA (p = 0.001). The distribution of MoCA scores can be seen in Supplementary Material.
Table 2
Sociodemographic and cognitive test results
| Men (n = 4,406) | Women (n = 5,257) | Total (n = 9,663) | |
| Age –mean (SD, min/max) | 77.3 (6.0, 70/103) | 78.5 (6.7, 70/102) | 77.9 (6.4, 70/103) |
| Test location –n (%) | |||
| Field station | 4,004 (90.9) | 4,395 (83.6) | 8,399 (86.9) |
| Home | 217 (4.9) | 478 (9.1) | 695 (7.2) |
| Nursing home | 185 (4.2) | 384 (7.3) | 569 (5.9) |
| Education –n (%) | |||
| <10 y | 1,344 (30.5) | 2,693 (51.2) | 4,037 (41.8) |
| 11-12 y | 1,757 (39.9) | 1,529 (29.1) | 3,286 (34.0) |
| >12 y | 1,305 (29.6) | 1,035 (19.7) | 2,340 (24.2) |
| Subjective memory decline | 1,344 (32.1) | 1,572 (32.6) | 2,916 (32.3) |
| (n = 9021) –n (%) | |||
| MoCA* (n = 8,738) - mean (SD) | 22.6 (4.3) | 22.9 (4.8) | 22.8 (4.6) |
*The MoCA was not applied in participants with severe functional impairment that precluded the use of the assessment scale. In participants with severe dementia, the Severe Impairment Battery was applied instead of the MoCA.
Table 3 presents the prevalence of MCI and dementia according to sex and age group. The standardized prevalence of dementia was 14.6% (95% confidence interval CI 13.9–15.4) of people aged≥70. There was a steady increase in dementia prevalence across age groups with nearly a doubling every five years, from 5.6% in the youngest group, 70–74 years, to 48.1% in the oldest group, 90 + years. The prevalence of dementia was 2.9 percentage points higher in women than in men (p < 0.001).
Table 3
Number and prevalence of participants with mild cognitive impairment and dementia
| Number of respondents | Number of dementia cases | Standardized dementia prevalence* | 95% confidence interval | Number of MCI cases | Standardized MCI prevalence* | 95% confidence interval | |
| Total | |||||||
| 70–74 | 4,014 | 234 | 5.6% | (4.9–6.3) | 1,451 | 36.0% | (34.5–37.6) |
| 75–79 | 2,575 | 263 | 9.5% | (8.4–10.7) | 938 | 36.6% | (34.7–38.6) |
| 80–84 | 1,564 | 303 | 17.9% | (16.0–20.0) | 513 | 32.9% | (30.4–35.5) |
| 85–89 | 901 | 333 | 33.0% | (29.7–36.5) | 293 | 33.2% | (29.8–36.8) |
| 90+ | 609 | 337 | 48.1% | (43.0–53.3) | 187 | 35.7% | (30.7–41.1) |
| Overall | 9,663 | 1470 | 14.6% | (13.9–15.4) | 3,382 | 35.3% | (34.3–36.4) |
| Men | |||||||
| 70–74 | 1,955 | 124 | 6.4% | (5.4–7.6) | 710 | 36.5% | (34.4–38.7) |
| 75–79 | 1,203 | 130 | 10.0% | (8.5–11.8) | 517 | 43.4% | (40.6–46.3) |
| 80–84 | 711 | 131 | 17.8% | (15.2–20.8) | 249 | 34.8% | (31.3–38.4) |
| 85–89 | 337 | 114 | 30.4% | (25.9–35.4) | 119 | 36.9% | (31.8–42.3) |
| 90+ | 200 | 99 | 41.5% | (34.6–48.7) | 65 | 36.2% | (29.1–44.0) |
| Overall | 4,406 | 598 | 13.0% | (12.1–14.0) | 1,660 | 38.1% | (36.7–39.6) |
| Women | |||||||
| 70–74 | 2,059 | 110 | 4.8% | (4.0–5.8) | 741 | 35.6% | (33.5–37.8) |
| 75–79 | 1,372 | 133 | 9.0% | (7.5–10.7) | 421 | 30.6% | (28.0–33.3) |
| 80–84 | 853 | 172 | 18.0% | (15.4–21.0) | 264 | 31.5% | (28.0–35.1) |
| 85–89 | 564 | 219 | 34.6% | (30.1–39.3) | 174 | 30.9% | (26.5–35.7) |
| 90+ | 409 | 238 | 50.9% | (44.2–57.6) | 122 | 35.5% | (29.1–42.5) |
| Overall | 5,257 | 872 | 15.9% | (14.8–17.0) | 1,722 | 33.0% | (31.6–34.5) |
*Standardization done in two steps: 1) Weighted (inverse probability weighting) to account for non-response by sex, age, municipality and nursing home. 2) Standardized (calibrated) to correspond to the distribution in Norway according to sex, age and education in 2019.
The standardized prevalence of MCI was 35.3% (95% CI 34.3–36.4). No age trend was identified for the prevalence of MCI. The prevalence of MCI was 5.1 percentage points higher in men (p < 0.001). Of those with MCI, 2,896 had amnestic MCI (30.4%, 95% CI 29.4-31.4), and 486 had non-amnestic MCI (4.9%, 95% CI 4.4–5.3) (see Supplementary Material).
Among those who completed the MoCA, 4,431 (50.7%), 3,437 (39.4%), and 2,641 (30.2%) participants had z-scores≤–1.0,≤–1.5, and≤–2.0, resp-ectively, applying norm values adjusted for age, education, and sex from a recent Swedish study [39].
Table 4 presents the prevalence of subtypes of dementia. AD was diagnosed in 57% of the partici-pants with dementia. The second most common subtype was VaD (10%), followed by mixed dementia (9%), LBD (4%), and FTD (2%). In 17%, the information was insufficient for diagnosing the subtype of dementia, and these individuals were classified as having unspecified dementia. There was a higher prevalence of AD (p = 0.002) in women and a higher prevalence of VaD (p = 0.03) in men.
Table 4
Dementia by subtype, number, and prevalence
| Number of cases | Standardized prevalence* | 95% confidence interval | Sex difference** | Share of all dementias | |
| Total | |||||
| Alzheimer | 840 | 8.4% | (7.8–9.0) | 57% | |
| Vascular dementia | 151 | 1.4% | (1.2–1.7) | 10% | |
| Lewy Body dementias | 53 | 0.6% | (0.4–0.8) | 4% | |
| Frontotemporal dementia | 38 | 0.4% | (0.2–0.5) | 2% | |
| Mixed dementia | 129 | 1.4% | (1.1–1.7) | 9% | |
| Unspecified dementia | 255 | 2.5% | (2.2–2.8) | 17% | |
| Men | |||||
| Alzheimer | 330 | 7.3% | (6.6–8.1) | 56% | |
| Vascular dementia | 78 | 1.7% | (1.4–2.2) | 13% | |
| Lewy Body dementias | 34 | 0.5% | (0.3–0.8) | 4% | |
| Frontotemporal dementia | 12 | 0.2% | (0.1–0.4) | 2% | |
| Mixed dementia | 48 | 1.1% | (0.8–1.4) | 8% | |
| Unspecified dementia | 102 | 2.1% | (1.7–2.5) | 16% | |
| Women | |||||
| Alzheimer | 510 | 9.3% | (8.4–10.2) | P = 0.002 | 58% |
| Vascular dementia | 73 | 1.2% | (0.9–1.5) | P = 0.03 | 7% |
| Lewy Body dementia | 29 | 0.6% | (0.4–0.9) | P = 0.62 | 4% |
| Frontotemporal dementia | 26 | 0.4% | (0.3–0.7) | P = 0.08 | 3% |
| Mixed dementia | 81 | 1.6% | (1.2–2.1) | P = 0.05 | 10% |
| Unspecified dementia | 153 | 2.8% | (2.3–3.4) | P = 0.03 | 18% |
Four men had other specified dementias. (Two had alcoholic dementia, one had progressive supranuclear palsy, one had post-operative sequelae). **Chi-Squared test, design based.
Table 5 presents the prevalence of dementia in participants living at home and participants who were nursing home residents. In nursing home residents, the standardized prevalence of dementia and MCI was 84.3% and 13.5%, respectively. While there was a higher prevalence of dementia in older age groups among those living at home (p < 0.001), there was a lower prevalence of dementia in older age groups among nursing home residents (p = 0.006).
Table 5
Prevalence of dementia and mild cognitive impairment in institutions versus in the community
| Number of respondents | Dementia cases | Standardized dementia prevalence* | 95% confidence interval | MCI cases | Standardized MCI prevalence* | 95% confidence interval | |
| Community | |||||||
| 70–74 | 3,973 | 196 | 4.9% | (4.2–5.6) | 1,448 | 36.3% | (34.7–37.8) |
| 75–79 | 2,512 | 204 | 7.7% | (6.7–8.8) | 934 | 37.2% | (35.3–39.2) |
| 80–84 | 1,466 | 215 | 14.3% | (12.3–16.2) | 504 | 34.1% | (31.5–36.8) |
| 85–89 | 762 | 212 | 25.0% | (21.6–28.4) | 278 | 36.5% | (32.7–40.4) |
| 90+ | 381 | 154 | 36.4% | (30.1–42.7) | 148 | 42.2% | (35.7–49.0) |
| p-trend with age** | p < 0.001 | p = 0.47 | |||||
| Overall | 9,094 | 981 | 10.8% | (10.1–11.5) | 3,312 | 36.5% | (35.4–37.6) |
| Men | 4,221 | 436 | 10.2% | (9.3–11.1) | 1,639 | 39.1% | (37.6–40.6) |
| Women | 4,873 | 545 | 11.3% | (10.2–12.3) | 1,673 | 34.3% | (32.8–35.8) |
| Nursing homes | |||||||
| 70–74 | 41 | 38 | 91.3% | (81.8–100) | 3 | 8.7% | (2.8–24.0) |
| 75–79 | 63 | 59 | 93.4% | (86.9–99.0) | 4 | 6.6% | (2.4–16.9) |
| 80–84 | 98 | 88 | 88.6% | (80.9–96.2) | 9 | 9.0% | (4.3–17.7) |
| 85–89 | 139 | 121 | 85.3% | (78.1–92.4) | 15 | 12.0% | (6.8–20.2) |
| 90+ | 228 | 183 | 77.9% | (70.3–85.5) | 39 | 19.6% | (13.2–28.2) |
| p-trend with age** | p = 0.006 | p = 0.016 | |||||
| Total | 569 | 489 | 84.3% | (80.4–88.3) | 70 | 13.5% | (10.2–17.7) |
| Men | 185 | 162 | 88.6% | (84.0–93.1) | 21 | 10.6% | (6.9–15.9) |
| Women | 384 | 327 | 82.4% | (77.1–87.7) | 49 | 14.9% | (10.5–20.6) |
*Standardization done in two steps: 1) Weighted (inverse probability weighting) to account for non-response by sex, age, municipality, and nursing home. 2) Standardized (calibrated) to correspond to the distribution in Norway according to sex, age, and education in 2019. **Trend estimated in logistic regression.
Table 6 shows projections of the numbers of people with dementia for the years 2020, 2050, and 2100 for the entire range of ages 30 + . The estimated number of persons with dementia in the group 65–69 and < 65 were 2008 (783 men and 1,225 women) and 2,108 (1,057 men and 1,051 women), respectively, based on results from a study of persons < 70 years in the same region. The total number of people with dementia in Norway in 2020 was estimated to be 101,118; by the year 2050, this number is expected to more than double to 236,789; and by 2100, the number is projected to be nearly four times that of 2020 at 380,134. The proportion of women among those who have dementia is predicted to decrease from 59% in 2020 to 55% in 2100.
Table 6
Projections of people with dementia in 2020, 2050, and 2100 in Norway
| Year 2020 | Year 2050 | Year 2100 | Ratio 2050/2020 | Ratio 2100/2020 | |
| Total | |||||
| 30–64 | 2,108 | 2,203 | 2,095 | 1.0 | 1.0 |
| 65–69 | 2,008 | 2,383 | 2,489 | 1.2 | 1.2 |
| 70–74 | 14,493 | 17,153 | 18,277 | 1.2 | 1.3 |
| 75–79 | 16,691 | 29,774 | 29,512 | 1.8 | 1.8 |
| 80–84 | 20,380 | 49,866 | 55,267 | 2.4 | 2.7 |
| 85–89 | 23,675 | 64,498 | 97,093 | 2.7 | 4.1 |
| 90+ | 21,762 | 70,912 | 175,402 | 3.3 | 8.1 |
| Overall | 101,118 | 236,789 | 380,134 | 2.3 | 3.8 |
| Men | |||||
| 30–64 | 1,057 | 1,106 | 1,055 | 1.0 | 1.0 |
| 65–69 | 783 | 936 | 999 | 1.2 | 1.3 |
| 70–74 | 8,140 | 9,748 | 10,568 | 1.2 | 1.3 |
| 75–79 | 8,349 | 15,544 | 15,788 | 1.9 | 1.9 |
| 80–84 | 8,814 | 24,202 | 27,870 | 2.7 | 3.2 |
| 85–89 | 8,370 | 28,290 | 45,520 | 3.4 | 5.4 |
| 90+ | 5,567 | 25,406 | 70,805 | 4.6 | 12.7 |
| Overall | 41,080 | 105,233 | 172,605 | 2.6 | 4.2 |
| Women | |||||
| 30–64 | 1,051 | 1,096 | 1,040 | 1.0 | 1.0 |
| 65–69 | 1,225 | 1,447 | 1,490 | 1.2 | 1.2 |
| 70–74 | 6,353 | 7,405 | 7,708 | 1.2 | 1.2 |
| 75–79 | 8,342 | 14,230 | 13,724 | 1.7 | 1.6 |
| 80–84 | 11,566 | 25,663 | 27,397 | 2.2 | 2.4 |
| 85–89 | 15,306 | 36,208 | 51,573 | 2.4 | 3.4 |
| 90+ | 16,195 | 45,506 | 104,597 | 2.8 | 6.5 |
| Overall | 60,038 | 131,556 | 207,529 | 2.2 | 3.5 |
Projections based on population estimates by gender from Statistics Norway (main alternative).
DISCUSSION
The present study provides national standardized estimates for the prevalence of dementia in Norway. The results are based on a large population-based sample of persons 70 years of age or older (HUNT4 70 + study). In order to present prevalence numbers for the entire population as well, we have included data from another study conducted with persons younger than 70 years of age.
The prevalence of dementia among those 70 + years of age was 14.6%, increasing from 5.6% in the group 70–74 to 48.1% in the group 90 + . The prevalence of MCI among those 70 + years of age was 35.3% and was stable across age groups. Overall, there was a higher prevalence of dementia among women, whereas there was a higher prevalence of MCI among men. Alzheimer’s disease was the most common dementia subtype. More than 80% of nursing home residents had dementia. The number of people with dementia in Norway was estimated to be 101,118 in 2020—a number that is expected to more than double by the year 2050.
Dementia
The prevalence of dementia in our study is higher than that found in a large UK study [9] and, to a lesser extent, the Rotterdam study [45] but similar to the prevalence found in a Finnish study [13]. The only previous Norwegian prevalence study, including 1,029 older adults age 75 years and older, also showed a lower prevalence [46]. This study was conducted in Oslo, the capital of Norway, and half of the study sample comprised nursing home residents. Pooled prevalence rates from meta-analyses and reviews are also lower in all age groups than in our study [6, 8, 47]. Several studies have indicated that the prevalence of dementia in Western countries might be decreasing [11], although another review concluded that there was no clear overall effect including all countries [48]. The higher prevalence estimates of our study might be related to methodological issues, such as choice of diagnostic criteria or the test battery applied but could also be caused by variation in survival and risk and protective factors. Norway is one of the countries with the highest life expectancy and has a public health system that provides services to address care for persons with dementia at all stages of the disease [28].
When applying MoCA norm values from a recent Swedish study [39], we found that 30.2% of those who completed the MoCA had a score two standard deviations or more below the mean, a common threshold for dementia [38]. In the present study, the MoCA was not conducted with individuals suffering from severe dementia. This suggests that we have not overestimated the prevalence of dementia in the present sample. In nursing homes, the prevalence of dementia was very high, varying from 78% in the oldest age group to more than 90% in the youngest age groups. The overall dementia prevalence in nursing homes (84.3%) is almost identical to results in other stud-ies on dementia prevalence in Norwegian nursing ho- mes [49]. Our inclusion of nursing home patients may also have contributed to a higher prevalence as this population has not been included consistently in previous studies [47].
Subtypes of dementia
We found AD to be the most common subtype of dementia, followed by VaD, LBD, and FTD. This distribution is consistent with previous research [50, 51]. For some of these subtypes, the prevalence in our study is lower than in other studies [52], which may be explained by a large group receiving the diagnosis of unspecified dementia. These were cases for which the information was inconsistent or insufficient to identify the subtype of dementia. Some participants with severe dementia did not have a caregiver who could provide information about the person’s symptom profile at an early stage of the disease.
MCI
Our prevalence numbers for MCI are in the upper range of previous results. A recent review found that the prevalence of MCI ranged from 0.5% to 41.8%, and that the pooled prevalence was 17.5% [53]. In the recently updated American Academy of Neurology guidelines, the prevalence in the age groups 70–74, 75–79, and 80–84 was estimated to 8.4%, 10.1%, and 14.8%, respectively [54]. Various diagnostic criteria have in common the definition of MCI as a condition with cognitive complaint, objectively measured cognitive decline, and essentially normal functioning. Our study applied the DSM-5 criteria for minor neurocognitive disorder, which are very similar to other MCI diagnostic criteria [20, 21]. However, cognitive decline sufficient for an MCI diagnosis has been defined by scores of 1.5 SD or 1.0 SD below the mean from normative samples. The DSM-5 suggests using 1.0 SD as a threshold value, thereby producing a higher prevalence of MCI than if 1.5 SD had been chosen. The fact that 51% and 39% had z-scores≤–1.0 and≤–1.5, respectively, according to norms from a recent Swedish study [39], illustrates this and may suggest that we are not overestimating the prevalence of MCI. A higher prevalence of MCI among men than among women confirms results from several previous studies, whereas other studies fail to find a sex difference [54]. The considerably higher prevalence of amnestic MCI than non-amnestic MCI contrasts with previous studies that have shown a similar prevalence between the two subtypes of MCI [24]. This may be because we utilized test instruments with more information about memory than other cognitive domains.
Projections
Future projections show that the number of people with dementia will more than double by 2050 and nearly quadruple by the year 2100, with a ratio of 3.8 compared to 2020. These projections confirm earlier estimates from other countries [2, 55] and highlight the immense challenges associated with dementia care in the future.
Strengths and limitations
The present study conforms to the quality indica-tors of prevalence studies on dementia [6, 7]. The sample is one of the largest included in a dementia prevalence study with clinical assessment of all par-ticipants, and it spans the entire spectrum of cognitive impairment from normal cognition to severe dementia. The target population is well-described. The entire population of a Norwegian county, home-dwelling and institutionalized, was invited to participate. The data collection method was standardized with use of validated criteria. The design was one-phase with a multidomain cognitive test battery, a formal disability assessment, an informant interview, and a clinical interview.
Ideally, the response rate could have been higher, but it is in line with other similar studies condu-cted over the past few years [9]. It is probable that those who did not participate in the study differed from those who participated on variables that are associated with dementia, such as age, sex, and pl-ace of living, including living in a nursing home. Therefore, our analyses were weighted to control for non-response bias according to age, sex, municipality, and nursing home residency, and were further calibrated to represent Norway according to age, sex, and educational distribution. Thus, in regard to these important factors, differences between the study population and those not responding should not affect our results.
Due to the magnitude of the study, a large number of different assessors conducted the data collection, which could threaten the reliability of the data. However, all the assessors were health personnel and received a two-day standardized training on the study performance to ensure a high level of reliability. Although MoCA is a multidomain cognitive test instrument, limited testing of cognitive domains other than memory may make it more difficult to diagnose other dementia subtypes than AD.
Most studies on dementia prevalence have applied either the algorithmic diagnostic method or the clinical consensus method [56]. We chose the clinical consensus method as we wanted the diagnostic process to reflect current diagnostic practice and to en-compass all relevant information in the process. The clinical consensus method may be less reliable than an algorithmic approach. However, the experts met prior to the diagnostic process and communi-cated with the rest of the group throughout the project period in order to avoid different interpretations of the data. The main limitation to setting the diagnosis is the reliance on information collected by other people, not seeing the person, and the lack of biomarker data such as cerebrospinal fluid and ima-ging. These are particularly important when diagnosing subtypes of dementia as the distinctive features of each subtype are often blurred as the dementia progresses. This may also be reflected in the high prevalence of unspecified dementia in the present study. Consequently, the distribution between subtypes of dementia should be interpreted with caution.
The projection method assumes that the incidence and survival of dementia remains the same in the coming years. However, dementia incidence might continue to decrease in the coming years or other health factors such as a higher prevalence of obesity and less physical activity may lead to an increase in the incidence of dementia. Furthermore, any future disease-modifying therapy will probably affect both the incidence and the survival of dementia. The projections should be interpreted with these limitations in mind.
CONCLUSION
By adding information from another recent study, we estimate that the total number of persons with dementia in Norway is 101,118. This is considerably higher than the number (78,000) presented in the Norwegian 2020 dementia plan [28] but close to the estimate (104,500) by the Norwegian Institute of Public Health based on data from the Global Burden of Disease project [57]. Uncertainty about the prevalence of a condition that is so important to healthcare planning is unfortunate. The present study provides valid information about the prevalence of dementia in Norway today. To plan for current and future health and social services, accurate and updated knowledge about dementia prevalence, incidence, and survival is needed. This information is crucial for dealing with the challenges to the healthcare system related to an aging population.
ACKNOWLEDGMENTS
The data collection took place as part of the fourth wave of the Trøndelag Health Study (HUNT). HUNT is a collaboration between HUNT Research Centre (Faculty of Medicine and Health Sciences, Norwegian University of Science and Technology NTNU), Trøndelag County Council, Central Norway Regional Health Authority, and the Norwegian Institute of Public Health.
The study was commissioned by the Norwegian Directorate of Health and also financed by the Norwegian Health Association. There were no restrictions in regard to the research conduct.
Authors’ disclosures available online (https://www.j-alz.com/manuscript-disclosures/20-1275r1).
SUPPLEMENTARY MATERIAL
[1] The supplementary material is available in the electronic version of this article: https://dx.doi.org/10.3233/JAD-201275.
REFERENCES
[1] | World Health Organization, Alzheimer’s Disease International, ((2012) ) Dementia: A public health priority. World Health Organization, Geneva. |
[2] | Prince M , Wimo A , Guerchet M , Ali GC , Wu Y-T , Prina M ((2015) ) World Alzheimer Report. The Global Impact of Dementia An analysis of prevalence, incidence, cost and trends. Alzheimer’s Disease International, London. |
[3] | Prince M , Comas-Herrera A , Knapp M , Guerchet M , Karagiannidou M ((2016) ) World Alzheimer Report 2016 Improving healthcare for people with dementia. Coverage, quality and costs now and in the future. Alzheimer’s Disease International, London. |
[4] | World Health Organization ((2017) ) Global action plan on the public health response to dementia 2017-2025. World Health Organization, Geneva. |
[5] | Lobo A , Launer LJ , Fratiglioni L , Andersen K , Di Carlo A , Breteler MM , Copeland JR , Dartigues JF , Jagger C , Martinez-Lage J , Soininen H , Hofman A ((2000) ) Prevalence of dementia and major subtypes in Europe: A collaborative study of population-based cohorts. Neurologic Diseases in the Elderly Research Group. Neurology 54: , S4–9. |
[6] | Prince M , Bryce R , Albanese E , Wimo A , Ribeiro W , Ferri CP ((2013) ) The global prevalence of dementia: A systematic review and metaanalysis. Alzheimers Dement 9: , 63–75. |
[7] | Fiest KM , Jette N , Roberts JI , Maxwell CJ , Smith EE , Black SE , Blaikie L , Cohen A , Day L , Holroyd-Leduc J , Kirk A , Pearson D , Pringsheim T , Venegas-Torres A , Hogan DB ((2016) ) The prevalence and incidence of dementia: A systematic review and meta-analysis. Can J Neurol Sci 43: (Suppl 1), S3–S50. |
[8] | Alzheimer Europe (2019) Dementia in Europe Yearbook 2019. Estimating the prevalence of dementia in Europe. Alzheimer Europe, Luxembourg. |
[9] | Matthews FE , Arthur A , Barnes LE , Bond J , Jagger C , Robinson L , Brayne C , Medical Research Council Cognitive Function and Ageing Collaboration ((2013) ) A two-decade comparison of prevalence of dementia in individuals aged 65 years and older from three geographical areas of England: Results of the Cognitive Function and Ageing Study I and II. Lancet 382: , 1405–1412. |
[10] | Wolters FJ , Chibnik LB , Waziry R , Anderson R , Berr C , Beiser A , Bis JC , Blacker D , Bos D , Brayne C , Dartigues JF , Darweesh SKL , Davis-Plourde KL , de Wolf F , Debette S , Dufouil C , Fornage M , Goudsmit J , Grasset L , Gudnason V , Hadjichrysanthou C , Helmer C , Ikram MA , Ikram MK , Joas E , Kern S , Kuller LH , Launer L , Lopez OL , Matthews FE , McRae-McKee K , Meirelles O , Mosley TH Jr. , Pase MP , Psaty BM , Satizabal CL , Seshadri S , Skoog I , Stephan BCM , Wetterberg H , Wong MM , Zettergren A , Hofman A ((2020) ) Twenty-seven-year time trends in dementia incidence in Europe and the United States: The Alzheimer Cohorts Consortium. Neurology 95: , e519–e531. |
[11] | Wu YT , Beiser AS , Breteler MMB , Fratiglioni L , Helmer C , Hendrie HC , Honda H , Ikram MA , Langa KM , Lobo A , Matthews FE , Ohara T , Peres K , Qiu C , Seshadri S , Sjolund BM , Skoog I , Brayne C ((2017) ) The changing prevalence and incidence of dementia over time - current evidence. Nat Rev Neurol 13: , 327–339. |
[12] | Langa KM , Larson EB , Crimmins EM , Faul JD , Levine DA , Kabeto MU , Weir DR ((2017) ) A Comparison of the Prevalence of Dementia in the United States in 2000 and 2012. JAMA Intern Med 177: , 51–58. |
[13] | Winblad I , Viramo P , Remes A , Manninen M , Jokelainen J ((2010) ) Prevalence of dementia - a rising challenge among ageing populations. Eur Geriatr Med 1: , 330–333. |
[14] | Mathillas J , Lövheim H , Gustafson Y ((2011) ) Increasing prevalence of dementia among very old people. Age Ageing 40: , 243–249. |
[15] | Misiak B , Cialkowska-Kuzminska M , Frydecka D , Chladzinska-Kiejna S , Kiejna A ((2013) ) European studies on the prevalence of dementia in the elderly: Time for a step towards a methodological consensus. Int J Geriatr Psychiatry 28: , 1211–1221. |
[16] | Bruti G , Cavallucci E , Mancini M , Bitossi A , Baldereschi M , Sorbi S ((2016) ) A systematic review of the quality of studies on dementia prevalence in Italy. BMC Health Serv Res 16: , 615. |
[17] | Prince M ((2003) ) Commentary: Two-phase surveys. A death is announced; no flowers please. Int J Epidemiol 32: , 1078–1080. |
[18] | Brayne C , Davis D ((2012) ) Making Alzheimer’s and dementia research fit for populations. Lancet 380: , 1441–1443. |
[19] | Breeze E , Hart NJ , Aarsland D , Moody C , Brayne C ((2015) ) Harnessing the power of cohort studies for dementia research. J Public Ment Health 14: , 8–17. |
[20] | Winblad B , Palmer K , Kivipelto M , Jelic V , Fratiglioni L , Wahlund LO , Nordberg A , Backman L , Albert M , Almkvist O , Arai H , Basun H , Blennow K , de LM , DeCarli C , Erkinjuntti T , Giacobini E , Graff C , Hardy J , Jack C , Jorm A , Ritchie K , van DC , Visser P , Petersen RC ((2004) ) Mild cognitive impairment–beyond controversies, towards a consensus: Report of the International Working Group on Mild Cognitive Impairment. J Intern Med 256: , 240–246. |
[21] | Petersen RC ((2004) ) Mild cognitive impairment as a diagnostic entity. J Intern Med 256: , 183–194. |
[22] | Ganguli M , Snitz BE , Saxton JA , Chang CC , Lee CW , Vander Bilt J , Hughes TF , Loewenstein DA , Unverzagt FW , Petersen RC ((2011) ) Outcomes of mild cognitive impairment by definition: A population study. Arch Neurol 68: , 761–767. |
[23] | Sachdev PS , Lipnicki DM , Crawford J , Reppermund S , Kochan NA , Trollor JN , Wen W , Draper B , Slavin MJ , Kang K , Lux O , Mather KA , Brodaty H ((2013) ) Factors predicting reversion from mild cognitive impairment to normal cognitive functioning: A population-based study. PLoS One 8: , e59649. |
[24] | Sachdev PS , Lipnicki DM , Kochan NA , Crawford JD , Thalamuthu A , Andrews G , Brayne C , Matthews FE , Stephan BC , Lipton RB , Katz MJ , Ritchie K , Carriere I , Ancelin ML , Lam LC , Wong CH , Fung AW , Guaita A , Vaccaro R , Davin A , Ganguli M , Dodge H , Hughes T , Anstey KJ , Cherbuin N , Butterworth P , Ng TP , Gao Q , Reppermund S , Brodaty H , Schupf N , Manly J , Stern Y , Lobo A , Lopez-Anton R , Santabarbara J , Cohort Studies of Memory in an International Consortium (COSMIC) ((2015) ) The prevalence of mild cognitive impairment in diverse geographical and ethnocultural regions: The COSMIC Collaboration. PLoS One 10: , e0142388. |
[25] | Petersen RC , Caracciolo B , Brayne C , Gauthier S , Jelic V , Fratiglioni L ((2014) ) Mild cognitive impairment: A concept in evolution. J Intern Med 275: , 214–228. |
[26] | Espinosa A , Alegret M , Valero S , Vinyes-Junqué G , Hernández I , Mauleón A , Rosende-Roca M , Ruiz A , López O , Tárraga L , Boada M ((2013) ) A longitudinal follow-up of 550 mild cognitive impairment patients: Evidence for large conversion to dementia rates and detection of major risk factors involved. J Alzheimers Dis 34: , 769–780. |
[27] | Ferman TJ , Smith GE , Kantarci K , Boeve BF , Pankratz VS , Dickson DW , Graff-Radford NR , Wszolek Z , Van Gerpen J , Uitti R , Pedraza O , Murray ME , Aakre J , Parisi J , Knopman DS , Petersen RC ((2013) ) Nonamnestic mild cognitive impairment progresses to dementia with Lewy bodies. Neurology 81: , 2032–2038. |
[28] | Norwegian Ministry of health and Care Services (2015) Dementia Plan 2020, A More Dementia-friendly Society. |
[29] | NTNU - HUNT Research Centre, The HUNT Study - a longitudinal population health study in Norway, NTNU, https://www.ntnu.edu/hunt, Accessed August 17, 2020. |
[30] | Krokstad S , Langhammer A , Hveem K , Holmen TL , Midthjell K , Stene TR , Bratberg G , Heggland J , Holmen J ((2013) ) Cohort profile: The HUNT Study, Norway. Int J Epidemiol 42: , 968–977. |
[31] | Nordog SØr-TrØndelag County County, TrØndelag i tall 2016 – Statistikk og fakta om TrØndelag [TrØndelag in numbers 2016 – Statistics and facts on TrØndelag] https://www.trondelagfylke.no/contentassets/1889712535bd4178b8626f300c04cae7/trondelag-i-tall-2016.pdf, Accessed February 20, 2020. |
[32] | Dietrichson S , Nordmenns helse under lupen [Norwegian people’s health closely investigated], https://sykepleien.no/2016/03/nordmenns-helse-under-lupen, SykepleienDece-mber 16, 2019, Accessed January 17, 2020. |
[33] | Kvello-Alme M , Brathen G , White LR , Sando SB ((2019) ) The prevalence and subtypes of young onset dementia in central Norway: A population-based study. J Alzheimers Dis 69: , 479–487. |
[34] | Nasreddine ZS , Phillips NA , Bedirian V , Charbonneau S , Whitehead V , Collin I , Cummings JL , Chertkow H ((2005) ) The Montreal Cognitive Assessment, MoCA: A brief screening tool for mild cognitive impairment. J Am Geriatr Soc 53: , 695–699. |
[35] | Morris JC , Heyman A , Mohs RC , Hughes JP , van Belle G , Fillenbaum G , Mellits ED , Clark C ((1989) ) The Consortium to Establish a Registry for Alzheimer’s Disease (CERAD). Part I. Clinical and neuropsychological assessment of Alzheimer’s disease. Neurology 39: , 1159–1165. |
[36] | Schmitt FA , Saxton J , Ferris SH , Mackell J , Sun Y ((2013) ) Evaluation of an 8-item Severe Impairment Battery (SIB-8) vs. the full SIB in moderate to severe Alzheimer’s disease patients participating in a donepezil study. Int J Clin Pract 67: , 1050–1056. |
[37] | Saxton J , Gonigle-Gibson K , Swihart A , Miller V , Boller F ((1990) ) Assessment of the severely impaired patient: Description and validation of a new neuropsychological test battery. Psychol Assess 2: , 298–303. |
[38] | American Psychiatric Association ((2013) ) Diagnostic and statistic manual of mental disorders: DSM-5, American Psychiatric Association, Washington DC. |
[39] | Borland E , Nagga K , Nilsson PM , Minthon L , Nilsson ED , Palmqvist S ((2017) ) The Montreal Cognitive Assessment: Normative data from a large Swedish population-based cohort. J Alzheimers Dis 59: , 893–901. |
[40] | Kenny RA , Coen RF , Frewen J , Donoghue OA , Cronin H , Savva GM ((2013) ) Normative values of cognitive and physical function in older adults: Findings from the Irish Longitudinal Study on Ageing. J Am Geriatr Soc 61: (Suppl 2), S279–290. |
[41] | Luck T , Pabst A , Rodriguez FS , Schroeter ML , Witte V , Hinz A , Mehnert A , Engel C , Loeffler M , Thiery J , Villringer A , Riedel-Heller SG ((2018) ) Age-, sex-, and education-specific norms for an extended CERAD Neuropsychological Assessment Battery-Results from the population-based LIFE-Adult-Study. Neuropsychology 32: , 461–475. |
[42] | Luck T , Riedel-Heller SG , Wiese B , Stein J , Weyerer S , Werle J , Kaduszkiewicz H , Wagner M , Mösch E , Zimmermann T , Maier W , Bickel H , van den Bussche H , Jessen F , Fuchs A , Pentzek M ((2009) ) CERAD-NP-Testbatterie: Alters-, geschlechts- und bildungs-spezifische Normen ausgewählter Subtests. Ergebnisse der German Study on Ageing, Cognition and Dementia in Primary Care Patients (AgeCoDe). [CERAD-NP battery: Age-, gender- and education-specific reference values for selected subtests. Results of the German Study on Ageing, Cognition and Dementia in Primary Care Patients (AgeCoDe).]. Z Gerontol Geriatr 42: , 372–384. |
[43] | Valliant R , Dever JA ((2018) ) Survey weights: A Step-by-step Guide to Calculation, Stata Press. |
[44] | Statistics Norway (2020) National Population Projections. 12881: Population projections 1 January, by sex, age, immigration category and country background, in 15 alternatives 2020 - 2100. Available from: https://www.ssb.no/en/statbank/table/12881/. Accessed August 20, 2020 |
[45] | Ott A , Breteler MM , van Harskamp F , Claus JJ , van der Cammen TJ , Grobbee DE , Hofman A ((1995) ) Prevalence of Alzheimer’s disease and vascular dementia: Association with education. The Rotterdam study. BMJ 310: , 970–973. |
[46] | Engedal K , Haugen PK ((1993) ) The prevalence of dementia in a sample of elderly Norwegians. Int J Geriatr Psychiatry 8: , 565–570. |
[47] | Cao Q , Tan CC , Xu W , Hu H , Cao XP , Dong Q , Tan L , Yu JT ((2020) ) The prevalence of dementia: A systematic review and meta-analysis. J Alzheimers Dis 73: , 1157–1166. |
[48] | Prince M , Ali GC , Guerchet M , Prina AM , Albanese E , Wu YT ((2016) ) Recent global trends in the prevalence and incidence of dementia, and survival with dementia. Alzheimers Res Ther 8: , 23. |
[49] | Helvik AS , Engedal K , Benth JS , Selbaek G ((2015) ) Prevalence and severity of dementia in nursing home residents. Dement Geriatr Cogn Disord 40: , 166–177. |
[50] | de Pedro-Cuesta J , Virues-Ortega J , Vega S , Seijo-Martinez M , Saz P , Rodriguez F , Rodriguez-Laso A , Rene R , de las Heras SP , Mateos R , Martinez-Martin P , Manubens JM , Mahillo-Fernandez I , Lopez-Pousa S , Lobo A , Regla JL , Gascon J , Garcia FJ , Fernandez-Martinez M , Boix R , Bermejo-Pareja F , Bergareche A , Benito-Leon J , de Arce A , del Barrio JL ((2009) ) Prevalence of dementia and major dementia subtypes in Spanish populations: A reanalysis of dementia prevalence surveys, 1990-2008. BMC Neurol 9: , 55. |
[51] | Goodman RA , Lochner KA , Thambisetty M , Wingo TS , Posner SF , Ling SM ((2017) ) Prevalence of dementia subtypes in United States Medicare fee-for-service beneficiaries, 2011-2013. Alzheimers Dement 13: , 28–37. |
[52] | Hogan DB , Fiest KM , Roberts JI , Maxwell CJ , Dykeman J , Pringsheim T , Steeves T , Smith EE , Pearson D , Jetté N ((2016) ) The prevalence and incidence of dementia with Lewy bodies: A systematic review. Can J Neurol Sci 43: (Suppl 1), S83–95. |
[53] | Pessoa RMP , Bomfim AJL , Ferreira BLC , Chagas MHN ((2019) ) Diagnostic criteria and prevalence of mild cognitive impairment in older adults living in the community: A systematic review and meta-analysis. Arch Clin Psychiatry (S&o Paulo) 46: , 72–79. |
[54] | Petersen RC , Lopez O , Armstrong MJ , Getchius TSD , Ganguli M , Gloss D , Gronseth GS , Marson DC , Pringsheim T , Day GS , Sager M , Stevens J , Rae-Grant A ((2018) ) Practice guideline update summary: Mild cognitive impairment. Report of the Guideline Development, Dissemination, and Implementation Subcommittee of the American Academy of Neurology. Neurology 90: , 126–135. |
[55] | Wittenberg R , Hu B , Jagger C , Kingston A , Knapp M , Comas-Herrera A , King D , Rehill A , Banerjee S ((2020) ) Projections of care for older people with dementia in England: 2015 to 2040. Age Ageing 49: , 264–269. |
[56] | Brayne C , Stephan BC , Matthews FE ((2011) ) A European perspective on population studies of dementia. Alzheimers Dement 7: , 3–9. |
[57] | Norwegian Institute of Public Health (2016) Folkehelseinstituttet, Oslo. |
[58] | Lawton MP , Brody EM ((1969) ) Assessment of older people: Self-maintaining and instrumental activities of daily living. Gerontologist 9: , 179–186. |
[59] | Kaufer DI , Cummings JL , Ketchel P , Smith V , MacMillan A , Shelley T , Lopez OL , DeKosky ST ((2000) ) Validation of the NPI-Q, a brief clinical form of the Neuropsychiatric Inventory. J Neuropsychiatry Clin Neurosci 12: , 233–239. |
[60] | Hughes CP , Berg L , Danziger WL , Coben LA , Martin RL ((1982) ) A new clinical scale for the staging of dementia. Br J Psychiatry 140: , 566–572. |
[61] | Zigmond AS , Snaith RP ((1983) ) The hospital anxiety and depression scale. Acta Psychiatr Scand 67: , 361–370. |


