
Synaptic Molecular and Neurophysiological Markers Are Independent Predictors of Progression in Alzheimer’s Disease
Abstract
Background:
Cerebrospinal fluid (CSF) neurogranin and quantitative electroencephalography (qEEG) are potential molecular and functional markers of synaptic pathology in Alzheimer’s disease (AD). Synaptic markers have emerged as candidate prognostic indicators of AD since synaptic degeneration was shown to be an early event and the best correlate of cognitive deficits in patients along the disease continuum.
Objective:
The present study investigated the association between CSF neurogranin and qEEG measures as well as their potential to predict clinical deterioration in mild cognitive impairment (MCI) patients.
Methods:
Patients diagnosed with MCI (n = 99) underwent CSF conventional AD biomarkers and neurogranin analysis and resting-state EEG recordings. The study population was further stratified into stable (n = 41) and progressive MCI (n = 31), based on the progression to AD dementia during two years follow-up. qEEG analysis included computation of global field power and global field synchronization in four conventional frequency bands.
Results:
CSF neurogranin levels were associated with theta power and synchronization in the progressive MCI group. CSF neurogranin and qEEG measures were significant predictors of progression to AD dementia, independent of baseline amyloid status in MCI patients. A combination of CSF neurogranin with global EEG power in theta and global EEG synchronization in beta band exhibited the highest classification accuracy as compared to either of these markers alone.
Conclusion:
qEEG and CSF neurogranin are independent predictors of progression to AD dementia in MCI patients. Molecular and neurophysiological synaptic markers may have additive value in a multimodal diagnostic and prognostic approach to dementia.
INTRODUCTION
Alzheimer’s disease (AD) is the most common form of dementia and a growing global public health concern [1]. To date, clinical symptoms such as impairment in memory and other cognitive domains remain fundamental for the clinical diagnosis of this insidious disease. In light of improving early and accurate diagnosis, essential for timely therapeutic intervention and prediction of disease progression, there is an urgent need for novel high performance AD biomarkers.
The clinical spectrum of AD includes the transition from mild cognitive impairment (MCI), an intermediate stage of cognitive decline, to the dementia onset. The prevalence of MCI in subjects over 60 years old is estimated between 15–20%and has been long recognized as an at-risk state for future progression to dementia with an annual conversion rate of 8–15%[2]. The core clinical criteria for MCI include an objectively detected decline in memory or other cognitive domains over time, not severe enough to meet the criteria for dementia, since the patients have preserved activities of daily living [3, 4]. The clinical criteria are used in broad settings, do not require specialized diagnostic tests and can be therefore applied at different levels of health care. However, without the further stratification into specific clinical and/or biomarker subtypes, the MCI entity represents a highly heterogeneous group of patients with underlying pathophysiological mechanisms that possibly differ from AD. The research criteria for ‘MCI due to AD’ therefore encompasses both clinical evidence of mild cognitive impairment and biomarkers of AD pathology, including evidence of amyloid-β deposition and neuronal injury [2, 4].
Predicting the rate at which an individual will transition from a pre-dementia stage to dementia itself remains of the utmost importance for the patients and their physicians. This task is often challenging since subjects with evidence of amyloid and tau pathology may remain cognitively stable over prolonged periods of time [5–7]. Recently, markers of synaptic pathology have emerged as candidate prognostic indicators of AD since synaptic pathology and dysfunction have been shown to occur early during the disease course and correlate well with cognitive deficits in affected subjects [8–10]. Moreover, markers of synaptic degeneration may serve as molecular substrates of cognitive reserve, which may account for different likelihoods of disease progression rates among individuals with similar levels of AD-related neuropathology [11].
Growing evidence supports neurogranin, a neuron-specific postsynaptic protein, as a CSF marker of synaptic dysfunction due to AD [12–14]. Neurogranin is highly expressed in excitatory neurons of cortex and hippocampus [15, 16], where it plays a key role in synaptic plasticity and long-term potentiation [17]. Several studies have shown that neurogranin is specifically increased in the cerebrospinal fluid (CSF) of MCI due to AD and AD patients compared to healthy elderly and patients with other neurodegenerative disorders [12, 14, 18]. Moreover, they provided evidence that CSF neurogranin correlates with CSF Aβ42, p-tau, and t-tau levels [19, 20] and improves diagnostic and prognostic accuracy of the current biomarker panel of AD [13, 20]. Even though recent neuropathological investigations revealed reduced full-length neurogranin levels in the cortex of AD patients [21], the extent of the functional impairment these changes cause at the synaptic level remains to be fully elucidated.
Electroencephalography (EEG) is a functional method that measures summated postsynaptic potentials generated by cortical pyramidal neurons. Resting-state EEG recordings therefore reflect cortical synaptic activity during task-absent resting state. Generalized slowing of resting-state EEG [22, 23], decreased EEG measures of global field synchronization [24, 25] and their correlation with the measures of cognitive impairment [26, 27] as well as core CSF biomarkers of AD [28, 29] have been repeatedly reported in MCI and AD patients. In addition, several longitudinal EEG studies have shown that EEG measures are predictive of future cognitive decline, including decreased EEG alpha and increased theta power that with high accuracy differentiated between stable MCI and patients that progressed to AD [30, 31]. Another study reported that increased global theta power was the strongest predictor of clinical progression over time in amyloid-β positive subjects with subjective cognitive decline (SCD) [32]. However, EEG is a functional method that captures global large-scale synaptic activity and is known to show relatively high inter-individual variability due to its sensitivity to individual characteristics, different pathological changes, medication, cognitive reserve, and other factors [33]. Previous studies have shown that in-parallel use of EEG with conventional CSF, structural and functional modalities such as MRI and SPECT increase the diagnostic accuracy of dementia [34–36]. The combination of EEG measures with molecular markers of synaptic degeneration might therefore improve diagnostic and prognostic accuracy of either of these single modalities in the context of AD diagnosis.
The first aim of the present study was to investigate the association between CSF neurogranin and qEEG measures of global power and synchronization as molecular and functional synaptic markers, respectively, in a clinical cohort of MCI patients that have been followed-up over time. The second aim was to assess whether CSF neurogranin and qEEG measures have independent and additive value in predicting clinical progression to AD dementia in MCI patients.
METHODS
Study population
The study population consisted of 99 patients, clinically diagnosed with MCI according to the Winblad et al. criteria [3], and recruited at Karolinska University Hospital-Huddinge, Stockholm, Sweden. All patients underwent comprehensive clinical evaluation, CSF sampling and biomarker analysis, and resting-state EEG recordings at the baseline.
Seventy-two patients had available clinical follow-up information for at least two years and were based on the follow-up stratified as stable (remained clinically stable during two years, MCI diagnosis according to the Winblad et al. criteria [3]; n = 41) and progressive MCI (clinical progression to Alzheimer’s dementia within two years follow-up according to the ICD-10 criteria [37]; n = 31). Twelve out of 41 and 19 out of 31 patients were CSF Aβ42-positive in stable and progressive MCI groups, respectively, according to the clinical cut-off < 550 ng/L.
Demographics, Mini-Mental State Examination (MMSE) scores, and clinical data in the whole, stable, and progressive MCI patient groups are presented in Table 1. Patients that were less than 50 years old, those that progressed to any other dementia diagnosis, had any significant psychiatric or neurological comorbidity, psychotropic medication, alcohol abuse, and a time gap between baseline lumbar puncture and EEG recordings longer than six months were excluded. The study was approved by the local ethical committee of the Karolinska Hospital and Regional Ethical Review Board in Stockholm (Dnr: 2011/1978-31/4, 2020-00678). All patients gave their informed written consent to store and analyze the data for research purposes in accordance with the Declaration of Helsinki.
Table 1
Baseline demographic and clinical characteristics in whole, stable, and progressive MCI groups based on the two years follow-up
| Whole MCI group | Stable MCI | Progressive MCI | p | |
| N | 99 | 41 | 31 | |
| Age (y) | 64 (52 –83) | 65 (56 –83) | 63 (52 –83) | 0.425 |
| Sex ratio (M/F) | 45/54 | 24/17 | 10/21 | 0.027 |
| Education (y) | 12 (3 –24) | 10 (3 –24) | 12 (7 –19) | 0.091 |
| MMSE | 28 (22 –30)a | 28 (23 –30)b | 27 (23–30) | 0.737 |
| CSF Aβ42 (ng/L) | 638 (270 –1350) | 600 (270 –1334) | 532 (272 –914) | 0.013 |
| CSF Aβ42 (neg/posc) | 65/34 | 29/12 | 12/19 | 0.007 |
| CSF t-tau (ng/L) | 337 (75 –1140) | 314 (75 –930) | 492 (169 –1140) | <0.001 |
| CSF p-tau (ng/L) | 65 (16 –150) | 66 (16 –140) | 75 (26 –150) | 0.023 |
| CSF Ng (ng/L) | 196 (39 –445) | 192.5 (39 –392) | 254 (77 –445) | 0.006 |
Data presented as median and minimum-maximum range. Mann Whitney U test and chi-square test as appropriate. an = 98; bn = 40; ccut-off for CSF Aβ42 positivity < 550 ng/L. CSF, cerebrospinal fluid; MCI, mild cognitive impairment; MMSE, Mini-Mental State Examination; Ng, neurogranin.
CSF analysis
CSF samples were collected from all patients at the baseline following a standard procedure for lumbar puncture. CSF was subsequently analyzed for Aβ42, p-tau, and t-tau using xMAP technology and the INNO-BIA AlzBio3 kit (Innogenetics) [38]. The cut-off for CSF Aβ42 positivity was < 550 ng/L. CSF neurogranin concentration was measured using an in-house-developed ELISA protocol, as described previously [21]. The internal quality control (iQC) samples of high and low concentrations of neurogranin had a coefficient of variance that was below 12%and 8%for the intra- and inter-assay variability, respectively. The lowest limit of quantification (LLoQ) for the assay was 19 pg/mL.
EEG recordings and analysis
All patients underwent baseline eyes closed resting-state EEG recordings at the Department of Clinical Neurophysiology at Karolinska University Hospital-Huddinge. EEG was recorded on the Nervus System (NicoletOne EEG Reader v5.93.0.424, Natus NicoletOne, Pleasanton, CA) using 19 electrodes placed according to the standard 10/20 system. A technician monitored patients’ vigilant states during the entire EEG recording. The standard recording setup was described previously in detail in Smailovic et al., 2018 [28].
All EEG recordings were preprocessed using visual inspection and manual artifact rejection. Ocular artifacts were additionally eliminated using a semi-automated independent component algorithm (ICA). Preprocessing and quantitative EEG analysis was performed in Brain Vision analyzer, version 2.0 software (Gilching, Germany).
Two qEEG measures of global field power (GFP) and global field synchronization (GFS) were computed in four conventional frequency bands: delta (1–3.5 Hz), theta (4–7.5 Hz), alpha (8–11.5 Hz), and beta (12–19.5 Hz). GFP is defined as the root mean, across channels, of all squared potentials [39], so for our frequency domain data, we computed GFP as the root mean across channels of the spectral amplitudes. GFP measure has already been utilized in several EEG studies involving cognitively impaired patients [28, 31]. On the other hand, GFS is an EEG measure of global brain functional synchronization whose computation has been introduced in Koenig et al., 2001 [40]. It takes into account multichannel recordings and provides a percentage of the total EEG activity that oscillates with a common phase (value range 0–1) within a certain frequency band. Both GFP and GFS were averaged across 2-s FFT-transformed epochs and four conventional frequency bands.
Statistical analysis
All statistical analyses were performed in SPSS (version 26, IBM, NY, USA). Demographics, MMSE, and clinical data were compared between stable and progressive MCI groups using Mann Whitney U and chi-square tests. Correlations between CSF biomarkers in the whole, stable, progressive, CSF amyloid-negative and -positive MCI groups were investigated using Spearman’s rank correlation tests due to the non-normal distribution of the data. Differences in baseline qEEG measures between stable and progressive MCI groups were assessed by independent-samples t-test.
Multiple linear regression analysis was used to investigate an association between CSF neurogranin and qEEG measures in the whole MCI group. GFP and GFS in four conventional frequency bands served as dependent and CSF neurogranin as independent continuous variables while controlling for age and sex (Model I) and age, sex, and CSF t-tau/Aβ42 ratio (Model II). Model II excludes the confounding effect of CSF t-tau and Aβ42 levels, which are known to be associated with both CSF neurogranin and qEEG measures. Subsequent linear regression analyses were performed separately in stable and progressive groups (Model I and II) and amyloid-positive and -negative MCI groups (Model I only since the group was stratified according to the amyloid status). GFP measures and CSF t-tau/Aβ42 ratio were transformed with a natural log (ln) transformation to obtain normal distribution for the statistical analyses.
A logistic regression model was applied to assess baseline CSF neurogranin and qEEG measures that can best predict progression to AD dementia during two years follow-up (progressive versus stable MCI), adjusting for baseline age, sex, and MMSE. All qEEG measures were tested for their predictive significance, while measures below p < 0.1 were kept in the model. Classification accuracy, using a threshold of 50%for predicted probabilities, was used to quantify correctly categorized progressive versus stable MCI. Additionally, significant predictors were tested for their interactions with baseline CSF Aβ42 amyloid status (negative/positive according to the cut-off 550 ng/L) in order to study whether CSF neurogranin and/or qEEG measures predict progression to AD dementia in MCI patients depending on the patient’s amyloid status. CSF neurogranin and qEEG variables have been centered around mean in the interaction model that was adjusted for age, sex, and MMSE.
RESULTS
Demographics
Baseline demographic data, MMSE, and CSF biomarker values of the whole MCI group as well as stable and progressive MCI groups are shown in Table 1. There was no statistical difference in baseline age, education or MMSE. Conventional CSF biomarker values (Aβ42, t-tau, p-tau) were statistically different between stable and progressive MCI patients.
Baseline CSF neurogranin and qEEG in stable and progressive MCI patients
One CSF neurogranin and four GFP alpha outlying data points were detected and excluded from the subsequent statistical analyses (one stable MCI patient with CSF neurogranin > 650 ng/L; two progressive MCI and two MCI patients without sufficiently long follow-up with baseline GFP alpha > 1μV).
Baseline CSF neurogranin levels were statistically higher in MCI patients who progressed to AD dementia compared to MCI patients that remained clinically stable (p = 0.006, Table 1).
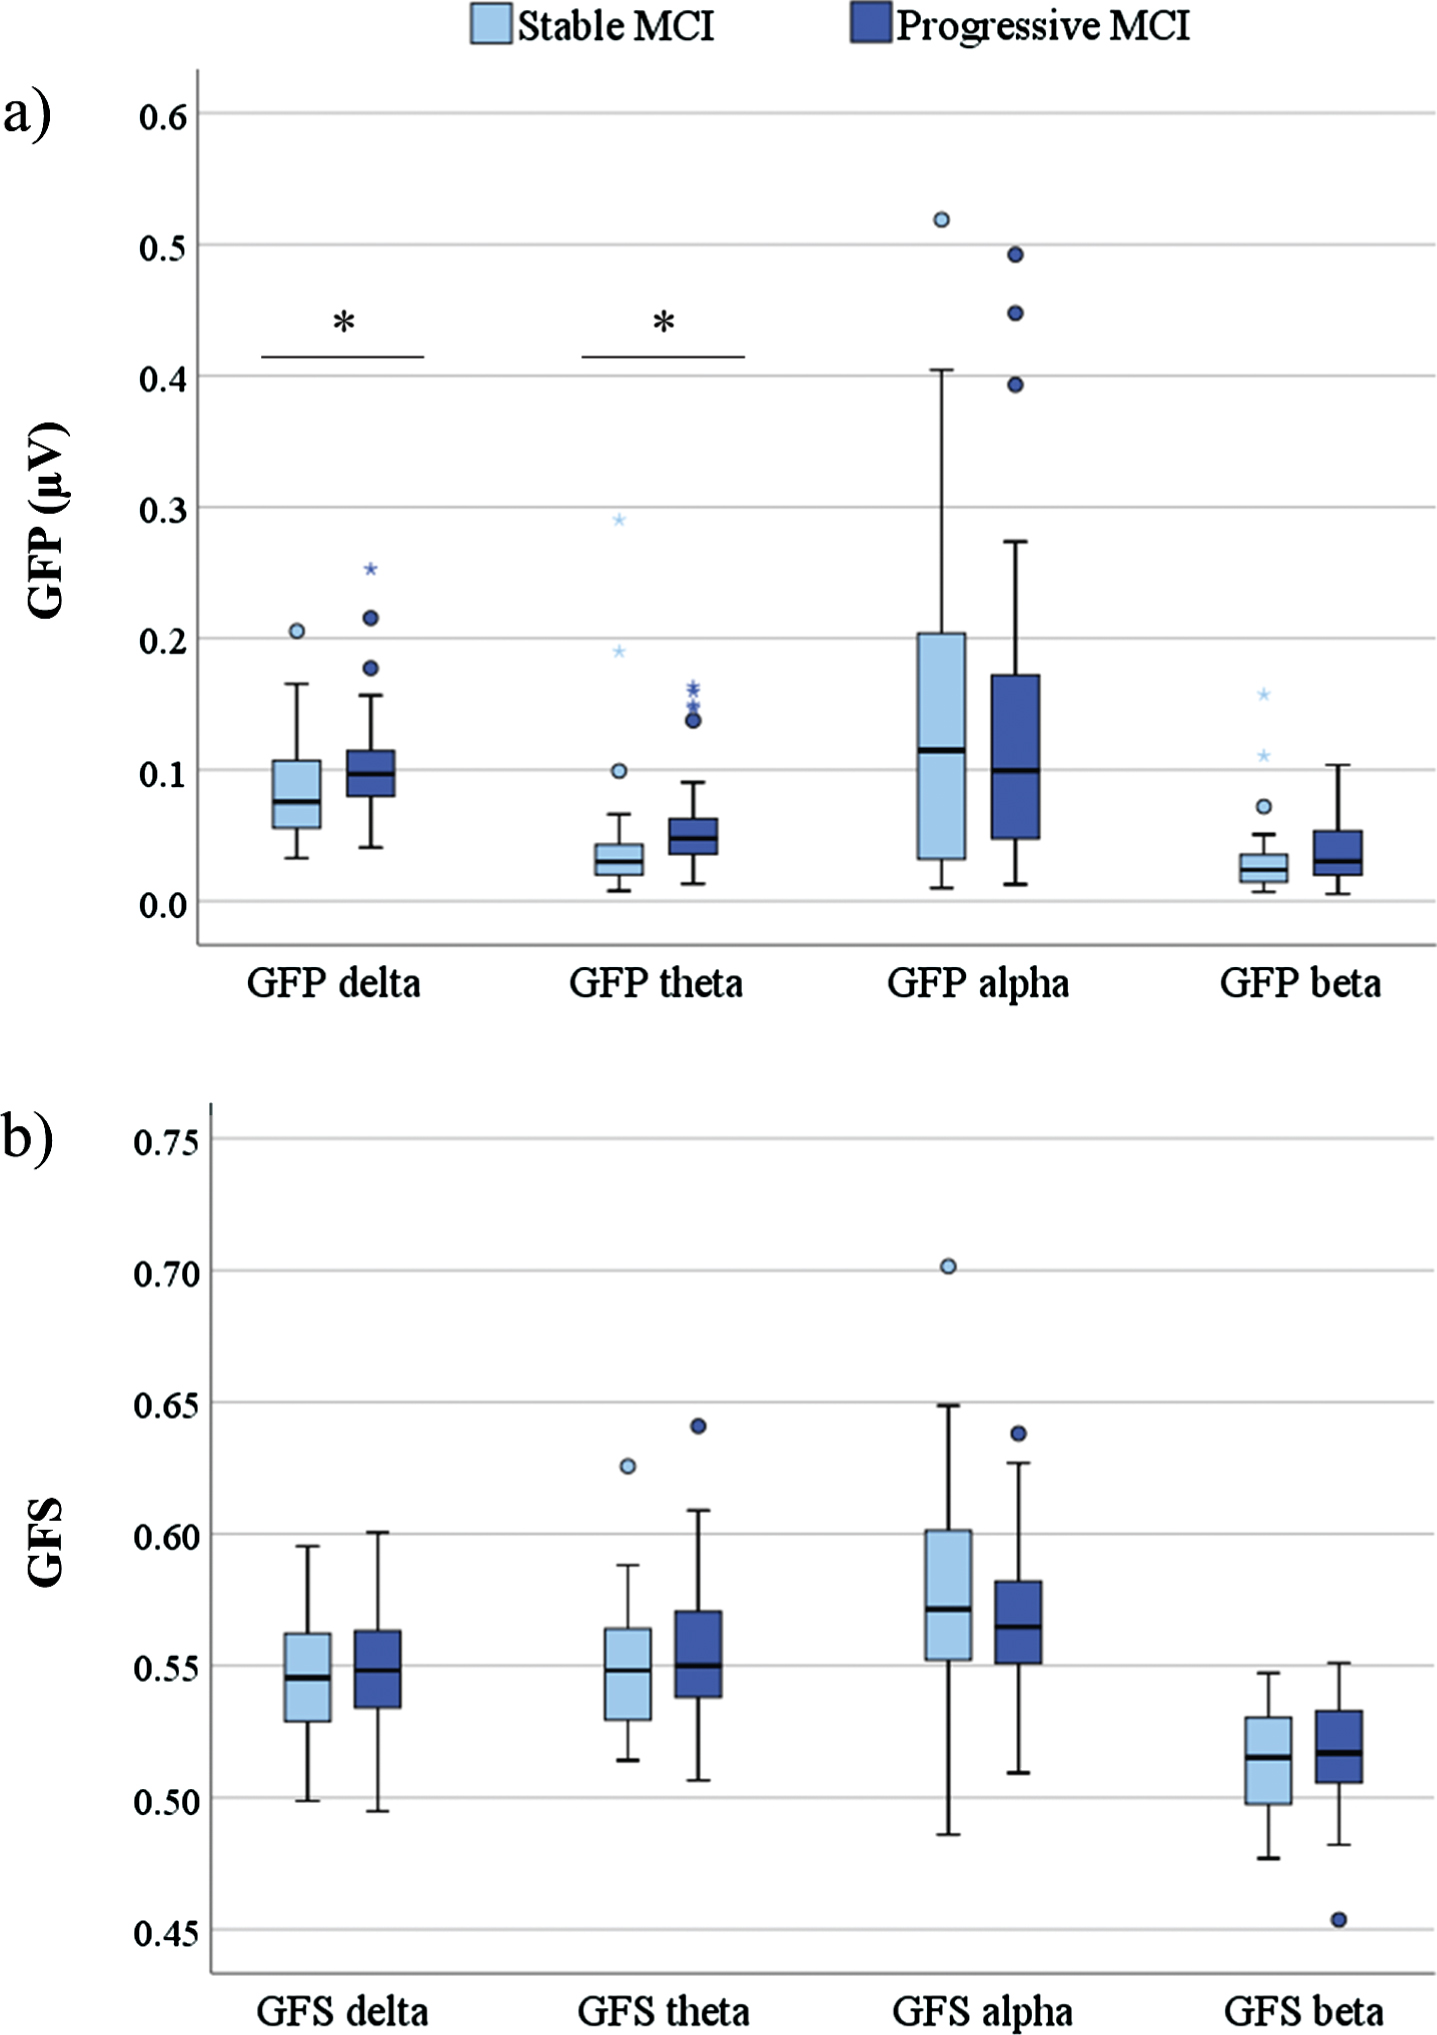
The differences in baseline qEEG power measures included significantly higher GFP in delta (p = 0.032) and theta frequency band (p = 0.003) in progressive compared to stable MCI patients (Fig. 1). There were no statistically significant differences in GFS measures between stable and progressive MCI groups.
Fig. 1
Box plot of baseline qEEG measures GFP (a) and GFS (b) (y-axis) across different frequency bands (x-axis) in stable and progressive MCI patients. Statistics were calculated using Independent sample t-test; *p < 0.05. GFP, global field power; GFS, global field synchronization; MCI, mild cognitive impairment.
Association between CSF biomarkers
CSF neurogranin levels significantly positively correlated with both t-tau and p-tau levels (all p < 0.001) in the whole MCI group (rs = 0.822 for t-tau, rs = 0.820 for p-tau), amyloid negative (rs = 0.800 for t-tau, rs = 0.792 for p-tau), amyloid positive (rs = 0.858 for t-tau, rs = 0.853 for p-tau), stable (rs = 0.760 for t-tau, rs = 0.836 for p-tau), and progressive MCI groups (rs = 0.834 for t-tau, rs = 0.780 for p-tau) (Table 2).
Table 2
Correlation between CSF neurogranin and CSF Aβ42, t-tau, and p-tau in the whole MCI, amyloid negative, and positive and stable and progressive MCI groups
| CSF Aβ42 | CSF t-tau | CSF p-tau | ||
| CSF Ng | Whole MCI group | –0.136 | 0.822*** | 0.820*** |
| MCI Aβ- | –0.107 | 0.800*** | 0.792*** | |
| MCI Ab+ | 0.256 | 0.858*** | 0.853*** | |
| Stable MCI | –0.028 | 0.760*** | 0.836*** | |
| Progressive MCI | 0.341 | 0.834*** | 0.780*** |
Data presented as Spearman’s rank correlation coefficients. ***p < 0.001. Cut-off for CSF Aβ42 positivity < 550 ng/L. CSF, cerebrospinal fluid; MCI, mild cognitive impairment; Ng, neurogranin.
Association between CSF neurogranin and qEEG measures in MCI patients
A multiple linear regression model, controlling for age, sex (Model I), and additionally CSF t-tau/Aβ42 ratio (Model II), did not reveal significant associations between CSF neurogranin and GFP measures in the whole, amyloid negative, positive or stable MCI groups. However, baseline CSF neurogranin levels were significantly negatively associated with GFP theta in progressive MCI group when controlling for age, sex and CSF t-tau/Aβ42 ratio (Model II, p = 0.044) (Table 3).
Table 3
Relationship between CSF neurogranin and GFP in four conventional frequency bands in different MCI groups
| GFP delta | GFP theta | GFP alpha | GFP beta | ||||||
| Model I | Model II | Model I | Model II | Model I | Model II | Model I | Model II | ||
| CSF Ng | Whole MCI group | –0.091 | –0.211 | –0.080 | –0.239 | –0.060 | 0.021 | –0.020 | –0.034 |
| MCI Aβ– | –0.144 | – | –0.065 | – | –0.108 | – | –0.038 | – | |
| MCI Aβ+ | –0.082 | – | –0.194 | – | 0.094 | – | –0.010 | – | |
| Stable MCI | –0.112 | –0.103 | –0.022 | 0.037 | –0.001 | 0.076 | –0.045 | 0.097 | |
| Progressive MCI | –0.131 | –0.335 | –0.170 | –0.511* | –0.222 | –0.153 | 0.004 | –0.213 | |
Multiple linear regression analyses controlled for age, sex (Model I) and additionally CSF t-tau/Aβ42 ratio (Model II). Data presented as standardized β coefficients. Dependent variables were ln transformed GFP values in different frequency bands, while the independent variable was CSF neurogranin. *p < 0.05. CSF, cerebrospinal fluid; GFP, global field power; MCI, mild cognitive impairment; Ng, neurogranin.
Furthermore, significant negative associations between baseline CSF neurogranin levels and GFS theta were observed in the whole MCI (p = 0.019) and progressive MCI groups (p = 0.024) when controlling for age, sex and CSF t-tau/Aβ42 levels (Model II, Table 4). In other words, higher CSF neurogranin levels were associated with decreased global EEG synchronization in the theta band when the effect of CSF t-tau and Aβ42 levels was excluded.
Table 4
Relationship between CSF neurogranin and GFS in four conventional frequency bands in different MCI groups
| GFS delta | GFS theta | GFS alpha | GFS beta | ||||||
| Model I | Model II | Model I | Model II | Model I | Model II | Model I | Model II | ||
| CSF Ng | Whole MCI group | 0.006 | –0.085 | –0.112 | –0.305* | –0.033 | 0.073 | 0.092 | 0.111 |
| MCI Aβ– | –0.078 | – | –0.136 | – | –0.035 | – | 0.061 | – | |
| MCI Aβ+ | 0.216 | – | –0.066 | – | 0.016 | – | 0.153 | – | |
| Stable MCI | 0.156 | –0.101 | –0.011 | –0.183 | –0.029 | –0.056 | 0.100 | 0.071 | |
| Progressive MCI | 0.057 | –0.072 | –0.196 | –0.502* | –0.011 | 0.169 | 0.073 | 0.165 | |
Multiple linear regression analyses controlled for age, sex (Model I) and additionally CSF t-tau/Aβ42 ratio (Model II). Data presented as standardized β coefficients. Dependent variables were GFS values in different frequency bands, while the independent variable was CSF neurogranin. *p < 0.05. CSF, cerebrospinal fluid; GFS, global field synchronization; MCI, mild cognitive impairment; Ng, neurogranin.
CSF neurogranin and qEEG as predictors of disease progression
Logistic regression model applied on baseline CSF neurogranin and qEEG measures and controlled for age, sex and MMSE, revealed that CSF neurogranin (p = 0.023), GFP theta (p = 0.026), and GFS beta (p = 0.043) were all significant predictors of progression to AD dementia in MCI patients during two years follow-up. GFP theta as a single predictor demonstrated the highest classification accuracy (74.6%) compared to CSF neurogranin (70.0%) and GFS beta alone (67.6%) (Table 5). GFP delta was close to reaching statistical significance (p = 0.059) and was therefore included in subsequent models that combined several predictors.
Table 5
Prognostic accuracy of CSF neurogranin and qEEG measures in differentiating stable from progressive MCI during two years of follow-up
| Variable | CSF Ng | GFP delta | GFP theta | GFS beta | Classification accuracy |
| CSF Ng | 1.009 (1.001–1.017)* | 70.0% | |||
| GFP delta | 3.370 (0.954–11.900) | 69.0% | |||
| GFP theta | 2.357 (1.108–5.014)* | 74.6% | |||
| GFS beta | 1.383 (1.010–1.893)* | 67.6% | |||
| CSF Ng & GFP delta | 1.010 (1.002–1.018)* | 3.719 (0.975–14.180) | 74.3% | ||
| CSF Ng & GFP theta | 1.010 (1.001–1.018)* | 2.424 (1.095–5.366)* | 74.3% | ||
| CSF Ng & GFS beta | 1.009 (1.001–1.017)* | 1.357 (0.978–1.884) | 74.3% | ||
| CSF Ng & GFP delta & GFS beta | 1.009 (1.001–1.017)* | 4.499 (1.049–19.300)* | 1.405 (1.000–1.974)* | 78.6% | |
| CSF Ng & GFP theta & GFS beta | 1.009 (1.000–1.017)* | 2.841 (1.184–6.819)* | 1.446 (1.019–2.051)* | 81.4% |
Logistic regression with CSF neurogranin and qEEG measures GFP and GFS as predictors and progression to AD dementia in MCI patients during two years follow-up as an outcome (stable versus progressive MCI). Data presented as odds ratio with 95%confidence intervals in brackets. All models controlled for age, sex, and MMSE. *p < 0.05. CSF, cerebrospinal fluid; GFP, global field power; GFS, global field synchronization; Ng, neurogranin.
Next, the same logistic regression model was applied on a combination of significant CSF neurogranin and qEEG measures in order to study whether a combination of molecular and neurophysiological markers of synaptic pathology improves the classification accuracy for differentiating progressive from stable MCI patients. The combination of CSF neurogranin with theta power revealed both variables as significant predictors (p = 0.022 for CSF neurogranin, p = 0.029 for GFP theta); however, the classification accuracy remained the same as for GFP theta alone (74.3%). On the other hand, combination of CSF neurogranin with GFS beta and either GFP delta (p = 0.030 for CSF neurogranin, p = 0.043 for GFP delta, p = 0.0497 for GFS beta) or GFP theta (p = 0.038 for CSF neurogranin, p = 0.019 for GFP theta, p = 0.039 for GFS beta) displayed higher classification accuracy than either of these markers alone, with the latter combination reaching 81.4%(Table 5). GFP delta and theta were not combined in the same model due to multicollinearity.
A logistic regression model was further applied to examine whether the effect of neurogranin and/or qEEG measures depends on the patients’ CSF amyloid status in differentiating stable from progressive MCI patients. However, there were no statistically significant interactions between baseline CSF neurogranin or qEEG measures and amyloid status in predicting progression to AD dementia in MCI patients (Table 6).
Table 6
Interaction of baseline CSF neurogranin and qEEG measures with CSF Aβ42 status in predicting progression to AD dementia in MCI patients
| Variable | Odds ratio (95%CI) | |
| Progressive versus stable MCI | CSF Ng among CSF Aβ42 neg | 1.012 (1.001 –1.024)* |
| CSF Ng among CSF Aβ42 pos | 1.006 (0.994 –1.017) | |
| CSF Ng x CSF Aβ42 (neg/pos) | 1.007 (0.991 –1.022) | |
| CSF Aβ42 (neg/pos) | 0.291 (0.092 –0.920)* | |
| GFP delta among CSF Aβ42 neg | 1.936 (0.374 –10.027) | |
| GFP delta among CSF Aβ42 pos | 4.998 (0.533 –46.869) | |
| GFP delta x CSF Aβ42 (neg/pos) | 0.387 (0.024 –6.157) | |
| CSF Aβ42 (neg/pos) | 0.415 (0.136 –1.267) | |
| GFP theta among CSF Aβ42 neg | 1.747 (0.678 –4.505) | |
| GFP theta among CSF Aβ42 pos | 3.185 (0.803 –12.639) | |
| GFP theta x CSF Aβ42 (neg/pos) | 0.548 (0.103 –2.917) | |
| CSF Aβ42 (neg/pos) | 0.401 (0.132 –1.223) | |
| GFS beta among CSF Aβ42 neg | 1.359 (0.927 –1.991) | |
| GFS beta among CSF Aβ42 pos | 1.470 (0.928 –2.326) | |
| GFS beta x CSF Aβ42 (neg/pos) | 0.925 (0.540 –1.582) | |
| CSF Aβ42 (neg/pos) | 0.298 (0.096 –0.922)* |
Logistic regression with CSF neurogranin, qEEG measures and their interactions with CSF Aβ42 status as predictors and progression to AD dementia in MCI patients during two years follow-up as an outcome (stable versus progressive MCI). Data presented as odds ratio with 95%confidence intervals in brackets. The first two lines in each section of the table report association between CSF neurogranin/qEEG measures and progression status in patients that are CSF Aβ42 negative and positive, respectively. The third line reports the interaction between CSF neurogranin/qEEG measures and CSF Aβ42 status and corresponds to the relative difference between the odds ratio among CSF Aβ42 negative and odds ratio among CSF Aβ42 positive patients. The fourth line reports the main effect of CSF Aβ42 status in this interaction model, i.e., odds ratio for CSF Aβ42 negative versus positive among subjects that have the average value of CSF neurogranin/qEEG measures. CSF neurogranin and qEEG variables have been centered around mean. All models controlled for age, sex, and MMSE. *p < 0.05. CSF, cerebrospinal fluid; GFP, global field power; GFS, global field synchronization; MCI, mild cognitive impairment; Ng, neurogranin.
DISCUSSION
The present study investigated the relationship between molecular and functional synaptic markers in patients with MCI and whether they provide comparable or complementary information on predicting progression to AD dementia. The main findings were that 1) CSF neurogranin levels were associated with global EEG power and synchronization in theta frequency band in a progressive MCI group; 2) CSF neurogranin and EEG power in delta and theta band and EEG synchronization in beta band were independent predictors of progression to AD dementia in MCI patients during two years follow-up; 3) combination of CSF neurogranin and qEEG measures exhibited highest classification accuracy for progressive versus stable MCI patients, and 4) CSF neurogranin and qEEG measures were significant predictors of clinical progression to AD dementia independent of patients’ baseline amyloid status.
The first main finding is the association between CSF neurogranin levels and EEG power and synchronization in theta band. Lower neurogranin levels in the CSF were associated with higher theta power in the progressive MCI group once that the model was adjusted for CSF t-tau/Aβ42 ratio. Interestingly, an increase in theta power is one of the earliest EEG power spectra changes in patients along the AD continuum [41], and its baseline levels were also significantly higher in the progressive compared to stable MCI patients in the present study. This negative association might be a result of the compensatory mechanisms at the synaptic level that arise in MCI patients. A decrease in GFP theta might represent a different mechanism of synaptic compensation in patients with higher CSF neurogranin levels, such as in progressive MCI subjects. Another interpretation might be related to the inverse relationship between neurogranin and AD once it is adjusted for t-tau levels, i.e., the observation that lower CSF neurogranin levels may be associated with AD when t-tau effects are partialled out [20]. The authors suggested that it might be a result of neurogranin levels reflecting physiological neuronal function once the synaptic/neuronal injury factor has been removed. Lastly, specific synaptic injury reflected by changes in neurogranin could represent pathological mechanisms that affect theta generators in an opposing way compared to amyloid and/or tau pathology in AD.
We have additionally reported an association between elevated neurogranin levels in the CSF and reduced global synchronization in theta band in the whole and progressive MCI groups, after controlling for t-tau/Aβ42 levels. Decreased theta synchronization in cognitively impaired patients was reported in several studies [42, 43], even though some of these findings revealed only non-significant trends [26] or even contradictory results [44] which may be related to the use of different qEEG measures. Also, the present study has failed to identify differences in GFS theta between stable and progressive MCI groups.
The overall relationship of neurogranin alterations and theta power and synchronization in MCI patients might be related to the spatial overlap between pronounced synaptic pathology and theta generators in the vulnerable brain regions. Indeed, neurogranin levels are markedly decreased in the hippocampus of AD patients [45] and animal models of neurodegeneration [46], while the limbic structures are considered to be the ‘pacemaker’ of theta activity [47]. Furthermore, it has been reported that the potential for neuroplasticity-related processes is the highest in the limbic lobe compared to the rest of the cerebral cortex. Prolonged high levels of compensatory cellular activity due to increased neuroplasticity burden in the initial stages of AD could eventually become maladaptive and lead to the accelerated formation of AD-associated neuropathology, such as neurofibrillary tangles and amyloid plaques [48]. Hippocampal neurons have indeed shown the capacity for compensatory processes in the MCI stage of the disease [49] where even more extensive branching of dendritic trees in tangle-bearing compared to tangle-free neurons has been reported [50]. We could speculate that neurogranin levels, once that the effect of tau-related neuronal injury has been partialled out, could reflect a compensatory mechanism due to increased plasticity burden, especially pronounced in the limbic lobe of MCI patients that will progress to AD dementia. These synaptic alterations could consequently affect theta oscillations generated within the same vulnerable brain regions.
The second main finding was that CSF neurogranin and EEG measures of power and synchronization predicted future clinical progression to AD dementia and that their combination reached the highest classification accuracy when comparing progressive with stable MCI patients. Neurogranin, GFP delta, GFP theta and GFS beta were all independent significant predictors suggesting that they reflect complementary information on synaptic dysfunction due to AD. In addition, our results indicate that the highest classification accuracy for differentiating progressive versus stable MCI was achieved by combining CSF neurogranin, GFP theta, and GFS beta measures. Higher neurogranin levels in progressive MCI patients compared with healthy controls and stable MCI have already been reported in several studies [19, 20]. Moreover, increased neurogranin levels predicted future cognitive decline, reduction in brain glucose metabolism and hippocampal volume in MCI patients [19].
An increase in theta power is the most consistent power spectral finding with high predictive accuracy of future cognitive decline in healthy elderly and patients with SCD or MCI, reported by both EEG [30–32, 51] and MEG studies [52]. Additionally, it has been shown that theta power provides significant additional value to baseline neuropsychological tests, hippocampal volume and medial temporal lobe atrophy (MTA) score in predicting future cognitive performance [32, 52, 53]. It is believed that theta rhythms coordinate the hippocampus and neocortex during memory consolidation and retrieval [54]; however, organized high amplitude theta rhythm is an abnormal finding in the EEG of awake resting-state adults [47]. In the present study, GFP theta alone exhibited the highest potential to differentiate progressive from stable MCI, compared to the single use of CSF neurogranin or other qEEG measures. It should be further investigated whether theta power alone or in combination with other neurophysiological parameters could be used as a diagnostic and prognostic add-on in patients or clinics where CSF sampling is not feasible.
Increased delta power contributes to the global slowing of resting-state activity in AD and was shown to correlate with decreased amyloid-β levels in the CSF [28]. Prognostic significance of delta power was reported in several studies since an increase in delta power predicted conversion to AD in MCI subjects [55] and loss of activities of daily living in AD patients [56]. Interestingly, increased synchronization in the beta band at the baseline was predictive of future clinical progression in the present study, which is seemingly in contrast with previous reports of decreased synchronization in fast frequencies in MCI and AD patients [24, 28]. However, referred findings compared patients with objective cognitive impairment to healthy elderly and/or patients with SCD, while increased beta synchronization within MCI group might arise as a compensatory mechanism in an attempt to maintain cognitive performance in patients with impending cognitive decline. Higher overall EEG coherence, a measure of temporal synchronization of the EEG signals, including beta band, was indeed previously observed in MCI patients that converted to AD compared to non-converters [55].
Lastly, we reported a lack of interaction of neurogranin and qEEG measures with baseline CSF amyloid status in predicting future clinical progression to AD dementia, implying that these markers could have added prognostic value independent of patients’ amyloid positivity during MCI stage. Neurogranin was previously shown to correlate with Aβ42 levels in the CSF of cognitively impaired patients [20, 57]; however, some studies failed to report these associations in MCI group [12, 18]. These associations may be too weak in the MCI stage of the clinical continuum and/or would exhibit significant associations if the amyloid levels were corrected by the levels of individual amyloid production, e.g., by using CSF Aβ42/40 ratio. Still, it has been repeatedly shown that CSF neurogranin levels are elevated [19, 20] and that they predict a more rapid cognitive decline in amyloid positive MCI patients [18]. The number of subjects in the present study was not sufficient to divide the study population according to amyloid status for separate logistic regression analyses. Therefore, the results should be further evaluated in larger cohorts, using more lenient cut-offs for amyloid positivity and/or CSF Aβ42/40 ratio. Another limitation is that a certain proportion of stable MCI patients might have progressed to AD later, after the relatively short two years follow-up. Additionally, it would be of value to further investigate different qEEG measures in time and space domain and their add-on value to other procedures in multimodal prognostic work-up of dementia.
In conclusion, the present study indicates that qEEG and CSF neurogranin are independent predictors of progression to AD dementia in MCI patients. Additionally, qEEG measures of power and synchronization correlated with neurogranin levels in the CSF of progressive MCI patients, implying a relationship between molecular and neurophysiological (functional) synaptic markers in AD. Combining markers that mirror different and/or complementary aspects of synaptic injury has the potential to reliably identify subjects that are likely to decline to dementia and have a faster clinical progression of the disease, which is of utmost importance for timely preventive and personalized interventional strategies.
ACKNOWLEDGMENTS
This work was supported by European Union’s Horizon 2020 research and innovation program under the Marie Sk1odowska-Curie grant agreement number 676144 (Synaptic Dysfunction in Alzheimer Disease, SyDAD) (US, VJ), Gun and Bertil Stohne’s Research Scholarship (US), Gamla Tjänarinnor grant (US, VJ), Swedish State Support for Clinical Research (#ALF-591660) (VJ), Swedish Research Council (2018-02843, BW), and Margaretha af Ugglas Foundation (BW). HZ is a Wallenberg Scholar supported by grants from the Swedish Research Council (#2018-02532), the European Research Council (#681712), Swedish State Support for Clinical Research (#ALFGBG-720931), the Alzheimer Drug Discovery Foundation (ADDF), USA (#201809-2016862), and the UK Dementia Research Institute at UCL. KB is supported by the Swedish Research Council (#2017-00915), the Alzheimer Drug Discovery Foundation (ADDF), USA (#RDAPB-201809-2016615), the Swedish Alzheimer Foundation (#AF-742881), Hjärnfonden, Sweden (#FO2017-0243), the Swedish state under the agreement between the Swedish government and the County Councils, the ALF-agreement (#ALFGBG-715986), and European Union Joint Program for Neurodegenerative Disorders (JPND2019-466-236). PN is supported by Hållsten Research Foundation, Swedish Research Council, Swedish Brain foundation, Torsten Söderberg Foundation, Sonja Leikrans donation, The Erling-Persson Family Foundation.
Authors’ disclosures available online (https://www.j-alz.com/manuscript-disclosures/20-1234r3).
REFERENCES
[1] | Alzheimer’s Disease International ((2019) ) World Alzheimer Report 2019: Attitudes to dementia. Alzheimer’s Disease International, London. |
[2] | Petersen RC ((2016) ) Mild cognitive impairment. Continuum (Minneapolis, Minn.) 22: , 404–418. |
[3] | Winblad B , Palmer K , Kivipelto M , Jelic V , Fratiglioni L , Wahlund LO , Nordberg A , Backman L , Albert M , Almkvist O , Arai H , Basun H , Blennow K , de Leon M , DeCarli C , Erkinjuntti T , Giacobini E , Graff C , Hardy J , Jack C , Jorm A , Ritchie K , van Duijn C , Visser P , Petersen RC ((2004) ) Mild cognitive impairment–beyond controversies, towards a consensus: Report of the International Working Group on Mild Cognitive Impairment. J Intern Med 256: , 240–246. |
[4] | Albert MS , DeKosky ST , Dickson D , Dubois B , Feldman HH , Fox NC , Gamst A , Holtzman DM , Jagust WJ , Petersen RC , Snyder PJ , Carrillo MC , Thies B , Phelps CH ((2011) ) The diagnosis of mild cognitive impairment due to Alzheimer’s disease: Recommendations from the National Institute on Aging-Alzheimer’s Association workgroups on diagnostic guidelines for Alzheimer’s disease. Alzheimers Dement 7: , 270–279. |
[5] | Price JL , Morris JC ((1999) ) Tangles and plaques in nondemented aging and “preclinical” Alzheimer’s disease. Ann Neurol 45: , 358–368. |
[6] | Chételat G , La Joie R , Villain N , Perrotin A , de La Sayette V , Eustache F , Vandenberghe R ((2013) ) Amyloid imaging in cognitively normal individuals, at-risk populations and preclinical Alzheimer’s disease. Neuroimage Clin 2: , 356–365. |
[7] | Crary JF , Trojanowski JQ , Schneider JA , Abisambra JF , Abner EL , Alafuzoff I , Arnold SE , Attems J , Beach TG , Bigio EH , Cairns NJ , Dickson DW , Gearing M , Grinberg LT , Hof PR , Hyman BT , Jellinger K , Jicha GA , Kovacs GG , Knopman DS , Kofler J , Kukull WA , Mackenzie IR , Masliah E , McKee A , Montine TJ , Murray ME , Neltner JH , Santa-Maria I , Seeley WW , Serrano-Pozo A , Shelanski ML , Stein T , Takao M , Thal DR , Toledo JB , Troncoso JC , Vonsattel JP , White CL , 3rd, Wisniewski T , Woltjer RL , Yamada M , Nelson PT ((2014) ) Primary age-related tauopathy (PART): A common pathology associated with human aging. Acta Neuropathol 128: , 755–766. |
[8] | Scheff SW , Price DA , Schmitt FA , Mufson EJ ((2006) ) Hippocampal synaptic loss in early Alzheimer’s disease and mild cognitive impairment. Neurobiol Aging 27: , 1372–1384. |
[9] | Scheff SW , Price DA , Schmitt FA , Scheff MA , Mufson EJ ((2011) ) Synaptic loss in the inferior temporal gyrus in mild cognitive impairment and Alzheimer’s disease. J Alzheimers Dis 24: , 547–557. |
[10] | Terry RD , Masliah E , Salmon DP , Butters N , DeTeresa R , Hill R , Hansen LA , Katzman R ((1991) ) Physical basis of cognitive alterations in Alzheimer’s disease: Synapse loss is the major correlate of cognitive impairment. Ann Neurol 30: , 572–580. |
[11] | Stern Y ((2012) ) Cognitive reserve in ageing and Alzheimer’s disease. Lancet Neurol 11: , 1006–1012. |
[12] | Portelius E , Olsson B , Hoglund K , Cullen NC , Kvartsberg H , Andreasson U , Zetterberg H , Sandelius A , Shaw LM , Lee VMY , Irwin DJ , Grossman M , Weintraub D , Chen-Plotkin A , Wolk DA , McCluskey L , Elman L , McBride J , Toledo JB , Trojanowski JQ , Blennow K ((2018) ) Cerebrospinal fluid neurogranin concentration in neurodegeneration: Relation to clinical phenotypes and neuropathology. Acta Neuropathol 136: , 363–376. |
[13] | Tarawneh R , D’Angelo G , Crimmins D , Herries E , Griest T , Fagan AM , Zipfel GJ , Ladenson JH , Morris JC , Holtzman DM ((2016) ) Diagnostic and prognostic utility of the synaptic marker neurogranin in Alzheimer disease. JAMA Neurol 73: , 561–571. |
[14] | Wellington H , Paterson RW , Portelius E , Tornqvist U , Magdalinou N , Fox NC , Blennow K , Schott JM , Zetterberg H ((2016) ) Increased CSF neurogranin concentration is specific to Alzheimer disease. Neurology 86: , 829–835. |
[15] | Singec I , Knoth R , Ditter M , Volk B , Frotscher M ((2004) ) Neurogranin is expressed by principal cells but not interneurons in the rodent and monkey neocortex and hippocampus. J Comp Neurol 479: , 30–42. |
[16] | BogdanovicN, DavidssonP, GottfriesJ, VolkmanI, WinbladB, BlennowK ((2002) ) Regional and cellular distribution of synaptic proteins in the normal human brain. Brain Aging 2: , 18–30. |
[17] | Diez-Guerra FJ ((2010) ) Neurogranin, a link between calcium/calmodulin and protein kinase C signaling in synaptic plasticity. IUBMB Life 62: , 597–606. |
[18] | Kvartsberg H , Duits FH , Ingelsson M , Andreasen N , Ohrfelt A , Andersson K , Brinkmalm G , Lannfelt L , Minthon L , Hansson O , Andreasson U , Teunissen CE , Scheltens P , Van der Flier WM , Zetterberg H , Portelius E , Blennow K ((2015) ) Cerebrospinal fluid levels of the synaptic protein neurogranin correlates with cognitive decline in prodromal Alzheimer’s disease. Alzheimers Dement 11: , 1180–1190. |
[19] | Portelius E , Zetterberg H , Skillbäck T , Törnqvist U , Andreasson U , Trojanowski JQ , Weiner MW , Shaw LM , Mattsson N , Blennow K , Alzheimer’s Disease Neuroimaging Initiative((2015) ) Cerebrospinal fluid neurogranin: Relation to cognition and neurodegeneration in Alzheimer’s disease. Brain 138: , 3373–3385. |
[20] | Mattsson N , Insel PS , Palmqvist S , Portelius E , Zetterberg H , Weiner M , Blennow K , Hansson O , Alzheimer’s Disease Neuroimaging Initiative ((2016) ) Cerebrospinal fluid tau, neurogranin, and neurofilament light in Alzheimer’s disease. EMBO Mol Med 8: , 1184–1196. |
[21] | Kvartsberg H , Lashley T , Murray CE , Brinkmalm G , Cullen NC , Hoglund K , Zetterberg H , Blennow K , Portelius E ((2019) ) The intact postsynaptic protein neurogranin is reduced in brain tissue from patients with familial and sporadic Alzheimer’s disease. Acta Neuropathol 137: , 89–102. |
[22] | Prichep LS , John ER , Ferris SH , Reisberg B , Almas M , Alper K , Cancro R ((1994) ) Quantitative EEG correlates of cognitive deterioration in the elderly. Neurobiol Aging 15: , 85–90. |
[23] | Jelic V , Shigeta M , Julin P , Almkvist O , Winblad B , Wahlund LO ((1996) ) Quantitative electroencephalography power and coherence in Alzheimer’s disease and mild cognitive impairment. Dementia 7: , 314–323. |
[24] | Koenig T , Prichep L , Dierks T , Hubl D , Wahlund LO , John ER , Jelic V ((2005) ) Decreased EEG synchronization in Alzheimer’s disease and mild cognitive impairment. Neurobiol Aging 26: , 165–171. |
[25] | Ma CC , Liu AJ , Liu AH , Zhou XY , Zhou SN ((2014) ) Electroencephalogram global field synchronization analysis: A new method for assessing the progress of cognitive decline in Alzheimer’s disease. Clin EEG Neurosci 45: , 98–103. |
[26] | Park Y-M , Che H-J , Im C-H , Jung H-T , Bae S-M , Lee S-H ((2008) ) Decreased EEG synchronization and its correlation with symptom severity in Alzheimer’s disease. Neurosci Res 62: , 112–117. |
[27] | Luckhaus C , Grass-Kapanke B , Blaeser I , Ihl R , Supprian T , Winterer G , Zielasek J , Brinkmeyer J ((2008) ) Quantitative EEG in progressing vs stable mild cognitive impairment (MCI): Results of a 1-year follow-up study. Int J Geriatr Psychiatry 23: , 1148–1155. |
[28] | Smailovic U , Koenig T , Kareholt I , Andersson T , Kramberger MG , Winblad B , Jelic V ((2018) ) Quantitative EEG power and synchronization correlate with Alzheimer’s disease CSF biomarkers. Neurobiol Aging 63: , 88–95. |
[29] | Schjønning Nielsen M , Simonsen AH , Siersma V , Engedal K , Jelic V , Andersen BB , Naik M , Hasselbalch SG , Høgh P ((2018) ) Quantitative electroencephalography analyzed by statistical pattern recognition as a diagnostic and prognostic tool in mild cognitive impairment: Results from a Nordic multicenter cohort study. Dement Geriatr Cogn Disord Extra 8: , 426–438. |
[30] | Jelic V , Johansson SE , Almkvist O , Shigeta M , Julin P , Nordberg A , Winblad B , Wahlund LO ((2000) ) Quantitative electroencephalography in mild cognitive impairment: Longitudinal changes and possible prediction of Alzheimer’s disease. Neurobiol Aging 21: , 533–540. |
[31] | Huang C , Wahlund L , Dierks T , Julin P , Winblad B , Jelic V ((2000) ) Discrimination of Alzheimer’s disease and mild cognitive impairment by equivalent EEG sources: A cross-sectional and longitudinal study. Clin Neurophysiol 111: , 1961–1967. |
[32] | Gouw AA , Alsema AM , Tijms BM , Borta A , Scheltens P , Stam CJ , van der Flier WM ((2017) ) EEG spectral analysis as a putative early prognostic biomarker in nondemented, amyloid positive subjects. Neurobiol Aging 57: , 133–142. |
[33] | Koenig T , Smailovic U , Jelic V ((2020) ) Past, present and future EEG in the clinical workup of dementias. Psychiatry Res Neuroimaging 306: , 111182. |
[34] | Dauwan M , van der Zande JJ , van Dellen E , Sommer IE , Scheltens P , Lemstra AW , Stam CJ ((2016) ) Random forest to differentiate dementia with Lewy bodies from Alzheimer’s disease. Alzheimers Dement (Amst) 4: , 99–106. |
[35] | Höller Y , Bathke AC , Uhl A , Strobl N , Lang A , Bergmann J , Nardone R , Rossini F , Zauner H , Kirschner M , Jahanbekam A , Trinka E , Staffen W ((2017) ) Combining SPECT and quantitative EEG analysis for the automated differential diagnosis of disorders with amnestic symptoms. Front Aging Neurosci 9: , 290–290. |
[36] | Colloby SJ , Cromarty RA , Peraza LR , Johnsen K , Johannesson G , Bonanni L , Onofrj M , Barber R , O’Brien JT , Taylor JP ((2016) ) Multimodal EEG-MRI in the differential diagnosis of Alzheimer’s disease and dementia with Lewy bodies. J Psychiatr Res 78: , 48–55. |
[37] | World Health Organization ((1993) ) The ICD-10 Classification of Mental and Behavioural Disorders: Diagnostic Criteria for Research. World Health Organization, Geneva xiii, 248. |
[38] | Olsson A , Vanderstichele H , Andreasen N , De Meyer G , Wallin A , Holmberg B , Rosengren L , Vanmechelen E , Blennow K ((2005) ) Simultaneous measurement of beta-amyloid(1-42), total tau, and phosphorylated tau (Thr181) in cerebrospinal fluid by the xMAP technology. Clin Chem 51: , 336–345. |
[39] | Lehmann D , Michel CM ((1989) ) Intracerebral dipole sources of EEG FFT power maps. Brain Topogr 2: , 155–164. |
[40] | Koenig T , Lehmann D , Saito N , Kuginuki T , Kinoshita T , Koukkou M ((2001) ) Decreased functional connectivity of EEG theta-frequency activity in first-episode, neuroleptic-naive patients with schizophrenia: Preliminary results. Schizophr Res 50: , 55–60. |
[41] | Dierks T , Perisic I , Frolich L , Ihl R , Maurer K ((1991) ) Topography of the quantitative electroencephalogram in dementia of the Alzheimer type: Relation to severity of dementia. Psychiatry Res 40: , 181–194. |
[42] | Adler G , Brassen S , Jajcevic A ((2003) ) EEG coherence in Alzheimer’s dementia. J Neural Transm (Vienna) 110: , 1051–1058. |
[43] | Babiloni C , Ferri R , Binetti G , Cassarino A , Dal Forno G , Ercolani M , Ferreri F , Frisoni GB , Lanuzza B , Miniussi C , Nobili F , Rodriguez G , Rundo F , Stam CJ , Musha T , Vecchio F , Rossini PM ((2006) ) Fronto-parietal coupling of brain rhythms in mild cognitive impairment: A multicentric EEG study. Brain Res Bull 69: , 63–73. |
[44] | Locatelli T , Cursi M , Liberati D , Franceschi M , Comi G ((1998) ) EEG coherence in Alzheimer’s disease. Electroencephalogr Clin Neurophysiol 106: , 229–237. |
[45] | Davidsson P , Blennow K ((1998) ) Neurochemical dissection of synaptic pathology in Alzheimer’s disease. Int Psychogeriatr 10: , 11–23. |
[46] | Hoglund K , Schussler N , Kvartsberg H , Smailovic U , Brinkmalm G , Liman V , Becker B , Zetterberg H , Cedazo-Minguez A , Janelidze S , Lefevre IA , Eyquem S , Hansson O , Blennow K ((2019) ) Cerebrospinal fluid neurogranin in an inducible mouse model of neurodegeneration: A translatable marker of synaptic degeneration. Neurobiol Dis 134: , 104645. |
[47] | Schomer DL , Lopes da Silva F (2015) Niedermeyer’s Electroencephalography: Basic Principles, Clinical Applications, and Related Fields. |
[48] | Mesulam MM ((1999) ) Neuroplasticity failure in Alzheimer’s disease: Bridging the gap between plaques and tangles. Neuron 24: , 521–529. |
[49] | Mufson EJ , Mahady L , Waters D , Counts SE , Perez SE , DeKosky ST , Ginsberg SD , Ikonomovic MD , Scheff SW , Binder LI ((2015) ) Hippocampal plasticity during the progression of Alzheimer’s disease. Neuroscience 309: , 51–67. |
[50] | Gertz HJ , Krüger H , Patt S , Cervos-Navarro J ((1991) ) Tangle-bearing neurons show more extensive dendritic trees than tangle-free neurons in area CA1 of the hippocampus in Alzheimer’s disease. Brain Res 548: , 260–266. |
[51] | Prichep LS , John ER , Ferris SH , Rausch L , Fang Z , Cancro R , Torossian C , Reisberg B ((2006) ) Prediction of longitudinal cognitive decline in normal elderly with subjective complaints using electrophysiological imaging. Neurobiol Aging 27: , 471–481. |
[52] | López ME , Turrero A , Cuesta P , López-Sanz D , Bruña R , Marcos A , Gil P , Yus M , Barabash A , Cabranes JA , Maestú F , Fernández A ((2016) ) Searching for primary predictors of conversion from mild cognitive impairment to Alzheimer’s disease: A multivariate follow-up study. J Alzheimers Dis 52: , 133–143. |
[53] | van der Hiele K , Bollen EL , Vein AA , Reijntjes RH , Westendorp RG , van Buchem MA , Middelkoop HA , van Dijk JG ((2008) ) EEG markers of future cognitive performance in the elderly. J Clin Neurophysiol 25: , 83–89. |
[54] | Gage NM , Baars BJ ((2018) ) Chapter 3 - Observing the Brain. In Fundamentals of Cognitive Neuroscience (Second Edition), Gage NM, Baars BJ, eds. Academic Press, San Diego, pp. 53–97. |
[55] | Rossini PM , Del Percio C , Pasqualetti P , Cassetta E , Binetti G , Dal Forno G , Ferreri F , Frisoni G , Chiovenda P , Miniussi C , Parisi L , Tombini M , Vecchio F , Babiloni C ((2006) ) Conversion from mild cognitive impairment to Alzheimer’s disease is predicted by sources and coherence of brain electroencephalography rhythms. Neuroscience 143: , 793–803. |
[56] | Rodriguez G , Nobili F , Arrigo A , Priano F , De Carli F , Francione S , Gambaro M , Rosadini G ((1996) ) Prognostic significance of quantitative electroencephalography in Alzheimer patients: Preliminary observations. Electroencephalogr Clin Neurophysiol 99: , 123–128. |
[57] | Thorsell A , Bjerke M , Gobom J , Brunhage E , Vanmechelen E , Andreasen N , Hansson O , Minthon L , Zetterberg H , Blennow K ((2010) ) Neurogranin in cerebrospinal fluid as a marker of synaptic degeneration in Alzheimer’s disease. Brain Res 1362: , 13–22. |


