
Cerebrospinal Fluid C18 Ceramide Associates with Markers of Alzheimer’s Disease and Inflammation at the Pre- and Early Stages of Dementia
Abstract
Background:
Understanding how dysregulation in lipid metabolism relates to the severity of Alzheimer‘s disease (AD) pathology might be critical in developing effective treatments.
Objective:
To identify lipid species in cerebrospinal fluid (CSF) associated with signature AD pathology and to explore their relationships with measures reflecting AD-related processes (neurodegeneration, inflammation, deficits in verbal episodic memory) among subjects at the pre- and early symptomatic stages of dementia.
Methods:
A total of 60 subjects that had been referred to an Icelandic memory clinic cohort were classified as having CSF AD (n = 34) or non-AD (n = 26) pathology profiles. Untargeted CSF lipidomic analysis was performed using ultra-performance liquid chromatography-tandem mass spectrometry (UPLC-MS) for the detection of mass-to-charge ratio (m/z) features. CSF proteins reflecting neurodegeneration (neurofilament light [NFL]) and inflammation (chitinase-3-like protein 1 [YKL-40], S100 calcium-binding protein B [S100B], glial fibrillary acidic protein [GFAP]) were also measured. Rey Auditory Verbal Learning (RAVLT) and Story tests were used for the assessment of verbal episodic memory.
Results:
Eight out of 1008 features were identified as best distinguishing between the CSF profile groups. Of those, only the annotation of the m/z feature assigned to lipid species C18 ceramide was confirmed with a high confidence. Multiple regression analyses, adjusted for age, gender, and education, demonstrated significant associations of CSF core AD markers (Aβ42: st.β= –0.36, p = 0.007; T-tau: st.β= 0.41, p = 0.005) and inflammatory marker S100B (st.β= 0.51, p = 0.001) with C18 ceramide levels.
Conclusion:
Higher levels of C18 ceramide associated with increased AD pathology and inflammation, suggesting its potential value as a therapeutic target.
INTRODUCTION
Alzheimer’s disease (AD) is a neurodegenerative disease that leads to progressive cognitive impairment and dementia. The pathology of AD, which starts decades before the appearance of clinical symptoms [1], is characterized by extracellular amyloid plaques containing amyloid-β (Aβ) and intracellular neurofibrillary tangles (NFTs) comprised of phosphorylated tau (P-tau) [2, 3]. The most widely accepted hypothesis regarding AD pathogenesis proposes that the deposition of Aβ leads to formation of NFTs, neuronal dysfunction, and dementia [4]. Although abundant evidence places Aβ and tau pathology at the center of AD pathogenesis, the mechanisms linking the two together and to eventual neuronal dysfunction and death are still unclear [4, 5]. As Aβ and tau pathology levels are relatively constant in the symptomatic stages of the disease, they are not considered suitable as progression markers [6–9]. Biomarkers reflecting other aspects of AD pathology are therefore needed. Genome-wide association studies have identified about 30 risk genes with a high proportion related to lipid metabolism, immune response, or both [10, 11]. These findings suggest that dysregulation of lipids and inflammatory proteins play an essential part in the pathogenesis of AD.
Lipids play various roles in the human body, both as structural components of cell membranes and in diverse biochemical processes, including membrane trafficking and cell signaling [12]. A dozen of major lipid classes are found within eukaryotic organisms, each comprising hundreds of individual molecular species [13]. Major classes, including glycerophospholipids, sphingolipids, fatty acids, and cholesterol [14], are abundantly expressed in the brain. These lipids are utilized in different compartments of glial cells and neurons [15]. In recent years, the role of lipid metabolism defects in AD pathogenesis has gained increased attention. Several molecular mechanisms have been identified, which connect membrane lipids to the generation and aggregation of Aβ. Pathological forms of Aβ proteins are formed by proteolytic cleavage of the transmembrane protein AβPP by β- and γ-secretases [16]. Lipid membrane structure and organization can affect the activity of these transmembrane enzymes, and thus AβPP processing and Aβ production [17]. Furthermore, secretases, AβPP, and its derivatives also appear to affect the activity of lipid metabolic enzymes and subcellular trafficking, thereby changing the membrane lipid composition. Lipids might, therefore, play a role in the initiation and progression of AD pathogenesis [16].
Studies have established neuroinflammation as a contributing factor in the pathogenesis and progression of AD and other neurodegenerative diseases [18, 19]. Aβ plaques induce an immune response by activation of microglia and astrocytes [20–22], which in turn is thought to play a role in the formation of NFTs, contributing to neuronal dysfunction and loss [23]. The glial proteins chitinase-3-like-1 protein (YKL-40), calcium-binding protein S100B, and glial fibrillary acidic protein (GFAP) have been associated with AD pathology [24]. All proteins are expressed primarily (YKL-40 and S100B) [25, 26], or exclusively (GFAP) [27] in astrocytes within the central nervous system (CNS). YKL-40, a chitin-binding glycoprotein [28], has been reported to be a promising candidate biomarker of glial activation in AD. Previous studies have detected positive relationships between YKL-40 and the neurodegeneration markers tau [29–32] and neurofilament light (NFL) [33] in cerebrospinal fluid (CSF), demonstrating an association between glial activation and neurodegeneration [34]. NFL is mainly located in myelinated axons, with recent studies indicating a potential for this protein as both a diagnostic and a progression marker in AD and other neurodegenerative diseases [35, 36]. S100B, a calcium-binding protein, exerts both intracellular and extracellular functions and has been found to be upregulated in AD tissues [37, 38]. GFAP is an intermediate filament protein and a marker for astrocyte activation, which has both been associated with amyloid plaque load and the number of NFTs [39–41].
In recent years, a paradigm shift has occurred from clinical to biological definition of AD based on in vivo biomarkers measured in CSF or with positron emission tomography (PET) imaging [1]. The most recent research criteria base the diagnosis of AD partly [42] or primarily [1] on signature profiles defined by CSF/PET Aβ, CSF total tau (T-tau), and CSF P-tau levels. The International Working Group (IWG) [42], for example, defines typical AD as a combination of biomarker evidence (decreased CSF/PET Aβ42 together with increased CSF T-tau or P-tau) and a specific phenotype (presence of a significant episodic memory impairment). Although the diagnostic accuracies of these core biomarkers are satisfactory [43], there is still a need to examine others. Understanding how biomarkers reflecting other processes could influence AD pathogenesis and severity is critical for the improvement of diagnosis and development of effective pharmacologic treatments. The first aim of this study was to identify CSF lipid species associated with CSF profile reflecting signature AD pathology in a cohort of subjects at the pre- and early symptomatic stages of dementia. The second aim was to explore the relationships between candidate lipid species and measures reflecting other AD-associated processes, including neuronal generation, inflammation and impairment in verbal episodic memory.
MATERIALS AND METHODS
Subjects
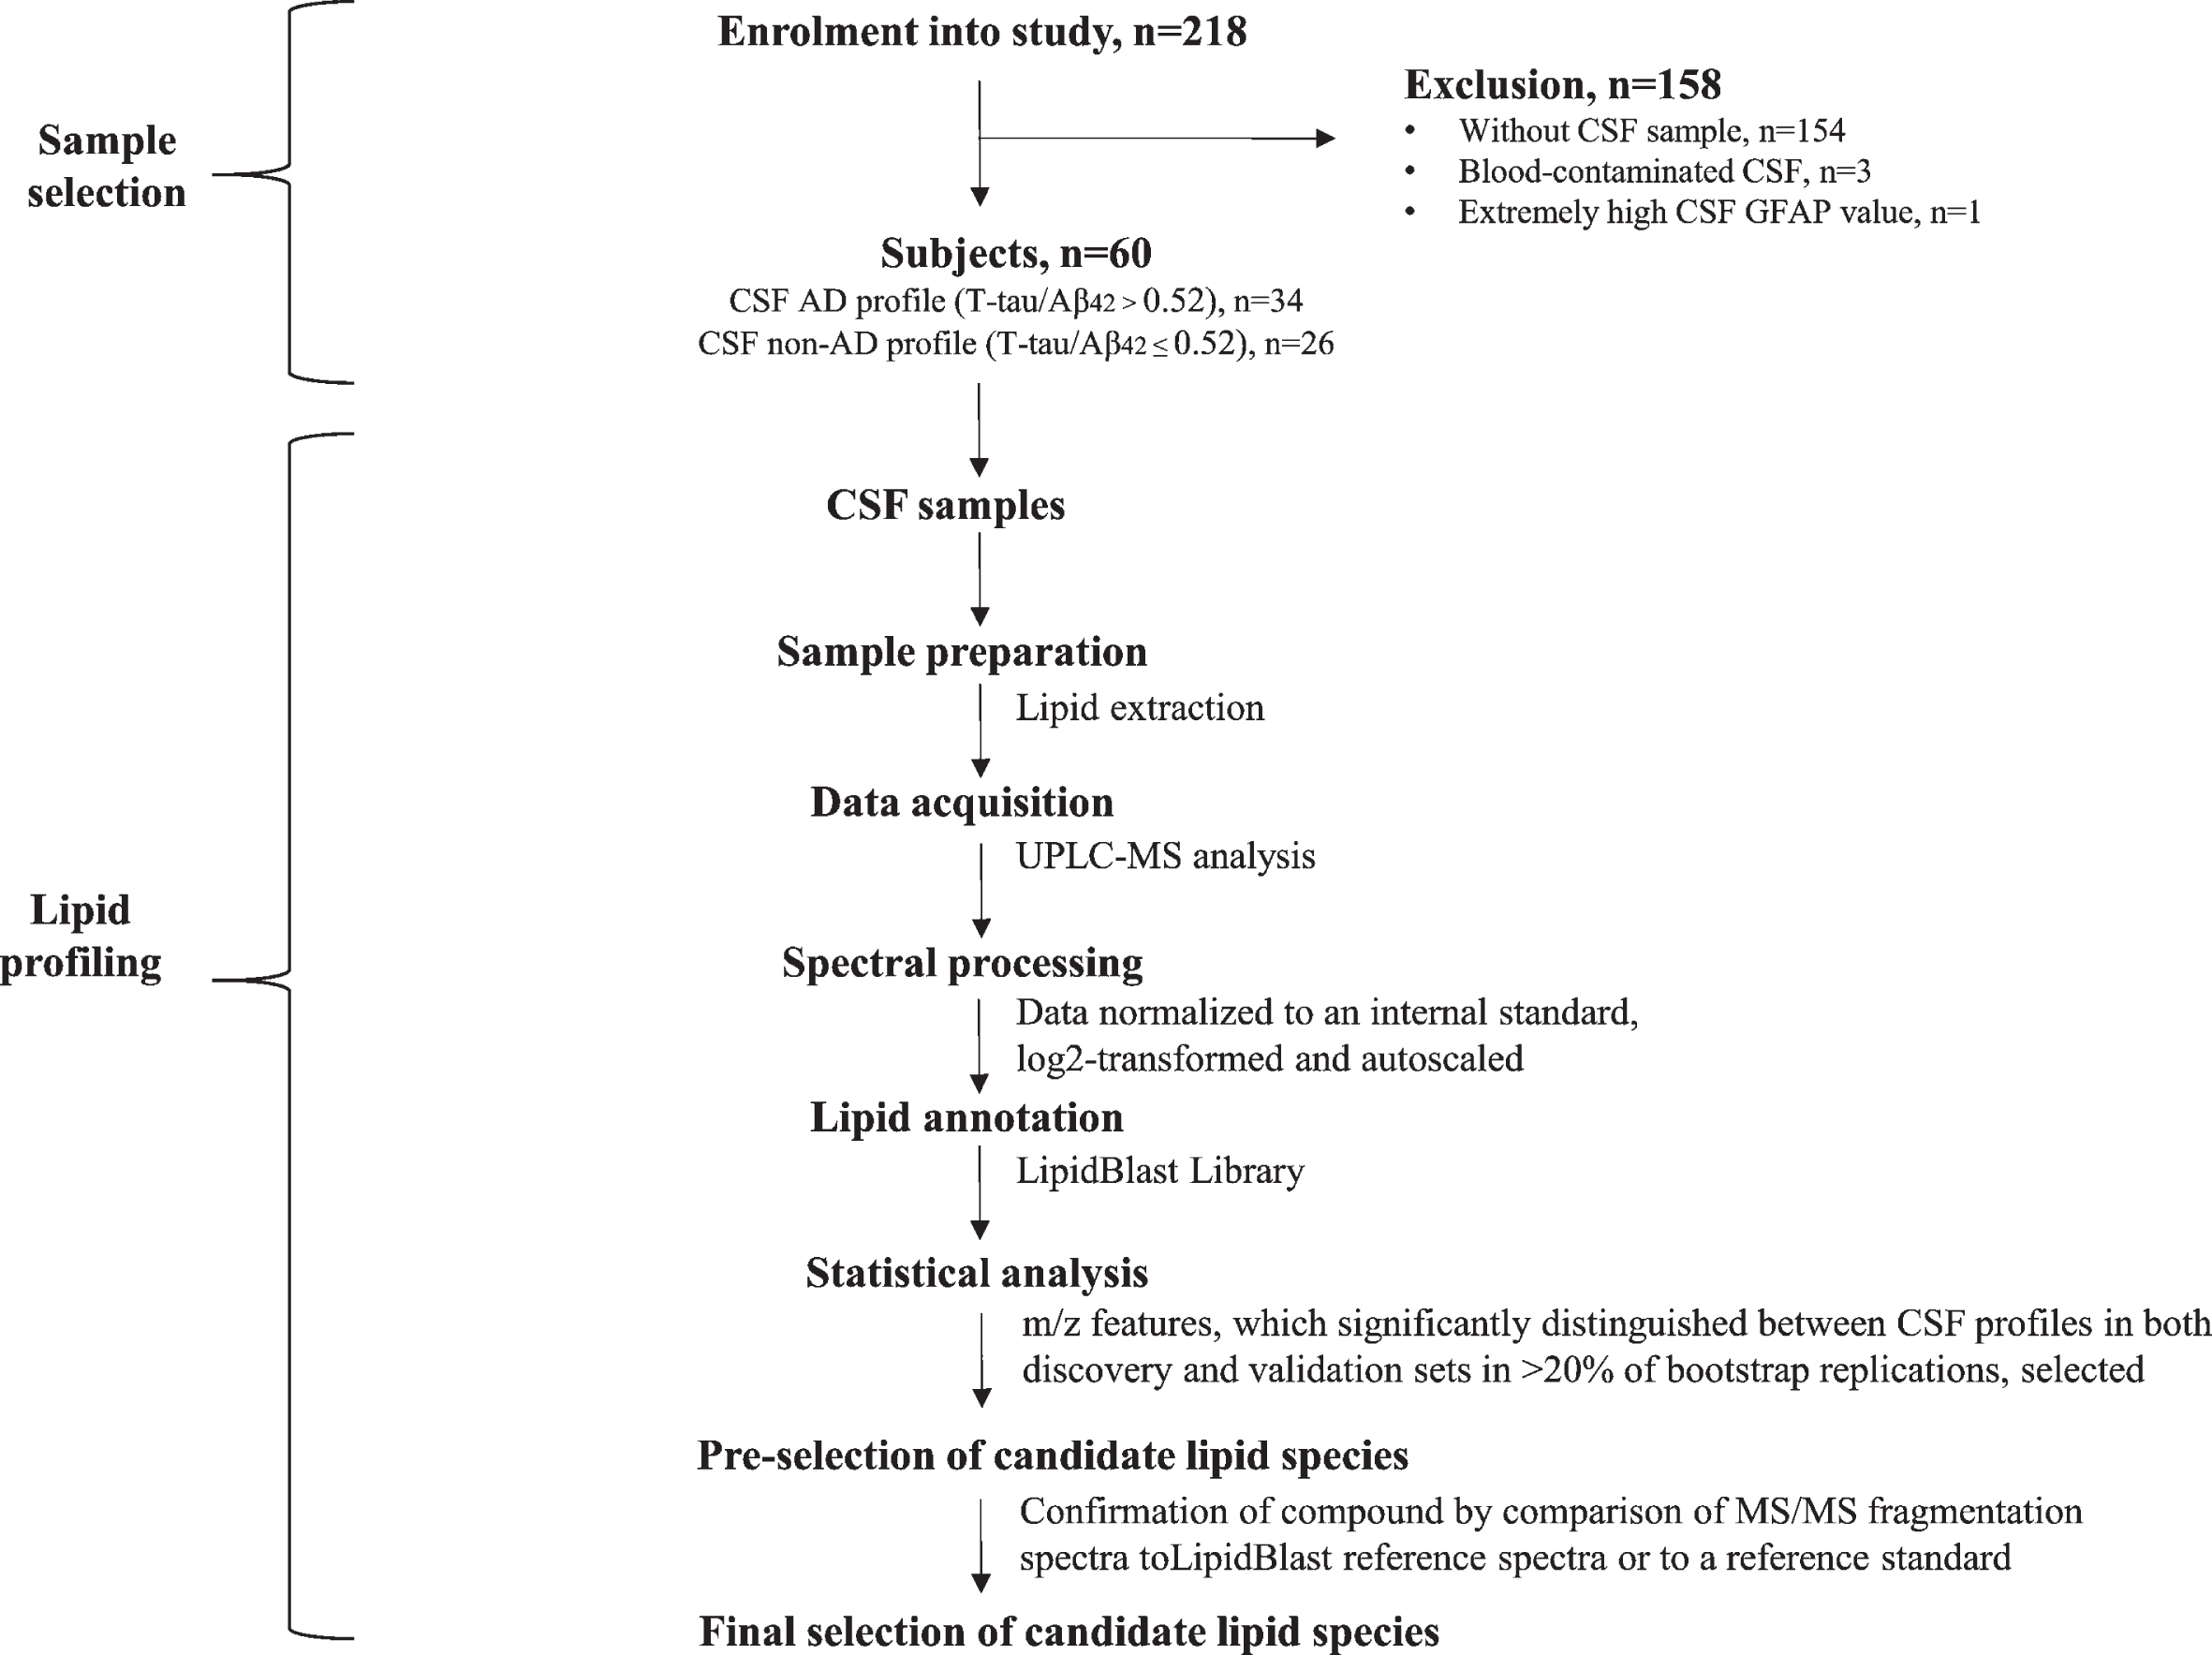
Subjects from The Icelandic MCI study cohort (n = 218), who had undergone lumbar puncture, were selected for this cross-sectional study (n = 64). The cohort was comprised of individuals who had been referred to Landspitali University Hospital (LUH) Memory Clinic over a four-year period (Fig. 1). The inclusion criteria for joining the cohort study were: 1) a score between 24–30 on the Mini-Mental State Examination (MMSE) [44] and 2) a score of 4.0 or less on the Informant Questionnaire on Cognitive Decline in the Elderly (IQCODE) [45]. The exclusion criteria were the following: 1) cognitive impairment caused by a pre-existing condition, 2) difficulties participating due to health or social issues, and 3) residency outside the Reykjavík Capital Area. Each subject underwent various measurements at baseline, which included a medical assessment and a detailed neuropsychological assessment as well as brain magnetic resonance imaging (MRI) for the evaluation of medial temporal lobe atrophy (MTA) and white matter lesions. Lumbar puncture was carried out for the collection of CSF, but the intervention was optional required by the National Bioethics Committee. The final sample included 60 subjects as four were removed due to excessively high CSF GFAP value (n = 1) or blood-contamination in CSF samples (n = 3). Clinical diagnosis of AD was based on the criteria for probable AD dementia defined by the National Institute on Aging-Alzheimer’s Association (NIA-AA) [46], with evidence of AD pathophysiological processes (based on MTA score or/and analysis of core CSF markers). Patients with Lewy body dementia (LBD) were diagnosed based on the consensus criteria of McKeith [47]. The diagnosis of mild cognitive impairment (MCI) required the fulfillment of the Winblad criteria [48]. Those without cognitive impairment were considered to have subjective cognitive impairment (SCI), as they had been referred to the Memory Clinic due to concerns of cognitive decline. Of the 60 participants in this study, 13 were diagnosed with SCI, 23 with MCI, 20 with AD, three with LBD, and one with Parkinson’s disease.
Fig. 1
Flow diagram of sample selection and lipid profiling techniques applied to the analysis of CSF samples.
The study has been approved by the National Research Ethics Committee of Iceland (VSN-14-028) and all subjects signed an informed consent. The study was conducted in accordance with the Helsinki Declaration latest revision of 2013.
CSF collection and analysis
Collection of CSF was done via lumbar puncture with a 22-gauge spinal needle at the L3/4 or L4/5 interspace. Samples, uncentrifuged, were frozen in 2 ml polypropylene tubes and stored at –80°C. Levels of all proteins were determined using commercially available sandwich enzyme-linked immuno-sorbent assays (ELISAs) and performed according to manufacturer‘s instructions. Levels of T-tau (IBL International, Hamburg, Germany), P-tau181 (INNOTEST, Gent, Belgium), and Aβ42 (IBL International, Hamburg, Germany), were measured in the ISO 15189 accredited medical laboratory MVZ Labor P.D. Dr. Volkmann und Kollegen GbR (Karls-ruhe, Germany). Levels of NFL (Uman Diagnostics, Umeå, Sweden), YKL-40 (Quantikine ELISA Human Chitinase-3–like 1; R&D systems, MN, USA), S100B (BioVendor GmbH, Heidelberg, Germany), and GFAP (BioVendor GmbH, Heidelberg, Germany) were measured in a laboratory at the University of Iceland. All assays had mean Intra-assay CV < 10% and Inter-assay CV < 15%.
Subject grouping based on CSF measures
Each subject was classified based on CSF T-tau and Aβ42 values, independently of clinical diagnosis. A cut-off of 0.52 for T-tau/Aβ42 ratio was selected based on results from a large memory clinic cohort study [49]. T-tau/Aβ42 ratio > 0.52 was defined as a signature CSF AD profile. The CSF AD profile group had a total of 34 subjects (20 with a clinical diagnosis of AD dementia, 10 with MCI, three with SCI and one with Lewy body dementia) while the non-AD profile had a total of 26 subjects (13 with MCI, 10 with SCI, two with LBD, and one with Parkinson’s disease). The same ratio cut-off point was also used as a part of the clinical diagnosis of AD, explaining full concordance with the CSF AD profile.
Neuropsychological tests
A detailed neuropsychological assessment, for the evaluation of different cognitive domains, was performed by licensed psychologists under the supervision of a clinical neuropsychologist. A significant impairment in episodic memory is commonly the earliest clinical symptom of AD [50], and therefore of specific interest here. Two tests were used for the evaluation of verbal episodic memory, The Rey Auditory Verbal Learning Test (RAVLT) [51], and a Story test based on the Logical Memory test of the Wechsler Memory Scale-Revised [52]. RAVLT consists of 15 nouns presented across five consecutive trials, with each trial followed by a free-recall test (immediate recall). A score for RAVLT immediate recall was calculated by summing up the number of words recalled from trials 1 through 5 (0 to 75 points). After a 30 min delay, subjects were required to recall the words without being reread the list (delayed recall). A point was given for each correct word (0 to 15 points). The second test was composed of an orally presented story, which included 25 ideas. Right after the presentation, the subject was asked to repeat what they remembered without being given any clues. After a 30 min delay, there was another recall without the story being reread to the subject. For both immediate and delayed recall, a point was given for each idea (0 to 25 points).
Sample preparation and scanning UPLC-MS analysis
CSF sample extraction was based on the method used in Bird et al. [53]. Briefly, C12 ceramide and C17 sphingomyelin (SM d18:1/17:0) were purchased from Avanti Polar Lipids (Alabaster, AL, USA) and added to 30μl of CSF as internal standards prior to lipid extraction. Dried lipid extracts were resuspended in 300μL of ACN/IPA/H2O (65:30:5 v/v/v) and stored at –80°C prior to analyses. C18 SM (d18:1/18:0) and C18 ceramide (d18:1/18:0) were run alongside samples for reference as both SMs and ceramides have consistently been associated with AD [54]. Ultra-performance liquid chromatography-tandem mass spectrometry (UPLC-MS) lipidomic analysis was carried out as described in Kotronoulas et al. [55]. The analytical instrumentation used was an ACQUITY UPLC system (UPLC ACQUITY, Waters Corporation, Milford, MA) coupled to a traveling-wave ion mobility (IMS) qTOF mass spectrometer (Synapt G2 HDMS, Waters Corporation, Manchester, UK). The chromatographic gradient separation was performed on an ACQUITY CSH C18 column (2.1 mm× 150 mm, 1.7μm particle size, Waters Corporation) at 60°C (Supplementary Figure 1). Mobile phase A was H2O/2-isopropanol (80:20) and mobile phase B 2-isopropanol/ACN/H2O (90:9.1), both with 0.05% of formic acid and 5 mM ammonium formate. Injection volume was 10μL, flow rate was 0.4 mL/min, and the run time was 17 min. The following gradient pattern (solvent B) was used: 0 min, 40% B; 1 min, 40% B; 3 min, 60% B; 10 min, 100% B; 13.5 min, 100% B; 14 min, 40% B; 17 min, 40 % B. Both positive (+) and negative (-) electrospray ionization (ESI) modes were acquired. The capillary and cone voltage were 2.5 kV and 30 V, respectively. The source and desolvation temperature were 120 and 500°C and the desolvation gas flow was 800 L/h. During High Definition MSE (HDMSE) experiments, the collision energy in the trap cell was off, and in the transfer cell, it ranged from 20 to 30 eV for the positive mode and from 25 to 40 eV for the negative mode. The resulting MS data were analyzed further within the MS-Dial program.
Spectral processing
Waters RAW files were converted to ABF format using the Reifycs Abf Converter tool. All patient ABF files and pooled samples from either positive or negative controls were loaded into the MS-Dial application [56]. MS-Dial was used for sample alignment and peak detection. Selected mass-to-charge ratio (m/z) peaks, hereafter referred to as m/z features, were manually curated to minimize the effect of sample drift. All m/z features were normalized to the internal standards. M/z feature annotation was performed with MS-Dial and compared to MS/MS spectra in the LipidBlast Library [57]. A total of 1013 m/z features were detected based on their peak mass. M/z features with more than 5% missing values were excluded from the analysis (n = 5), leaving 1008 features. The remaining missing data (5% or less) were imputed by the smallest observed value of that particular feature.
Statistical analysis
All CSF measures (detected m/z features and proteins) were log2-transformed to fit a Gaussian distribution. After autoscaling, each CSF measure had an average and a standard deviation of 0 and 1, respectively. Mann-Whitney U non-parametric tests were performed to compare levels of different variables between CSF profile groups. The sample (n = 60) was divided into the two sets (discovery and validation) using a bootstrap sampling method [58] for the selection of m/z features best distinguishing between CSF AD and non-AD profile groups. A discovery set was created by drawing a random sample of equal size from the original sample (n = 60) with replacement. Approximately 63% of the sample (38 subjects) were selected into the discovery set, and those left out (22 subjects) made up the validation set. The levels of each m/z feature were compared between CSF profile groups in both sets using Mann-Whitney U tests with a significance level of 0.05. This procedure was repeated 1000 times for the purpose of enhancing the robustness of feature selection. The m/z features most frequently significant in both sets (> 20%) were selected for more detailed identification. The cut-off point of 20% was selected based on the distribution of m/z features after 1000 bootstrap replications (Supplementary Figure 2). A cut-off at 20% was considered optimal, as frequencies of significant m/z features started to slowly increase below that point. Pearson’s correlations and linear regression models (both unadjusted and adjusted for gender, age, and years of education) were used for estimation of relationships between continuous measures and final selection of lipids. All statistical analyses were performed using R (version 3.6.1, The R Foundation for Statistical Computing).
RESULTS
Table 1 presents the demographic, pathophysiological, and cognitive characteristics of subjects, both within the whole sample and divided by CSF profile (AD and non-AD). No statistical differences (p > 0.05) were found between CSF profile groups by gender, age, education, CSF protein levels, or MMSE scores. Subjects with a CSF AD profile performed worse on tests assessing verbal episodic memory, both for immediate (RAVLT: p = 0.009; Story: p =0.003) and delayed (RAVLT: p < 0.001; Story: p =0.002) recall.
Table 1
Subject demographics, CSF protein levels and cognitive scores by CSF profile
| CSF profile | All | |||
| Non-AD | AD | |||
| T-tau/ Aβ42≤0.52 | T-tau/ Aβ42 > 0.52 | pa | ||
| n = 26 | n = 34 | n = 60 | ||
| Demographics | ||||
| Gender (M/F) | 16/10 | 16/18 | 0.27 | 32/28 |
| Age, y | 68 (46–85) | 70 (51–84) | 0.19 | 70 (46–85) |
| Education, y | 14 (9–20) | 13 (6–20) | 0.82 | 13 (6–20) |
| Clinical diagnosis | ||||
| SCI/MCI/AD/LBD/PD | 10/13/0/2/1 | 3/10/20/1/0 | N/Ad | 13/23/20/3/1 |
| CSF measuresb | ||||
| Aβ42 (pg/ml) | 770 (374–2332) | 470 (140–977) | N/Ae | 555 (140–2332) |
| T-tau (pg/ml) | 182 (100–722) | 429 (132–1086) | N/Ae | 290 (100–1086) |
| P-tau (pg/ml) | 45 (24–77) | 84 (30–144) | N/Ae | 58 (24–144) |
| NFL (ng/ml) | 2.0 (0.9–6.5) | 2.5 (1.2–5.3) | 0.052 | 2.2 (0.9–6.5) |
| YKL-40 (ng/ml) | 165 (83–399) | 189 (124–367) | 0.35 | 183 (83–399) |
| S100B (pg/ml) | 215 (132–335) | 240 (129–509) | 0.06 | 228 (129–509) |
| GFAP (ng/ml) | 1.1 (0.1–7.1) | 1.3 (0.5–21.3) | 0.11 | 1.3 (0.1–21.3) |
| Global cognition | ||||
| MMSE, score | 28 (24–30) | 28 (24–30) | 0.87 | 28 (24–30) |
| Verbal episodic memory | ||||
| RAVLT immediate recall, scorec | 34.5 (23–66) | 27 (13–58) | 0.009 | 30 (13–66) |
| RAVLT delayed recall, scorec | 4.5 (0–15) | 1 (0–12) | < 0.001 | 3 (0–15) |
| Story –immediate recall, score | 13.5 (5–17) | 8 (1–21) | 0.003 | 10 (1–21) |
| Story –delayed recall, score | 11.5 (1–19) | 6 (0–19) | 0.002 | 7 (0–19) |
AD, Alzheimer’s disease; CSF, Cerebrospinal fluid; LBD, Lewy body dementia; MCI, mild cognitive impairment; MMSE, Mini-Mental State Examination; N/A, Not applicable; PD, Parkinson‘s disease; RAVLT, Rey Auditory Verbal Learning Test; SCI, subjective cognitive impairment. Values are shown as median (range) or as numbers per group. aMann-Whitney U non-parametric test used for continuous variables and Chi-Square test for the categorical variable (gender). bRaw values (neither log2-transformed nor autoscaled). cAnalysis based on 59 subjects, one missing value. dp-values not applicable for clinical diagnosis due to CSF profiles being part of the diagnostic criteria for AD. ep-values not applicable for Aβ42 and tau due to their values used for defining CSF profiles.
In order to relate changes in lipid species levels to typical AD pathology and related measures, we performed a lipidomic analysis of CSF from patients described in Table 1. The selection of the m/z features best distinguishing between CSF profile groups was done using Mann-Whitney U non-parametric tests. Of the 1008 features detected, eight significantly differed in levels between groups within both the discovery and validation sets in more than 200 of the 1000 (20%) bootstrap replicates (Fig. 2) and were selected for further identification. Eight m/z features reached significance in 10–20% of the replicates, 23 in 2–10% of the replicates and 969 in less than 2% of the replicates. The distribution of all m/z features after 1000 boostrap replications is depicted in Supplementary Figure 2.
Fig. 2
Frequencies of m/z features significantly distinguishing between CSF profiles (AD and non-AD) in both discovery and validation sets (p < 0.05) after 1000 bootstrap replications. A total of eight features with frequencies higher than 200 (20%) were selected for more detailed identification.
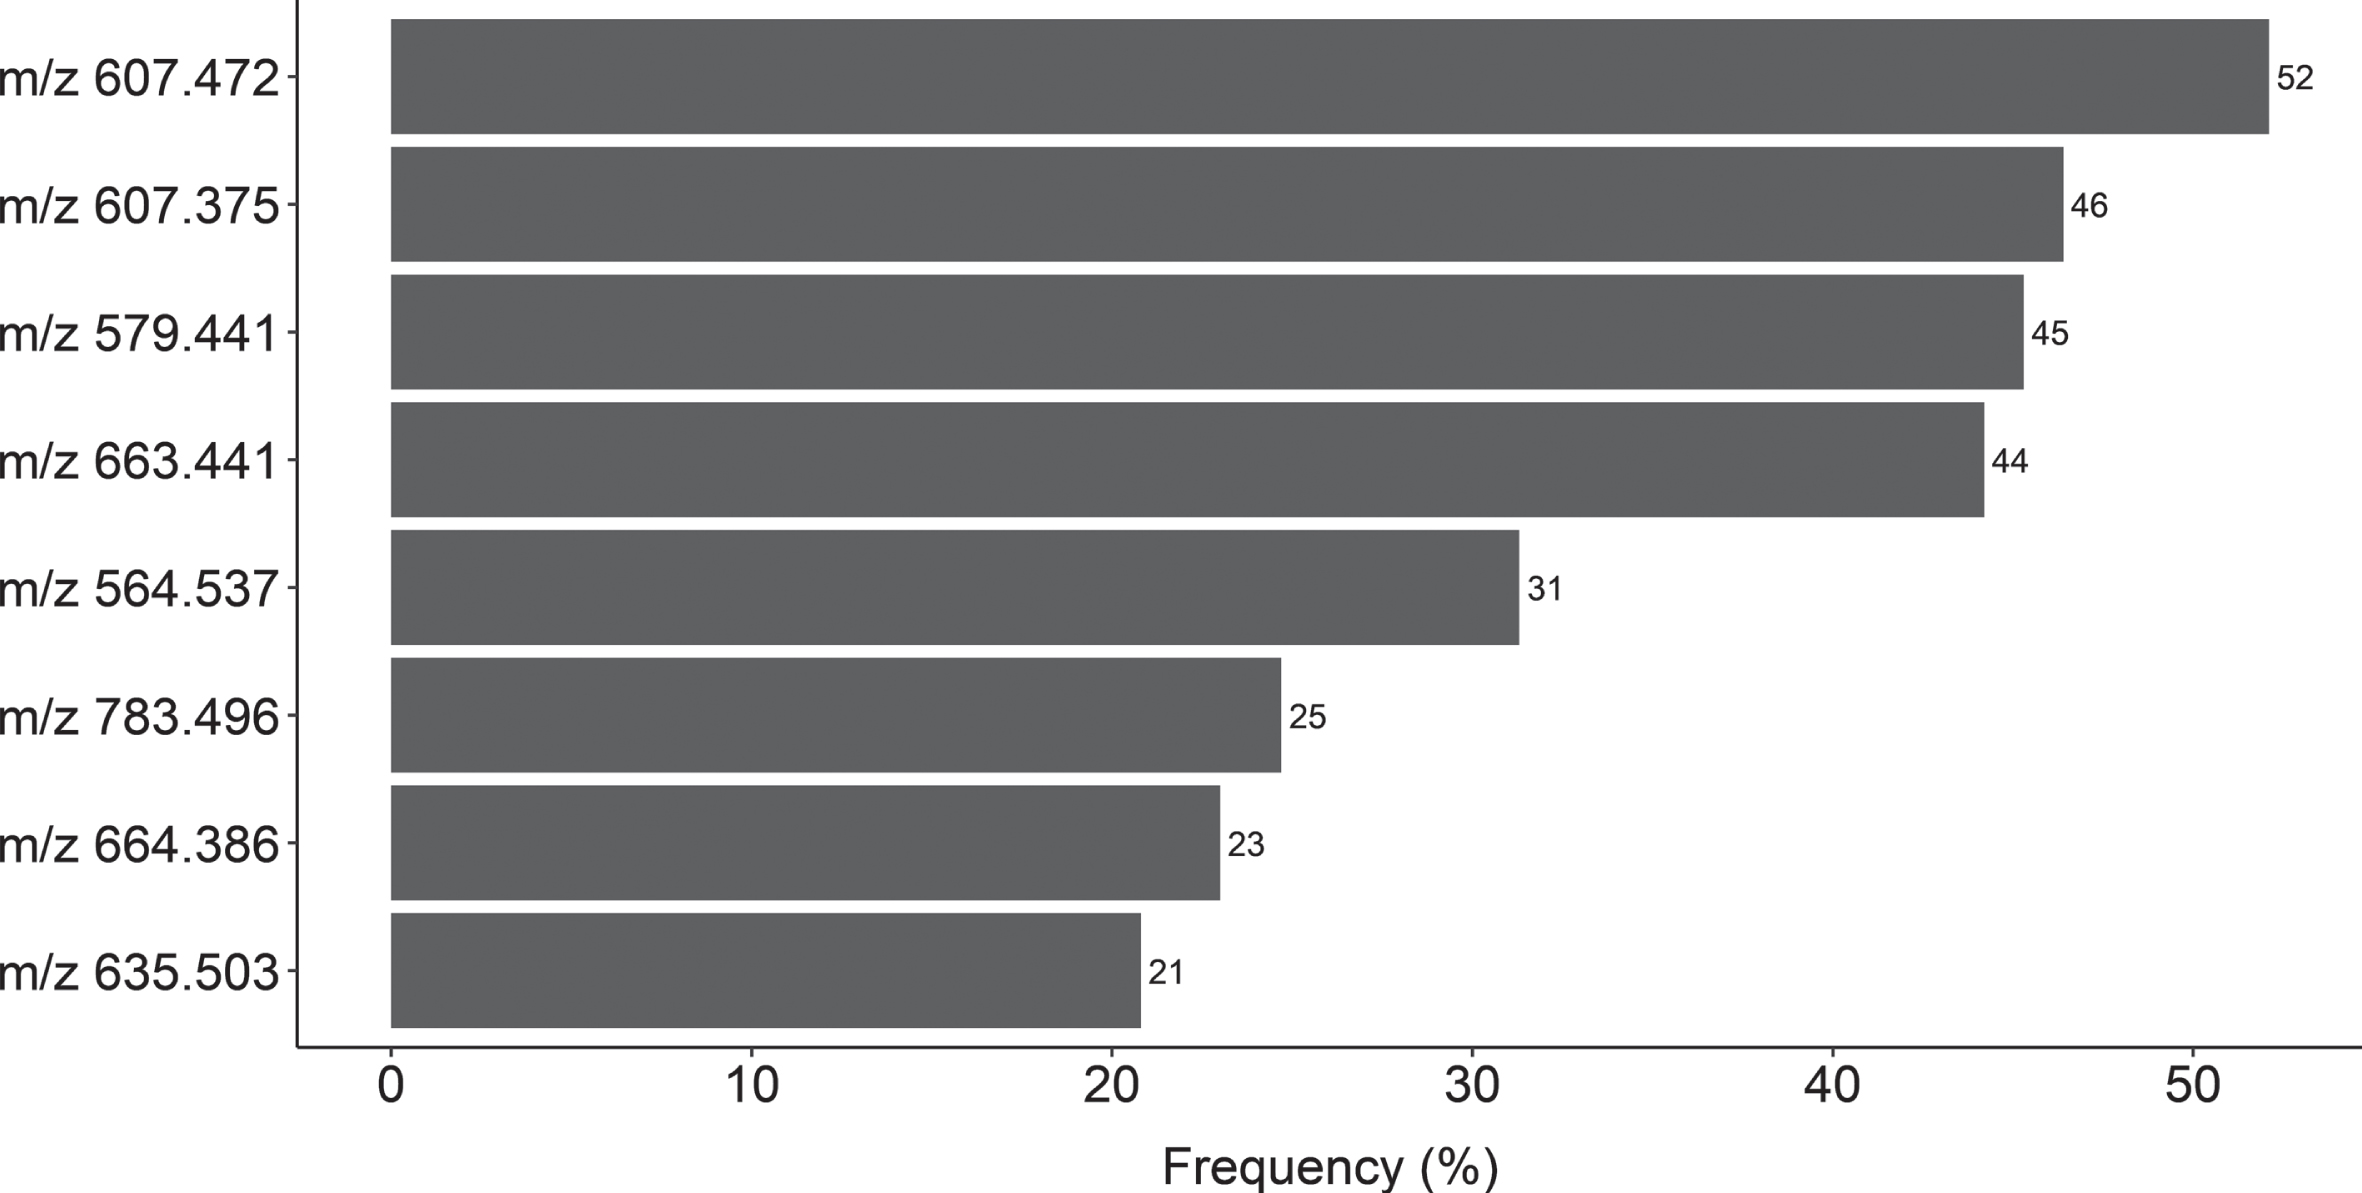
Table 2 presents the lipid species annotations that were automatically assigned to the eight selected m/z features using the LipidBlast spectral library. It also includes comparisons in levels of each feature between CSF profiles. Annotations of compounds searching the library are based on similarity matching of elements, including m/z peaks and retention time (RT). The lipid species selected belonged to four different lipid categories; glycerophospholipids (PE 16:23/16:4, PMeOH 20:3/22:6), sphingolipids (ceramide d18:1/18:0), branched fatty acid esters of hydroxy fatty acids (FAHFA 18:5/22:2, 18:4/20:3 and 20:3/22:4), and monogalactosyldiacylglycerol (MGDG 10:0/10:0). Of the eight lipid species annotated via LipidBlast library search, a reference standard was only run for C18 ceramide (d18:1/18:0). A comparison of the MS/MS fragmentation spectra of the C18 ceramide standard confirmed the annotation of C18 ceramide in the CSF samples (Supplementary Figure 3). The other seven annotated lipid species remain unconfirmed, as a comparison of each MS/MS fragmentation spectra to the LipidBlast reference spectra did not clearly confirm the correct chemical structure. All measured m/z features are listed in Supplementary Table 1A (positive ionization mode) and 1B (negative ionization mode).
Table 2
LipidBlast annotations of the eight selected m/z features. Levels for each feature compared between CSF AD and non-AD profile groups
| Feature /peak (m/z) | Average RT (min) | Ionization mode | Annotated lipid species | Proposed structure | CSF profilea | pb | |
| Non-AD | AD | ||||||
| 607.472 | 7.74 | (-) | FAHFA 40:7 | FAHFA (18:5/22:2) | –0.50 | 0.25 | < 0.001 |
| 607.375 | 6.00 | (-) | MGDG 20:0 | MGDG (10:0/10:0) | –0.54 | –0.05 | < 0.001 |
| 579.441 | 7.24 | (-) | FAHFA 38:7 | FAHFA (18:4/20:3) | –0.42 | 0.27 | < 0.001 |
| 663.441 | 6.15 | (-) | MGDG 24:0 | MGDG (10:0/14:0) | –0.28 | 0.38 | < 0.001 |
| 564.537 | 7.50 | (-) | Cer 36:1 | C18 Cer (d18:1/18:0) | –0.48 | 0.31 | 0.002 |
| 783.496 | 6.65 | (-) | PMeOH 42:9 | PMeOH (20:3/22:6) | –0.36 | 0.29 | 0.003 |
| 664.386 | 6.21 | (-) | PE 32:6e | PE (16:23/16:4) | –0.10 | 0.36 | 0.003 |
| 635.503 | 8.07 | (-) | FAHFA 42:7 | FAHFA (20:3/22:4) | –0.56 | –0.11 | 0.005 |
m/z, mass-to-charge ratio; RT, retention time; Cer, ceramide; FAHFA, fatty acid ester of hydroxyl fatty acid; MGDG, monogalactosyldiacyl-glycerol; PE, phosphatidylethanolamines; PMeOH, phosphatidyl methanol. aBased on normalized peak area arbitrary units (A.U.), log2-transformed and autoscaled before analysis. bMann-Whitney U non-parametric test used.
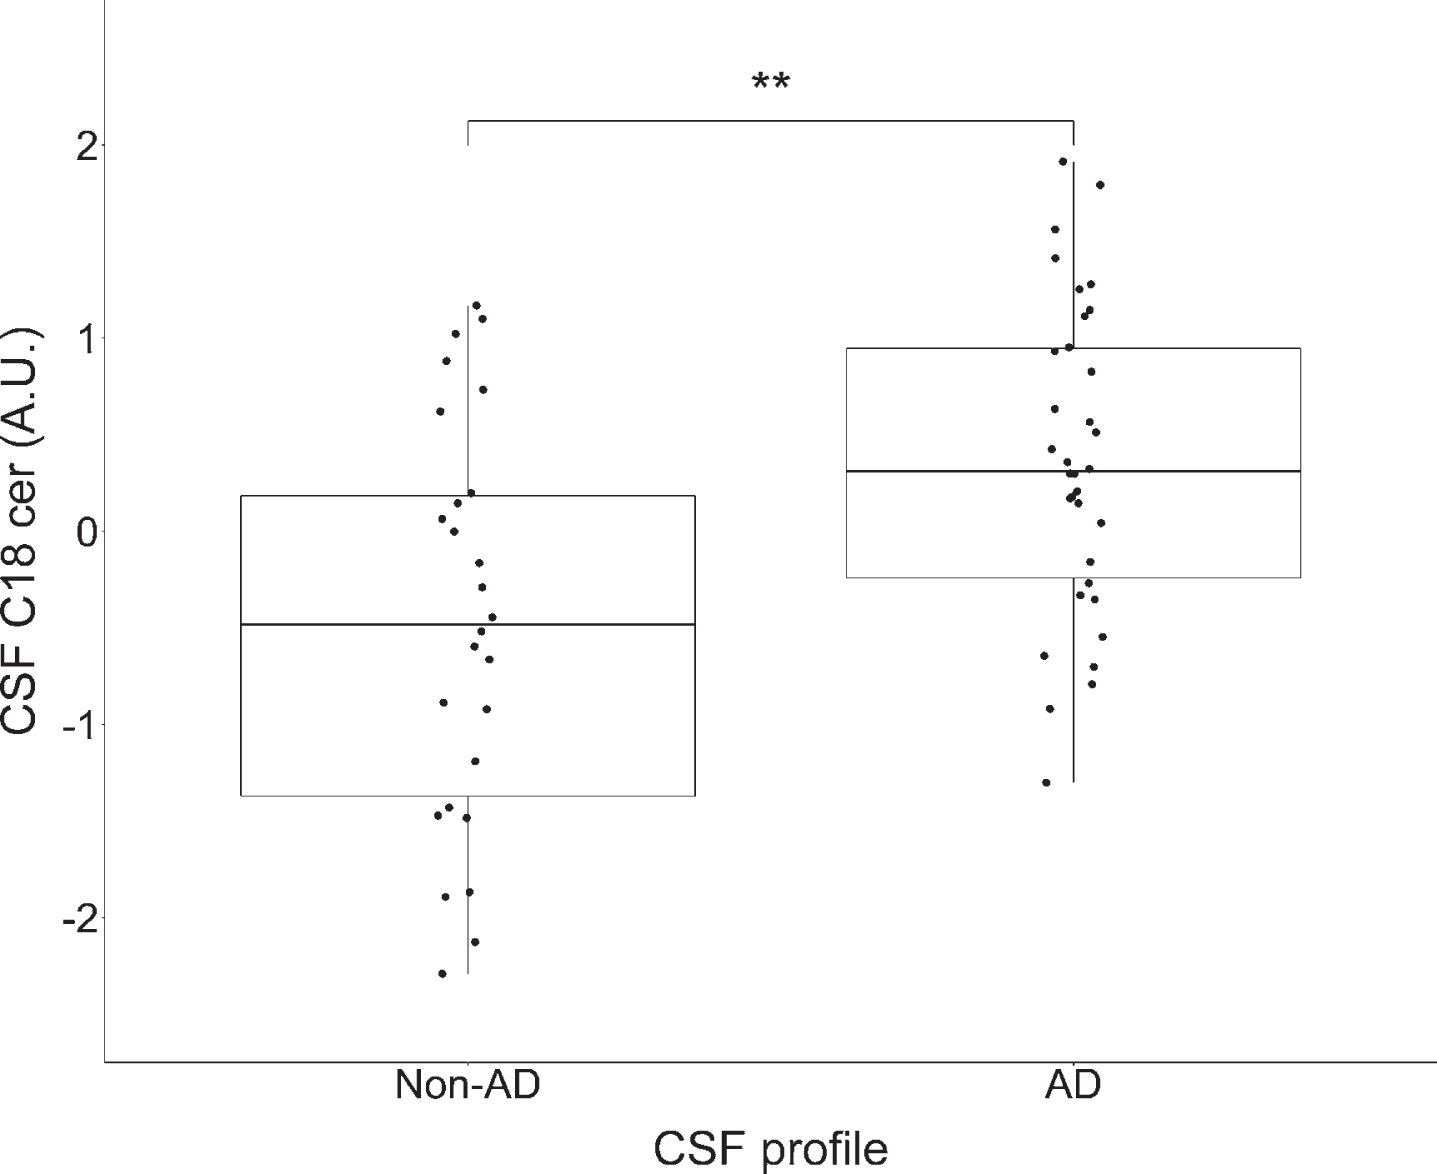
As the structure for C18 ceramide was confir-med with high confidence, it was selected for fur-ther analysis. Figure 3 presents the levels of CSF C18 ceramide by different CSF profiles. As can be observed, levels of C18 ceramide were elevated in the CSF AD profile group compared to the non-AD group (p = 0.002).
Fig. 3
Comparison in levels of CSF C18 ceramide by CSF profile (non-AD and AD). *p < 0.05, **p < 0.01, ***p < 0.001 significance according to Mann-Whitney U non-parametric test. Based on normalized peak area arbitrary units (A.U.), log2-transformed and autoscaled before analysis. The lower and upper horizontal lines of the boxplot correspond to the 25th and the 75th centiles and the middle line to the median. Levels of CSF C18 ceramide were significantly higher (p = 0.002) among participants with a CSF AD profile compared to those without.
Linear regression (unadjusted and adjusted for gender, age, and education) was performed to estimate the relationships of established AD (Aβ42, T-tau, P-tau), inflammatory (YKL-40, S100B, GFAP) and neuronal degeneration (NFL) markers with CSF C18 ceramide (Table 3). Levels of Aβ42 were negatively associated with C18 ceramide when adjusted for age, gender, and education (st. β= –0.36, p = 0.007). T-tau (st. β= 0.41, p = 0.005) and S100B (st. β= 0.51, p = 0.001) positively associated with C18 ceramide when adjusted for the same covariates. Statistically significant, albeit weaker, associations were detected between the same measures when linear regression was not adjusted for demographic variables. Levels of other CSF proteins (NFL, YKL-40, GFAP) and test scores presenting verbal episodic memory (RAVLT, Story) did not significantly associate with levels of C18 ceramide. One subject did not take the RAVLT test, and therefore the analyses involving RAVLT immediate and delayed recall were only based on 59 subjects. This did not skew comparisons between RAVLT and other regression estimates, as results in Table 3 did not change when calculated again without that subject.
Table 3
Linear regression estimates (unadjusted and adjusted) for the association between various measures and levels of CSF C18 ceramide
| CSF C18 ceramide (A.U.)a | ||||||
| Unadjusted model | Adjusted model* | |||||
| St. β | p | St. β | p | |||
| Demographics | ||||||
| Age, y | –0.02 | 0.902 | –0.05 | 0.765 | ||
| Education, y | –0.05 | 0.688 | –0.07 | 0.596 | ||
| CSF proteinsa | ||||||
| Aβ42 (pg/ml) | –0.35 | 0.006 | –0.36 | 0.007 | ||
| T-tau (pg/ml) | 0.30 | 0.018 | 0.41 | 0.005 | ||
| P-tau (pg/ml) | 0.17 | 0.188 | 0.21 | 0.129 | ||
| T-tau/Aβ42 | 0.44 | < 0.001 | 0.52 | < 0.001 | ||
| NFL (ng/ml) | 0.03 | 0.835 | 0.05 | 0.782 | ||
| YKL-40 (ng/ml) | 0.11 | 0.411 | 0.25 | 0.194 | ||
| S100B (pg/ml) | 0.37 | 0.004 | 0.51 | 0.001 | ||
| GFAP (ng/ml) | 0.22 | 0.087 | 0.26 | 0.087 | ||
| Verbal episodic memory | ||||||
| RAVLT immediate recall, scoreb | –0.02 | 0.893 | –0.01 | 0.928 | ||
| RAVLT delayed recall, scoreb | –0.18 | 0.339 | –0.29 | 0.095 | ||
| Story immediate recall, score | –0.13 | 0.356 | –0.14 | 0.345 | ||
| Story delayed recall, score | –0.13 | 0.305 | –0.15 | 0.335 | ||
A.U., arbitrary units; RAVLT, Rey Auditory Verbal Learning Test. Numbers present standardized beta coefficients (st.β). *Adjusted for age, gender, and years of education. aValues log2-transformed and autoscaled before analysis. bAnalysis based on 59 subjects, with one missing.
The statistically significant relationships between the levels of proteins and C18 ceramide from (p < 0.05) Table 3 are depicted in Fig. 4. The associations were estimated with Pearson’s coefficients, which are equal to the unadjusted standardized beta coefficients (st. β) in Table 3. Pearson’s coefficients were also calculated for the CSF markers within each CSF profile group (Table 4), but none reached statistical significance (p > 0.05).
Fig. 4
Pearson’s correlations between CSF levels of a) Aβ42, b) T-tau, c) T-tau/ Aβ42, d) S100B and CSF C18 ceramide. Normalized peak area arbitrary units (A.U.). All CSF measures were log2-transformed and autoscaled before analysis. C18 ceramide levels significantly correlated with levels of the core AD markers Aβ42, T-tau, and inflammatory marker S100B.
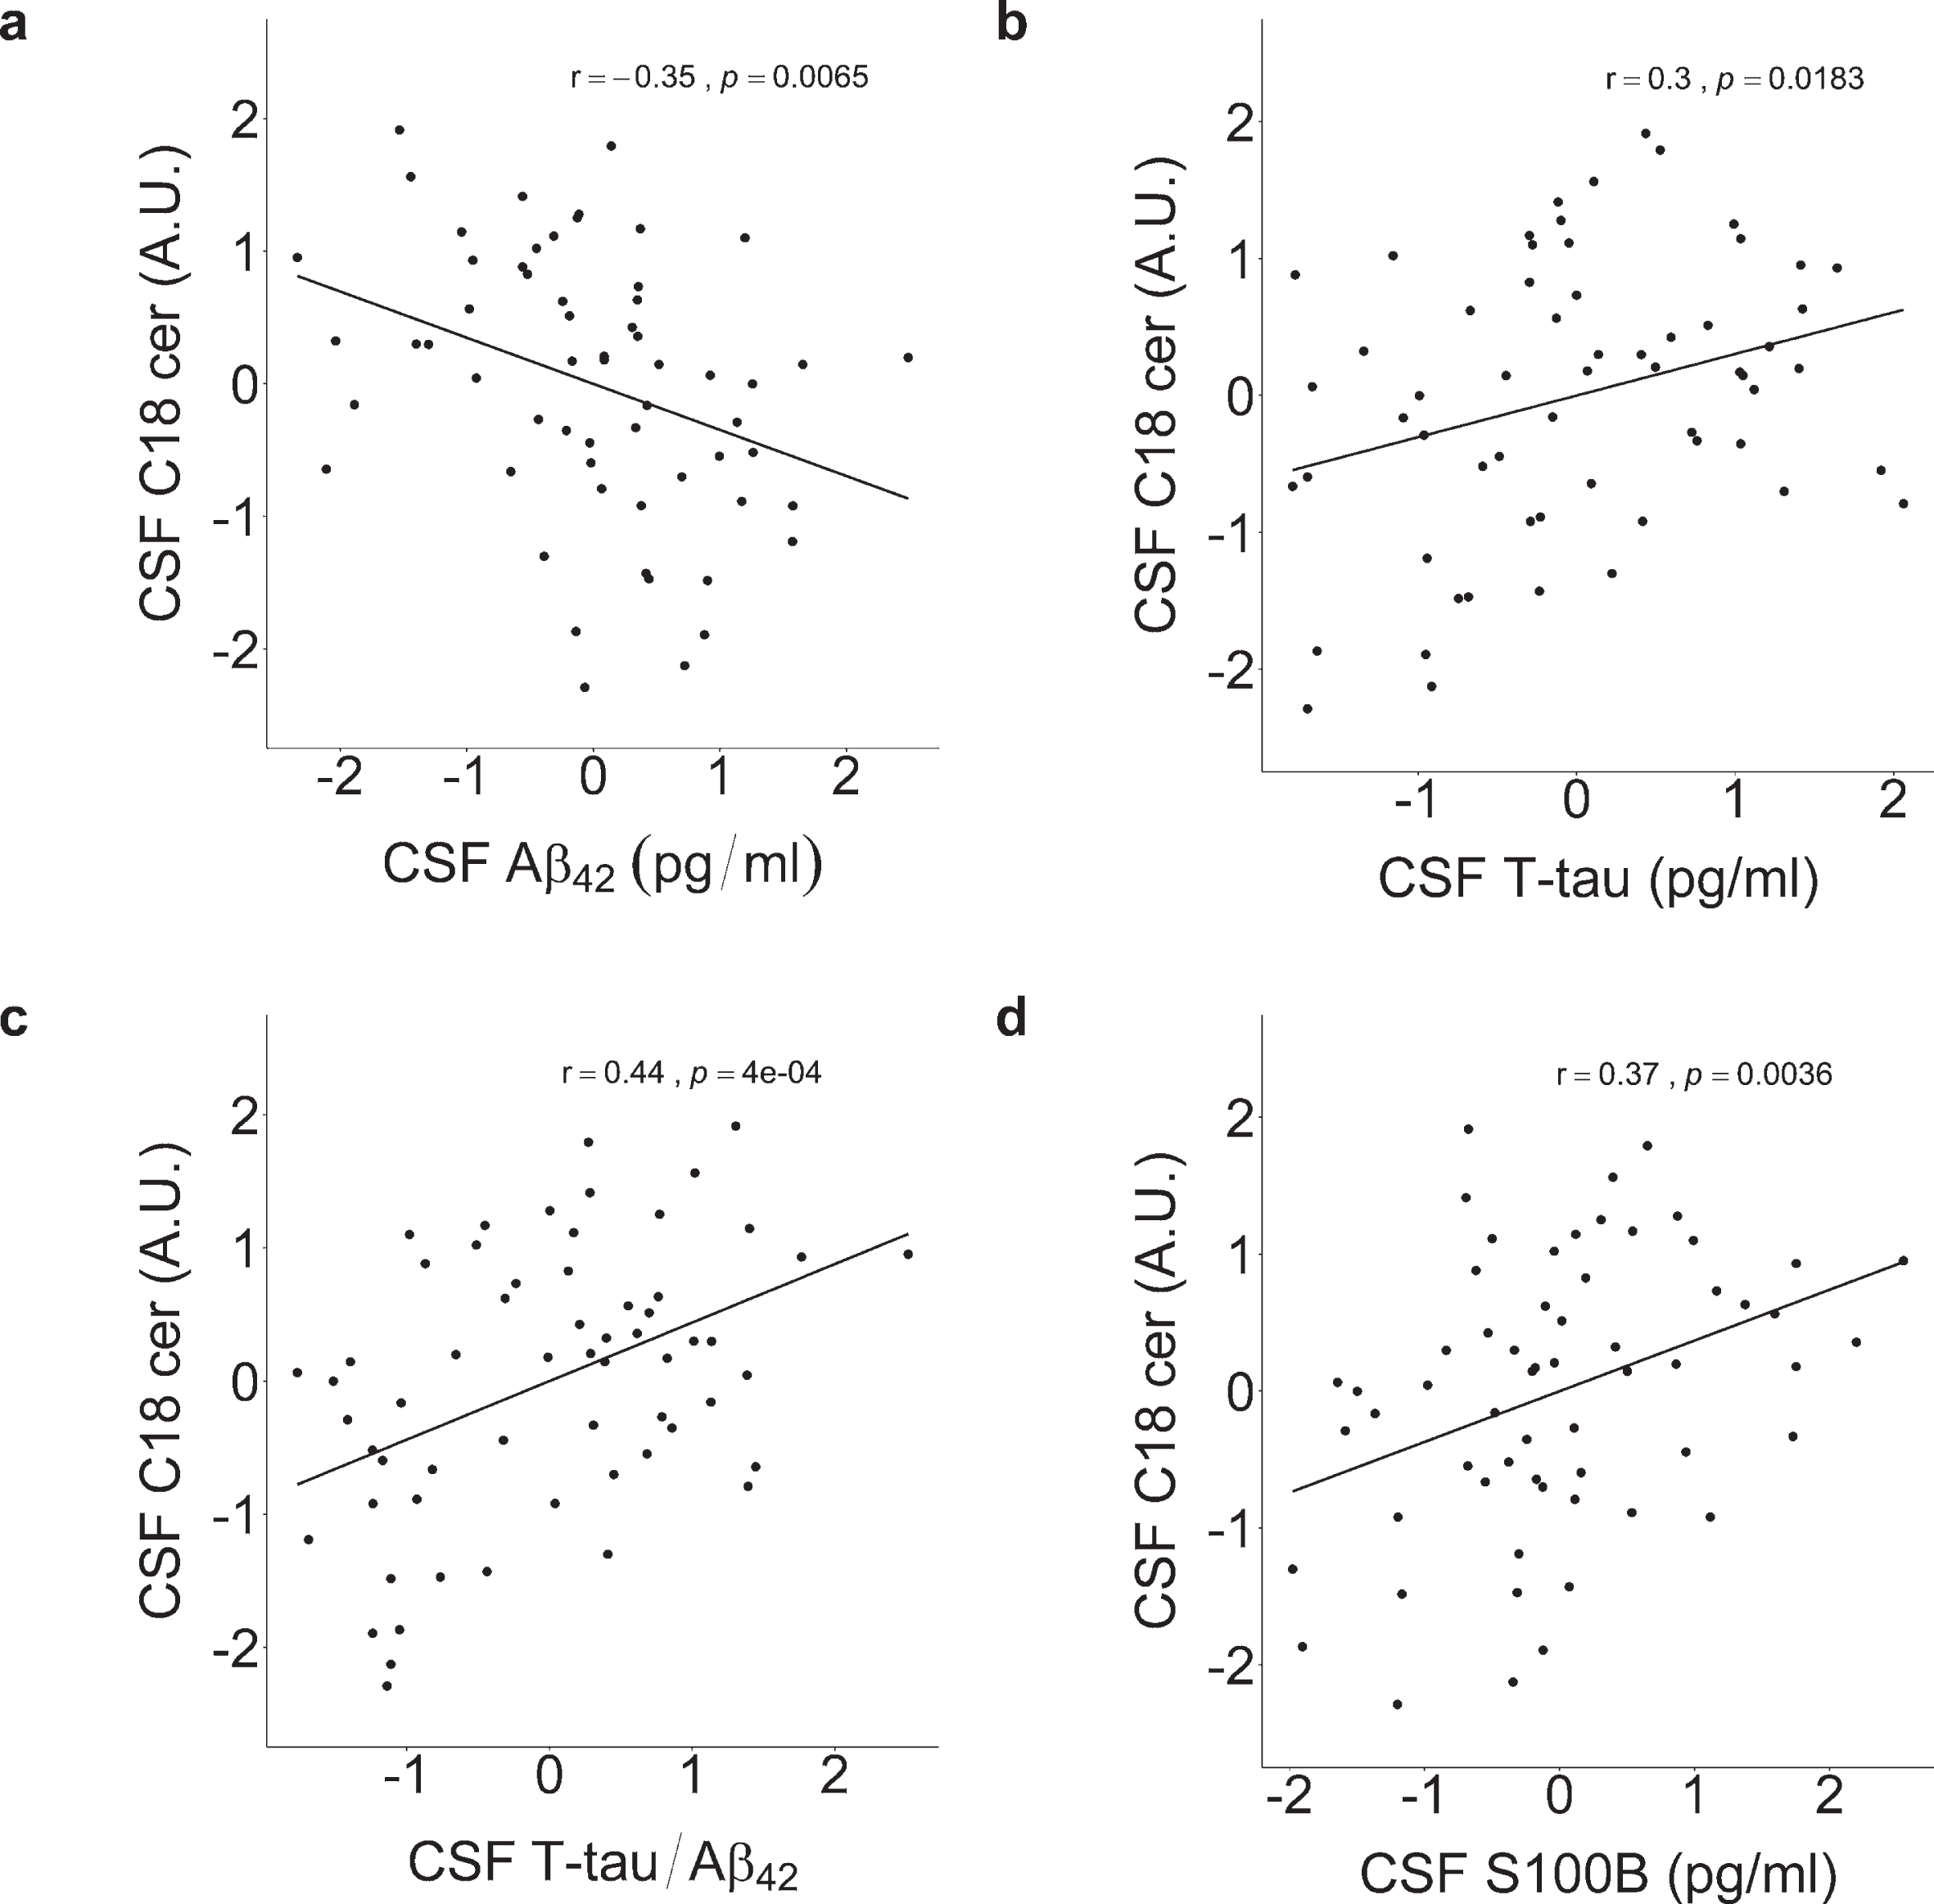
Table 4
Pearson‘s correlations between selected CSF markers and levels of CSF C18 ceramide within CSF profiles
| CSF C18 ceramide (A.U.)a | ||||
| CSF non-AD profile n = 26 | CSF AD profile n = 34 | |||
| r | p | r | p | |
| CSF proteinsa | ||||
| Aβ42 (pg/ml) | –0.04 | 0.86 | –0.25 | 0.15 |
| T-tau (pg/ml) | 0.23 | 0.25 | –0.20 | 0.25 |
| P-tau (pg/ml) | –0.20 | 0.34 | –0.13 | 0.47 |
| T-tau/Aβ42 | 0.32 | 0.11 | 0.08 | 0.67 |
| NFL (ng/ml) | –0.09 | 0.68 | –0.07 | 0.70 |
| YKL-40 (ng/ml) | 0.08 | 0.70 | 0.02 | 0.90 |
| S100B (pg/ml) | 0.39 | 0.052 | 0.21 | 0.24 |
| GFAP (ng/ml) | 0.16 | 0.43 | 0.17 | 0.34 |
A.U., arbitrary units. aValues log2-transformed and autoscaled before analysis.
DISCUSSION
We used an untargeted lipidomic approach to identify CSF lipid species associated with a signature CSF profile reflecting AD pathology. A total of 1008 m/z features were detected, with eight selected as candidate markers. Out of these, one was fully confirmed as corresponding to the lipid species C18 ceramide. Our results showed that C18 ceramide levels were higher among subjects with a CSF AD profile. Relationships were also detected between established AD markers (Aβ42, T-tau) and C18 ceramide. Higher levels of C18 ceramide associated with lower levels of Aβ42 and higher levels of T-tau. In addition, levels of the inflammatory marker S100B positively related to C18 ceramide. Overall, our results indicate that CSF C18 ceramide levels could increase during pathological changes in the early stages of AD.
Ceramides, the core constituents of sphingolipid metabolism, are composed of a sphingosine backbone linked to a fatty acid chain of varying carbon atom length (C14-C26) [59]. Alterations in sphingolipid metabolism have been observed in healthy aging and in neurodegenerative diseases, including AD [60]. They play essential roles in the structural stability of membranes and as signaling molecules affect differentiation, proliferation, inflammation, and apoptosis [61, 62]. Ceramides are synthesized via two main pathways in eukaryotic cells [63]. In the salvage pathway, sphingomyelin is hydrolyzed through sphingomyelinase (SMase) to produce ceramide, which can be further metabolized to sphingosine by ceramidase. Ceramides can also be generated through the de novo pathway via anabolism of serine and palmitate. Results from cellular and animal studies suggest that both direct and indirect mechanisms by which ceramides can contribute to an increase in Aβ levels and AD pathogenesis [64]. Ceramides stimulate Aβ generation by stabilizing β-secretase enzyme BACE1 and increasing its half-life [65, 66]. Furthermore, soluble and fibrillar forms of Aβ can induce degradation of SM to ceramide by SMases [67, 68] through oxidative stress-mediated mechanisms [69]. This positive loop of ceramide production possibly contributes to immune activation and neuronal loss in AD. Long-chain ceramides, specifically C18 ceramide, have also been linked to tau phosphorylation through modulation of PP2A activity [70–74]. Several postmortem studies have found increased levels of ceramide in brain tissues of AD patients compared to healthy controls [60, 69, 75–77]. Two of the studies [60, 76] examined different ceramide species, with long-chain ceramide levels (C18 and C24) being significantly elevated in the AD group. Han et al. [75] observed the highest elevation of total ceramide in the brains of patients with mild AD, compared to those with severe AD and to controls, indicating early changes in the pathological processes of AD. To further confirm the implications of ceramide metabolism in AD, upregulation [78] and increase in activity of enzymes [77] controlling ceramide synthesis have been observed in brain areas (temporal and frontal cortices) affected in the early stages of the disease.
While postmortem studies are essential, in vivo studies are the only way to ascertain the role of lipids in early AD pathogenesis and whether these lipids may be indicators or predictors of disease progression. The most informative medium for studying lipid changes in the brain is the CSF, since it is in direct contact with the brain interstitial fluid. Very few CSF studies have been published comparing ceramide levels in AD patients to other groups. Fonteh et al. [79] found slightly higher, albeit not significant, levels of ceramide in AD compared to MCI and control groups in supernatant fluid of CSF. In another study [80], patients with AD had significantly higher levels compared to controls with other neurological conditions. A study by Mielke et al. [81], examined the relationship between different ceramide species in relation to Aβ and tau levels in CSF. A positive correlation was found between C18 ceramide and all Aβ species except Aβ 42 as well as tau levels in a cohort of cognitively healthy individuals aged 36–69 years (n = 91) with a parental history of AD. In contrast with cellular studies, no significant correlation was found between the lipid species and P-tau. The same study also found a negative association between the longer carbon chain species (C20, C22, and C26) and performance on cognitive tests reflecting verbal episodic memory (delayed recall) or working memory. Our results expand upon the findings from this study. The results we present show a significant positive relationship between levels of C18 ceramide and T-tau, but not with P-tau, among the cohort of patients at risk of or at the early stages of dementia. Association between C18 ceramide and verbal epi-sodic memory (immediate or delayed recall) was also not detected. No significant relationship was found with NFL levels, which is interesting considering it is a marker for neurodegeneration and white matter changes, and SM, a precursor of ceramide, is enriched in the myelin sheath of neurons. A possible explanation is CSF C18 ceramide being a marker of apoptosis, rather than degradation of myelinated axons. Evidence supports the role of ceramides in neuronal apoptosis, initiating a cascade of biochemical alterations leading ultimately to neuronal death [64]. In contrast with the study by Mielke et al. [81], we showed higher levels of C18 ceramide associating with lower levels of Aβ 42, one of the primary toxic species of amyloid [82]. A possible reason could be that all subjects in our study were already at the symptomatic pre- or early stages of dementia, and it is not unlikely that the relationship between the analytes strengthens during the progression of AD. Our study also found a positive association between levels of C18 ceramide and inflammatory marker S100B, but not YKL-40 and GFAP. Our hypothesis is that the relationship could be due to higher concentrations of ceramides and S100B, as both have been associated with the induction of neuronal apoptosis [26, 64]. In high doses, extracellular S100B has been shown to cause neuronal death by activation of the receptor for advanced glycation end products (RAGE). The protein can, by excessive stimulation of RAGE expressed in neurons, hyperactivate the Ras/MEK/ERK pathway, which consequently leads to apoptosis [83, 84]. S100B can also, indirectly, lead to neuronal death through the release of nitric oxide by astrocytes and microglia via RAGE-dependent activation [85, 86].
There are several limitations to our study. First, our sample size was relatively small, with a vast number of features compared to the number of subjects, resulting in little power and a considerable risk of type-II errors. Corrections for multiple comparisons were, therefore, not performed when comparing levels of features between groups in the discovery set. A more significant validation set would also have allowed for evaluation of accuracy in distinguishing between CSF profile groups using multiple lipid species simultaneously as predictors. Second, our study did not include a healthy control group or patients with moderate to severe AD. It also included very few participants with other dementias. It would be of interest to examine the relationships between ceramides and AD-related markers in CSF in a more diverse cohort, for a better evaluation of C18 ceramide as a marker of AD progression and severity, preferably in a longitudinal study. Third, information about the APOE genotype of subjects was not available, and therefore, its potential effect on results could not be adjusted for [87].
In summary, our results indicate that CSF C18 ceramide levels associate with established markers of AD pathology (Aβ42 and T-tau) and inflammation (S100B) at the symptomatic pre- and early stages of dementia. These findings suggest that ceramide metabolism could influence the pathophysiological processes during the early stages of AD. Furthermore, ceramides could potentially serve as therapeutic targets, with strategies aiming at reducing ceramide levels to slow down the progression of the disease. Longitudinal studies are, however, needed to validate the pathological implications of these results.
ACKNOWLEDGMENTS
This study was supported by the St. Josef's Hospital Fund, Reykjavik, Iceland, the Landspitali University Hospital Research Fund and the Icelandic Research Fund of the Icelandic Centre for Research (163172-051). The authors thank all the subjects of The Icelandic MCI study for their participation. They also wish to thank Kristin H. Hannesdottir for managing participant administration and the staff of the LUH Memory Clinic.
Authors’ disclosures available online (https://www.j-alz.com/manuscript-disclosures/20-0964r2).
SUPPLEMENTARY MATERIAL
[1] The supplementary material is available in the electronic version of this article: https://dx.doi.org/10.3233/JAD-200964.
REFERENCES
[1] | Jack CR Jr. , Bennett DA , Blennow K , Carrillo MC , Dunn B , Haeberlein SB , Holtzman DM , Jagust W , Jessen F , Karlawish J , Liu E , Molinuevo JL , Montine T , Phelps C , Rankin KP , Rowe CC , Scheltens P , Siemers E , Snyder HM , Sperling R ((2018) ) NIA-AA Research Framework: Toward a biological definition of Alzheimer’s disease. Alzheimers Dement 14: , 535–562. |
[2] | Glenner GG , Wong CW ((1984) ) Alzheimer’s disease: Initial report of the purification and characterization of a novel cerebrovascular amyloid protein. Biochem Biophys Res Commun 120: , 885–890. |
[3] | Grundke-Iqbal I , Iqbal K , Tung YC , Quinlan M , Wisniewski HM , Binder LI ((1986) ) Abnormal phosphorylation of the microtubule-associated protein tau (tau) in Alzheimer cytoskeletal pathology. Proc Natl Acad Sci U S A 83: , 4913–4917. |
[4] | Selkoe DJ , Hardy J ((2016) ) The amyloid hypothesis of Alzheimer’s disease at 25 years. EMBO Mol Med 8: , 595–608. |
[5] | Chen XQ , Mobley WC ((2019) ) Alzheimer disease pathogenesis: Insights from molecular and cellular biology studies of oligomeric Abeta and tau species. Front Neurosci 13: , 659. |
[6] | Perrin RJ , Fagan AM , Holtzman DM ((2009) ) Multimodal techniques for diagnosis and prognosis of Alzheimer’s disease. Nature 461: , 916–922. |
[7] | Zhou B , Teramukai S , Yoshimura K , Fukushima M ((2009) ) Validity of cerebrospinal fluid biomarkers as endpoints in early-phase clinical trials for Alzheimer’s disease. J Alzheimers Dis 18: , 89–102. |
[8] | Jack CR Jr. , Knopman DS , Jagust WJ , Shaw LM , Aisen PS , Weiner MW , Petersen RC , Trojanowski JQ ((2010) ) Hypothetical model of dynamic biomarkers of the Alzheimer’s pathological cascade. Lancet Neurol 9: , 119–128. |
[9] | Lewczuk P , Riederer P , O’Bryant SE , Verbeek MM , Dubois B , Visser PJ , Jellinger KA , Engelborghs S , Ramirez A , Parnetti L , Jack CR Jr. , Teunissen CE , Hampel H , Lleó A , Jessen F , Glodzik L , de Leon MJ , Fagan AM , Molinuevo JL , Jansen WJ , Winblad B , Shaw LM , Andreasson U , Otto M , Mollenhauer B , Wiltfang J , Turner MR , Zerr I , Handels R , Thompson AG , Johansson G , Ermann N , Trojanowski JQ , Karaca I , Wagner H , Oeckl P , van Waalwijk van Doorn L , Bjerke M , Kapogiannis D , Kuiperij HB , Farotti L , Li Y , Gordon BA , Epelbaum S , Vos SJB , Klijn CJM , Van Nostrand WE , Minguillon C , Schmitz M , Gallo C , Lopez Mato A , Thibaut F , Lista S , Alcolea D , Zetterberg H , Blennow K , Kornhuber J ; Members of the WFSBP Task Force Working on this Topic: Peter Riederer, Carla Gallo, Dimitrios Kapogiannis, Andrea Lopez Mato, Florence Thibaut ((2018) ) Cerebrospinal fluid and blood biomarkers for neurodegenerative dementias: An update of the Consensus of the Task Force on Biological Markers in Psychiatry of the World Federation of Societies of Biological Psychiatry. World J Biol Psychiatry 19: , 244–328. |
[10] | Jones L , Holmans PA , Hamshere ML , Harold D , Moskvina V , Ivanov D , Pocklington A , Abraham R , Hollingworth P , Sims R , Gerrish A , Pahwa JS , Jones N , Stretton A , Morgan AR , Lovestone S , Powell J , Proitsi P , Lupton MK , Brayne C , Rubinsztein DC , Gill M , Lawlor B , Lynch A , Morgan K , Brown KS , Passmore PA , Craig D , McGuinness B , Todd S , Holmes C , Mann D , Smith AD , Love S , Kehoe PG , Mead S , Fox N , Rossor M , Collinge J , Maier W , Jessen F , Schurmann B , Heun R , Kolsch H , van den Bussche H , Heuser I , Peters O , Kornhuber J , Wiltfang J , Dichgans M , Frolich L , Hampel H , Hull M , Rujescu D , Goate AM , Kauwe JS , Cruchaga C , Nowotny P , Morris JC , Mayo K , Livingston G , Bass NJ , Gurling H , McQuillin A , Gwilliam R , Deloukas P , Al-Chalabi A , Shaw CE , Singleton AB , Guerreiro R , Muhleisen TW , Nothen MM , Moebus S , Jockel KH , Klopp N , Wichmann HE , Ruther E , Carrasquillo MM , Pankratz VS , Younkin SG , Hardy J , O’Donovan MC , Owen MJ , Williams J ((2010) ) Genetic evidence implicates the immune system and cholesterol metabolism in the aetiology of Alzheimer’s disease. PLoS One 5: , e13950. |
[11] | Matarin M , Salih DA , Yasvoina M , Cummings DM , Guelfi S , Liu W , Nahaboo Solim MA , Moens TG , Paublete RM , Ali SS , Perona M , Desai R , Smith KJ , Latcham J , Fulleylove M , Richardson JC , Hardy J , Edwards FA ((2015) ) A genome-wide gene-expression analysis and database in transgenic mice during development of amyloid or tau pathology. Cell Rep 10: , 633–644. |
[12] | van Meer G , Voelker DR , Feigenson GW ((2008) ) Membrane lipids: Where they are and how they behave. Nat Rev Mol Cell Biol 9: , 112–124. |
[13] | Shevchenko A , Simons K ((2010) ) Lipidomics: Coming to grips with lipid diversity. Nat Rev Mol Cell Biol 11: , 593–598. |
[14] | Hussain G , Schmitt F , Loeffler JP , Gonzalez de Aguilar JL ((2013) ) Fatting the brain: A brief of recent research. Front Cell Neurosci 7: , 144. |
[15] | Zarrouk A , Debbabi M , Bezine M , Karym EM , Badreddine A , Rouaud O , Moreau T , Cherkaoui-Malki M , El Ayeb M , Nasser B , Hammami M , Lizard G ((2018) ) Lipid biomarkers in Alzheimer’s disease. Curr Alzheimer Res 15: , 303–312. |
[16] | Walter J , van Echten-Deckert G ((2013) ) Cross-talk of membrane lipids and Alzheimer-related proteins. Mol Neurodegener 8: , 34. |
[17] | Hartmann T , Kuchenbecker J , Grimm MO ((2007) ) Alzhei-mer’s disease: The lipid connection. J Neurochem 103: Suppl 1, 159–170. |
[18] | Ardura-Fabregat A , Boddeke E , Boza-Serrano A , Brioschi S , Castro-Gomez S , Ceyzeriat K , Dansokho C , Dierkes T , Gelders G , Heneka MT , Hoeijmakers L , Hoffmann A , Iaccarino L , Jahnert S , Kuhbandner K , Landreth G , Lonnemann N , Loschmann PA , McManus RM , Paulus A , Reemst K , Sanchez-Caro JM , Tiberi A , Van der Perren A , Vautheny A , Venegas C , Webers A , Weydt P , Wijasa TS , Xiang X , Yang Y ((2017) ) Targeting neuroinflammation to treat Alzheimer’s disease. CNS Drugs 31: , 1057–1082. |
[19] | Calsolaro V , Edison P ((2016) ) Neuroinflammation in Alzheimer’s disease: Current evidence and future directions. Alzheimers Dement 12: , 719–732. |
[20] | Medeiros R , LaFerla FM ((2013) ) Astrocytes: Conductors of the Alzheimer disease neuroinflammatory symphony. Exp Neurol 239: , 133–138. |
[21] | El Khoury JB , Moore KJ , Means TK , Leung J , Terada K , Toft M , Freeman MW , Luster AD ((2003) ) CD36 mediates the innate host response to beta-amyloid. J Exp Med 197: , 1657–1666. |
[22] | Steardo L Jr. , Bronzuoli MR , Iacomino A , Esposito G , Steardo L , Scuderi C ((2015) ) Does neuroinflammation turn on the flame in Alzheimer’s disease? Focus on astrocytes. Front Neurosci 9: , 259. |
[23] | Heppner FL , Ransohoff RM , Becher B ((2015) ) Immune attack: The role of inflammation in Alzheimer disease. Nat Rev Neurosci 16: , 358–372. |
[24] | Carter SF , Herholz K , Rosa-Neto P , Pellerin L , Nordberg A , Zimmer ER ((2019) ) Astrocyte biomarkers in Alzheimer’s disease. Trends Mol Med 25: , 77–95. |
[25] | Bonneh-Barkay D , Bissel SJ , Kofler J , Starkey A , Wang G , Wiley CA ((2012) ) Astrocyte and macrophage regulation of YKL-40 expression and cellular response in neuroinflammation. Brain Pathol 22: , 530–546. |
[26] | Donato R , Sorci G , Riuzzi F , Arcuri C , Bianchi R , Brozzi F , Tubaro C , Giambanco I ((2009) ) S100B’s double life: Intracellular regulator and extracellular signal. Biochim Biophys Acta 1793: , 1008–1022. |
[27] | Yang Z , Wang KK ((2015) ) Glial fibrillary acidic protein: From intermediate filament assembly and gliosis to neurobiomarker. Trends Neurosci 38: , 364–374. |
[28] | Rehli M , Niller HH , Ammon C , Langmann S , Schwarzfischer L , Andreesen R , Krause SW ((2003) ) Transcriptional regulation of CHI3L1, a marker gene for late stages of macrophage differentiation. J Biol Chem 278: , 44058–44067. |
[29] | Alcolea D , Vilaplana E , Pegueroles J , Montal V , Sánchez-Juan P , González-Suárez A , Pozueta A , Rodríguez-Rodríguez E , Bartrés-Faz D , Vidal-Piñeiro D , González-Ortiz S , Medrano S , Carmona-Iragui M , Sánchez-Saudinós M , Sala I , Anton-Aguirre S , Sampedro F , Morenas-Rodríguez E , Clarimón J , Blesa R , Lleó A , Fortea J ((2015) ) Relationship between cortical thickness and cerebrospinal fluid YKL-40 in predementia stages of Alzheimer’s disease. Neurobiol Aging 36: , 2018–2023. |
[30] | Alcolea D , Carmona-Iragui M , Suarez-Calvet M , Sanchez-Saudinos MB , Sala I , Anton-Aguirre S , Blesa R , Clarimon J , Fortea J , Lleo A ((2014) ) Relationship between beta-Secretase, inflammation and core cerebrospinal fluid biomarkers for Alzheimer’s disease. J Alzheimers Dis 42: , 157–167. |
[31] | Antonell A , Mansilla A , Rami L , Llado A , Iranzo A , Olives J , Balasa M , Sanchez-Valle R , Molinuevo JL ((2014) ) Cerebrospinal fluid level of YKL-40 protein in preclinical and prodromal Alzheimer’s disease. J Alzheimers Dis 42: , 901–908. |
[32] | Craig-Schapiro R , Perrin RJ , Roe CM , Xiong C , Carter D , Cairns NJ , Mintun MA , Peskind ER , Li G , Galasko DR , Clark CM , Quinn JF , D’Angelo G , Malone JP , Townsend RR , Morris JC , Fagan AM , Holtzman DM ((2010) ) YKL-40: A novel prognostic fluid biomarker for preclinical Alzheimer’s disease. Biol Psychiatry 68: , 903–912. |
[33] | Melah KE , Lu SY , Hoscheidt SM , Alexander AL , Adluru N , Destiche DJ , Carlsson CM , Zetterberg H , Blennow K , Okonkwo OC , Gleason CE , Dowling NM , Bratzke LC , Rowley HA , Sager MA , Asthana S , Johnson SC , Bendlin BB ((2016) ) Cerebrospinal fluid markers of Alzheimer’s disease pathology and microglial activation are associated with altered white matter microstructure in asymptomatic adults at risk for Alzheimer’s disease. J Alzheimers Dis 50: , 873–886. |
[34] | Querol-Vilaseca M , Colom-Cadena M , Pegueroles J , San Martin-Paniello C , Clarimon J , Belbin O , Fortea J , Lleo A ((2017) ) YKL-40 (Chitinase 3-like I) is expressed in a subset of astrocytes in Alzheimer’s disease and other tauopathies. J Neuroinflammation 14: , 118. |
[35] | Olsson B , Lautner R , Andreasson U , Ohrfelt A , Portelius E , Bjerke M , Holtta M , Rosen C , Olsson C , Strobel G , Wu E , Dakin K , Petzold M , Blennow K , Zetterberg H ((2016) ) CSF and blood biomarkers for the diagnosis of Alzheimer’s disease: A systematic review and meta-analysis. Lancet Neurol 15: , 673–684. |
[36] | Olsson B , Portelius E , Cullen NC , Sandelius A , Zetterberg H , Andreasson U , Hoglund K , Irwin DJ , Grossman M , Weintraub D , Chen-Plotkin A , Wolk D , McCluskey L , Elman L , Shaw LM , Toledo JB , McBride J , Hernandez-Con P , Lee VM , Trojanowski JQ , Blennow K ((2019) ) Association of cerebrospinal fluid neurofilament light protein levels with cognition in patients with dementia, motor neuron disease, and movement disorders. JAMA Neurol 76: , 318–325. |
[37] | Griffin WS , Stanley LC , Ling C , White L , MacLeod V , Perrot LJ , White CL 3rd , Araoz C ((1989) ) Brain interleukin 1 and S-100 immunoreactivity are elevated in Down syndrome and Alzheimer disease. Proc Natl Acad Sci U S A 86: , 7611–7615. |
[38] | Mrak RE , Sheng JG , Griffin WS ((1996) ) Correlation of astrocytic S100 beta expression with dystrophic neurites in amyloid plaques of Alzheimer’s disease. J Neuropathol Exp Neurol 55: , 273–279. |
[39] | Hanzel DK , Trojanowski JQ , Johnston RF , Loring JF ((1999) ) High-throughput quantitative histological analysis of Alzheimer’s disease pathology using a confocal digital microscanner. Nat Biotechnol 17: , 53–57. |
[40] | Muramori F , Kobayashi K , Nakamura I ((1998) ) A quantitative study of neurofibrillary tangles, senile plaques and astrocytes in the hippocampal subdivisions and entorhinal cortex in Alzheimer’s disease, normal controls and non-Alzheimer neuropsychiatric diseases. Psychiatry Clin Neurosci 52: , 593–599. |
[41] | Vehmas AK , Kawas CH , Stewart WF , Troncoso JC ((2003) ) Immune reactive cells in senile plaques and cognitive decline in Alzheimer’s disease. Neurobiol Aging 24: , 321–331. |
[42] | Dubois B , Feldman HH , Jacova C , Hampel H , Molinuevo JL , Blennow K , DeKosky ST , Gauthier S , Selkoe D , Bateman R , Cappa S , Crutch S , Engelborghs S , Frisoni GB , Fox NC , Galasko D , Habert MO , Jicha GA , Nordberg A , Pasquier F , Rabinovici G , Robert P , Rowe C , Salloway S , Sarazin M , Epelbaum S , de Souza LC , Vellas B , Visser PJ , Schneider L , Stern Y , Scheltens P , Cummings JL ((2014) ) Advancing research diagnostic criteria for Alzheimer’s disease: The IWG-2 criteria. Lancet Neurol 13: , 614–629. |
[43] | Ferreira D , Perestelo-Perez L , Westman E , Wahlund LO , Sarria A , Serrano-Aguilar P ((2014) ) Meta-review of CSF core biomarkers in Alzheimer’s disease: The state-of-the-art after the new revised diagnostic criteria. Front Aging Neurosci 6: , 47. |
[44] | Folstein MF , Folstein SE , McHugh PR ((1975) ) “Mini-mental state”. A practical method for grading the cognitive state of patients for the clinician. J Psychiatr Res 12: , 189–198. |
[45] | Jorm AF ((2004) ) The Informant Questionnaire on cognitive decline in the elderly (IQCODE): A review. Int Psychogeriatr 16: , 275–293. |
[46] | McKhann GM , Knopman DS , Chertkow H , Hyman BT , Jack CR Jr., Kawas CH , Klunk WE , Koroshetz WJ , Manly JJ , Mayeux R , Mohs RC , Morris JC , Rossor MN , Scheltens P , Carrillo MC , Thies B , Weintraub S , Phelps CH ((2011) ) The diagnosis of dementia due to Alzheimer’s disease: Recommendations from the National Institute on Aging-Alzheimer’s Association workgroups on diagnostic guidelines for Alzheimer’s disease. Alzheimers Dement 7: , 263–269. |
[47] | McKeith IG , Boeve BF , Dickson DW , Halliday G , Taylor J-P , Weintraub D , Aarsland D , Galvin J , Attems J , Ballard CG , Bayston A , Beach TG , Blanc F , Bohnen N , Bonanni L , Bras J , Brundin P , Burn D , Chen-Plotkin A , Duda JE , El-Agnaf O , Feldman H , Ferman TJ , ffytche D , Fujishiro H , Galasko D , Goldman JG , Gomperts SN , Graff-Radford NR , Honig LS , Iranzo A , Kantarci K , Kaufer D , Kukull W , Lee VMY , Leverenz JB , Lewis S , Lippa C , Lunde A , Masellis M , Masliah E , McLean P , Mollenhauer B , Montine TJ , Moreno E , Mori E , Murray M , O’Brien JT , Orimo S , Postuma RB , Ramaswamy S , Ross OA , Salmon DP , Singleton A , Taylor A , Thomas A , Tiraboschi P , Toledo JB , Trojanowski JQ , Tsuang D , Walker Z , Yamada M , Kosaka K ((2017) ) Diagnosis and management of dementia with Lewy bodies. Fourth consensus report of the DLB Consortium. Neurology 89: , 88–100. |
[48] | Winblad B , Palmer K , Kivipelto M , Jelic V , Fratiglioni L , Wahlund LO , Nordberg A , Bäckman L , Albert M , Almkvist O , Arai H , Basun H , Blennow K , de Leon M , DeCarli C , Erkinjuntti T , Giacobini E , Graff C , Hardy J , Jack C , Jorm A , Ritchie K , van Duijn C , Visser P , Petersen RC ((2004) ) Mild cognitive impairment–beyond controversies, towards a consensus: Report of the International Working Group on Mild Cognitive Impairment. J Intern Med 256: , 240–246. |
[49] | Duits FH , Teunissen CE , Bouwman FH , Visser PJ , Mattsson N , Zetterberg H , Blennow K , Hansson O , Minthon L , Andreasen N , Marcusson J , Wallin A , Rikkert MO , Tsolaki M , Parnetti L , Herukka SK , Hampel H , De Leon MJ , Schroder J , Aarsland D , Blankenstein MA , Scheltens P , van der Flier WM ((2014) ) The cerebrospinal fluid “Alzheimer profile”: Easily said, but what does it mean? Alzheimers Dement 10: , 713–723.e712. |
[50] | Petersen RC , Smith GE , Ivnik RJ , Kokmen E , Tangalos EG ((1994) ) Memory function in very early Alzheimer’s disease. Neurology 44: , 867–867. |
[51] | Lezak MD , Howieson DB , Bigler ED , Tranel D ((2012) ) Neuropsychological assessment, 5th ed, Oxford University Press, New York, NY, US. |
[52] | Wechsler D ((1987) ) WMS-R : Wechsler Memory Scale-Revised: Manual , Harcourt Brace Jovanovich, San Antonio. |
[53] | Bird SS , Marur VR , Sniatynski MJ , Greenberg HK , Kristal BS ((2011) ) Serum lipidomics profiling using LC-MS and high-energy collisional dissociation fragmentation: Focus on triglyceride detection and characterization. Anal Chem 83: , 6648–6657. |
[54] | Haughey NJ , Bandaru VV , Bae M , Mattson MP ((2010) ) Roles for dysfunctional sphingolipid metabolism in Alzheimer’s disease neuropathogenesis. Biochim Biophys Acta 1801: , 878–886. |
[55] | Kotronoulas A , Jonasdottir HS , Sigurethardottir RS , Halldorsson S , Haraldsson GG , Rolfsson O ((2020) ) Wound healing grafts: Omega-3 fatty acid lipid content differentiates the lipid profiles of acellular Atlantic cod skin from traditional dermal substitutes. J Tissue Eng Regen Med 14: , 441–451. |
[56] | Tsugawa H , Cajka T , Kind T , Ma Y , Higgins B , Ikeda K , Kanazawa M , VanderGheynst J , Fiehn O , Arita M ((2015) ) MS-DIAL: Data-independent MS/MS deconvolution for comprehensive metabolome analysis. Nat Methods 12: , 523–526. |
[57] | Kind T , Liu KH , Lee DY , DeFelice B , Meissen JK , Fiehn O ((2013) ) LipidBlast in silico tandem mass spectrometry database for lipid identification. Nat Methods 10: , 755–758. |
[58] | Efron B , Gong G ((1983) ) A leisurely look at the bootstrap, the jackknife, and cross-validation. Am Stat 37: , 36–48. |
[59] | Fanani ML , Maggio B ((2017) ) The many faces (and phases) of ceramide and sphingomyelin I - single lipids. Biophys Rev 9: , 589–600. |
[60] | Stranahan AM , Cutler RG , Button C , Telljohann R , Mattson MP ((2011) ) Diet-induced elevations in serum cholesterol are associated with alterations in hippocampal lipid metabolism and increased oxidative stress. J Neurochem 118: , 611–615. |
[61] | Cuvillier O ((2002) ) Sphingosine in apoptosis signaling. Biochim Biophys Acta 1585: , 153–162. |
[62] | Gomez-Munoz A , Presa N , Gomez-Larrauri A , Rivera IG , Trueba M , Ordonez M ((2016) ) Control of inflammatory responses by ceramide, sphingosine 1-phosphate and ceramide 1-phosphate. Prog Lipid Res 61: , 51–62. |
[63] | Hannun YA , Obeid LM ((2008) ) Principles of bioactive lipid signalling: Lessons from sphingolipids. Nat Rev Mol Cell Biol 9: , 139–150. |
[64] | Jazvinscak Jembrek M , Hof PR , Simic G ((2015) ) Ceramides in Alzheimer’s disease: Key mediators of neuronal apoptosis induced by oxidative stress and Abeta accumulation. Oxid Med Cell Longev 2015: , 346783. |
[65] | Kalvodova L , Kahya N , Schwille P , Ehehalt R , Verkade P , Drechsel D , Simons K ((2005) ) Lipids as modulators of proteolytic activity of BACE: Involvement of cholesterol, glycosphingolipids, and anionic phospholipids in vitro. J Biol Chem 280: , 36815–36823. |
[66] | Puglielli L , Ellis BC , Saunders AJ , Kovacs DM ((2003) ) Ceramide stabilizes beta-site amyloid precursor protein-cleaving enzyme 1 and promotes amyloid beta-peptide biogenesis. J Biol Chem 278: , 19777–19783. |
[67] | Grimm MO , Grimm HS , Patzold AJ , Zinser EG , Halonen R , Duering M , Tschape JA , De Strooper B , Muller U , Shen J , Hartmann T ((2005) ) Regulation of cholesterol and sphingomyelin metabolism by amyloid-beta and presenilin. Nat Cell Biol 7: , 1118–1123. |
[68] | Lee JT , Xu J , Lee JM , Ku G , Han X , Yang DI , Chen S , Hsu CY ((2004) ) Amyloid-beta peptide induces oligodendrocyte death by activating the neutral sphingomyelinase-ceramide pathway. J Cell Biol 164: , 123–131. |
[69] | Cutler RG , Kelly J , Storie K , Pedersen WA , Tammara A , Hatanpaa K , Troncoso JC , Mattson MP ((2004) ) Involvement of oxidative stress-induced abnormalities in ceramide and cholesterol metabolism in brain aging and Alzheimer’s disease. Proc Natl Acad Sci U S A 101: , 2070–2075. |
[70] | Chalfant CE , Kishikawa K , Mumby MC , Kamibayashi C , Bielawska A , Hannun YA ((1999) ) Long chain ceramides activate protein phosphatase-1 and protein phosphatase-2A. Activation is stereospecific and regulated by phosphatidic acid. J Biol Chem 274: , 20313–20317. |
[71] | Dobrowsky RT , Kamibayashi C , Mumby MC , Hannun YA ((1993) ) Ceramide activates heterotrimeric protein phosphatase 2A. J Biol Chem 268: , 15523–15530. |
[72] | Goedert M , Jakes R , Qi Z , Wang JH , Cohen P ((1995) ) Protein phosphatase 2A is the major enzyme in brain that dephosphorylates tau protein phosphorylated by proline-directed protein kinases or cyclic AMP-dependent protein kinase. J Neurochem 65: , 2804–2807. |
[73] | Gong CX , Grundke-Iqbal I , Iqbal K ((1994) ) Dephosphorylation of Alzheimer’s disease abnormally phosphorylated tau by protein phosphatase-2A. Neuroscience 61: , 765–772. |
[74] | Mukhopadhyay A , Saddoughi SA , Song P , Sultan I , Ponnusamy S , Senkal CE , Snook CF , Arnold HK , Sears RC , Hannun YA , Ogretmen B ((2009) ) Direct interaction between the inhibitor 2 and ceramide via sphingolipid-protein binding is involved in the regulation of protein phosphatase 2A activity and signaling. FASEB J 23: , 751–763. |
[75] | Han X , Holtzman DM , McKeel DW Jr. , Kelley J , Morris JC ((2002) ) Substantial sulfatide deficiency and ceramide elevation in very early Alzheimer’s disease: Potential role in disease pathogenesis. J Neurochem 82: , 809–818. |
[76] | Filippov V , Song MA , Zhang K , Vinters HV , Tung S , Kirsch WM , Yang J , Duerksen-Hughes PJ ((2012) ) Increased ceramide in brains with Alzheimer’s and other neurodegenerative diseases. J Alzheimers Dis 29: , 537–547. |
[77] | He X , Huang Y , Li B , Gong CX , Schuchman EH ((2010) ) Deregulation of sphingolipid metabolism in Alzheimer’s disease. Neurobiol Aging 31: , 398–408. |
[78] | Katsel P , Li C , Haroutunian V ((2007) ) Gene expression alterations in the sphingolipid metabolism pathways during progression of dementia and Alzheimer’s disease: A shift toward ceramide accumulation at the earliest recognizable stages of Alzheimer’s disease? Neurochem Res 32: , 845–856. |
[79] | Fonteh AN , Ormseth C , Chiang J , Cipolla M , Arakaki X , Harrington MG ((2015) ) Sphingolipid metabolism correlates with cerebrospinal fluid Beta amyloid levels in Alzheimer’s disease. PLoS One 10: , e0125597. |
[80] | Satoi H , Tomimoto H , Ohtani R , Kitano T , Kondo T , Watanabe M , Oka N , Akiguchi I , Furuya S , Hirabayashi Y , Okazaki T ((2005) ) Astroglial expression of ceramide in Alzheimer’s disease brains: A role during neuronal apoptosis. Neuroscience 130: , 657–666. |
[81] | Mielke MM , Haughey NJ , Bandaru VVR , Zetterberg H , Blennow K , Andreasson U , Johnson SC , Gleason CE , Blazel HM , Puglielli L , Sager MA , Asthana S , Carlsson CM ((2014) ) Cerebrospinal fluid sphingolipids, beta-amyloid, and tau in adults at risk for Alzheimer’s disease. Neurobiol Aging 35: , 2486–2494. |
[82] | Sengupta U , Nilson AN , Kayed R ((2016) ) The role of amyloid-β oligomers in toxicity, propagation, and immunotherapy. EBioMedicine 6: , 42–49. |
[83] | Huttunen HJ , Kuja-Panula J , Sorci G , Agneletti AL , Donato R , Rauvala H ((2000) ) Coregulation of neurite outgrowth and cell survival by amphoterin and S100 proteins through receptor for advanced glycation end products (RAGE) activation. J Biol Chem 275: , 40096–40105. |
[84] | Fanò G , Mariggiò MA , Angelella P , Nicoletti I , Antonica A , Fulle S , Calissano P ((1993) ) The S-100 protein causes an increase of intracellular calcium and death of PC12 cells. Neuroscience 53: , 919–925. |
[85] | Hu J , Ferreira A , Van Eldik LJ ((1997) ) S100beta induces neuronal cell death through nitric oxide release from astrocytes. J Neurochem 69: , 2294–2301. |
[86] | Adami C , Sorci G , Blasi E , Agneletti AL , Bistoni F , Donato R ((2001) ) S100B expression in and effects on microglia. Glia 33: , 131–142. |
[87] | Liu CC , Liu CC , Kanekiyo T , Xu H , Bu G ((2013) ) Apolipoprotein E and Alzheimer disease: Risk, mechanisms and therapy. Nat Rev Neurol 9: , 106–118. |


