
Plasma Biomarkers of Alzheimer’s Disease in African Americans
Abstract
Background/Objective:
The aim of this study was to determine if plasma concentrations of 5 surrogate markers of Alzheimer’s disease (AD) pathology and neuroinflammation are associated with disease status in African Americans.
Methods:
We evaluated 321 African Americans (159 AD, 162 controls) from the Florida Consortium for African-American Alzheimer’s Disease Studies (FCA3DS). Five plasma proteins reflecting AD neuropathology or inflammation (Aβ42, tau, IL6, IL10, TNFα) were tested for associations with AD, age, sex, APOE and MAPT genotypes, and for pairwise correlations.
Results:
Plasma tau levels were higher in AD when adjusted for biological and technical covariates. APOE ɛ4 was associated with lower plasma Aβ42 and tau levels. Older age was associated with higher plasma Aβ42, tau, and TNFα. Females had lower IL10 levels. Inflammatory proteins had strong pairwise correlations amongst themselves and with Aβ42.
Conclusion:
We identified effects of demographic and genetic variants on five potential plasma biomarkers in African Americans. Plasma inflammatory biomarkers and Aβ42 may reflect correlated pathologies and elevated plasma tau may be a biomarker of AD in this population.
INTRODUCTION
Alzheimer’s disease (AD) is a growing epidemic that disproportionately affects African Americans [1]. The prevalence of AD is estimated to be about twice as high in African Americans as in individuals of European ancestry. The United States (US) census projections estimate that by 2050, 42% of elderly adults will be members of minority groups [1]. Thus, the toll of AD is expected to rise considerably in the African-American population, underscoring the importance of discovering effective biomarkers and therapies that are relevant to this population.
Despite this rising prevalence, African Americans are underrepresented in AD research, including biomarker studies and clinical trials [2, 3]. A recent evaluation of major federally-funded biomarker studies in the US revealed that more than half of these studies did not achieve adequate recruitment of African Americans to reach the representation expected from the US census [3]. Due to this underrepresentation, the clinical utility and characteristics of biomarkers, which are primarily established in participants of European ancestry, are unclear for African Americans.
Emerging studies evaluating neuroimaging or cerebrospinal fluid (CSF) protein levels suggest that there may be population specific differences for these AD biomarkers between African Americans and individuals of European ancestry [4]. However, plasma biomarker studies in African-American AD participants are scarce, even though affordable and minimally invasive biomarkers are heavily investigated in individuals of European ancestry [5–7]. Furthermore, most plasma AD biomarker studies of African Americans are conducted in cognitively unimpaired or non-demented populations [8–10]. Although such studies are important to evaluate the effects of these biomarkers on cognition, investigations on the characteristics and diagnostic potential of plasma biomarkers in African-American AD study participants are sorely lacking.
In this study, we sought to fill this knowledge gap by investigating plasma protein levels in 321 African-Americans AD cases and controls from the Florida Consortium for African-American Alzheimer’s Disease Studies (FCA3DS) [11, 12]. We measured plasma levels of five proteins reflecting either core AD neuropathology (amyloid-β 42 [Aβ42] and tau) or inflammation (interleukin 6 [IL6], interleukin 10 [IL10], and tumor necrosis factor alpha [TNFα]). These proteins have been extensively studied as diagnostic biomarkers of AD [5–7, 13, 14], albeit in study participants that are primarily of European descent. Our study provides a thorough characterization of these plasma proteins in our sizable FCA3DS African-American AD case-control series. Our findings have implications for the analyses of these proteins and their potential as diagnostic biomarkers of AD in this population.
MATERIALS AND METHODS
Participants
A total of 321 self-reported African-American individuals (159 AD cases and 162 controls) were recruited at the Mayo Clinic, Jacksonville, Florida for this study (Table 1). All cognitively normal controls and AD cases included in this study were Mayo Clinic patients who consented to participate in AD research as part of the FCA3DS [11, 12], and were diagnosed by a neurologist as possible or probable AD according to the NINCDS-ADRDA criteria [15], or as controls if they were cognitively normal elderly participants with a Clinical Dementia Rating scale score of 0 at their last examination. Informed consent and approval by the Mayo Clinic Institutional Review Board was obtained.
Table 1
Participant demographics and descriptive statistics of the plasma protein measurements
| Variables | Results | AD | Control |
| Age (y) | Mean±SD | 78.2±8.97 | 82.7±8.15 |
| Range | 52.41–99.47 | 56.59–101.47 | |
| n (%) | 159 (49.53%) | 162 (50.47%) | |
| p < 0.0001a | |||
| APOE N (%) | 22 | 2 (1.26%) | 2 (1.23%) |
| 23 | 7 (4.4%) | 30 (18.52%) | |
| 24 | 9 (5.66%) | 7 (4.32%) | |
| 33 | 46 (28.93%) | 72 (44.44%) | |
| 34 | 66 (41.51%) | 46 (28.40%) | |
| 44 | 29 (18.24%) | 5 (3.09%) | |
| p < 0.0001b | |||
| MAPT N (%) | H1/H1 | 108 (67.92%) | 104 (64.20%) |
| H1/H2 | 46 (28.93%) | 50 (30.86%) | |
| H2/H2 | 5 (3.14%) | 8 (4.94%) | |
| p = 0.64b | |||
| Female N (%) | 111 (69.81%) | 124 (76.54%) | |
| p = 0.21c | |||
| Aβ42 (pg/mL) | Mean±SD | 12.02±4.34 | 12.58±4.35 |
| Range | 2.69–40.02 | 2.08–35.61 | |
| N | 159 | 162 | |
| Tau (pg/mL) | Mean±SD | 3.75±2.36 | 3.84±2.27 |
| Range | 0.37–26.79 | 0.18–23.49 | |
| N | 157 | 162 | |
| IL6 (pg/mL) | Mean±SD | 10.16±22.79 | 7.75±16.53 |
| Range | 0.73–217.7 | 0.53–168.41 | |
| N | 150 | 146 | |
| IL10 (pg/mL) | Mean±SD | 1.85±6.57 | 1.58±3.52 |
| Range | 0.25–66.03 | 0.18–30.67 | |
| N | 159 | 155 | |
| TNFα (pg/mL) | Mean±SD | 10.06±57.56 | 7.81±23.21 |
| Range | 0.77–723.91 | 1.4–281.97 | |
| N | 159 | 156 | |
Data are shown for all samples from both batches combined, stratified by diagnosis. Age refers to age of participant at plasma draw. aUnpaired t-test, two-sided p value, bChi-square, cFishers exact test.
Single molecule arrays by quanterix
Plasma was stored at –80°C until the protein quantifications. Plasma proteins were quantified using single molecule array (Simoa) assays on the Simoa HD1-Analyzer (Quanterix, Lexington, MA), with a single freeze-thaw cycle between the multiplex Simoa Human Cytokine 3-Plex A assay (IL6, IL10, and TNFα) and the single-analyte Simoa Human assays (Aβ42 and tau). The Simoa tau assay that was utilized recognizes all human tau isoforms including phosphorylated tau. All plasma samples were assayed in duplicate for each protein, according to the manufacturer’s protocol. The first lot of reagents was utilized to measure protein levels in 66 AD cases (batch 1), while the second lot was used to measure 93 AD cases and 162 controls (batch 2). Supplementary Table 1 summarizes demographics of study participants. For all protein measurements, samples were randomized according to age and sex within in each batch, and in the second batch samples were also randomized according to diagnosis. In addition, when the two batches were analyzed jointly, statistical analyses included a covariate to adjust for potential batch effects.
Genotyping
We extracted DNA from blood using the FLEX STAR system (AutoGen, MA, USA) and the FlexiGene DNA Kit (QIAGEN, Hilden, Germany) according to manufacturer’s instructions. We utilized TaqMan genotyping assays to obtain APOE ɛ2/3/4 genotypes (C_\!_\!_3084793_20 for rs429358, C_\!_\!_\!_904973_10 for rs7412) and MAPT H1/H2 haplotypes (C_\!_29297996_10 for rs8070723) using a QuantStudio 7 Flex Real-Time PCR system (Applied Biosystems, CA, USA) with an Eppendorf Mastercycler Pro 384 with vapo.protect (Eppendorf, Hamburg, Germany).
Statistical analysis
Mean, standard deviation, and coefficient of variation (CoV) were calculated for every duplicate plasma protein measurement. Measurements with >20% CoV were excluded from the analysis. Statistical analyses for the five plasma proteins were performed on the log2-transformed mean of duplicate measurements, as these values were normally distributed (Supplementary Figure 1).
Separate multivariable linear regression models were used to examine independent predictors of our dependent variables, the plasma AD biomarkers. As aforementioned, the log2-transformed mean of duplicate plasma biomarkers measurements were used. All analyses included age of the study participant at blood draw (age), number of years of plasma storage (age of plasma), sex, plate, and batch variables. The primary analytic model (Model 1) included these variables, as well as diagnosis, APOE ɛ4 dosage (0, 1, or 2 copies of the ɛ4 allele) as it is a well-known AD-risk factor, and MAPT H1 haplotype dosage (0, 1, or 2 copies of the H1 haplotype) given that MAPT H1 haplotype is associated with higher brain levels of MAPT. We also performed exploratory analyses that did not adjust for APOE ɛ4 dosage (Model 2) or MAPT H1 haplotype dosage (Model 3) in order to assess the individual genetic effects of MAPT or APOE, respectively.
In the main analyses, batch 1 (AD only) and batch 2 (AD and controls) were analyzed jointly, while appropriately adjusting for potential batch effects (Table 2). Secondary analyses stratified by batch and by diagnosis were also conducted to determine whether the findings were driven by either of these strata (Supplementary Tables 2, 3).
Table 2
Association of plasma protein levels with diagnosis, age, sex, and APOE ɛ4 dosage and MAPT H1 haplotype dosage
| APOE ɛ4 dosage | MAPT H1 dosage | Age, 10 years | Sex, female versus male | Diagnosis, AD versus control | ||||||||||||
| % change | 95% CI | p | % change | 95% CI | p | % change | 95% CI | p | % change | 95% CI | p | % change | 95% CI | p | ||
| Aβ42 (n = 321) | Model 1 | –11.5 | (–16.55, –6.11) | 5.99E–05 | 5.9 | (–0.55, 12.9) | 0.07 | 8.7 | (3.53, 14.08) | 5.20E–04 | –2.1 | (–9.62, 6.07) | 0.60 | 5.7 | (–3.67, 15.99) | 0.24 |
| Model 2 | – | – | – | 5.7 | (–0.97, 12.9) | 0.09 | 11.7 | (7.18, 17.28) | 1.34E–06 | –2.5 | (–10.12, 5.92) | 0.55 | 0.5 | (–8.3, 10.11) | 0.91 | |
| Model 3 | –11.4 | (–16.55, –6.05) | 7.06E–05 | – | – | – | 8.7 | (4.25, 14.08) | 3.01E–04 | –2.5 | (–10, 5.7) | 0.54 | 6.1 | (–3.41, 16.39) | 0.22 | |
| Tau (n = 319) | Model 1 | –8.7 | (–16.66, –0.07) | 0.05 | 5.4 | (–4.47, 16.23) | 0.29 | 8.7 | (1.4, 16.47) | 0.02 | 4.3 | (–7.85, 18.02) | 0.50 | 17.1 | (1.61, 35.1) | 0.03 |
| Model 2 | – | – | – | 5.3 | (–4.6, 16.15) | 0.31 | 11.0 | (3.53, 18.92) | 2.44E–03 | 4.1 | (–8.11, 17.85) | 0.53 | 12.8 | (–1.72, 29.41) | 0.09 | |
| Model 3 | –8.7 | (–16.61, 0) | 0.05 | – | – | – | 9.4 | (1.4, 17.28) | 0.02 | 4.0 | (–8.11, 17.61) | 0.54 | 17.5 | (1.89, 35.47) | 0.03 | |
| IL6 (n = 296) | Model 1 | 8.5 | (–12.28, 34.07) | 0.45 | –15.9 | (–32.4, 4.61) | 0.12 | 16.5 | (–0.69, 36.6) | 0.06 | –17.0 | (–37.24, 9.89) | 0.19 | 29.0 | (–6.44, 77.77) | 0.12 |
| Model 2 | – | – | – | –16.0 | (–32.45, 4.46) | 0.12 | 14.1 | (–2.06, 32.87) | 0.08 | –16.7 | (–37.06, 10.11) | 0.20 | 33.4 | (–1.92, 81.63) | 0.07 | |
| Model 3 | 8.8 | (–12.1, 34.54) | 0.44 | – | – | – | 15.7 | (–1.38, 35.66) | 0.08 | –16.1 | (–36.62, 11.03) | 0.22 | 27.4 | (–7.66, 75.69) | 0.14 | |
| IL10 (n = 314) | Model 1 | 7.1 | (–8.68, 25.53) | 0.40 | –0.9 | (–16.38, 17.45) | 0.92 | 3.5 | (–8.62, 17.28) | 0.58 | –20.2 | (–35.52, –1.31) | 0.04 | 5.4 | (–17.58, 34.82) | 0.67 |
| Model 2 | – | – | – | –0.9 | (–16.38, 17.45) | 0.92 | 2.1 | (–9.25, 14.87) | 0.77 | –20.1 | (–35.34, –1.1) | 0.04 | 8.5 | (–14.44, 37.46) | 0.50 | |
| Model 3 | 7.1 | (–8.62, 25.53) | 0.40 | – | – | – | 3.5 | (–8.62, 17.28) | 0.59 | –20.2 | (–35.47, –1.31) | 0.04 | 5.3 | (–17.58, 34.63) | 0.68 | |
| TNF–α (n = 315) | Model 1 | 4.5 | (–9.37, 20.41) | 0.54 | –3.9 | (–17.47, 11.73) | 0.60 | 12.5 | (0.7, 25.7) | 0.04 | –13.7 | (–28.65, 4.39) | 0.13 | –5.1 | (–23.79, 18.35) | 0.64 |
| Model 2 | – | – | – | –4.0 | (–17.53, 11.73) | 0.60 | 11.0 | (0, 23.11) | 0.05 | –13.6 | (–28.55, 4.46) | 0.13 | –3.3 | (–21.76, 19.5) | 0.75 | |
| Model 3 | 4.5 | (–9.31, 20.41) | 0.54 | – | – | – | 11.7 | (0, 24.83) | 0.04 | –13.6 | (–28.5, 4.54) | 0.13 | –5.3 | (–23.95, 17.94) | 0.63 | |
Plasma protein levels (log 2) of all samples were analyzed using a multivariable linear regression analysis accounting for technical variables (plate, batch and years of plasma storage), APOE ɛ4 dosage, MAPT H1 haplotype dosage, age, sex, and diagnosis (Model 1). Model 2 excluded APOE ɛ4 dosage, and Model 3 excluded MAPT H1 haplotype dosage. To aid interpretability of results, the estimated coefficients were transformed to provide estimates of percent change in plasma level associated with the specified change in value of the explanatory variable: one copy of APOE ɛ4, one copy of MAPT H1, 10 years of age, female versus male, AD versus control. The transformation was: (100*(2∧beta-1)) where beta was the raw estimated coefficient. 95% CI refer to 95% confidence intervals of the change.
We also evaluated the relationship between each pair of biomarkers using multivariable linear regression where log2 transformed plasma levels of each biomarker were tested as the dependent variable in models which assessed all other biomarkers individually as independent variables. These analyses were adjusted for APOE ɛ4 dosage, age, sex, diagnosis, years of plasma storage, plate, and batch.All association analyses were performed using linear fixed-effects models in R version 3.4.4. Data was visualized using the ggplot2 package in R. All statistical tests were two-sided. Type 1 error rate was considered as 0.05. The receiver operating characteristic (ROC) curve was generated in R version 3.6.2 using residuals from the model that included all the variables except for diagnosis.
RESULTS
A total of 23 plasma samples were excluded from the corresponding protein analyses due to quantification failure; 20 for IL6, 2 for IL10, and 1 for TNFα. Two tau measurements exceeded the CoV threshold and were excluded from subsequent analyses. The average CoV for all measurements was 3%, highlighting the high degree of precision in repeat measurements. Participant demographics and summary statistics for the plasma proteins analyzed are shown in Table 1. These data are also shown stratified by diagnosis, sex, APOE genotypes and MAPT haplotypes, as well as measurement batch in Supplementary Table 1.
Controls were significantly older than AD cases both in the combined analysis (Table 1) and within measurement batch 2 (Supplementary Table 1). AD participants from batch 2 were also significantly older than AD cases in batch 1 (data not shown). There were no differences in the distribution of sex between the diagnostic groups in batch 2 or in the combined analysis (Table 1 and Supplementary Table 1). As expected [17], APOE genotype frequencies were significantly different between AD cases and controls (Table 1 and Supplementary Table 1), with a higher percentage of APOE ɛ4 carriers in the AD cases (batch 1: 71.21%, batch 2: 61.29%, batch 1 + 2: 65.41%) compared to controls (35.81%). There was no difference in the MAPT haplotype frequency between AD cases and controls (Table 1), or in AD cases between the two batches (data not shown). Following log2 transformation, all plasma protein measurements were normally distributed within each of the AD and control groups and in all samples combined (Supplementary Figure 1).
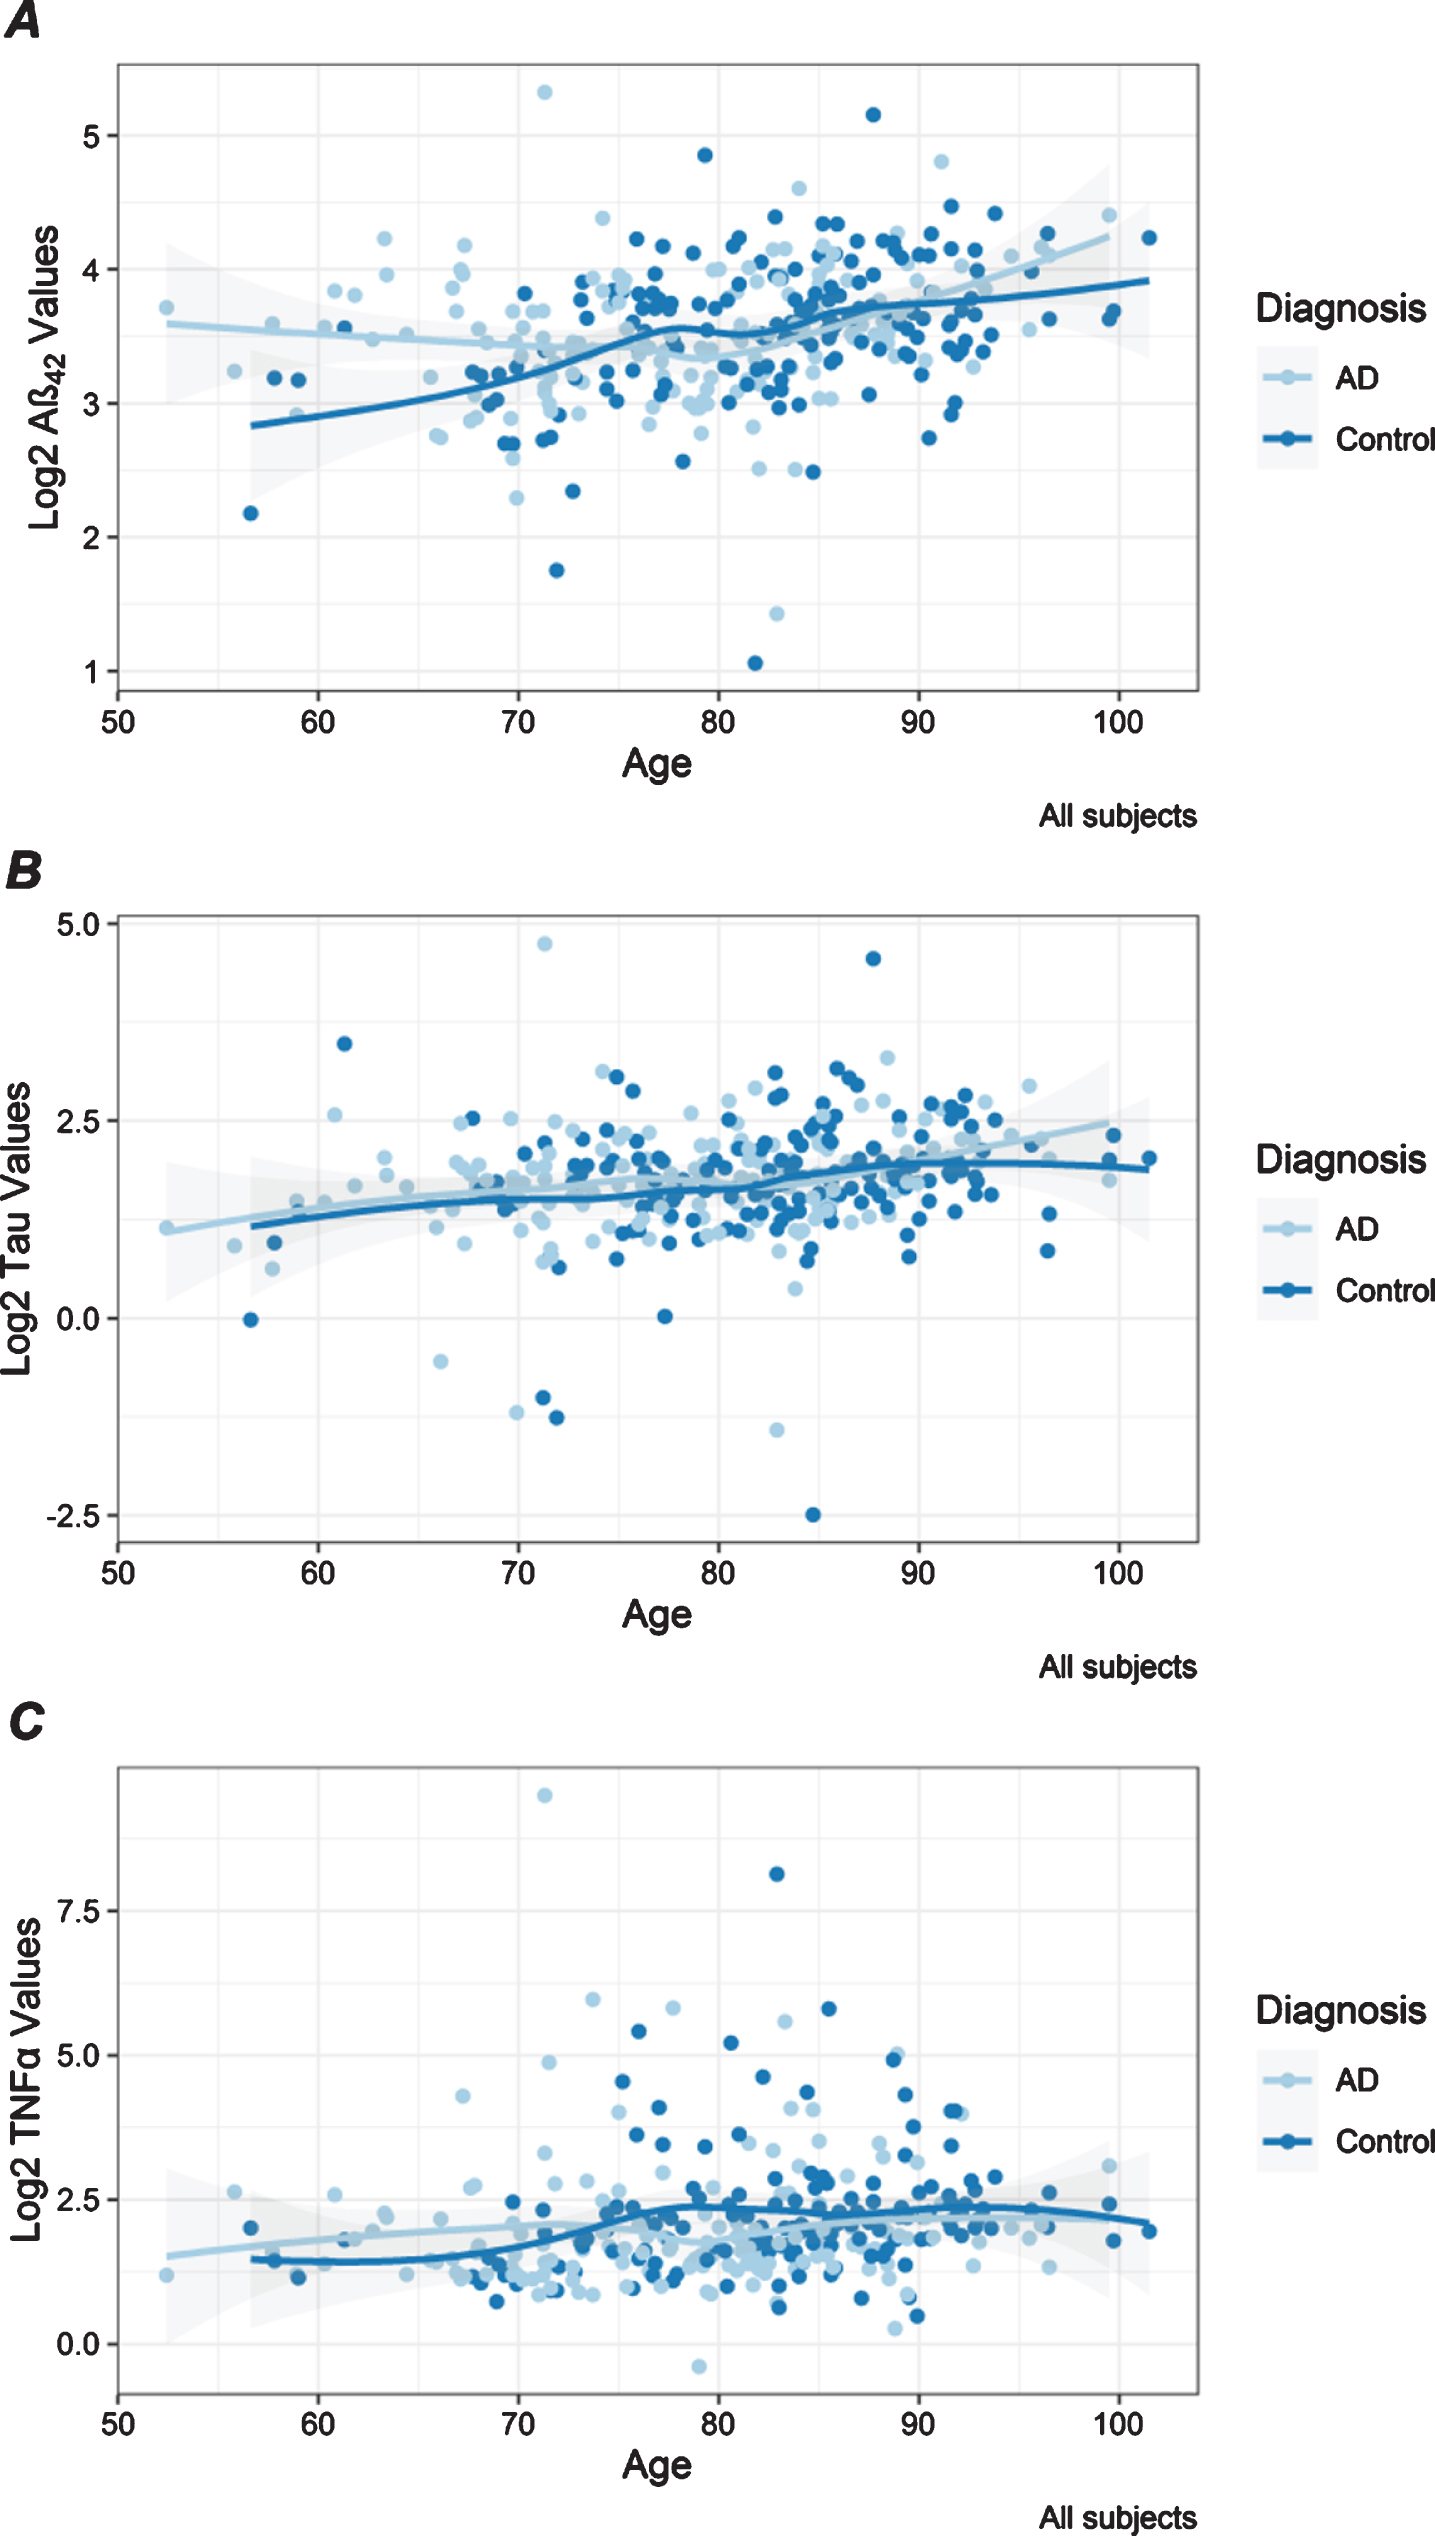
Age was significant for three of the five tested plasma proteins in these African-American samples. In the combined analysis, higher plasma levels of Aβ42, tau, and TNFα were significantly associated with older age (Table 2, Fig. 1). Associations with age were strongest for plasma Aβ42 under all models (Table 2) and observed in AD and control participants in both batches (Supplementary Table 2). Association between age and tau levels was most significant for the older AD participants in batch 2, which may be suggestive of an influence of both disease and age on this biomarker (Supplementary Table 2). This is supported by the observation that plasma tau levels were significantly higher in AD participants compared to controls. TNFα was significantly associated with age only in the control participants (Supplementary Table 2), who were the oldest diagnostic group, highlighting the effect of older age for this inflammatory biomarker. Higher plasma IL6 was significantly associated with older age in the combined set of AD cases and controls in batch 2 (Supplementary Table 2), but this association was not observed in the combined analysis (Table 2). Higher IL10 levels were associated with older age that was significant only in AD cases in batch 1 (Supplementary Table 2).
Fig. 1
Distribution of plasma protein levels by age. Scatter plots are shown for Aβ42 (A), tau (B), and TNFα (C) log2 transformed values that have statistically significant associations with age shown in Table 2. Each dot presents the level for a unique individual. Lines are drawn with the loess smoother function and gray bands represent confidence intervals. Results are color-coded for participants with AD (light blue) and controls (dark blue).
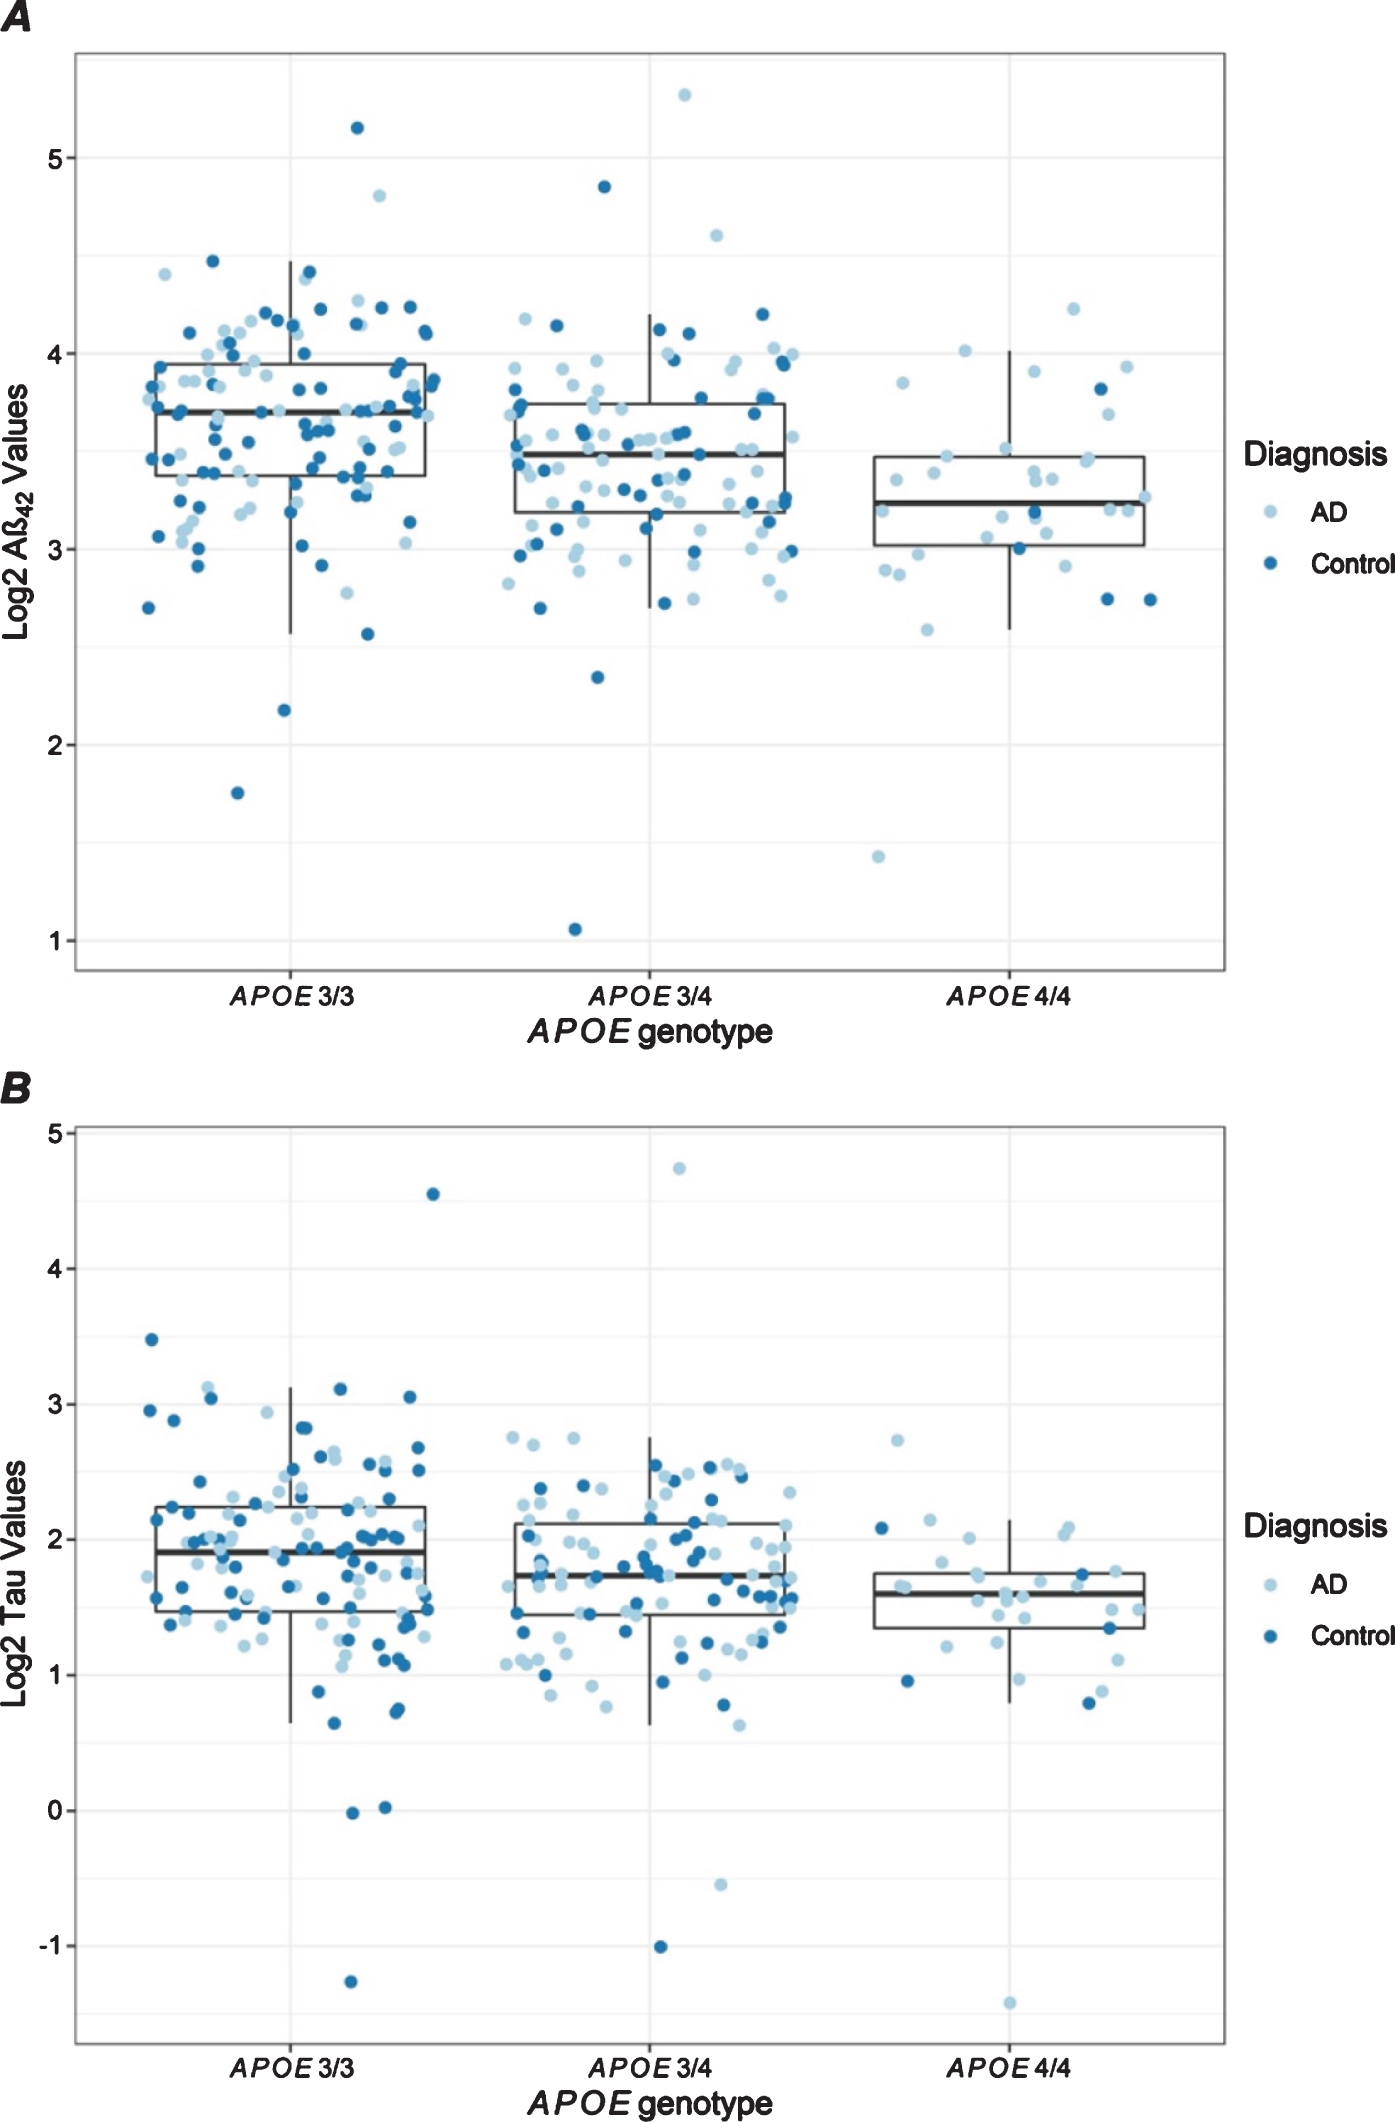
APOE ɛ4 dosage was significantly associated with lower Aβ42 and tau levels (Table 2, Fig. 2). These associations were observed in both diagnostic groups and in both batches (Supplementary Table 2, Supplementary Figures 2 and 3), suggesting an influence of APOE ɛ4 on these biomarkers regardless of AD diagnosis or age. No significant associations were observed with MAPT H1 haplotype dosage in the combined analysis (Table 2); however, controls who were H1 haplotype carriers had significantly lower IL6 levels (Supplementary Table 2).
Fig. 2
Distribution of plasma protein levels by APOE genotype. Box plots are shown for Aβ42 (A) and tau (B) levels that have statistically significant associations with APOE ɛ4 dosage as shown in Table 2. Each dot presents the level for a unique individual. Results are color-coded for participants with AD (light blue) and controls (dark blue).
Female sex was associated with lower plasma IL10 levels in the combined analysis (Table 2, Supplementary Figure 4). Although the other two inflammatory biomarkers, IL6 (Supplementary Figure 5) and TNFα (Supplementary Figure 6) had trends toward lower levels in females, these did not achieve statistical significance in the joint analysis (Table 2). IL10 associations and TNFα trends with sex appeared to be driven by AD with the strongest effects observed in batch 1 and batch 2, respectively (Supplementary Table 2).
The only biomarker that showed significant association with diagnosis in the combined analysis was tau, which was higher in AD (Table 2, Supplementary Table 2). We note that AD cases had slightly lower, though insignificant, mean tau levels compared to controls (Table 1), when no covariate adjustments were made. However, in our study, controls were older and had lower APOE ɛ4 frequency, and plasma samples of AD cases were stored longer (median plasma storage time = 13.44 years) than controls (7.36 years) which led to strong associations with the technical variable of years of plasma storage and lower plasma tau levels (data not shown). After adjusting for biological and technical variables, AD diagnosis was associated with higher plasma tau levels. This association was independent of MAPT haplotypes and persisted whether they were included (Model 1) or excluded (Model 3) from the analyses. Analysis of sensitivity and specificity of plasma tau concentrations as discriminator of AD diagnosis showed an area under the ROC curve of 0.55 and the highest estimated value of (sensitivity + specificity)/2 was obtained at a cut-point where the sensitivity is 63% and the specificity is 50%.
IL6 levels were significantly higher in AD cases than in controls in batch 2 (Supplementary Table 2), but only reached significance when APOE ɛ4 dosage was not included in the model (Model 2), and it did not reach significance in the combined analysis of the two batches.
To evaluate the relationship of these plasma bio-markers, pairwise analyses were performed adjusting for biological and technical covariates. All observed protein-protein associations had positive regression coefficients (Table 3). Strong associations were observed between plasma Aβ42 and tau levels, whether Aβ42 or tau were analyzed as the dependent variable. Significant positive associations were also observed amongst the inflammatory biomarkers IL6, IL10, and TNFα. Among the inflammatory biomarkers, TNFα was positively associated with Aβ42, and to a lesser but still statistically significant level with tau. Plasma IL6 levels were also positively associated with Aβ42, but displaying only a marginal trend with tau. The pairwise associations of these plasma biomarkers were in general consistently observed when AD cases and controls were analyzed separately (Supplementary Table 3). Scatter plots showing pairwise protein correlations are shown in Supplementary Figure 7.
Table 3
Pairwise associations of plasma protein levels
| Aβ42 | Tau | IL6 | IL10 | TNFα | ||||||||||||||||
| N | % change | 95% CI | p | N | % change | 95% CI | p | N | % change | 95% CI | p | N | % change | 95% CI | p | N | % change | 95% CI | p | |
| Aβ42 | – | – | – | – | 319 | 55.1 | (39.09, 72.91) | 4.31E–14 | 296 | 40.8 | (7.92, 83.78) | 1.19E–02 | 314 | 16.0 | (–5.85, 42.8) | 1.63E–01 | 315 | 54.2 | (28.79, 84.68) | 3.47E–06 |
| Tau | 319 | 20.6 | (15.11, 26.4) | 5.21E–14 | – | – | – | – | 294 | 14.9 | (–3.21, 36.23) | 1.12E–01 | 312 | 3.6 | (–9.5, 18.51) | 6.08E–01 | 313 | 12.9 | (0.14, 27.28) | 4.70E–02 |
| IL6 | 296 | 3.4 | (0.84, 5.92) | 8.13E–03 | 294 | 3.3 | (–0.62, 7.4) | 9.71E–02 | – | – | – | – | 295 | 15.5 | (9.73, 21.5) | 6.57E–08 | 296 | 22.8 | (19, 26.66) | 3.53E–30 |
| IL10 | 314 | 2.2 | (–0.83, 5.26) | 1.52E–01 | 312 | 1.5 | (–3.07, 6.36) | 5.20E–01 | 295 | 40.1 | (24.57, 57.57) | 3.90E–08 | – | – | – | – | 314 | 47.3 | (39.38, 55.62) | 1.05E–33 |
| TNFα | 315 | 8.1 | (4.75, 11.57) | 1.81E–06 | 313 | 5.7 | (0.56, 11.19) | 3.06E–02 | 296 | 139.7 | (109.65, 173.78) | 4.31E–30 | 314 | 62.0 | (51.15, 73.51) | 1.05E–33 | – | – | – | – |
Plasma protein levels (log 2) of all samples were analyzed for pairwise associations using a multivariable linear regression analysis. All analyses were adjusted for technical variables, APOE ɛ4 dosage, age, and sex. Variables in the rows represent the dependent variables and those in the columns the tested independent variables in the models. To aid interpretability of results, the estimated coefficients were transformed to provide estimates of percent change in plasma level associated with the specified change in value of the independent variable. The transformation was: (100*(2∧beta-1)) where beta was the raw estimated coefficient. 95% CI refer to 95% confidence intervals of the change.
DISCUSSION
Our study sought to evaluate the diagnostic potential of five potential plasma biomarkers, namely Aβ42, total tau, IL6, IL10, and TNFα. These plasma protein measurements were obtained via single molecule array technology implemented in the Simoa HD1 platform, known for its sensitivity and reproducibility even at low concentrations [18]. The association of biological variables including age, sex, APOE ɛ4 dosage, MAPT H1dosage, and AD diagnosis was also evaluated in our study.
We found significantly higher levels of plasma total tau in African-American AD cases compared to elderly, cognitively unimpaired controls, after adjusting for biological and technical variables. AD cases had slightly lower, though insignificant, mean tau levels compared to controls, when no covariate adjustments are made. However, in our study, controls were older and had lower APOE ɛ4 frequency, which may lead to increases in their plasma tau levels. Further, we observed strong associations with the technical variable of years of plasma storage and lower plasma tau levels. If unadjusted for, this would also confound the results toward lower tau levels in AD, as plasma samples of AD cases were stored longer. These results highlight the importance of adequate evaluation and adjustment for variables in biomarker studies.
Previous studies conducted in European [19], European-American [20], or Taiwanese [21] populations also detected significantly higher levels of plasma tau levels in participants with clinically diagnosed AD compared with elderly controls. More recently, a comprehensive meta-analysis of biomarker studies evaluated plasma or serum data from 271 AD participants and 394 controls [7]. This meta-analysis identified significantly higher total tau levels in AD participants, consistent with our findings. Interestingly, of the peripheral biomarkers meta-analyzed in that study (YKL-40, HFABP, Aβ40, Aβ42, MCP-1, NSE, and tau), total tau was the only one significantly associated with AD. In our study, we did not identify significant associations with AD for any of the other biomarkers assessed, namely Aβ42 and the inflammatory proteins, IL6, IL10, and TNFα. Previous cross-sectional studies on plasma Aβ levels as a diagnostic AD biomarker revealed conflicting results [22–24]. Prospective studies which evaluated baseline Aβ levels as a predictive biomarker for cognitive decline and/or incident AD also had some discrepancies. In some prospective studies, higher levels of plasma Aβ42 at baseline were associated with greater risk of incident AD [25, 26]. Others determined that lower baseline Aβ42/Aβ40 [8, 27] were associated with greater risk of incident mild cognitive impairment or AD and/or cognitive decline.
To our knowledge, there are no studies in African Americans that evaluated cytokines as potential AD diagnostic biomarkers. Neuroinflammation is considered an integral part of AD pathophysiology [28], prompting investigators to look for inflammatory signatures in body fluids as potential disease biomarkers [13, 14]. A recent meta-analysis of peripheral cytokines and chemokines [14] evaluated 36 (n = 3,245), 32 (n = 2,913) and 15 (n = 1,595) AD case-control studies for association with plasma TNFα, IL6, and IL10 levels, respectively. In this larger meta-analysis, only higher plasma IL6 levels had significant association with AD. Neither TNFα nor IL10 plasma levels had significant associations with AD, although CSF levels of IL10 were higher in AD than controls in a meta-analysis of three studies [14]. We took advantage of the multiplex assay from Simoa to investigate in our FCA3DS case-control series three cytokines, IL6, IL10, and TNFα, which have previously been studied in many European [14] and some Asian [29, 30] populations. None of these biomarkers were significantly associated with AD in the overall FCA3DS case-control series.
Among the biological variables tested as potential modifiers of plasma biomarker levels (age, sex, APOE ɛ4 dosage, and MAPT H1 haplotype dosage), age, APOE ɛ4 dosage, and sex showed significant effects. Older age had significant associations with elevated plasma levels of Aβ42, tau, and TNFα. Plasma Aβ42 and/or Aβ40 levels were previously shown to be elevated with age in both cross-sectional [23, 31, 32] and prospective studies [33, 34]. In our cross-sectional study, age had significant influence on plasma Aβ42 levels in both AD cases and controls, even when analyzed separately. Higher plasma tau levels were also associated with older age in our study. These findings are consistent both with the notion that plasma tau is likely a biomarker of neurodegeneration [35] and that it is positively correlated with age [36]. We also identified association between older age and TNFα, as previously reported [30]. Indeed, aging is thought to be associated with chronic low grade inflammation. Increased levels of cytokines including TNFα and IL6 are correlated with frailty, cognitive decline, other morbidities, and increased mortality in the elderly [37]. In our study, the strongest influence of age on TNFα was detected in the controls, which had the oldest mean age of 82.7.
We also observed a significant association of APOE ɛ4 dosage with lower plasma Aβ42 levels in the overall case-control series, as well as in AD cases and controls separately. Our findings are consistent with previous studies, including one on LOAD families of European ancestry in which our group identified association of the APOE ɛ4/ɛ4 genotype with lower plasma Aβ42 levels [31], and another study on a Japanese cohort [32] in which APOE ɛ4 carrier status had a suppressive effect on age-related increases in plasma Aβ42. Even though the estimated risk of AD conferred by APOE ɛ4 is lower in African Americans than that in individuals of European ancestry [38], our findings indicate that this variant has consistent effects on plasma Aβ levels in African Americans as in other populations [31, 32].
An inverse relationship was also observed between APOE ɛ4 and plasma tau levels in our study. In a previous study of two cohorts of European ancestry, plasma tau was increased in APOE ɛ4 carriers in one cohort but not in the other [20]. Future studies that include additional African Americans and individuals of European ancestry, as well as other race/ethnicities are needed to determine whether these conflicting findings represent actual population differences in the effect of APOE on plasma tau levels.
Furthermore, an association of female sex with lower plasma IL10 levels was observed in our study. IL10 is an anti-inflammatory cytokine, lower levels of which are thought to result in an enhanced inflammatory status [14]. IL10 was previously shown to be lower in African-American women who were disproportionately affected by metabolic conditions [39]. The implications of these findings, specifically for AD risk, and whether this is an indication of sex-specific differences in the general inflammatory status in this population remain to be established.
Underrepresentation of African Americans in biomarker studies poses a major barrier to the discovery of population-specific risk factors and translation of such findings to therapeutic targets, biomarkers and management approaches relevant to this population [2, 3] who is at greater risk of AD [1, 40]. Given the existing healthcare disparities for African Americans reflected in their delayed presentation for evaluation and lower likelihood to receive dementia treatment [41], the implications of this barrier are far-reaching. AD diagnostic and predictive potential of plasma biomarkers are unknown for African Americans, despite the fact that some plasma biomarkers have already been assessed in as many as >1,000 [42]–10,000 [43] participants that are primarily of European ancestry.
It is probable that utilizing multiple biomarkers jointly, rather than individually, will provide more robust outcomes and may also provide insight about disease pathophysiology [6], as exemplified by utilization of CSF Aβ42, total tau, and phosphorylated tau as combined biomarkers of AD pathophysiology both in the clinic and in research. In this context, it is also useful to characterize correlations or associations between different biomarkers. We identified positive associations between Aβ42 and tau with the inflammatory cytokines; as well as between TNFα and both Aβ42 and tau. These associations were similar in AD cases and controls, suggesting they are not driven by clinical AD. Correlative biomarker studies are scarce. One study identified no correlations between plasma Aβ levels and IL6, IL10, or TNFα [44], whereas another one determined that IL6 was correlated with TNFα and IL10 in LOAD [45]. We postulate that the correlated plasma Aβ42, tau, and TNFα levels may be reflective of both age- and AD-related increases in brain Aβ42 and tau, with concurrent enhancement of pro-inflammatory cytokines. Future neuroimaging and CSF biomarker studies in this population would enable validation of this hypothesis.
In summary, our study provides detailed assessment of five plasma biomarkers in an African-American case-control series consisting of 159 AD participants and 162 controls. Our plasma biomarker study has a sizable representation of African-American AD cases, in comparison to prior studies of this population, which either lacked or had limited numbers of AD participants of less than 50 [26]. Our evaluation of both primary AD neuropathology biomarkers (Aβ and tau), and those of inflammation (IL6, IL10, TNFα) aims to yield information on different facets of AD pathophysiology. Another strength of our study is its experimental rigor, which includes single molecule array technology for biomarker measurements, multiplex assay of three cytokines, performing of all measurements in a limited time period and adjusting for multiple technical variables. Our findings support AD related changes in plasma tau levels in African Americans. Even though plasma tau cannot be used alone as a diagnostic biomarker for AD given overlap of its levels with controls, as shown by our sensitivity and specificity analysis, it can potentially be considered as part of a panel for patient stratification or disease staging in African-American populations, as proposed for European study participants [6, 7]. Our study also demonstrates influence of APOE ɛ4, age at measurement, and sex on a variety of plasma proteins, which should serve as a practical guide for experimental design and analytic plan for future studies of these biomarkers in African Americans and other populations.
Correlative plasma biomarker results generate hypotheses on concerted biological processes, which must be tested in future studies that assess complementary neuroimaging and CSF biomarkers in this and other populations.Despite these strengths, our study also has several weaknesses. Given that it is a cross-sectional study, the findings are prone to inter-individual variability of biomarkers that may not be related with AD, or to the other variables we adjusted for in this study. For this reason, longitudinal measurements of biomarkers and assessment of their prospective intra-individual variability is advocated as a more reliable biomarker [20, 42, 43]. Another limitation of this study is that information regarding family history was not available for 80/159 (50%) of the controls. Among the 79 controls for whom family history was recorded, 40 had family history of dementia and 39 did not. This proportion of positive family history is higher than that estimated in a study by Tang et al. in which the frequency of family history of dementia in African Americans was found to be 15% [46]. This potential ascertainment bias in our study may have led to an underestimate of the effect size of the association of plasma tau protein in African American AD versus cognitively unimpaired controls. Although the association of plasma tau with diagnosis would not reach significance after correction for the five plasma proteins tested, the nominal associations we identified in the context of this understudied population are consistent with previously published work in European, European American, and Taiwanese cohorts and thus highly plausible. Despite having a sizable representation of AD participants and elderly controls, the sample size of our African-American case-control series is still a fraction of that collectively assessed in plasma biomarker meta-analyses of European ancestry cohorts [42, 43]. Although our study provides a thorough characterization of five plasma biomarkers in this understudied population, the field needs studies with even larger African-American series for replication of our results. Evaluation of other plasma protein biomarkers, such as ptau and Aβ40, is also needed; however, at the time when this study was conducted, the ptau assay had not been validated yet in plasma, and the amount of plasma available was insufficient for additional measurements. The findings from our study including effect sizes, which were previously lacking in the literature for this population, should help guide design of such future studies. Finally, future plasma biomarker studies of African Americans and other understudied minority populations should include markers of disease severity such as detailed neuropsychological and neuroimaging measures. Studies which can control for other factors that can influence plasma protein levels such as information on presence of infection or inflammation at the time of blood collection [6], blood liver enzyme and creatinine levels, are needed for all populations investigated for AD biomarkers.
This cross-sectional biomarker study on 321 FCA3DS AD cases and elderly, cognitively unimpaired controls provides a previously lacking detailed evaluation of five plasma proteins representing core AD pathology and inflammation in this understudied population. The findings of this study support further investigations of plasma tau as a potential AD biomarker and should help guide future studies of these biomarkers in African Americans.
AVAILABILITY OF DATA AND MATERIALS
Data may be made available after a reasonable and well-justified request to the principal investigator of FCA3DS, Dr. Nilufer Ertekin-Taner. Data cannot, however, be made freely available to the public, due to privacy regulations and informed consent.
ACKNOWLEDGMENTS
We thank the participants and their families for their participation in research. Without them this work would not have been possible. We are also thankful to the Mayo Clinic Memory Disorders Center Coordinators including Michelle Fudge, Rita Fletcher, Francine Parfitt, Kelly Smith, and Sylvia Grant. We thank Mayo Clinic Office of Health Disparities in Research for their support.
This work was supported by the National Institute on Aging [RF AG051504, U01 AG046139, R01 AG061796 to NET; P30 AG062677 to JL and NGR]; Florida Health Ed and Ethel Moore Alzheimer’s Disease grants [5AZ03 and 7AZ17 to NET; 7AZ07 to MC].
Authors’ disclosures available online (https://www.j-alz.com/manuscript-disclosures/20-0828r2).
SUPPLEMENTARY MATERIAL
[1] The supplementary material is available in the electronic version of this article: https://dx.doi.org/10.3233/JAD-200828.
REFERENCES
[1] | Barnes LL , Bennett DA ((2014) ) Alzheimer’s disease in African Americans: Risk factors and challenges for the future. Health Aff (Millwood) 33: , 580–586. |
[2] | Chin AL , Negash S , Hamilton R ((2011) ) Diversity and disparity in dementia: The impact of ethnoracial differences in Alzheimer disease. Alzheimer Dis Assoc Disord 25: , 187–195. |
[3] | Shin J , Doraiswamy PM ((2016) ) Underrepresentation of African-Americans in Alzheimer’s trials: A call for affirmative action. Front Aging Neurosci 8: , 123. |
[4] | Morris JC , Schindler SE , McCue LM , Moulder KL , Benzinger TLS , Cruchaga C , Fagan AM , Grant E , Gordon BA , Holtzman DM , Xiong C ((2019) ) Assessment of racial disparities in biomarkers for Alzheimer disease. JAMA Neurol 76: , 264–273. |
[5] | Henriksen K , O’Bryant SE , Hampel H , Trojanowski JQ , Montine TJ , Jeromin A , Blennow K , Lonneborg A , Wyss-Coray T , Soares H , Bazenet C , Sjogren M , Hu W , Lovestone S , Karsdal MA , Weiner MW ((2014) ) The future of blood-based biomarkers for Alzheimer’s disease. Alzheimers Dement 10: , 115–131. |
[6] | Snyder HM , Carrillo MC , Grodstein F , Henriksen K , Jeromin A , Lovestone S , Mielke MM , O’Bryant S , Sarasa M , Sjogren M , Soares H , Teeling J , Trushina E , Ward M , West T , Bain LJ , Shineman DW , Weiner M , Fillit HM ((2014) ) Developing novel blood-based biomarkers for Alzheimer’s disease. Alzheimers Dement 10: , 109–114. |
[7] | Olsson B , Lautner R , Andreasson U , Ohrfelt A , Portelius E , Bjerke M , Holtta M , Rosen C , Olsson C , Strobel G , Wu E , Dakin K , Petzold M , Blennow K , Zetterberg H ((2016) ) CSF and blood biomarkers for the diagnosis of Alzheimer’s disease: A systematic review and meta-analysis. Lancet Neurol 15: , 673–684. |
[8] | Yaffe K , Weston A , Graff-Radford NR , Satterfield S , Simonsick EM , Younkin SG , Younkin LH , Kuller L , Ayonayon HN , Ding J , Harris TB ((2011) ) Association of plasma beta-amyloid level and cognitive reserve with subsequent cognitive decline. JAMA 305: , 261–266. |
[9] | Yaffe K , Lindquist K , Penninx BW , Simonsick EM , Pahor M , Kritchevsky S , Launer L , Kuller L , Rubin S , Harris T ((2003) ) Inflammatory markers and cognition in well-functioning African-American and white elders. Neurology 61: , 76–80. |
[10] | Jordanova V , Stewart R , Davies E , Sherwood R , Prince M ((2007) ) Markers of inflammation and cognitive decline in an African-Caribbean population. Int J Geriatr Psychiatry 22: , 966–973. |
[11] | N’Songo A , Carrasquillo MM , Wang X , Burgess JD , Nguyen T , Asmann YW , Serie DJ , Younkin SG , Allen M , Pedraza O , Duara R , Greig Custo MT , Graff-Radford NR , Ertekin-Taner N ((2017) ) African American exome sequencing identifies potential risk variants at Alzheimer disease loci. Neurol Genet 3: , e141. |
[12] | N’Songo A , Carrasquillo MM , Wang X , Nguyen T , Asmann Y , Younkin SG , Allen M , Duara R , Custo MT , Graff-Radford N , Ertekin-Taner N ((2017) ) Comprehensive screening for disease risk variants in early-onset Alzheimer’s disease genes in African Americans identifies novel PSEN variants. J Alzheimers Dis 56: , 1215–1222. |
[13] | Brosseron F , Krauthausen M , Kummer M , Heneka MT ((2014) ) Body fluid cytokine levels in mild cognitive impairment and Alzheimer’s disease: A comparative overview. Mol Neurobiol 50: , 534–544. |
[14] | Lee KS , Chung JH , Choi TK , Suh SY , Oh BH , Hong CH ((2009) ) Peripheral cytokines and chemokines in Alzheimer’s disease. Dement Geriatr Cogn Disord 28: , 281–287. |
[15] | McKhann GM , Knopman DS , Chertkow H , Hyman BT , Jack CR Jr. , Kawas CH , Klunk WE , Koroshetz WJ , Manly JJ , Mayeux R , Mohs RC , Morris JC , Rossor MN , Scheltens P , Carrillo MC , Thies B , Weintraub S , Phelps CH ((2011) ) The diagnosis of dementia due to Alzheimer’s disease: Recommendations from the National Institute on Aging-Alzheimer’s Association workgroups on diagnostic guidelines for Alzheimer’s disease. Alzheimers Dement 7: , 263–269. |
[16] | Allen M , Kachadoorian M , Quicksall Z , Zou F , Chai HS , Younkin C , Crook JE , Pankratz VS , Carrasquillo MM , Krishnan S , Nguyen T , Ma L , Malphrus K , Lincoln S , Bisceglio G , Kolbert CP , Jen J , Mukherjee S , Kauwe JK , Crane PK , Haines JL , Mayeux R , Pericak-Vance MA , Farrer LA , Schellenberg GD , Parisi JE , Petersen RC , Graff-Radford NR , Dickson DW , Younkin SG , Ertekin-Taner N ((2014) ) Association of MAPT haplotypes with Alzheimer’s disease risk and MAPT brain gene expression levels. Alzheimers Res Ther 6: , 39. |
[17] | Logue MW , Schu M , Vardarajan BN , Buros J , Green RC , Go RC , Griffith P , Obisesan TO , Shatz R , Borenstein A , Cupples LA , Lunetta KL , Fallin MD , Baldwin CT , Farrer LA ((2011) ) A comprehensive genetic association study of Alzheimer disease in African Americans. Arch Neurol 68: , 1569–1579. |
[18] | Wilson DH , Rissin DM , Kan CW , Fournier DR , Piech T , Campbell TG , Meyer RE , Fishburn MW , Cabrera C , Patel PP , Frew E , Chen Y , Chang L , Ferrell EP , von Einem V , McGuigan W , Reinhardt M , Sayer H , Vielsack C , Duffy DC ((2016) ) The Simoa HD-1 analyzer: A novel fully automated digital immunoassay analyzer with single-molecule sensitivity and multiplexing. J Lab Autom 21: , 533–547. |
[19] | Zetterberg H , Wilson D , Andreasson U , Minthon L , Blennow K , Randall J , Hansson O ((2013) ) Plasma tau levels in Alzheimer’s disease. Alzheimers Res Ther 5: , 9. |
[20] | Mattsson N , Zetterberg H , Janelidze S , Insel PS , Andreasson U , Stomrud E , Palmqvist S , Baker D , Tan Hehir CA , Jeromin A , Hanlon D , Song L , Shaw LM , Trojanowski JQ , Weiner MW , Hansson O , Blennow K ((2016) ) Plasma tau in Alzheimer disease. Neurology 87: , 1827–1835. |
[21] | Chiu MJ , Chen YF , Chen TF , Yang SY , Yang FP , Tseng TW , Chieh JJ , Chen JC , Tzen KY , Hua MS , Horng HE ((2014) ) Plasma tau as a window to the brain-negative associations with brain volume and memory function in mild cognitive impairment and early Alzheimer’s disease. Hum Brain Mapp 35: , 3132–3142. |
[22] | Mehta PD , Pirttila T , Mehta SP , Sersen EA , Aisen PS , Wisniewski HM ((2000) ) Plasma and cerebrospinal fluid levels of amyloid beta proteins 1–40 and 1–42 in Alzheimer disease. Arch Neurol 57: , 100–105. |
[23] | Fukumoto H , Tennis M , Locascio JJ , Hyman BT , Growdon JH , Irizarry MC ((2003) ) Age but not diagnosis is the main predictor of plasma amyloid beta-protein levels. Arch Neurol 60: , 958–964. |
[24] | Mayeux R , Schupf N ((2011) ) Blood-based biomarkers for Alzheimer’s disease: Plasma Abeta40 and Abeta42, and genetic variants. Neurobiol Aging 32 Suppl 1: , S10–19. |
[25] | Mayeux R , Tang MX , Jacobs DM , Manly J , Bell K , Merchant C , Small SA , Stern Y , Wisniewski HM , Mehta PD ((1999) ) Plasma amyloid beta-peptide 1-42 and incipient Alzheimer’s disease. Ann Neurol 46: , 412–416. |
[26] | Schupf N , Tang MX , Fukuyama H , Manly J , Andrews H , Mehta P , Ravetch J , Mayeux R ((2008) ) Peripheral Abeta subspecies as risk biomarkers of Alzheimer’s disease. Proc Natl Acad Sci U S A 105: , 14052–14057. |
[27] | Graff-Radford NR , Crook JE , Lucas J , Boeve BF , Knopman DS , Ivnik RJ , Smith GE , Younkin LH , Petersen RC , Younkin SG ((2007) ) Association of low plasma Abeta42/Abeta40 ratios with increased imminent risk for mild cognitive impairment and Alzheimer disease. Arch Neurol 64: , 354–362. |
[28] | Heppner FL , Ransohoff RM , Becher B ((2015) ) Immune attack: The role of inflammation in Alzheimer disease. Nat Rev Neurosci 16: , 358–372. |
[29] | Huang CW , Wang SJ , Wu SJ , Yang CC , Huang MW , Lin CH , Cheng IH ((2013) ) Potential blood biomarker for disease severity in the Taiwanese population with Alzheimer’s disease. Am J Alzheimers Dis Other Demen 28: , 75–83. |
[30] | Oe Y , Mochizuki K , Miyauchi R , Misaki Y , Kasezawa N , Tohyama K , Goda T ((2015) ) Plasma TNF-alpha is associated with inflammation and nutrition status in community-dwelling Japanese elderly. J Nutr Sci Vitaminol (Tokyo) 61: , 263–269. |
[31] | Ertekin-Taner N , Younkin LH , Yager DM , Parfitt F , Baker MC , Asthana S , Hutton ML , Younkin SG , Graff-Radford NR ((2008) ) Plasma amyloid beta protein is elevated in late-onset Alzheimer disease families. Neurology 70: , 596–606. |
[32] | Nakamura T , Kawarabayashi T , Seino Y , Hirohata M , Nakahata N , Narita S , Itoh K , Nakaji S , Shoji M ((2018) ) Aging and APOE-epsilon4 are determinative factors of plasma Abeta42 levels. Ann Clin Transl Neurol 5: , 1184–1191. |
[33] | Mayeux R , Honig LS , Tang MX , Manly J , Stern Y , Schupf N , Mehta PD ((2003) ) Plasma A[beta]40 and A[beta]42 and Alzheimer’s disease: Relation to age, mortality, and risk. Neurology 61: , 1185–1190. |
[34] | Blasko I , Jellinger K , Kemmler G , Krampla W , Jungwirth S , Wichart I , Tragl KH , Fischer P ((2008) ) Conversion from cognitive health to mild cognitive impairment and Alzheimer’s disease: Prediction by plasma amyloid beta 42, medial temporal lobe atrophy and homocysteine. Neurobiol Aging 29: , 1–11. |
[35] | Blennow K , Zetterberg H ((2018) ) Biomarkers for Alzheimer’s disease: Current status and prospects for the future. J Intern Med 284: , 643–663. |
[36] | Lue LF , Pai MC , Chen TF , Hu CJ , Huang LK , Lin WC , Wu CC , Jeng JS , Blennow K , Sabbagh MN , Yan SH , Wang PN , Yang SY , Hatsuta H , Morimoto S , Takeda A , Itoh Y , Liu J , Xie H , Chiu MJ ((2019) ) Age-dependent relationship between plasma Abeta40 and Abeta42 and total tau levels in cognitively normal subjects. Front Aging Neurosci 11: , 222. |
[37] | Michaud M , Balardy L , Moulis G , Gaudin C , Peyrot C , Vellas B , Cesari M , Nourhashemi F ((2013) ) Proinflammatory cytokines, aging, and age-related diseases. J Am Med Dir Assoc 14: , 877–882. |
[38] | Ertekin-Taner N ((2007) ) Genetics of Alzheimer’s disease: A centennial review. Neurol Clin 25: , 611–667, v. |
[39] | Tekola Ayele F , Doumatey A , Huang H , Zhou J , Charles B , Erdos M , Adeleye J , Balogun W , Fasanmade O , Johnson T , Oli J , Okafor G , Amoah A , Eghan BA Jr. , Agyenim-Boateng K , Acheampong J , Adebamowo CA , Herbert A , Gerry N , Christman M , Chen G , Shriner D , Adeyemo A , Rotimi CN ((2012) ) Genome-wide associated loci influencing interleukin (IL)-10, IL-1Ra, and IL-6 levels in African Americans. Immunogenetics 64: , 351–359. |
[40] | Demirovic J , Prineas R , Loewenstein D , Bean J , Duara R , Sevush S , Szapocznik J ((2003) ) Prevalence of dementia in three ethnic groups: The South Florida program on aging and health. Ann Epidemiol 13: , 472–478. |
[41] | Williams MM , Scharff DP , Mathews KJ , Hoffsuemmer JS , Jackson P , Morris JC , Edwards DF ((2010) ) Barriers and facilitators of African American participation in Alzheimer disease biomarker research. Alzheimer Dis Assoc Disord 24 Suppl: , S24–29. |
[42] | Shen XN , Niu LD , Wang YJ , Cao XP , Liu Q , Tan L , Zhang C , Yu JT ((2019) ) Inflammatory markers in Alzheimer’s disease and mild cognitive impairment: A meta-analysis and systematic review of 170 studies. J Neurol Neurosurg Psychiatry 90: , 590–598. |
[43] | Koyama A , Okereke OI , Yang T , Blacker D , Selkoe DJ , Grodstein F ((2012) ) Plasma amyloid-beta as a predictor of dementia and cognitive decline: A systematic review and meta-analysis. Arch Neurol 69: , 824–831. |
[44] | Baranowska-Bik A , Bik W , Wolinska-Witort E , Martynska L , Chmielowska M , Barcikowska M , Baranowska B ((2008) ) Plasma beta amyloid and cytokine profile in women with Alzheimer’s disease. Neuro Endocrinol Lett 29: , 75–79. |
[45] | Dursun E , Gezen-Ak D , Hanagasi H , Bilgic B , Lohmann E , Ertan S , Atasoy IL , Alaylioglu M , Araz OS , Onal B , Gunduz A , Apaydin H , Kiziltan G , Ulutin T , Gurvit H , Yilmazer S ((2015) ) The interleukin 1 alpha, interleukin 1 beta, interleukin 6 and alpha-2-macroglobulin serum levels in patients with early or late onset Alzheimer’s disease, mild cognitive impairment or Parkinson’s disease. J Neuroimmunol 283: , 50–57. |
[46] | Tang MX , Stern Y , Marder K , Bell K , Gurland B , Lantigua R , Andrews H , Feng L , Tycko B , Mayeux R ((1998) ) The APOE-epsilon4 allele and the risk of Alzheimer disease among African Americans, whites, and Hispanics. JAMA 279: , 751–755. |


