
Evidence for the Utility of Actuarial Neuropsychological Criteria Across the Continuum of Normal Aging, Mild Cognitive Impairment, and Dementia
Abstract
Background:
Research suggests that actuarial neuropsychological criteria improve the accuracy of mild cognitive impairment (MCI) diagnoses relative to conventional diagnostic methods.
Objective:
We sought to examine the utility of actuarial criteria relative to consensus diagnostic methods used in the National Alzheimer’s Coordinating Center (NACC) Uniform Data Set (UDS), and more broadly across the continuum of normal aging, MCI, and dementia.
Methods:
We compared rates of cognitively normal (CN), MCI, and dementia diagnoses at baseline using actuarial versus consensus diagnostic methods in 1524 individuals from the NACC UDS.
Results:
Approximately one-third (33.59%) of individuals diagnosed as CN and more than one-fifth (22.03%) diagnosed with dementia based on consensus methods, met actuarial criteria for MCI. Many participants diagnosed with MCI via consensus methods also appeared to represent possible diagnostic errors. Notably, the CNa/CNc group (i.e., participants diagnosed as CN based on both actuarial [a] and consensus [c] criteria) had a lower proportion of apolipoprotein E ɛ4 carriers than the MCIa/MCIc group, which in turn had a lower proportion of ɛ4 carriers than the dementia (Dem)a/Demc group. Proportions of ɛ4 carriers were comparable between the CNa/CNc and CNa/MCIc, MCIa/MCIc and MCIa/CNc, MCIa/MCIc and MCIa/Demc, and Dema/Demc and Dema/MCIc groups. These results were largely consistent with diagnostic agreement/discrepancy group comparisons on neuropsychological performance.
Conclusion:
The present results extend previous findings and suggest that actuarial neuropsychological criteria may enhance diagnostic accuracy relative to consensus methods, and across the wider continuum of normal aging, MCI, and dementia. Findings have implications for both clinical practice and research.
INTRODUCTION
Research from our group has demonstrated that the use of actuarial neuropsychological criteria [1–3] and cluster-analytic statistical techniques [4–6] enhances diagnostic sensitivity, specificity, and stability, as well as Alzheimer’s disease (AD) biomarker associations in individuals with mild cognitive impairment (MCI) in the Alzheimer’s Disease Neuroimaging Initiative (ADNI) cohort. These empirically-driven methods have yielded distinct cognitive phenotypes (e.g., amnestic, dysnomic, and dysexecutive/mixed MCI) that have also been consistently observed in other study populations (e.g., Mayo Clinic Study of Aging; Framingham Heart Study) [7, 8] but are not well-captured by the conventional diagnostic methods implemented in ADNI. Empirically-driven methods have also led to the identification of a “cluster-derived normal” subgroup in study cohorts such as ADNI that performs within normal limits on comprehensive neuropsychological testing, despite their ADNI MCI diagnosis. Notably, Edmonds et al. [6] showed that 34.2% of individuals conventionally-diagnosed with MCI in ADNI were better classified as cognitively normal (CN) based on cluster analysis (i.e., they performed within normal limits on more extensive cognitive testing relative to a robust normal control group) and thus represented possible false positive diagnostic errors. Further examination of this cluster-derived normal subgroup showed that they had a tendency to overreport subjective cognitive complaints, and had lower rates of functional decline and progression to dementia, a higher rate of reversion to normal cognition, fewer apolipoprotein E (APOE) ɛ4 carriers, and normal AD biomarker levels relative to other MCI subtypes [5, 6, 9, 10]. The high rate of false positive MCI cases observed in the ADNI cohort may be due to the conventional method’s reliance on clinician judgment, subjective complaints, cognitive and functional screening measures, and a single memory score to diagnose MCI [11, 12]. In a subsequent study, Edmonds et al. [13] showed that 7.1% of individuals conventionally-diagnosed as CN in ADNI met actuarial criteria for MCI, highlighting the susceptibility of conventional methods to false negative in addition to false positive diagnostic errors.
According to ADNI criteria, a CN diagnosis requires: the presence or absence of subjective memory complaints, verified by a study partner, beyond what one would expect for age; documented normal memory function by scoring above education-adjusted cutoffs on the Logical Memory II subscale (Delayed Paragraph Recall, Paragraph A only) from the Wechsler Memory Scale-Revised (WMS-R; ≥9 for 16 or more years of education; ≥5 for 8–15 years of education; and ≥ 3 for 0–7 years of education); a Mini-Mental State Exam (MMSE) score between 24–30 (inclusive); a CDR® Dementia Staging Instrument score of 0; and the absence of significant impairment in cognitive functions or activities of daily living. A MCI diagnosis requires: a subjective memory concern reported by the participant, study partner, or clinician; documented abnormal memory function by scoring below education-adjusted cutoffs on the WMS-R Logical Memory II subscale (<11 for 16 or more years of education; <9 for 8–15 years of education; and ≤ 6 for 0–7 years of education); a MMSE score between 24–30 (inclusive); a CDR score of 0.5; and general cognition and functional performance that are sufficiently preserved such that a diagnosis of AD cannot be made. Dementia (due to AD) diagnosis requires: a subjective memory concern reported by the participant, study partner, or clinician; documented abnormal memory function by scoring below education-adjusted cutoffs on the WMS-R Logical Memory II subscale (≤8 for 16 or more years of education; ≤4 for 8–15 years of education; and ≤ 2 for 0–7 years of education); a MMSE score between 20–24 (inclusive); a CDR score of 0.5 or 1.0; and that National Institute of Neurological and Communicative Diseases and Stroke/Alzheimer’s Disease and Related Disorders Association (NINCDS/ADRDA) criteria for probable AD are met. The aforementioned studies highlight a number of limitations of conventional diagnostic methods, such as those employed in ADNI. For example, studies of MCI have provided inconsistent support for a relationship between subjective cognitive complaints and objective neuropsychological performance and some have suggested that incorporating self-reported cognitive complaints into diagnostic criteria may confound impressions and result in diagnostic errors [5, 14, 15]. Additionally, while cognitive screening measures may be helpful for identifying individuals who may benefit from more comprehensive evaluation, they are limited in their diagnostic utility [16–18]. Moreover, relying on a single neuropsychological test score to render diagnostic decisions is likely to result in inaccurate diagnoses both due to the heterogeneity of MCI and dementia profiles [1, 4, 6, 19–21] as well as base rates for low test scores and test variability in older adults [22].
A different set of criteria, termed “consensus” criteria, are implemented by the National Alzheimer’s Coordinating Center (NACC). According to NACC criteria, a CN diagnosis requires that the participant does not meet criteria for MCI or dementia (see below). To render an MCI diagnosis, the diagnosing clinician or team must determine if memory impairment is present (i.e., cognitive complaint is supported by evidence of impairment or decline that is not normal for age, yet functional activities are essentially normal, and the extent of impairment/decline is not sufficient to warrant a dementia diagnosis), based on clinical judgment and/or neuropsychological memory test(s). The same clinical and/or psychometric approach is applied to determine whether other cognitive domains are also impaired. Standard criteria for dementia due to AD or for other non-AD dementia disorders are used to guide dementia diagnoses. The NACC consensus criteria are more consistent with current standards of MCI classification (which include complaints of cognitive impairment or decline, objective evidence of cognitive impairment in any domain, and preserved activities of daily living [11, 23, 24]), but are distinct from the specific diagnostic methods used in ADNI in that they do not require memory impairment for a diagnosis and are therefore more amenable to the heterogeneity of MCI. However, both the consensus approach and the conventional approach leave room for subjectivity in diagnostic decision-making given their use of cognitive and functional screening measures and heavy reliance on clinician judgment. Moreover, it is worth noting that NACC diagnoses are made by either a consensus team or a single physician, with the actual process varying according to each center’s specific protocol. Therefore, examination of whether this inherent variability in the consensus methods implemented in NACC reduces diagnostic accuracy is needed. In contrast, actuarial neuropsychological criteria provide a more objective and standardized approach to clinical diagnosis and are likely to enhance diagnostic sensitivity, specificity, and stability relative to both conventional and other consensus diagnostic approaches, particularly in large, multisite studies. Furthermore, the aforementioned studies that examined the utility of actuarial diagnostic methods focused on individuals who were CN or had MCI [1, 3–6, 13, 15], precluding individuals with more severe cognitive and functional impairment (i.e., dementia). Thus, what also remains unclear is the utility of actuarial neuropsychological criteria across the wider continuum of normal aging, MCI, and dementia.
Here we extend previous investigations of the utility of actuarial neuropsychological criteria by including a novel and more comprehensive analysis of their utility relative to the consensus diagnostic methods implemented in NACC, across the broader continuum of normal aging, MCI, and dementia. Differences in rates of CN, MCI, and dementia diagnoses at baseline, as well as patterns of neuropsychological performance and APOE ɛ4 carrier status, as a function of actuarial versus consensus diagnostic classifications, were examined.
MATERIALS AND METHODS
The NACC Uniform Data Set (UDS) was implemented in 2005 by the National Institute on Aging (NIA) Alzheimer’s Disease Research Centers (ADRCs) program with the intention of longitudinally assessing cognitive and other clinical changes in MCI and dementia due to AD and related disorders (e.g., frontotemporal lobar degeneration, Lewy body disease). Consent is obtained at the individual ADRCs, as approved by individual Institutional Review Boards (IRBs). As determined by the University of Washington Human Subjects Division, the NACC database itself is exempt from IRB review and approval because it does not involve human subjects, as defined by federal and state regulations. The present study utilized data from Versions 1.2 and 2.0 of the UDS (the neuropsychological batteries associated with these two versions are identical), collected at baseline visits conducted across 31 ADRCs from September 2005 to March 2015 (alz.washington.edu). The study was conducted in accord with the Helsinki Declaration of 1975.
Participants
Participants included 1,524 individuals (mean age = 78.88 years, standard deviation [SD] = 8.53; 47.80% male; 91.90% non-Hispanic White): 640 were diagnosed as CN, 353 were diagnosed with MCI, and 531 were diagnosed with dementia at baseline based on consensus diagnostic methods used in NACC (see below for further details). These 1,524 participants had sufficient baseline neuropsychological data to facilitate reclassification of cognitive status using actuarial neuropsychological criteria (see below for further details regarding actuarial diagnostic methods). Inclusion criteria included at least six years of formal education and fluency in English or Spanish. Exclusion criteria included history of neurologic injury (including stroke, traumatic brain injury, or seizures); history of a movement disorder (e.g., Parkinson’s disease); elevated psychiatric symptoms at the time of evaluation (e.g., Geriatric Depression Scale score of 6 or higher); or current residence in a skilled nursing facility, nursing home, or boarding home.
NACC consensus diagnostic methods
The NACC UDS includes demographic information, medical history and medication use, clinical and neurological examination findings, behavioral and functional measures (e.g., Functional Activities Questionnaire [FAQ]), clinical ratings of dementia severity (CDR), and neuropsychological test scores. Clinical diagnosis (including characterization of cognitive status as normal, impaired-not-MCI, MCI, or dementia) is made by either a consensus team or by the evaluating physician, and this process varies according to each ADRC’s protocol [25–27]. Clinician judgment is based on a review of all available information, including CDR scores as well as overall appraisal of neuropsychological test performance. While normative calculators for UDS neuropsychological test data that account for age, sex, and education are available to researchers [28], whether these calculators are implemented clinically, and the extent to which this is done consistently across ADRCs, is unclear.
Actuarial neuropsychological criteria
Actuarial neuropsychological criteria that were used to reclassify cognitive status were adapted from the criteria put forth by Jak et al. [1, 2] and incorporated objective performance on neuropsychological testing (see below for further details regarding the neuropsychological battery) as well as informant-reported ratings of each participant’s daily functioning (i.e., FAQ responses). A regression-based approach incorporating robust normative data from individuals identified in the NACC UDS as those who maintained a clinical diagnosis of normal cognitive status across all UDS visits (n = 317) was used to transform raw scores into demographically-adjusted z-scores (accounting for age, sex, education, and race/ethnicity) for each participant on each neuropsychological measure. A score was considered impaired if it fell more than one standard deviation below the corresponding demographically-adjusted normative mean (i.e., z < –1.0). Further, FAQ scores of 6 or higher were considered reflective of significant functional impairment when differentiating dementia from MCI [29]. Actuarial neuropsychological criteria are defined in Table 1.
Table 1
Actuarial neuropsychological criteria
| Cognitively Normal | MCI | Dementia |
| Criterion of ≥2 impaired scores in ≥1 cognitive domain not met | ≥2 impaired scores in 1 cognitive domain (regardless of FAQ score), or, ≥2 impaired scores in ≥2 cognitive domains + FAQ score <6 | ≥2 impaired scores in ≥2 cognitive domains + FAQ score ≥6 |
Regarding race/ethnicity, preliminary analyses demonstrated that there were no significant differences among Hispanic/Latino, Black or African American, American Indian or Alaska Native, Native Hawaiian or Pacific Islander, Asian, or multiracial groups on raw neuropsychological test scores, whereas non-Hispanic White participants had significantly higher scores compared to all other racial/ethnic groups. Thus, race/ethnicity was coded as a two-level categorical variable (non-Hispanic White, racial/ethnic minority) in the present study.
Neuropsychological battery
Raw neuropsychological test scores were derived from measures encompassing domains of 1) verbal memory (Wechsler Memory Scale [WMS]-III or -R Logical Memory Story A [two separate scores for the Immediate and Delayed Recall conditions], MMSE Orientation [sum of correct items for Time and Place]), 2) language (Boston Naming Test, Category Fluency [two separate scores for the Animals and Vegetables conditions]), 3) attention (Trail Making Test [TMT] Part A, WMS-R Digit Span Forward), and 4) executive functioning/processing speed (TMT Part B, WMS-R Digit Span Backward, Wechsler Adult Intelligence Scale [WAIS] Digit Symbol). Raw FAQ scores were examined as a measure of daily functioning.
APOE ɛ4 carrier status
APOE ɛ4 carrier status (number of ɛ4 allele copies) was derived from the NACC genetic dataset to facilitate the examination of associations between diagnostic group and APOE ɛ4 carrier status. APOE ɛ4 carrier status was available on 1,444 (94.75%) of the 1,524 study participants.
Data analysis
Statistical analyses were conducted in the Statistical Package for the Social Sciences (SPSS) Version 26.
Actuarial diagnostic classifications across NACC consensus diagnoses
To reiterate, a regression-based approach was used to generate age-, sex-, education-, and race/ethnicity-adjusted z-scores for each participant on each neuropsychological measure and reclassify cognitive status using the actuarial neuropsychological criteria defined in Table 1. Frequencies and relative proportions of actuarial diagnostic classifications (CN, MCI, dementia) across NACC consensus diagnoses (CN, MCI, dementia) were examined. For consensus diagnoses, the CN classification was collapsed across original NACC diagnoses of “normal” or “impaired-not-MCI.”
Demographic characteristics
One-way analysis of variance (ANOVA) and chi-square tests (with Bonferroni corrections for multiple comparisons) were conducted to examine actuarial and consensus diagnostic group differences on demographic variables.
Neuropsychological performance
Multivariate analysis of covariance (MANCOVA) tests (with follow-up univariate tests and Bonferroni-corrected pairwise comparisons) were conducted to examine diagnostic group differences on raw neuropsychological test scores across domains of verbal memory, language, attention, and executive functioning/processing speed, and on the FAQ, controlling for age at baseline (years), sex (male, female), education (years), and race/ethnicity (non-Hispanic White, racial/ethnic minority). First, two separate sets of analyses were conducted using actuarial or consensus classifications (CN, MCI, dementia) as 3-level diagnostic group variables. A third analysis was conducted using a 9-level diagnostic agreement/discrepancy group variable to reflect the exhaustive diagnostic classification scheme reflected in Fig. 1 and Table 4. Participants who were 1) actuarially-diagnosed as CN despite receiving consensus diagnoses of dementia or 2) actuarially-diagnosed with dementia despite being diagnosed as CN based on consensus criteria were included in omnibus tests of diagnostic agreement/discrepancy group differences on neuropsychological performance (and APOE ɛ4 carrier status; see below); however, post-hoc comparisons did not focus on these groups due to the small sizes of these subsamples.
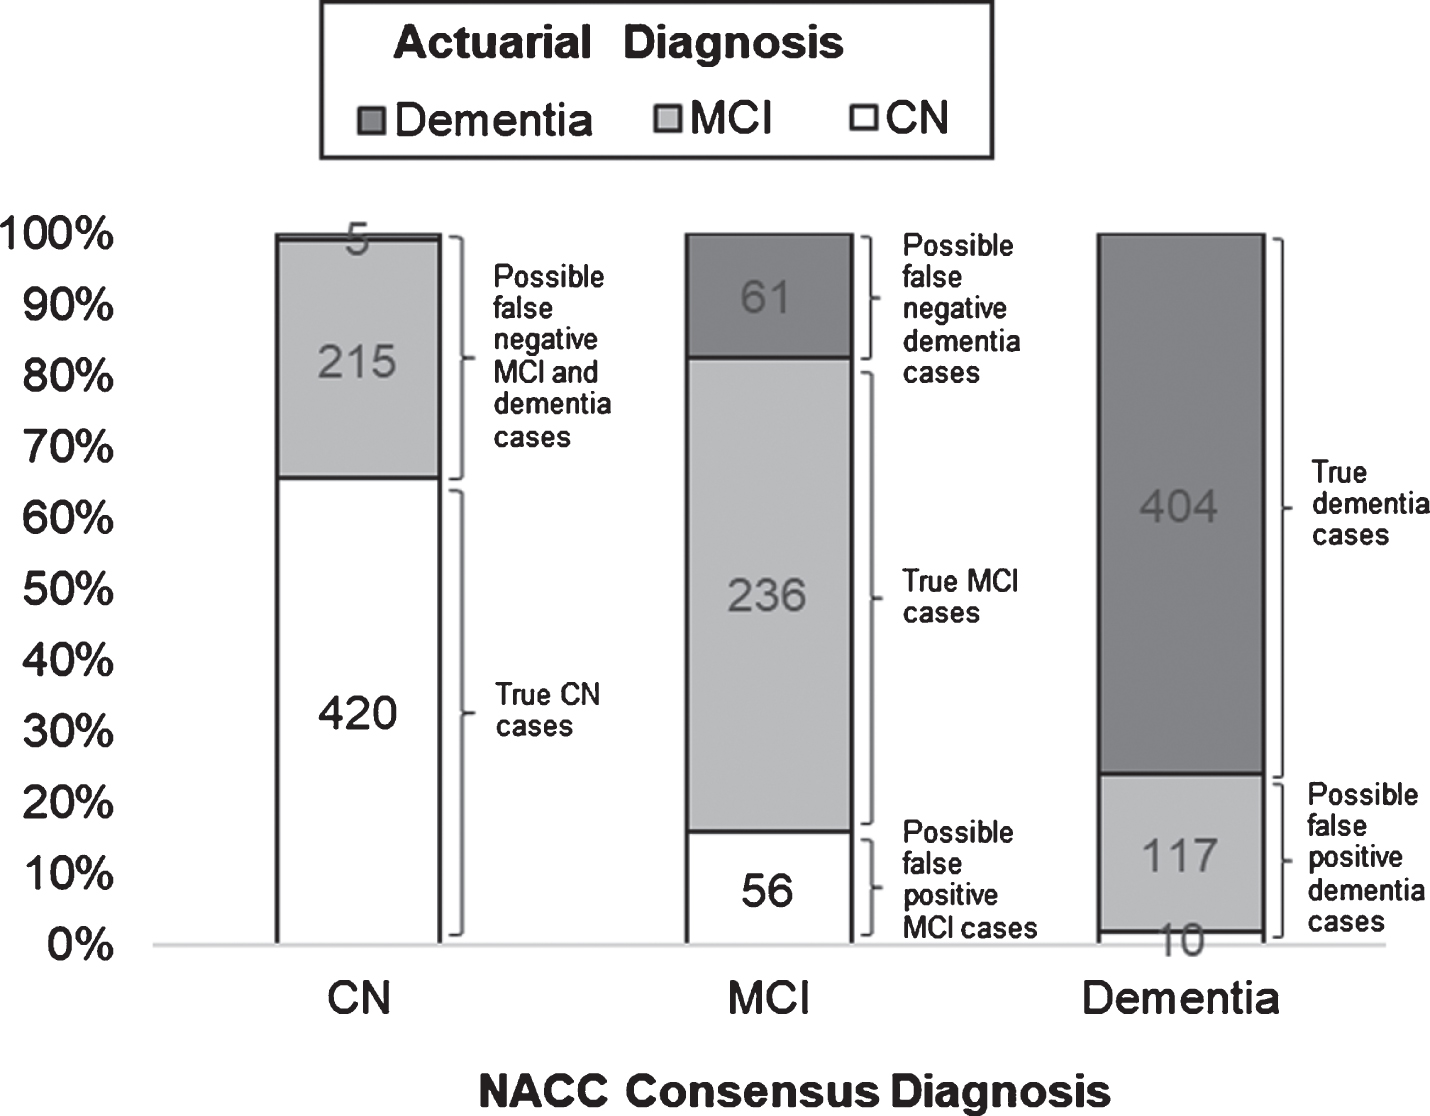
Fig.1
Frequencies and relative proportions of actuarial classifications across NACC consensus diagnoses, with corresponding possible diagnostic errors.
APOE ɛ4 carrier status
Chi-square tests (with Bonferroni-corrected comparisons) were conducted to examine associations between diagnostic group and APOE ɛ4 carrier status. First, two separate 3 (diagnostic group: CN, MCI, dementia)×3 (number of APOE ɛ4 allele copies: 0, 1, 2) chi-square tests were conducted using actuarial or consensus classifications as 3-level diagnostic group variables. A third chi-square test was conducted using the 9-level diagnostic agreement/discrepancy group variable; in this analysis, APOE ɛ4 carrier status was examined as a 2-level variable (ɛ4 negative, ɛ4 positive), given the low numbers of participants with 2 ɛ4 allele copies in multiple diagnostic agreement/discrepancy groups.
Post-Hoc analyses
Post-hoc analyses were conducted to assess the influence of factors that were thought to have potentially contributed to observed discrepancies in classification rates based on actuarial versus consensus diagnostic methods. Chi-square and one-way ANOVA tests (with Bonferroni corrections for multiple comparisons) were conducted to examine diagnostic group differences on global CDR, total MMSE, and GDS scores.
RESULTS
Actuarial diagnostic classifications across NACC consensus diagnoses
Frequencies and relative proportions of actuarial diagnostic classifications across NACC consensus diagnoses, with corresponding possible diagnostic errors, are illustrated in Fig. 1. Of the 640 individuals who were diagnosed as CN based on consensus criteria, 420 (65.63%) were actuarially-diagnosed as CN, whereas 215 (33.59%) had MCI and 5 (0.78%) had dementia based on actuarial neuropsychological criteria. Of the 353 individuals who were diagnosed with MCI based on consensus criteria, 236 (66.86%) were actuarially-diagnosed with MCI, whereas 56 (15.86%) were CN and 61 (17.28%) had dementia based on actuarial criteria. Of the 531 individuals who were diagnosed with dementia based on consensus criteria, 404 (76.08%) were actuarially-diagnosed with dementia, whereas 10 (1.88%) were CN and 117 (22.03%) had MCI based on actuarial criteria.
Demographic characteristics
Descriptive and inferential statistics associated with actuarial and consensus diagnostic group differences on demographic variables are provided in Tables 2 and 3, respectively. One-way ANOVA and chi-square tests revealed significant diagnostic group differences on age and sex, with similar patterns observed using actuarial or consensus diagnoses. Regarding age, the CN group was significantly older than both the MCI and dementia groups (ps < 0.001), and the MCI group was significantly older than the dementia group (p < 0.001). Regarding sex, there was a significantly higher proportion of male participants in the MCI versus CN group, while the dementia group showed a comparable proportion of male participants relative to the CN and MCI groups. There were no actuarial or consensus diagnostic group differences on education or race/ethnicity.
Table 2
Descriptive and inferential statistics associated with actuarial diagnostic group differences on demographic, genetic, neuropsychological, and functional variables
| Actuarial Diagnostic Classifications | ||||||
| CN (n = 486) | MCI (n = 568) | Dementia (n = 470) | F or χ2 | P | Effect Size (η2p or φ2) | |
| Demographic Variables | ||||||
| Age (y) | 81.57 (7.63) | 78.85 (8.32) | 76.13 (8.81) | 51.75 | <0.001 | 0.064 |
| Education (y) | 15.83 (2.75) | 15.70 (2.86) | 15.56 (2.75) | 1.10 | 0.333 | 0.001 |
| Sex (% male) | 43.21% | 52.64% | 46.60% | 9.71 | 0.008 | 0.080 |
| Race/ethnicity (% non-Hispanic White) | 91.98% | 91.55% | 92.34% | 0.22 | 0.896 | 0.012 |
| Genetic Variables | ||||||
| APOE ɛ4 carrier status (n = 1444) | – | – | – | – | – | – |
| No copies ɛ4 allele (n [%]) | 347 (73.67%) | 297 (55.20%) | 178 (40.92%) | 115.48 | <0.001 | 0.200 |
| 1 copy ɛ4 allele (n [%]) | 119 (25.27%) | 194 (36.06%) | 200 (45.98%) | |||
| 2 copies of ɛ4 allele (n [%]) | 5 (1.06%) | 47 (8.74%) | 57 (13.10%) | |||
| Neuropsychological/Functional Measures | ||||||
| Logical Memory - Immediate Recall | 14.62 (3.18) | 9.04 (4.21) | 4.30 (3.61) | 894.16 | <0.001 | 0.541 |
| Logical Memory - Delayed Recall | 13.40 (3.49) | 6.99 (4.76) | 2.00 (3.13) | 985.62 | <0.001 | 0.565 |
| MMSE Orientation - Time and Place | 9.84 (0.44) | 9.19 (1.32) | 6.69 (2.49) | 496.05 | <0.001 | 0.395 |
| BNT | 27.36 (2.48) | 25.20 (4.26) | 20.60 (7.12) | 265.98 | <0.001 | 0.260 |
| Category Fluency - Animals | 20.29 (5.26) | 15.87 (5.00) | 10.59 (4.80) | 473.79 | <0.001 | 0.384 |
| Category Fluency - Vegetables | 14.33 (4.08) | 10.48 (3.58) | 6.87 (3.46) | 541.24 | <0.001 | 0.416 |
| Digit Span - Forward | 8.84 (1.91) | 8.11 (2.15) | 7.13 (2.12) | 66.70 | <0.001 | 0.081 |
| TMT Part A | 37.50 (12.42) | 46.08 (21.35) | 63.99 (32.65) | 181.83 | <0.001 | 0.193 |
| Digit Span - Backward | 7.05 (1.95) | 6.03 (2.07) | 4.84 (1.95) | 125.03 | <0.001 | 0.142 |
| TMT Part B | 94.03 (36.40) | 139.88 (68.71) | 226.44 (81.02) | 550.02 | <0.001 | 0.420 |
| Digit Symbol | 42.82 (10.43) | 37.19 (11.04) | 26.61 (12.01) | 336.44 | <0.001 | 0.307 |
| FAQ | 0.46 (1.50) | 2.83 (5.21) | 17.79 (7.08) | 1365.17 | <0.001 | 0.675 |
APOE, apolipoprotein E; MMSE, Mini-Mental State Examination; BNT, Boston Naming Test; TMT, Trail Making Test; FAQ, Functional Activities Questionnaire; CN, cognitively normal; MCI, mild cognitive impairment.
Table 3
Descriptive and inferential statistics associated with consensus diagnostic group differences on demographic, genetic, neuropsychological, and functional variables
| Consensus Diagnostic Classifications | ||||||
| CN (n = 640) | MCI (n = 353) | Dementia (n = 531) | F or χ2 | P | Effect Size (η2p or φ2) | |
| Demographic Variables | ||||||
| Age (y) | 81.45 (7.48) | 79.03 (8.50) | 75.68 (8.69) | 72.84 | <0.001 | 0.087 |
| Education (y) | 15.75 (2.80) | 15.93 (2.77) | 15.49 (2.78) | 2.85 | 0.058 | 0.004 |
| Sex (% male) | 39.38% | 59.77% | 49.91% | 39.43 | <0.001 | 0.161 |
| Race/ethnicity (% non-Hispanic White) | 92.50% | 93.20% | 90.40% | 2.73 | 0.255 | 0.042 |
| Genetic Variables | ||||||
| APOE ɛ4 carrier status (n = 1444) | – | – | – | – | – | – |
| No copies ɛ4 allele (n [%]) | 447 (71.63%) | 179 (54.57%) | 196 (39.84%) | 134.92 | <0.001 | 0.216 |
| 1 copy ɛ4 allele (n [%]) | 167 (26.76%) | 112 (34.15%) | 234 (47.56%) | |||
| 2 copies of ɛ4 allele (n [%]) | 10 (1.60%) | 37 (11.28%) | 62 (12.60%) | |||
| Neuropsychological/Functional Measures | ||||||
| Logical Memory - Immediate Recall | 13.59 (3.82) | 8.60 (4.36) | 4.76 (3.80) | 681.02 | <0.001 | 0.473 |
| Logical Memory - Delayed Recall | 12.26 (4.13) | 6.40 (4.81) | 2.48 (3.69) | 764.78 | <0.001 | 0.502 |
| MMSE Orientation - Time and Place | 9.80 (0.45) | 9.18 (1.25) | 6.84 (2.49) | 521.97 | <0.001 | 0.408 |
| BNT | 26.92 (2.87) | 25.40 (3.76) | 20.90 (7.17) | 259.52 | <0.001 | 0.255 |
| Category Fluency - Animals | 19.42 (5.38) | 15.46 (4.86) | 11.23 (5.24) | 380.66 | <0.001 | 0.334 |
| Category Fluency - Vegetables | 13.55 (4.14) | 10.23 (3.51) | 7.28 (3.76) | 389.45 | <0.001 | 0.339 |
| Digit Span - Forward | 8.60 (1.96) | 8.35 (2.04) | 7.16 (2.23) | 55.99 | <0.001 | 0.069 |
| TMT Part A | 40.44 (15.83) | 45.42 (20.05) | 61.31 (32.92) | 132.06 | <0.001 | 0.148 |
| Digit Span - Backward | 6.74 (2.05) | 6.20 (2.06) | 4.93 (1.98) | 88.66 | <0.001 | 0.105 |
| TMT Part B | 108.03 (51.32) | 136.58 (68.62) | 215.12 (86.24) | 380.49 | <0.001 | 0.334 |
| Digit Symbol | 41.53 (10.82) | 36.24 (10.71) | 28.37 (12.94) | 245.33 | <0.001 | 0.244 |
| FAQ | 0.50 (1.74) | 4.49 (5.81) | 16.84 (8.19) | 1024.94 | <0.001 | 0.609 |
APOE, apolipoprotein E; MMSE, Mini-Mental State Examination; BNT, Boston Naming Test; TMT, Trail Making Test; FAQ, Functional Activities Questionnaire; CN, cognitively normal; MCI, mild cognitive impairment.
Neuropsychological performance
Actuarial diagnostic group differences on neuropsychological performance
Tables 2 and 3 displays descriptive and inferential statistics associated with actuarial and consensus diagnostic group differences, respectively, on neuropsychological and functional measures. As expected, MANCOVA and follow-up univariate tests revealed significant actuarial diagnostic group differences on tests of memory (F = 337.62, Wilks’ λ = 0.36, p < 0.001, η2p = 0.401), language (F [6, 3030] = 199.03, Wilks’ λ = 0.52, p < 0.001, η2p = 0.283), attention (F [4, 3032] = 108.10, Wilks’ λ = 0.77, p < 0.001, η2p = 0.125), executive functioning/processing speed (F [6, 3030] = 171.60, Wilks’ λ = 0.56, p < 0.001, η2p = 0.254), and daily functioning (see Tables 2 and 3). Post-hoc pairwise comparisons revealed that the CN group had significantly higher scores (or faster completion times) on neuropsychological tests relative to the MCI group, which in turn performed significantly better than the dementia group (ps < 0.001). Additionally, the CN group had significantly lower FAQ scores (indicating higher reported daily functioning skills) than the MCI group, which in turn had significantly lower scores than the dementia group (ps < 0.001; FAQ scores were available for 81.69% and 80.11% of participants actuarially-diagnosed as CN or with MCI, respectively).
Consensus diagnostic group differences on neuropsychological performance
MANCOVA and follow-up univariate tests also revealed significant consensus diagnostic group differences on tests of memory (F [6, 3030] = 284.21, Wilks’ λ = 0.41, p < 0.001, η2p = 0.360), language (F [6, 3030] = 157.97, Wilks’ λ = 0.58, p < 0.001, η2p = 0.238), attention (F [4, 3032] = 81.35, Wilks’ λ = 0.82, p < 0.001, η2p = 0.097), executive functioning/processing speed (F [6, 3030] = 122.66, Wilks’ λ = 0.65, p < 0.001, η2p = 0.195), and daily functioning (see Tables 2 and 3). Post-hoc pairwise comparisons revealed that the CN group performed significantly better than the MCI group, which in turn performed significantly better than the dementia group (ps < 0.005), on most neuropsychological tests, with the exception that the CN and MCI groups performed comparably on Digit Span – Forward (p > 0.05). Additionally, the CN group had significantly lower FAQ scores than the MCI group, which in turn had significantly lower scores than the dementia group (ps < 0.001; FAQ scores were available for 84.53% and 82.44% of participants diagnosed as CN or with MCI based on consensus criteria, respectively).
Diagnostic agreement/discrepancy group differences on neuropsychological performance
Table 4 displays descriptive and inferential statistics associated with diagnostic agreement/discrepancy group differences on neuropsychological and functional measures. Subscripts “a” and “c” are used to indicate actuarial and consensus diagnoses, respectively. Results from MANCOVA and follow-up univariate tests with pairwise comparisons generally demonstrated that 1) the CNa/CNc group performed better than the MCIa/MCIc and MCIa/CNc groups, and 2) the CNa/MCIc group performed better than the MCIa/MCIc group. Similarly, 3) the MCIa/MCIc group performed better than the Dema/Demc and Dema/MCIc groups, and 4) the MCIa/Demc group performed better than the Dema/Demc group. In contrast, performances were comparable between 5) the CNa/CNc and CNa/MCIc groups, 6) the MCIa/CNc and MCIa/MCIc groups, and 7) the MCIa/MCIc and MCIa/Demc groups.
Table 4
Descriptive and inferential statistics associated with diagnostic agreement/discrepancy group differences on neuropsychological and functional measures and APOE ɛ4 carrier status
| Diagnostic Agreement/Discrepancy Group | |||||||||||
| CNa/CNca n = 420 | CNa/MCIcb n = 56 | MCIa/CNcc n = 215 | MCIa/MCIcd n = 236 | MCIa/Demce n = 117 | Dema/MCIcf n = 61 | Dema/Demcg n = 404 | F or χ2 | p | Effect Size (η2p or φ2) | Pairwise Comparisons | |
| Genetic Variables | |||||||||||
| APOE ɛ4 status (n = 1444) | – | – | – | – | – | – | – | 127.93 | <0.001 | 0.298 | – |
| ɛ4 negative (n [%]) | 308 (74.94%) | 36 (69.23%) | 135 (64.90%) | 118 (54.13%) | 44 (39.29%) | 25 (43.10%) | 149 (40.05%) | – | – | – | – |
| ɛ4 positive (n [%]) | 103 (25.06%) | 16 (30.77%) | 73 (35.10%) | 100 (45.87%) | 68 (60.71%) | 33 (56.90%) | 223 (59.95%) | – | – | – | – |
| Neuropsychological/Functional Measures | |||||||||||
| Memory | – | – | – | – | – | – | – | 100.14 (λ = 0.28) | <0.001 | 0.345 | – |
| Logical Memory - Immediate Recall | 14.82 (3.21) | 13.39 (2.76) | 11.32 (3.74) | 8.04 (4.00) | 6.88 (3.47) | 6.38 (3.73) | 3.95 (3.45) | 273.58 | <0.001 | 0.592 | a > d, a > c, b > d, c > d, b > c, d > g, d > f, e > g, f > g |
| Logical Memory - Delayed Recall | 13.60 (3.52) | 11.98 (3.08) | 9.77 (3.98) | 5.78 (4.37) | 4.35 (4.29) | 3.67 (3.79) | 1.68 (2.86) | 316.43 | <0.001 | 0.626 | a > d, a > c, b > d, c > d, b > c, d > g, d > f, e > g, d > e, f > g |
| MMSE Orientation - Time and Place | 9.86 (0.40) | 9.71 (0.59) | 9.71 (0.50) | 9.20 (1.16) | 8.22 (1.97) | 8.59 (1.74) | 6.38 (2.46) | 168.04 | <0.001 | 0.471 | a > d, c > d, d > g, e > g, d > e, f > g |
| Language | – | – | – | – | – | – | – | 54.48 (λ = 0.47) | <0.001 | 0.223 | – |
| BNT | 27.48 (2.38) | 26.71 (2.85) | 25.88 (3.37) | 25.18 (4.03) | 23.99 (5.69) | 25.05 (3.20) | 19.88 (7.32) | 82.08 | <0.001 | 0.303 | a > d, a > c, d > g, e > g, f > g |
| Category Fluency - Animals | 20.60 (5.30) | 18.23 (4.49) | 17.24 (4.82) | 15.38 (4.74) | 14.36 (5.24) | 13.25 (4.46) | 10.13 (4.71) | 134.24 | <0.001 | 0.415 | a > d, a > c, b > d, a > b, c > d, d > g, d > f, e > g, f > g |
| Category Fluency - Vegetables | 14.64 (4.10) | 12.29 (3.22) | 11.48 (3.37) | 10.17 (3.47) | 9.28 (3.71) | 8.57 (2.98) | 6.57 (3.45) | 148.82 | <0.001 | 0.441 | a > d, a > c, b > d, a > b, d > g, d > f, e > g, f > g |
| Attention | – | – | – | – | – | – | – | 29.78 (λ = 0.75) | <0.001 | 0.136 | – |
| Digit Span - Forward | 8.86 (1.90) | 8.80 (2.07) | 8.13 (1.99) | 8.37 (2.05) | 7.54 (2.51) | 7.84 (1.89) | 7.03 (2.15) | 18.86 | <0.001 | 0.091 | a > c, d > g |
| TMT Part A* | 37.15 (12.08) | 39.93 (14.57) | 46.20 (19.37) | 45.38 (20.48) | 47.25 (26.14) | 50.59 (21.57) | 65.95 (33.65) | 49.30 | <0.001 | 0.207 | a > d, a > c, d > g, e > g, f > g |
| Executive Functioning/Processing Speed | – | – | – | – | – | – | 45.09 (λ = 0.53) | <0.001 | 0.192 | – | |
| Digit Span - Backward | 7.10 (2.00) | 6.80 (1.62) | 6.06 (1.97) | 6.15 (2.14) | 5.72 (2.07) | 5.84 (2.01) | 4.68 (1.91) | 33.94 | <0.001 | 0.152 | a > d, a > c, d > g, e > g, f > g |
| TMT Part B* | 93.30 (36.30) | 99.34 (38.53) | 134.47 (62.04) | 135.00 (65.34) | 159.69 (82.61) | 176.85 (81.15) | 234.15 (78.65) | 150.78 | <0.001 | 0.444 | a > d, a > c, b > d, b > c, d > g, d > f, e > g, d > e, f > g |
| Digit Symbol | 43.36 (10.26) | 38.75 (8.90) | 38.24 (10.95) | 36.56 (10.65) | 36.53 (11.91) | 32.72 (11.70) | 25.65 (11.82) | 91.18 | <0.001 | 0.326 | a > d, a > c, d > g, d > f, e > g, f > g |
| Daily Functioning | – | – | – | – | – | – | – | – | – | – | – |
| FAQ* | 0.27 (0.82) | 1.64 (2.67) | 0.64 (1.76) | 2.62 (3.91) | 7.99 (8.35) | 12.18 (5.80) | 18.71 (6.85) | 439.44 | <0.001 | 0.729 | a > d, c > d, d > g, d > f, e > g, d > e, f > g, e > f |
APOE, apolipoprotein E; MMSE, Mini-Mental State Examination; BNT, Boston Naming Test; TMT, Trail Making Test; FAQ, Functional Activities Questionnaire; CN, cognitively normal; MCI, mild cognitive impairment; Dem, dementia; *higher scores indicate worse performance on these measures; subscripts “a” and “c” indicate actuarial and consensus diagnoses, respectively; superscripts “a” through “g” denote groups included in pairwise comparisons; CNa/Demc and Dema/CNc groups are included in omnibus analyses but not a focus of pairwise comparisons and therefore not displayed in table.
APOE ɛ4 carrier status
Chi-square tests revealed significant associations between diagnostic group and APOE ɛ4 carrier status using actuarial or consensus classifications (see Tables 2 and 3), as well as diagnostic agreement/discrepancy groupings (see Table 4 and Fig. 2).
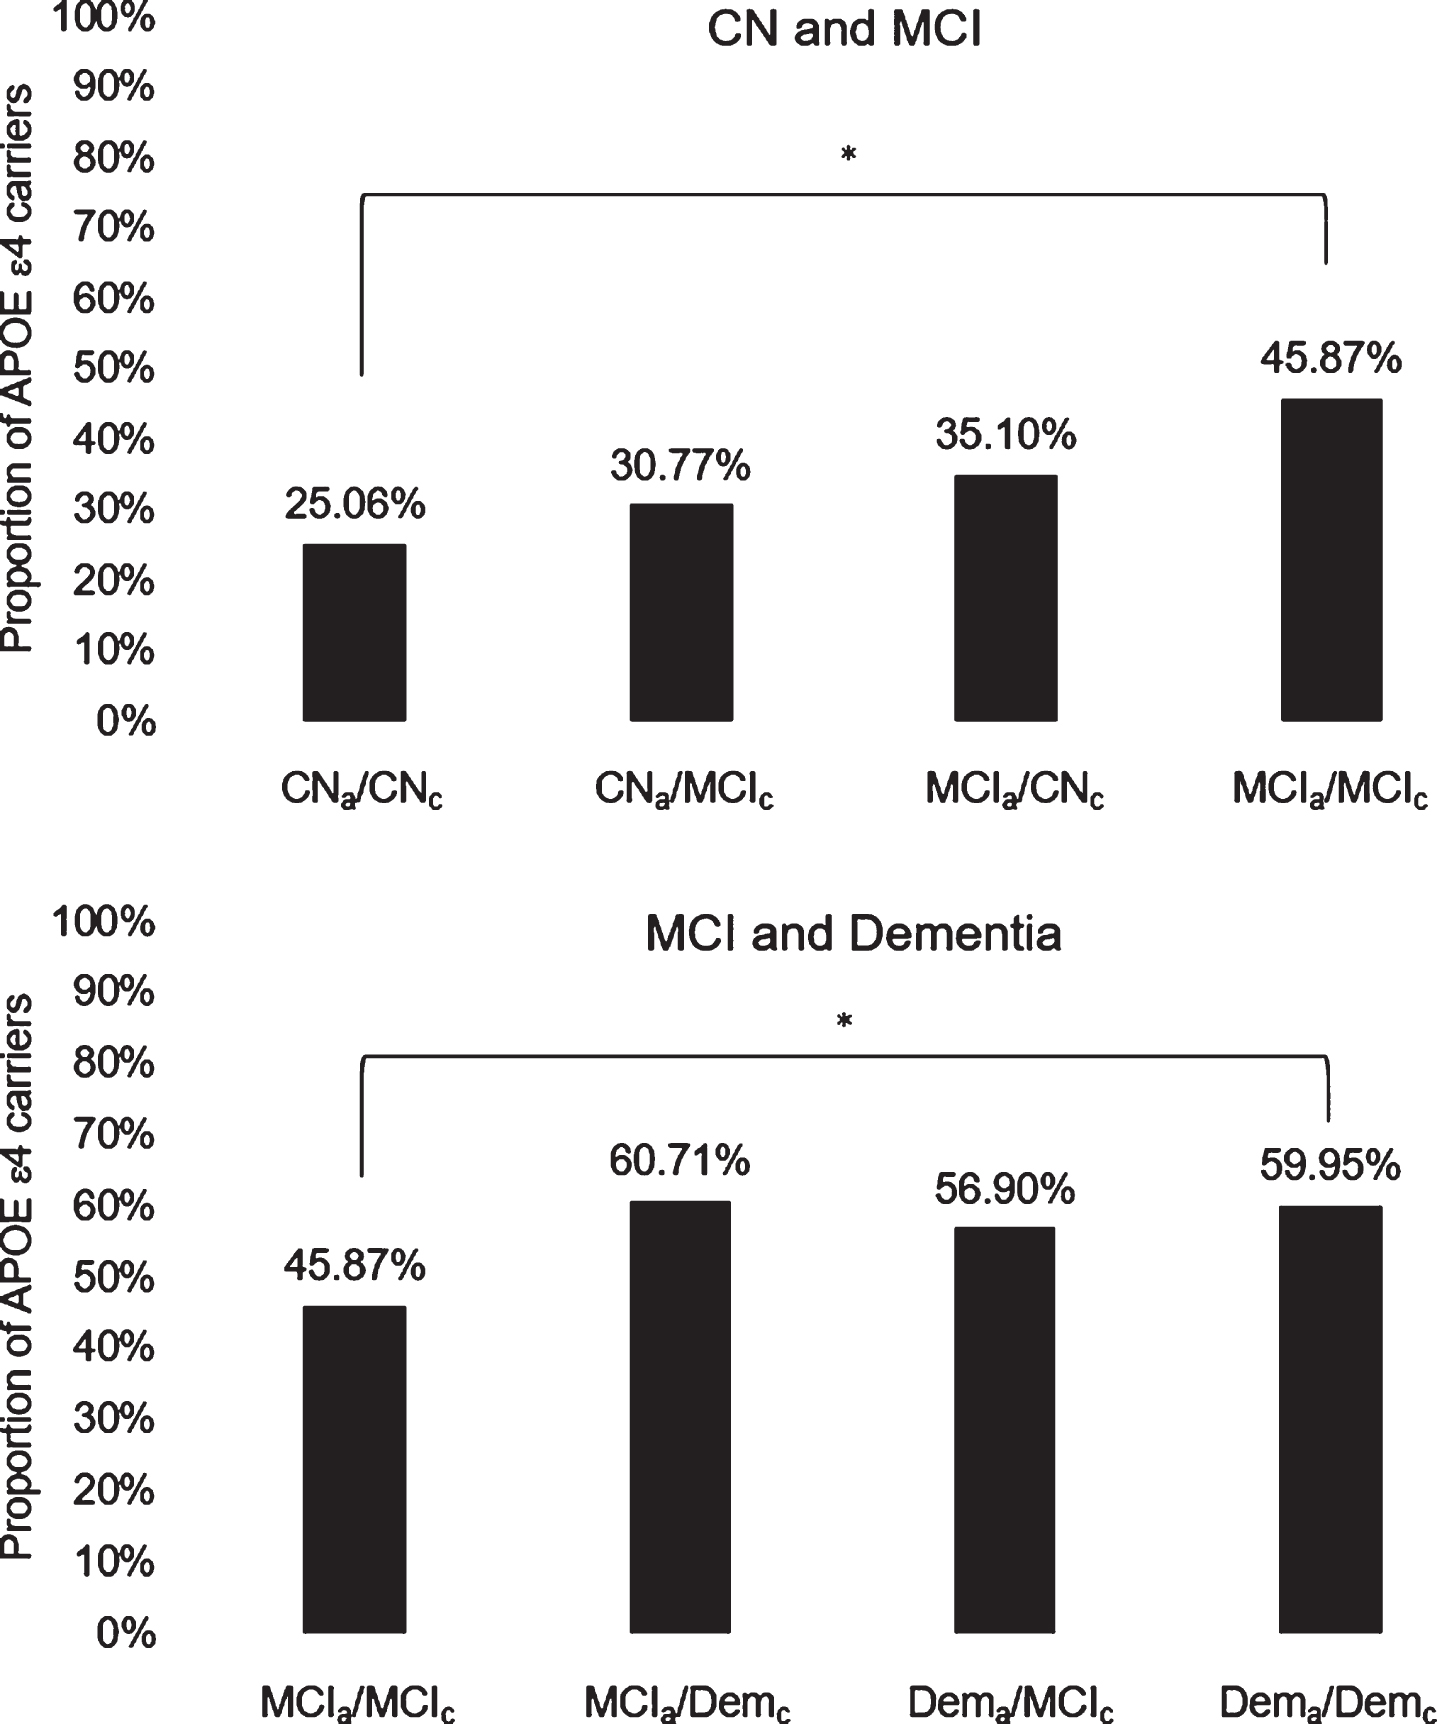
Fig.2
Diagnostic agreement/discrepancy group differences on APOE ɛ4 carrier status across CN and MCI groups (top) and MCI and dementia groups (bottom). APOE, apolipoprotein E; CN, cognitively normal; MCI, mild cognitive impairment; Dem, dementia; subscripts “a” and “c” indicate actuarial and consensus diagnoses, respectively; *denotes significant group difference following Bonferroni correction for multiple comparisons.
Actuarial diagnostic group differences on APOE ɛ4 carrier status
There was a significant negative trend in the proportions of participants with no ɛ4 alleles across actuarial diagnostic classifications of CN, MCI, and dementia (ps < 0.05). In contrast, there was a significant positive trend in the proportions of participants with 1 ɛ4 allele across actuarial diagnostic classifications (ps < 0.05). Proportions of participants with 2 ɛ4 alleles were significantly higher among those actuarially-diagnosed with MCI or dementia versus those actuarially-diagnosed as CN (ps < 0.05).
Consensus diagnostic group differences on APOE ɛ4 carrier status
There was a significant negative trend in the proportions of participants with no ɛ4 alleles across consensus diagnostic classifications of CN, MCI, and dementia (as was observed in the context of actuarial diagnoses; ps < 0.05). Proportions of participants with 1 ɛ4 allele were significantly higher among those with consensus diagnoses of dementia versus those diagnosed as CN or with MCI based on consensus criteria (in contrast to a positive linear trend across all three diagnostic groups which was observed in the context of actuarial diagnoses; ps < 0.05). Proportions of participants with 2 ɛ4 alleles were significantly higher among those with consensus diagnoses of MCI or dementia versus those diagnosed as CN based on consensus criteria (as was observed in the context of actuarial diagnoses; ps < 0.05).
Diagnostic agreement/discrepancy group differences on APOE ɛ4 carrier status
Table 4 displays descriptive and inferential statistics associated with diagnostic agreement/discrepancy group differences on APOE ɛ4 carrier status. Figure 2 illustrates diagnostic agreement/discrepancy group differences on APOE ɛ4 carrier status across CN and MCI groups (top) and MCI and dementia groups (bottom). Chi-square tests revealed that the CNa/CNc group had a significantly lower proportion of ɛ4 positive individuals than the MCIa/MCIc group, which in turn had a significantly lower proportion of ɛ4 positive individuals than the Dema/Demc group (ps < 0.05). No other diagnostic agreement/discrepancy group differences on APOE ɛ4 carrier status were observed. These results corroborated findings from analyses of neuropsychological performance (with the exception that the Dema/Demc and Dema/MCIc groups had comparable proportions of ɛ4 carriers despite showing differences on most neuropsychological measures).
An exploratory post-hoc analysis revealed that, sans corrections for multiple corrections, the CNa/CNc group had a lower proportion of ɛ4 carriers than the MCIa/CNc group, and that the CNa/MCIc group had a lower proportion of ɛ4 carriers than the MCIa/MCIc group; these results were in line with findings from analyses of neuropsychological performance showing that the CNa/CNc group outperformed the MCIa/CNc group on most measures, and that the CNa/MCIc group also performed better than the MCIa/MCIc group on multiple measures. However, sans corrections for multiple comparisons, the MCIa/MCIc group had a higher proportion of ɛ4 carriers than the MCIa/CNc group and a lower proportion of ɛ4 carriers than the MCIa/Demc group, and these results were largely inconsistent with findings from analyses of neuropsychological performance.
Post-hoc analyses of global CDR, total MMSE, and GDS scores
Given the results of our primary analyses, post-hoc analyses were conducted to assess the influence of factors that were thought to have potentially contributed to observed discrepancies in classification rates based on actuarial versus consensus diagnostic methods. Chi-square and ANOVA tests were conducted to examine diagnostic group differences on global CDR, total MMSE, and GDS scores.
Global CDR
Analyses revealed significant associations between diagnostic group and global CDR scores using actuarial classifications, χ2 (8, N = 1524) = 1033.96, p < 0.001, φc = 0.582, consensus classifications, χ2 (8, N = 1524) = 1611.26, p < 0.001, φc = 0.727, and diagnostic agreement/discrepancy groupings, χ2 (32, N = 1524) = 1751.08, p < 0.001, φc = 0.536.
While proportions of participants with a global CDR score of 0 (suggesting normal cognition and functioning, based in part on clinician judgment) significantly decreased across actuarial (CN: 81.89%, MCI: 35.92%, dementia: 0.64%) and consensus (CN: 88.59%, MCI: 8.50%, dementia: 1.51%) diagnostic classifications (ps < 0.05), there appeared to be a slightly higher proportion of individuals diagnosed as CN (and a substantially lower proportion of individuals diagnosed with MCI) based on consensus versus actuarial methods. Moreover, analyses demonstrated that within the actuarial CN and MCI groups, the proportion of individuals with a global CDR score of 0 was significantly higher among those diagnosed as CN based on consensus criteria (92.14%, 82.79%) versus those with consensus diagnoses of MCI (17.86%, 8.47%; ps < 0.05); thus, participants actuarially-diagnosed with MCI despite being diagnosed as CN based on consensus criteria (i.e., individuals in the MCIa/CNc group) represent cases in which global CDR scores may underestimate the severity of deficits.
While proportions of participants with a global CDR score of 0.5 (suggesting very mild dementia, based in part on clinician judgment) were highest among individuals diagnosed with MCI and lowest among individuals diagnosed as CN using actuarial (CN: 17.49%; MCI: 57.04%; dementia: 35.74%) and consensus (CN: 11.41%; MCI: 88.67%; dementia: 35.97%) diagnostic classifications (ps < 0.05), the proportion of participants with MCI appeared to be substantially higher based on consensus versus actuarial methods. Moreover, analyses demonstrated that within the actuarial CN and MCI groups, the proportion of individuals with a global CDR score of 0.5 was significantly higher among those with consensus diagnoses of MCI (82.14%, 90.25%) versus those diagnosed as CN based on consensus criteria (7.86%, 17.21%; ps < 0.05); thus, participants actuarially-diagnosed as CN despite having consensus diagnoses of MCI (i.e., individuals in the CNa/MCIc group) represent cases in which global CDR scores may overestimate the severity of deficits. Additionally, however, some participants actuarially-diagnosed with dementia had a global CDR score of 0.5, and in this group, the proportion of individuals with this score was significantly higher among those with consensus diagnoses of MCI (88.52%) versus those with consensus diagnoses of dementia (27.48%; p < 0.05); thus, participants actuarially-diagnosed with dementia despite having consensus diagnoses of MCI (i.e., individuals in the Dema/MCIc group) represent additional cases in which global CDR scores may underestimate the severity of deficits.
Total MMSE
Analyses revealed significant associations between diagnostic group and total MMSE scores using actuarial classifications, F(2, 1521) = 620.97, p < 0.001, η2p = 0.450, consensus classifications, F(2, 1521) = 703.45, p < 0.001, η2p = 0.481, and diagnostic agreement/discrepancy groupings, F(8, 1515) = 222.02, p < 0.001, η2p = 0.540. There was a significant negative trend (suggesting a decrease in general cognitive functioning) across diagnostic classifications of CN (actuarial: M = 28.84, SD = 1.31; consensus: M = 28.73, SD = 1.39), MCI (actuarial:M = 27.10, SD = 2.60; consensus: M = 27.09, SD = 2.23), and dementia (actuarial: M = 22.42, SD = 4.20; consensus: M = 22.59, SD = 4.17), using actuarial or consensus diagnoses (ps < 0.001). Within the actuarial MCI group, individuals diagnosed as CN based on consensus criteria (i.e., the MCIa/CNc group; M = 28.37, SD = 1.48) had significantly higher total MMSE scores than those with consensus diagnoses of MCI (i.e., the MCIa/MCIc group; M = 27.04, SD = 2.27). Additionally, within the actuarial dementia group, individuals diagnosed with MCI based on consensus criteria (i.e., the Dema/MCIc group; M = 26.28, SD = 2.36) had significantly higher total MMSE scores than those with consensus diagnoses of dementia (i.e., the Dema/Demc group; M = 21.78, SD = 4.09; ps < 0.005).
GDS
Analyses revealed significant associations between diagnostic group and GDS scores using actuarial classifications, F(2, 1521) = 22.97, p < 0.001, η2p = 0.029, consensus classifications, F(2, 1521) = 23.62, p < 0.001, η2p = 0.030, and diagnostic agreement/discrepancy groupings, F(8, 1515) = 8.64, p < 0.001, η2p = 0.044. Using actuarial or consensus diagnoses, GDS scores were significantly lower (indicating fewer reported depressive symptoms) in the CN group (actuarial: M = 1.12, SD = 1.39; consensus: M = 1.17, SD = 1.44) relative to the MCI (actuarial: M = 1.55, SD = 1.49; consensus: M = 1.71, SD = 1.44) and dementia (actuarial: M = 1.75, SD = 1.50; consensus: M = 1.68, SD = 1.50) groups (ps < 0.001), and comparable between the MCI and dementia groups (ps > 0.05). Within the actuarial CN group, individuals with consensus diagnoses of MCI (i.e., the CNa/MCIc group; M = 1.70, SD = 1.48) had significantly higher GDS scores than those diagnosed as CN based on consensus criteria (i.e., the CNa/CNc group; M = 1.03, SD = 1.35; p < 0.001).
DISCUSSION
The present study extends previous investigations of the utility of actuarial neuropsychological criteria by including a novel and more comprehensive analysis of their utility relative to the consensus diagnostic methods implemented in NACC, across the broader continuum of normal aging, MCI, and dementia. Analyses revealed that approximately one-third (33.59%) of individuals diagnosed as CN and more than one-fifth (22.03%) diagnosed with dementia based on consensus criteria, met actuarial neuropsychological criteria for MCI (these represent possible false negative MCI cases and possible false positive dementia cases, respectively). Many participants diagnosed with MCI via consensus methods also appeared to represent possible diagnostic errors (15.86% were actuarially-diagnosed as CN and represent possible false positive MCI cases, whereas 17.28% were actuarially-diagnosed with dementia and represent possible false negative dementia cases).
Analyses of diagnostic agreement/discrepancy group differences on neuropsychological and functional measures revealed that the CNa/CNc group (i.e., participants who were diagnosed as CN based on both actuarial and consensus criteria and therefore likely represent true CN cases) performed significantly better than the MCIa/MCIc group (i.e.,participants diagnosed with MCI based on both criteria, likely representing true MCI cases), which in turn performed significantly better than the Dema/Demc group (i.e., participants diagnosed with dementia based on both criteria, likely representing true dementia cases). Moreover, on most neuropsychological measures, performances were comparable between the CNa/CNc (true CN) and CNa/MCIc (possible false positive MCI) groups, and between the MCIa/MCIc (true MCI) and MCIa/CNc (possible false negative MCI) groups. While performances were also largely comparable between the MCIa/MCIc (true MCI) and MCIa/Demc (possible false positive dementia) groups, the Dema/MCIc (possible false negative dementia) group tended to outperform the Dema/Demc (true dementia) group; this is perhaps partly explained by the possibility that our actuarial neuropsychological criteria may have higher sensitivity for dementia and therefore capture more individuals in milder stages of dementia relative to the consensus diagnostic methods implemented in NACC.
Analyses of APOE ɛ4 carrier status suggested that, relative to consensus diagnoses, actuarial diagnoses more strongly corresponded to the prevalence of the ɛ4 allele (which was highest among participants diagnosed with dementia, followed by MCI, then CN). For example, using consensus criteria, proportions of participants with 1 ɛ4 allele were higher in the dementia group than in the CN or MCI groups (but comparable between the two latter groups). However, using actuarial criteria, there was a significant, positive linear trend across the CN, MCI, and dementia groups, consistent with other AD cohort studies showing higher rates of heterozygous (and homozygous) ɛ4 carriers in individuals with MCI than in those who are CN [30]. Additionally, results from diagnostic agreement/discrepancy group comparisons on APOE ɛ4 carrier status were largely consistent with corresponding group comparisons on neuropsychological performance. However, while proportions of ɛ4 carriers were comparable between the Dema/MCIc (possible false negative dementia) and Dema/Demc (true dementia) groups, the former tended to demonstrate better neuropsychological performance than the latter; this similarity in genetic AD biomarker profiles coupled with contrasting variability in neuropsychological performance further begs the question of whether our actuarial neuropsychological criteria have higher sensitivity for dementia (and therefore capture a wider range of dementia profiles) relative to the consensus criteria in NACC. Taken together, findings from analyses of diagnostic agreement/discrepancy group differences on neuropsychological performance and APOE ɛ4 carrier status suggest that the consensus diagnostic methods implemented in NACC may be prone to false positive and false negative MCI and dementia diagnoses, and thus, provide evidence for the utility of actuarial neuropsychological criteria in enhancing diagnostic sensitivity and specificity as well as genetic AD biomarker associations across the continuum of normal aging, MCI, and dementia.
A number of attributes associated with the consensus diagnostic methods implemented in NACC may have contributed to the observed discrepancies in classification rates. As was previously noted, determinations of cognitive status in NACC are purportedly based on a review of all available information, including CDR scores (which in part are based on clinician judgment). The present study yielded evidence that global CDR scores are more consistent with consensus diagnoses than with performance on comprehensive neuropsychological testing and corresponding actuarial diagnoses. A post-hoc analysis indicated that participants in the MCIa/CNc (possible false negative MCI) and Dema/MCIc (possible false negative dementia) groups represented cases in which global CDR scores may have underestimated the severity of deficits, whereas participants in the CNa/MCIc (possible false positive MCI) group represented cases in which global CDR scores may have overestimated the severity of deficits, resulting in inaccurate diagnoses via consensus methods. Findings from these post-hoc analyses corroborated the observation that approximately one-third of individuals who were diagnosed as CN based on consensus criteria met actuarial neuropsychological criteria for MCI, and that many participants diagnosed with MCI via consensus methods also appeared to represent possible diagnostic errors. Taken together, these findings suggest that diagnoses based on consensus methods implemented in NACC may be heavily biased toward CDR scores, which comes with some risk given that the CDR may not be well suited to capture normal variability in cognitive performance and may therefore inaccurately estimate the extent to which individuals may be experiencing cognitive or functional difficulties [6, 31]. In contrast, actuarial diagnostic methods that incorporate comprehensive neuropsychological data more rigorously are likely to enhance the objectivity and accuracy of diagnoses.
Research also suggests that CDR ratings, as well as subjective cognitive complaints, are susceptible to psychiatric influences [5, 32]. Relatedly, another post-hoc analysis in the present study indicated that participants in the CNa/MCIc (possible false positive MCI) group had significantly higher total GDS scores relative to participants in the CNa/CNc (true CN) group. Another factor that may have contributed to potential misdiagnosis by consensus methods is that general cognitive functioning was assessed using the MMSE in Versions 1.2 and 2.0 of the NACC UDS, and research has shown that the MMSE is limited in its ability to distinguish CN individuals from those with MCI, or individuals with MCI from those with AD [17]. A post-hoc analysis in the present study revealed negative trends in total MMSE scores across diagnostic classifications of CN, MCI, and dementia, as expected, when examining actuarial and consensus diagnoses independently. However, analyses of diagnostic agreement/discrepancy group differences showed that the MCIa/CNc (possible false negative MCI) group had significantly higher total MMSE scores than the MCIa/MCIc (true MCI) group (despite the fact that these groups showed comparable performances on most neuropsychological measures), and the Dema/MCIc (possible false negative dementia) group had significantly higher total MMSE scores than the Dema/Demc (true dementia) group.
The present results extend previous findings showing that the use of actuarial neuropsychological criteria [1, 2] enhances diagnostic sensitivity and specificity as well as AD biomarker associations in individuals with MCI [1, 4–6] by demonstrating the utility of actuarial neuropsychological criteria more broadly across the continuum of normal aging, MCI, and dementia, and that diagnostic errors are not unique to the conventional diagnostic methods used in ADNI. To reiterate, within ADNI, Edmonds et al. [6, 13] found that 34.2% of individuals conventionally-diagnosed with MCI were better classified as CN (based on cluster analysis), and 7.1% of individuals conventionally-diagnosed as CN met actuarial criteria for MCI. In the present study, we found that 15.86% of participants with consensus diagnoses of MCI were actuarially-diagnosed as CN, and 33.59% of participants diagnosed as CN based on consensus criteria met actuarial criteria for MCI. Thus, relative to the conventional diagnostic methods used in ADNI, the consensus diagnostic methods used in NACC may be associated with lower rates of false positive MCI cases and higher rates of false negative MCI cases. However, in addition to differences between the diagnostic methods used in ADNI versus NACC, these discrepancies may also be influenced, at least in part, by inherent differences in demographic and clinical sample characteristics and the number and types of neuropsychological measures available across the two databases.
The results of the present study have significant implications for diagnosis, treatment planning, and other aspects of clinical practice. Consistent with what previous studies have noted, our findings suggest that in order to maximize diagnostic accuracy, clinicians should adopt a comprehensive neuropsychological approach to conceptualization and diagnosis without placing disproportionate weight on subjective complaints, screening measures, or a single impaired neuropsychological test score [6, 13, 14, 17, 32]. Notably, the present study demonstrated that consensus diagnostic methods may result in inaccurate diagnoses of both MCI and dementia. These diagnostic errors, in addition to inaccurate diagnoses that underestimate one’s level of cognitive or functional impairment, can have inadvertent albeit significant consequences. Using actuarial methods in clinical settings to maximize diagnostic sensitivity and specificity is likely to: 1) increase opportunities for valuable intervention (e.g., cognitive rehabilitation, intensive monitoring and/or treatment of relevant medical risk factors, referrals to other appropriate healthcare providers, long-term planning or care) for those who are appropriate candidates and may benefit from such resources; as well as 2) reduce the risk of placing unnecessary or premature restraints on patients’ independence, or increased burden on family members or other caregivers.
Our results also have significant implications for research studies and clinical trials. Enhancing diagnostic sensitivity and specificity through the use of actuarial neuropsychological criteria can improve the rigor of clinical research studies attempting to characterize the preclinical and MCI stages of AD or other neurodegenerative disorders [6, 13]. Reducing diagnostic errors is likely to strengthen observed associations with regard to diagnosis, biomarker abnormalities, rates of progression and reversion, and drug or other intervention effects [33]. Relatedly, Emrani et al. [34] recently discussed the importance of leveraging statistical modeling techniques based on neuropsychological test performance in AD diagnosis and classification schemes, in light of growing evidence for the heterogeneity of underlying neuropathological processes contributing to neuropsychological phenotypes observed along the AD continuum, including in the dementia stage.
Notable strengths of the present study include the use of a large sample and robust norms for generating demographically-adjusted standardized scores on a comprehensive battery of neuropsychological tests. Relatedly, another strength of the present study was the inclusion of race/ethnicity in demographic adjustments of neuropsychological scores. Additionally, we were able to conduct a more comprehensive analysis of diagnostic group differences on APOE ɛ4 carrier status, with ɛ4 carrier status operationalized as a 3-level rather than dichotomous variable in a subset of the analyses.
The present study is not free of limitations. Tests of visuospatial functioning or visual memory were not incorporated into actuarial neuropsychological criteria, as more comprehensive measures of these skills were not included in the NACC UDS until Version 3, which was implemented in September 2015, and we opted to use data from Versions 1.2 and 2.0 to maximize our sample size. In addition, while participants in the NACC UDS reflect the demographic characteristics of individuals who participate in Alzheimer’s and dementia research in the U.S., they are not entirely representative of the general population given their substantially higher average level of education and predominantly Caucasian composition. Moreover, given the relative heterogeneity in NACC diagnostic methods (diagnostic decisions are based on a review of all available information and made either by a consensus team or the evaluating physician, and this process varies across ADRCs), it is possible that, in some cases, the neuropsychological tests that were considered in assigning NACC diagnoses were also incorporated into actuarial diagnoses. In contrast, previous studies conducted by our group using ADNI data incorporated memory tests into actuarial criteria that were independent from those that were used to assign ADNI diagnoses. Furthermore, analyses in the present study focused on neuropsychological performance at baseline, and the extent to which actuarial neuropsychological criteria would yield more accurate progression and reversion rates in the NACC UDS is unclear. Given that other studies have provided evidence for enhanced diagnostic stability using actuarial criteria in ADNI [3, 6, 13], future studies should examine and compare the stability of actuarial versus consensus diagnoses in the NACC UDS. Finally, further investigation of associations between actuarial and consensus diagnoses and other biomarkers available in NACC (e.g., neuroimaging, neuropathology) is warranted.
In sum, our findings highlight the utility of actuarial neuropsychological criteria in enhancing diagnostic sensitivity and specificity at baseline across the continuum of normal aging, MCI, and dementia in the NACC UDS. These findings have implications for improving characterizations of the preclinical and manifest stages of AD or other neurodegenerative disorders in research, as well as diagnosis and treatment planning for individuals with MCI or dementia.
ACKNOWLEDGMENTS
This work was supported by the NIH (R01 AG049810 to M.W.B.; L.V.G. is also supported by P30AG059299), the Alzheimer’s Association (AARG-17-500358 to E.C.E.; AARF-17-528918 to K.R.T.), and the U.S. Department of Veterans Affairs Clinical Sciences Research and Development Service (CDA-2 1IK2 CX001415 to E.C.E.; CDA-2 IK2 CX001865to K.R.T.). The NACC database is funded by NIA/NIH Grant U01 AG016976. NACC data are contributed by the NIA-funded ADRCs: P30 AG019610 (PI Eric Reiman, MD), P30 AG013846 (PI Neil Kowall, MD), P30 AG062428-01 (PI James Leverenz, MD) P50 AG008702 (PI Scott Small, MD), P50 AG025688 (PI Allan Levey, MD, PhD), P50 AG047266 (PI Todd Golde, MD, PhD), P30 AG010133 (PI Andrew Saykin, PsyD), P50 AG005146 (PI Marilyn Albert, PhD), P30 AG062421-01 (PI Bradley Hyman, MD, PhD), P30 AG062422-01 (PI Ronald Petersen, MD, PhD), P50 AG005138 (PI Mary Sano, PhD), P30 AG008051 (PI Thomas Wisniewski, MD), P30 AG013854 (PI Robert Vassar, PhD), P30 AG008017 (PI Jeffrey Kaye, MD), P30 AG010161 (PI David Bennett, MD), P50 AG047366 (PI Victor Henderson, MD, MS), P30 AG010129 (PI Charles DeCarli, MD), P50 AG016573 (PI Frank LaFerla, PhD), P30 AG062429-01(PI James Brewer, MD, PhD), P50 AG023501 (PI Bruce Miller, MD), P30 AG035982 (PI Russell Swerdlow, MD), P30 AG028383 (PI Linda Van Eldik, PhD), P30 AG053760 (PI Henry Paulson, MD, PhD), P30 AG010124 (PI John Trojanowski, MD, PhD), P50 AG005133 (PI Oscar Lopez, MD), P50 AG005142 (PI Helena Chui, MD), P30 AG012300 (PI Roger Rosenberg, MD), P30 AG049638 (PI Suzanne Craft, PhD), P50 AG005136 (PI Thomas Grabowski, MD), P30 AG062715-01 (PI Sanjay Asthana, MD, FRCP), P50 AG005681 (PI John Morris, MD), P50 AG047270 (PI Stephen Strittmatter, MD, PhD).
Authors’ disclosures available online (https://www.j-alz.com/manuscript-disclosures/20-0778r1).
REFERENCES
[1] | Bondi MW , Edmonds EC , Jak AJ , Clark LR , Delano-Wood L , McDonald CR , Nation DA , Libon DJ , Au R , Galasko D , Salmon DP ((2014) ) Neuropsychological criteria for MCI improves diagnostic accuracy. J Alzheimers Dis 42: , 275–289. |
[2] | Jak AJ , Bondi MW , Delano-Wood L , Wierenga C , Corey-Bloom J , Salmon DP , Delis DC ((2009) ) Quantification of five neuropsychological approaches to defining mild cognitive impairment. Am J Geriatr Psychiatry 17: , 368–375. |
[3] | Thomas KR , Edmonds EC , Eppig JS , Wong CG , Weigand AJ , Bangen KJ , Jak AJ , Delano-Wood L , Galasko DR , Salmon DP , Edland SD , Bondi MW ((2019) ) MCI-to-normal reversion using neuropsychological criteria in the Alzheimer’s Disease Neuroimaging Initiative. Alzheimers Dement 15: , 1322–1332. |
[4] | Clark LR , Delano-Wood L , Libon DJ , Mcdonald CR , Nation DA , Bangen KJ , Jak AJ , Au R , Salmon DP , Bondi MW ((2013) ) Are empirically-derived subtypes of mild cognitive impairment consistent with conventional subtypes? J Int Neuropsychol Soc 19: , 635–645. |
[5] | Edmonds EC , Delano-Wood L , Galasko DR , Salmon DP , Bondi MW ((2014) ) Subjective cognitive complaints contribute to misdiagnosis of mild cognitive impairment. J Int Neuropsychol Soc 20: , 836–847. |
[6] | Edmonds EC , Delano-Wood L , Clark LR , Jak AJ , Nation DA , McDonald CR , Libon DJ , Au R , Galasko D , Salmon DP , Bondi MW ((2015) ) Susceptibility of the conventional criteria for mild cognitive impairment to false-positive diagnostic errors. Alzheimers Dement 11: , 415–424. |
[7] | Machulda MM , Lundt ES , Albertson SM , Kremers WK , Mielke MM , Knopman DS , Bondi MW , Petersen RC ((2019) ) Neuropsychological subtypes of incident mild cognitive impairment in the Mayo Clinic Study of Aging. Alzheimers Dement 15: , 878–887. |
[8] | Wong CG , Thomas KR , Edmonds EC , Weigand AJ , Bangen KJ , Eppig JS , Jak AJ , Devine SA , Delano-Wood L , Libon DJ , Edland SD , Au R , Bondi MW ((2018) ) Neuropsychological criteria for mild cognitive impairment in the Framingham Heart Study’s old-old. Dement Geriatr Cogn Disord 46: , 253–265. |
[9] | Bangen KJ , Clark AL , Werhane M , Edmonds EC , Nation DA , Evangelista N , Libon DJ , Bondi MW ((2016) ) Cortical amyloid burden differences across empirically-derived mild cognitive impairment subtypes and interaction with APOE ɛ4 genotype. J Alzheimers Dis 52: , 849–861. |
[10] | Thomas KR , Edmonds EC , Delano-Wood L , Bondi MW ((2017) ) Longitudinal trajectories of informant-reported daily functioning in empirically defined subtypes of mild cognitive impairment. J Int Neuropsychol Soc 23: , 521–527. |
[11] | Petersen RC , Morris JC ((2005) ) Mild cognitive impairment as a clinical entity and treatment target. Arch Neurol 62: , 1160–1163. |
[12] | Petersen RC , Aisen PS , Beckett LA , Donohue MC , Gamst AC , Harvey DJ , Jack CR , Jagust WJ , Shaw LM , Toga AW , Trojanowski JQ , Weiner MW ((2010) ) Alzheimer’s Disease Neuroimaging Initiative (ADNI): Clinical characterization. Neurology 74: , 201–209. |
[13] | Edmonds EC , Delano-Wood L , Jak AJ , Galasko DR , Salmon DP , Bondi MW ((2016) ) “Missed” mild cognitive impairment: High false-negative error rate based on conventional diagnostic criteria. J Alzheimers Dis 52: , 685–691. |
[14] | Lenehan ME , Klekociuk SZ , Summers MJ ((2012) ) Absence of a relationship between subjective memory complaint and objective memory impairment in mild cognitive impairment (MCI): Is it time to abandon subjective memory complaint as an MCI diagnostic criterion? Int Psychogeriatrics 24: , 1505–1514. |
[15] | Thomas KR , Eppig JS , Weigand AJ , Edmonds EC , Wong CG , Jak AJ , Delano-Wood L , Galasko DR , Salmon DP , Edland SD , Bondi MW ((2019) ) Artificially low mild cognitive impairment to normal reversion rate in the Alzheimer’s Disease Neuroimaging Initiative. Alzheimers Dement 15: , 561–569. |
[16] | Block CK , Johnson-Greene D , Pliskin N , Boake C ((2017) ) Discriminating cognitive screening and cognitive testing from neuropsychological assessment: Implications for professional practice. Clin Neuropsychol 31: , 487–500. |
[17] | Mitchell AJ ((2009) ) A meta-analysis of the accuracy of the Mini-Mental State Examination in the detection of dementia and mild cognitive impairment. J Psychiatr Res 43: , 411–431. |
[18] | Roebuck-Spencer TM , Glen T , Puente AE , Denney RL , Ruff RM , Hostetter G , Bianchini KJ ((2017) ) Cognitive screening tests versus comprehensive neuropsychological test batteries: A National Academy of Neuropsychology Education Paper. Arch Clin Neuropsychol 32: , 491–498. |
[19] | Ganguli M , Snitz BE , Saxton JA , Chang CH , Lee C , Vander Bilt J , Hughes TF , Loewenstein DA , Unverzagt FW , Petersen RC ((2011) ) Outcomes of mild cognitive impairment by definition. Arch Neurol 68: , 761–767. |
[20] | Libon DJ , Xie SX , Eppig J , Wicas G , Lamar M , Lippa C , Bettcher BM , Price CC , Giovannetti T , Swenson R , Wambach DM ((2010) ) The heterogeneity of mild cognitive impairment: A neuropsychological analysis. J Int Neuropsychol Soc 16: , 84–93. |
[21] | Ryan J , Fransquet P , Wrigglesworth J , Lacaze P ((2018) ) Phenotypic heterogeneity in dementia: A challenge for epidemiology and biomarker studies. Front Public Health 6: , 181. |
[22] | Binder LM , Iverson GL , Brooks BL ((2009) ) To err is human: “abnormal” neuropsychological scores and variability are common in healthy adults. Arch Clin Neuropsychol 24: , 31–46. |
[23] | Petersen RC ((2004) ) Mild cognitive impairment as a diagnostic entity. J Intern Med 256: , 183–194. |
[24] | Winblad B , Palmer K , Kivipelto M , Jelic V , Fratiglioni L , Wahlund LO , Nordberg A , Bäckman L , Albert M , Almkvist O , Arai H , Basun H , Blennow K , De Leon M , Decarli C , Erkinjuntti T , Giacobini E , Graff C , Hardy J , Jack C , Jorm A , Ritchie K , Van Duijn C , Visser P , Petersen RC ((2004) ) Mild cognitive impairment - beyond controversies, towards a consensus: Report of the International Working Group on mild cognitive impairment. J Intern Med 256: , 240–246. |
[25] | Beekly DL , Ramos EM , Lee WW , Deitrich WD , Jacka ME , Wu J , Hubbard JL , Koepsell TD , Morris JC , Kukull WA , Reiman EM , Kowall N , Landreth G , Shelanski M , Welsh-Bohmer K , Levey AI , Potter H , Ghetti B , Price D , Hyman B , Petersen RC , Sano M , Ferris SH , Mesulam MM , Kaye J , Bennett DA , Yesavage J , Marson D , Beck C , DeCarli C , Cotman C , Cummings JL , Thal LJ , Markesbery W , Gilman S , Trojanowski JQ , DeKosky ST , Chui H , Rosenberg R , Raskind M ((2007) ) The National Alzheimer’s Coordinating Center (NACC) database: The uniform data set. Alzheimer Dis Assoc Disord 21: , 249–258. |
[26] | Morris JC , Weintraub S , Chui HC , Cummings J , DeCarli C , Ferris S , Foster NL , Galasko D , Graff-Radford N , Peskind ER , Beekly D , Ramos EM , Kukull WA ((2006) ) The Uniform Data Set (UDS): Clinical and cognitive variables and descriptive data from Alzheimer disease centers. Alzheimer Dis Assoc Disord 20: , 210–216. |
[27] | Weintraub S , Besser L , Dodge HH , Teylan M , Ferris S , Goldstein FC , Giordani B , Kramer J , Loewenstein D , Marson D , Mungas D , Salmon D , Welsh-Bohmer K , Zhou XH , Shirk SD , Atri A , Kukull WA , Phelps C , Morris JC ((2018) ) Version 3 of the Alzheimer Disease centers’ neuropsychological test battery in the Uniform Data Set (UDS). Alzheimer Dis Assoc Disord 32: , 10–17. |
[28] | Weintraub S , Salmon D , Mercaldo N , Ferris S , Graff-Radford NR , Chui H , Cummings J , DeCarli C , Foster NL , Galasko D , Peskind E , Dietrich W , Beekly DL , Kukull WA , Morris JC ((2009) ) The Alzheimer’s Disease Centers’ Uniform Data Set (UDS): The neuropsychologic test battery. Alzheimer Dis Assoc Disord 23: , 91–101. |
[29] | Teng E , Becker BW , Woo E , Knopman DS , Cummings JL , Lu PH ((2010) ) Utility of the Functional Activities Questionnaire for distinguishing mild cognitive impairment from very mild Alzheimer disease. Alzheimer Dis Assoc Disord 24: , 348–353. |
[30] | Heffernan AL , Chidgey C , Peng P , Masters CL , Roberts BR ((2016) ) The neurobiology and age-related prevalence of the ɛ4 allele of apolipoprotein E in Alzheimer’s disease cohorts. J Mol Neurosci 60: , 316–324. |
[31] | Chang YL , Bondi MW , McEvoy LK , Fennema-Notestine C , Salmon DP , Galasko D , Hagler DJ , Dale AM ((2011) ) Global clinical dementia rating of 0.5 in MCI masks variability related to level of function. Neurology 76: , 652–659. |
[32] | Saxton J , Snitz BE , Lopez OL , Ives DG , Dunn LO , Fitzpatrick A , Carlson MC , DeKosky ST ((2009) ) Functional and cognitive criteria produce different rates of mild cognitive impairment and conversion to dementia. J Neurol Neurosurg Psychiatry 80: , 737–743. |
[33] | Edmonds EC , Ard MC , Edland SD , Galasko DR , Salmon DP , Bondi MW ((2018) ) Unmasking the benefits of donepezil via psychometrically precise identification of mild cognitive impairment: A secondary analysis of the ADCS vitamin E and donepezil in MCI study. Alzheimers Dement (N Y) 4: , 11–18. |
[34] | Emrani S , Lamar M , Price CC , Wasserman V , Matusz E , Au R , Swenson R , Nagele R , Heilman KM , Libon D ((2020) ) Alzheimer’s/vascular spectrum dementia: Classification in addition to diagnosis. J Alzheimers Dis 73: , 63–71. |


