
Corneal Nerve and Brain Imaging in Mild Cognitive Impairment and Dementia
Abstract
Background:
Visual rating of medial temporal lobe atrophy (MTA) is an accepted structural neuroimaging marker of Alzheimer’s disease. Corneal confocal microscopy (CCM) is a non-invasive ophthalmic technique that detects neuronal loss in peripheral and central neurodegenerative disorders.
Objective:
To determine the diagnostic accuracy of CCM for mild cognitive impairment (MCI) and dementia compared to medial temporal lobe atrophy (MTA) rating on MRI.
Methods:
Subjects aged 60–85 with no cognitive impairment (NCI), MCI, and dementia based on the ICD-10 criteria were recruited. Subjects underwent cognitive screening, CCM, and MTA rating on MRI.
Results:
182 subjects with NCI (n = 36), MCI (n = 80), and dementia (n = 66), including AD (n = 19, 28.8%), VaD (n = 13, 19.7%), and mixed AD (n = 34, 51.5%) were studied. CCM showed a progressive reduction in corneal nerve fiber density (CNFD, fibers/mm2) (32.0±7.5 versus 24.5±9.6 and 20.8±9.3, p < 0.0001), branch density (CNBD, branches/mm2) (90.9±46.5 versus 59.3±35.7 and 53.9±38.7, p < 0.0001), and fiber length (CNFL, mm/mm2) (22.9±6.1 versus 17.2±6.5 and 15.8±7.4, p < 0.0001) in subjects with MCI and dementia compared to NCI. The area under the ROC curve (95% CI) for the diagnostic accuracy of CNFD, CNBD, CNFL compared to MTA-right and MTA-left for MCI was 78% (67–90%), 82% (72–92%), 86% (77–95%) versus 53% (36–69%) and 40% (25–55%), respectively, and for dementia it was 85% (76–94%), 84% (75–93%), 85% (76–94%) versus 86% (76–96%) and 82% (72–92%), respectively.
Conclusion:
The diagnostic accuracy of CCM, a non-invasive ophthalmic biomarker of neurodegeneration, was high and comparable with MTA rating for dementia but was superior to MTA rating for MCI.
INTRODUCTION
Dementia is a progressive neurodegenerative disease affecting 40–50 million people worldwide [1, 2]. Therapeutic and psychological interventions for people with early stage dementia can improve cognition, independence, and quality of life [3]. However, the clinical diagnosis of mild cognitive impairment (MCI) or early dementia is challenging due to the insidious onset of disease and gradual cognitive decline. The National Institute on Aging and the Alzheimer’s Association (NIA-AA) has proposed a number of biomarkers that reflect the underlying pathology of the disease to support the diagnosis of MCI and dementia [4, 5].
Medial temporal lobe atrophy (MTA) rating is an established biomarker for neurodegeneration in Alzheimer’s disease (AD) but not for MCI or dementia [4, 5]. There is progressive MTA in subjects with MCI and dementia compared to those with no cognitive impairment (NCI) [6, 7]. MTA rating has been shown to have high diagnostic accuracy for probable [8] and established AD [9, 10]. It can distinguish subjects with and without amnesic MCI and predict transition from NCI to MCI and from MCI to probable AD [11] as well as cognitive decline [12]. MTA has also been reported in patients with vascular dementia (VaD) [13, 14].
Corneal confocal microscopy (CCM) is a rapid non-invasive ophthalmic imaging technique which was originally pioneered for identifying neurodegeneration in diabetic peripheral neuropathy [15–19] and subsequently in a range of other peripheral neuropathies [20]. CCM has recently also been used to identify neuronal injury in a number of central neurodegenerative disorders, including MCI and dementia [21], Parkinson’s disease [22], amyotrophic lateral sclerosis [23], and multiple sclerosis [24–26]. CCM generates in vivo images of the sub-basal nerve plexus and image analysis of corneal nerves is performed using validated image analysis software [27] to reduce inter- and intra-rater variability and quantify corneal nerve morphology [15, 28, 29].
The objective of this study was to compare the diagnostic accuracy of CCM with MTA rating for MCI and dementia, including AD, VaD, and mixed AD.
MATERIALS AND METHODS
Patients with MCI, dementia, including AD, VaD, and mixed AD, and NCI were recruited from the Geriatric and Memory clinic in Rumailah Hospital, Doha, Qatar between September 18, 2016 and July 31, 2019. Patients with severe anxiety, severe depression, Parkinson’s disease, frontotemporal dementia and Lewy body dementia, hypomania, and severe dementia who were unable to cooperate were excluded. Additionally, patients with other potential causes of peripheral neuropathy including vitamin B12 deficiency, hypothyroidism, HIV infection, and hepatitis C were excluded. Diabetes was not excluded because there is a high prevalence of diabetes in patients aged ≥50 years in Qatar [30]. Patients with dry eyes, corneal dystrophies, ocular trauma or surgery in the preceding 6 months were excluded. This study was approved by the Institutional Review Board of Weill Cornell Medicine in Qatar and Hamad Medical Corporation and all participants gave informed consent to take part in the study. The research adhered to the tenets of the declaration of Helsinki.
Demographic and metabolic measures
Age, gender, ethnicity, blood pressure, weight, body mass index (BMI), HbA1c, cholesterol, triglycerides, thyroid stimulating hormone (TSH), free thyroxine (FT4), and vitamin B12 were recorded.
Cognitive screening
Cognitive screening was performed using the Montreal Cognitive Assessment (MoCA) test. The MoCA assesses seven cognitive domains including visuospatial/executive, naming, memory, attention, language, abstraction, and delayed recall giving a total score of 30. A score of ≤26 indicates cognitive impairment. A point was added for individuals who had formal education ≤6th grade. Cognitive symptom duration was estimated from the clinical history obtained from relatives and participants.
Diagnosis
The diagnosis of MCI and dementia, including AD, VaD, and mixed AD, were based on the ICD-10 criteria [31]. The diagnosis was made according to consensus decision by geriatricians, geriatric psychiatrists and neurologists to exclude reversible, complex and young-onset dementia. The diagnoses of MCI and dementia were based on a patient history and examination, which include 1) presenting complaint and history of illness; 2) comprehensive history of each of the cognitive domains using MoCA; 3) psychiatric history for ruling out depression, mood disorders, and psychosis; 4) medical history including episodes of delirium and other medical comorbidities; 5) medication history; 6) functional history of basic daily living activities. A comprehensive organic work-up including blood tests and brain imaging was undertaken to exclude other potentially reversible causes of cognitive decline such as tumors, subdural hematoma or normal pressure hydrocephalus. The diagnosis of mixed AD was based on the presence of AD and significant vascular changes. Subjects with typical features of AD and no significant decline in functioning were classified as AD. Neuroradiologists blinded to the diagnosis and clinical data assessed for volume loss of hippocampi, entorhinal cortex, and amygdala on MRI, based on the criteria of Dubois et al [32]. The diagnosis of probable or possible VaD was based on the NINDS-AIREN criteria [33], which include multiple large vessel infarcts or a single strategically placed infarct in the angular gyrus, thalamus, basal forebrain, or posterior (PCA) or anterior cerebral artery (ACA) territories, and multiple basal ganglia and white matter lacunes, extensive periventricular white matter lesions, or combinations thereof.
MRI brain procedures
MRI was performed on a superconductive magnet operated at 3T (Skyra, Siemens). A T1-weighted 3D magnetization prepared rapid acquisition gradient echo sequence (MPRAGE) was obtained in the sagittal plane with a 1 mm slice thickness, repetition time of 1900 ms, echo time of 2.67 ms and 2.46 ms, inversion time of 1100 ms and 900 ms, flip angle of 9 degree and 15 degree, and FOV = 240×100. Coronal and axial reformatted MPRAGE images were made from the sagittal 3D sequence.
Medial temporal lobe atrophy visual rating
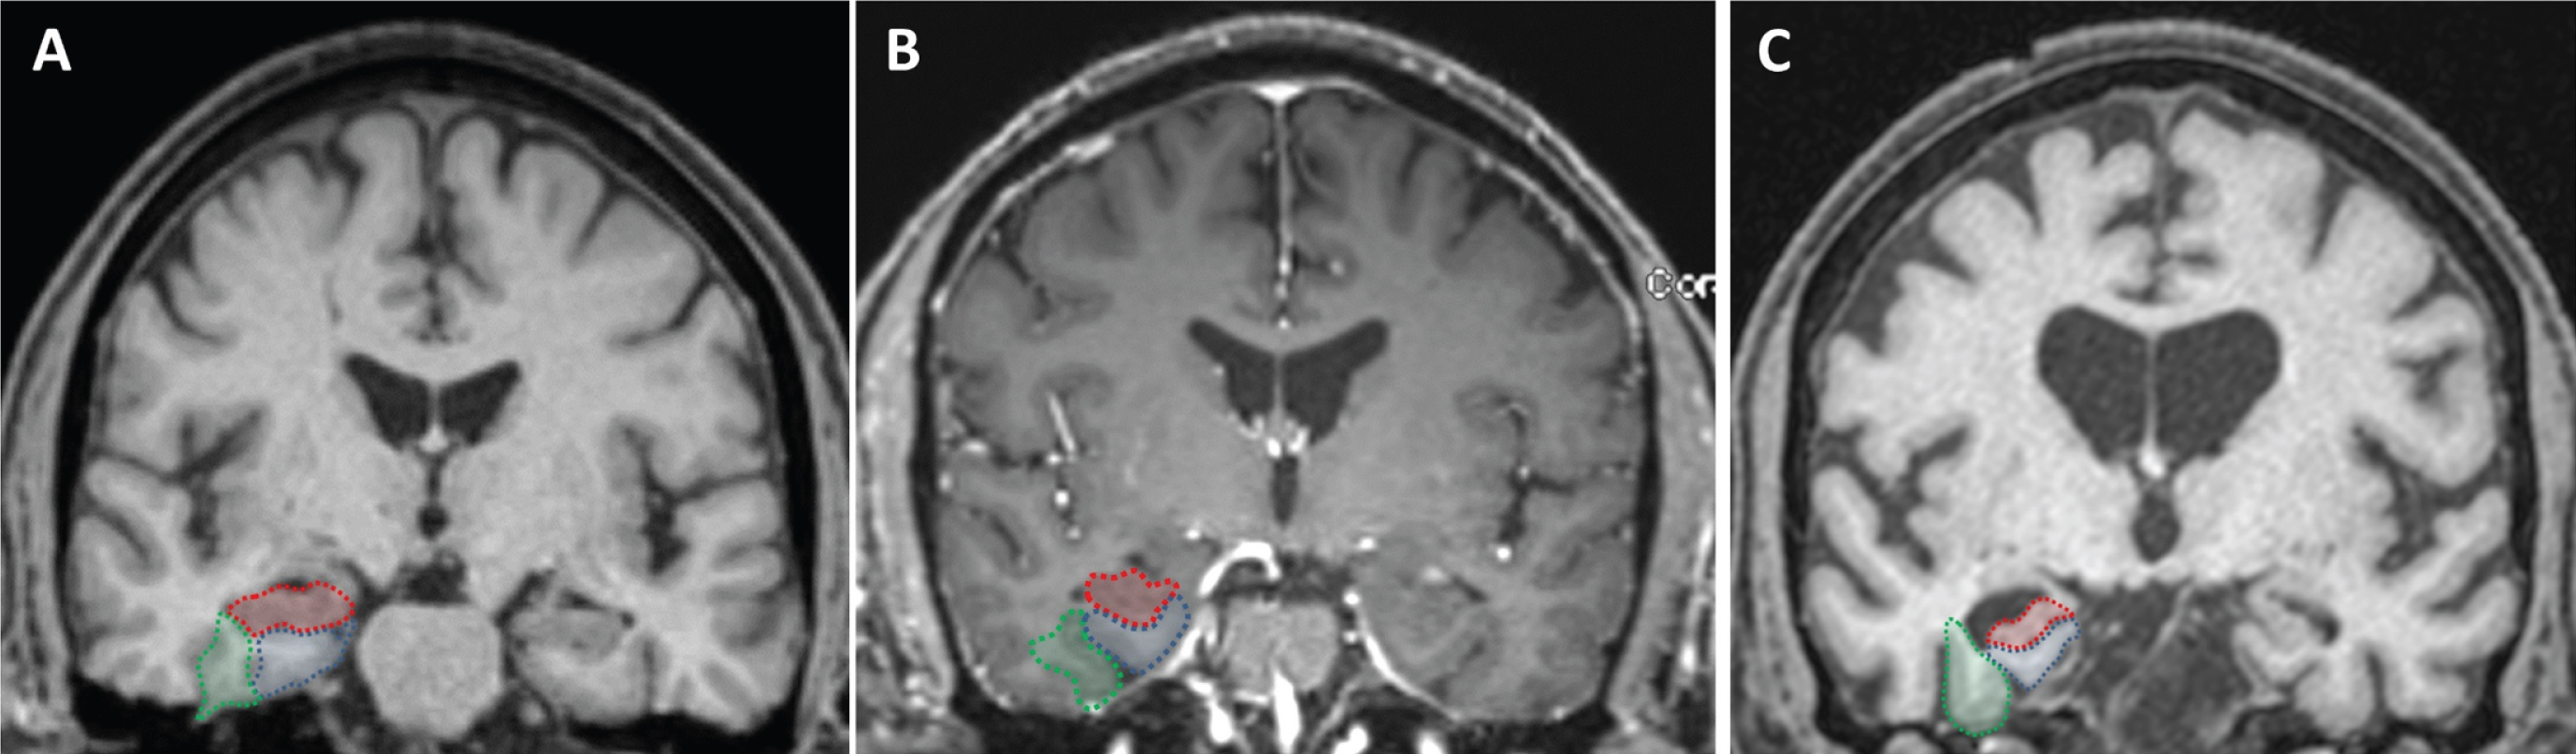
A board certified neuroradiologist blinded to diagnosis and clinical data assessed MRI images. T1-coronal images at the level of the midbrain were used to score for right and left MTA. The right and left hippocampi, entorhinal cortices, and perirhinal cortices were separately rated according to the five-point scale developed and validated by Duara et al., and a combined visual MTA score for each hemisphere was calculated averaging the three measurements [11]. The coronal reformatted MRI slice at the level of the mammillary bodies seen in the sagittal plane was used to define the outline of the medial temporal lobe. The outline of the entorhinal cortex in this slice was defined by the anterior parahippocampal gyrus and adjacent white matter (seen medial to the collateral sulcus and inferior to the hippocampus). The outline of the perirhinal cortex was defined by the fusiform gyrus and adjacent white matter (seen lateral to the collateral sulcus and medial to the occipitotemporal sulcus) (Fig. 1).
Fig. 1
Visual rating system for assessing medial temporal atrophy. The three regions of interest are outlined in the right hemisphere in color (hippocampus in red; entorhinal cortex in blue; perirhinal cortex in green). Control subject (A) and subject with MCI (B), all showing no atrophy (MTA score = 0) in both hemispheres. Subject with dementia (C), all structures have atrophy (right MTA score = 3.3 and left MTA score = 2.3).
Corneal confocal microscopy
CCM analysis was performed with the Heidelberg Retinal Tomograph III Rostock Cornea Module (Heidelberg Engineering GmbH, Heidelberg, Germany). The cornea was locally anesthetized by instilling 1 drop of 0.4% benoxinate hydrochloride (Chauvin Pharmaceuticals, Chefaro, UK) and Viscotears (Carbomer 980, 0.2%, Novartis, UK) was used as the coupling agent between the cornea and the TomoCap as well as between the TomoCap and the objective lens. Subjects were instructed to fixate on a target with the eye not being examined. Several scans of the sub-basal nerve plexus in the central cornea were captured per eye for ∼2 min. The field of view of each image is 400×400μm. At a separate time, three high clarity images per eye were selected by one researcher blind to the patient diagnosis using established criteria based on depth, focus position and contrast [29]. Corneal nerve fiber density (CNFD) (fibers/mm2), branch density (CNBD) (branches/mm2), and fiber length (CNFL) (total fiber length mm/mm2) were quantified using CCMetrics, a validated image analysis software [27].
Power analysis
Based on data from a previous study showing a reported difference in population means of CNFD 10 fibers/mm2, CNBD 4.96 branches/mm2, or CNFL 9.3 mm/mm2 [21] a sample size of 6, 22, and 7 subjects, respectively, was calculated to have 80% power to detect a significant difference between the NCI, MCI, and dementia group.
Statistical analysis
Patients’ demographics and clinical characteristics were summarized using means and standard deviations for numeric variables and frequency distribution for categorical variables. Variables were compared between the NCI, MCI, and dementia group using one-way analysis of variance (ANOVA) with Bonferroni’s post hoc test for pairwise comparisons and Chi-square test, respectively. Analysis of covariance (ANCOVA) was used to compare the corneal nerve fiber measures between subjects with NCI, MCI, and dementia after controlling for diabetes.
To assess intra-rater reliability, the neuroradiologist repeated ratings in 30 subjects with NCI (n = 10), MCI (n = 10), and dementia (n = 10), blind to the identity and diagnosis of the subjects after an interval of approximately four weeks. Intra-rater reliability was assessed using kappa statistics.
Receiver operating characteristic (ROC) curve analysis was used to determine the ability of CNFD, CNBD, CNFL, MTA-R, and MTA-L to distinguish between patients with MCI and dementia from NCI. The area under the ROC curve (AUC) and a cut-off point with the maximal sensitivity and specificity were calculated.
All analyses were performed using IBM-SPSS (version 23; SPSS Inc, Armonk NY). Dot plots were generated using GraphPad Prism, version 6.05. A two-tailed p value of ≤0.05 was considered significant.
RESULTS
We enrolled 207 people and excluded 1 patient with severe depression, 1 patient with hypomania, and 23 people who did not complete all assessments to leave a sample size of 182.
Demographic and clinical characteristics
182 subjects with NCI (n = 36), MCI (n = 80), and dementia (n = 66) were studied. The demographic and clinical characteristics of these three groups are summarized (Table 1). The study cohort comprised of 111 (61.0%) males and 71 (39.0%) females. There were 63 (34.6%) Qatari Arabs, 62 (34.1%) other Arabs, 37 (20.3%) South Asians, and 20 (11.0%) other ethnicities. The prevalence of Type 2 diabetes (T2D) was 110 (60.4%) and was comparable between subjects with NCI (n = 22, 61.1%), MCI (n = 46, 57.5%), and dementia (n = 42, 63.6%), p = 0.71. Gender proportion and the mean age, systolic blood pressure (SBP), diastolic blood pressure (DBP), body weight, BMI, HbA1c, cholesterol, and triglycerides were comparable between groups. There was a progressive reduction in cognitive function measured by MoCA between the NCI (27.4±4.1), MCI (22.1±5.5, p < 0.0001), and dementia (12.7±4.1, p < 0.0001) groups. The mean duration of cognitive impairment was significantly shorter in the MCI group compared to the dementia group (1.5±1.6 years versus 3.2±2.8 years, p < 0.0001). The dementia group comprised of AD (n = 19, 28.8%), VaD (n = 13, 19.7%), and mixed AD with vascular lesions (n = 34, 51.5%).
Table 1
Demographic and clinical characteristics of the study population
| NCI | MCI | Dementia | P1 | P2 | P3 | |
| (n = 36) | (n = 80) | (n = 66) | ||||
| Demographics | ||||||
| Age, y | 71.7±6.2 | 71.6±5.4 | 73.9±6.9 | NS | NS | NS |
| Female | 11 (30.6%) | 34 (42.5%) | 26 (39.4%) | NS | NS | NS |
| Systolic BP, mmHg | 140.3±17.0 | 138.6±17.4 | 138.6±21.4 | NS | NS | NS |
| Diastolic BP, mmHg | 73.7±19.8 | 71.4±8.3 | 69.1±10.0 | NS | NS | NS |
| Weight, kg | 76.4±10.7 | 80.7±19.2 | 75.8±13.8 | NS | NS | NS |
| BMI, Kg/m2 | 27.6±4.0 | 30.6±7.2 | 30.0±4.9 | NS | NS | NS |
| HbA1c, % | 6.7±1.3 | 7.0±1.7 | 6.6±1.3 | NS | NS | NS |
| Chol. mmol/L | 4.3±1.1 | 4.3±1.0 | 3.9±1.2 | NS | NS | NS |
| Trig. mmol/L | 1.5±0.7 | 1.5±0.7 | 1.4±0.7 | NS | NS | NS |
| Cognitive function | ||||||
| MoCA | 27.4±4.1 | 22.1±5.5 | 12.7±4.1 | <0.0001 | < 0.0001 | < 0.0001 |
| Cognitive impairment duration, y | N/A | 1.5±1.6 | 3.2±2.8 | < 0.0001 | ||
| Corneal nerve fiber measures | ||||||
| CNFD, fibers/mm2 | 32.0±7.5 | 24.5±9.6 | 20.8±9.3 | < 0.0001 | < 0.0001 | NS |
| CNBD, branches/mm2 | 90.9±46.5 | 59.3±35.7 | 53.9±38.7 | 0.001 | < 0.0001 | NS |
| CNFL, mm/mm2 | 22.9±6.1 | 17.2±6.5 | 15.8±7.4 | < 0.0001 | < 0.0001 | NS |
| Medial Temporal Atrophy Measures | ||||||
| Medial temporal atrophy (right &left) | 0.7±0.7 | 0.6±0.6 | 2.0±1.0 | NS | < 0.0001 | <0.0001 |
| Medial temporal atrophy (right) | 0.6±0.8 | 0.5±0.6 | 1.9±1.0 | NS | < 0.0001 | < 0.0001 |
| Hippocampus (right) | 1.1±1.1 | 1.3±0.9 | 2.8±0.9 | NS | < 0.0001 | < 0.0001 |
| Entorhinal cortex (right) | 0.4±0.9 | 0.2±0.6 | 1.6±1.2 | NS | < 0.0001 | < 0.0001 |
| Perirhinal cortex (right) | 0.3±0.6 | 0.2±0.5 | 1.4±1.1 | NS | < 0.0001 | < 0.0001 |
| Medial temporal atrophy (left) | 0.8±0.8 | 0.6±0.7 | 2.1±1.1 | NS | < 0.0001 | < 0.0001 |
| Hippocampus (left) | 1.3±0.9 | 1.2±1.0 | 2.8±0.9 | NS | < 0.0001 | <0.0001 |
| Entorhinal cortex (left) | 0.7±0.9 | 0.3±0.7 | 1.8±1.3 | NS | < 0.0001 | < 0.0001 |
| Perirhinal cortex (left) | 0.6±0.7 | 0.3±0.7 | 1.8±1.3 | NS | < 0.0001 | < 0.0001 |
1NCI versus MCI. 2NCI versus Dementia. 3MCI versus Dementia. Characteristics of 182 participants presented as mean±standard deviation for numeric variables and frequency distribution for NCI, MCI, and dementia. Continuous and categorical variables were compared using one-way ANOVA with Bonferroni’s post hoc test and Chi-square test, respectively. MoCA, Montreal cognitive assessment; NCI, no cognitive impairment, MCI, mild cognitive impairment, CNFD, corneal nerve fiber density; CNBD, corneal nerve branch density; CNFL, corneal nerve fiber length.
Visual rating of medial temporal lobe atrophy
The intra-rater reliability was 1.00 for both the right and left MTA.
The atrophy rating of the right and left hippocampi, entorhinal cortices, perirhinal cortices, and medial temporal lobe were comparable between the NCI and MCI group (Fig. 1 and Table 1). The MTA rating of the dementia group was significantly higher compared with the NCI and MCI group on the right (1.9±1.0 versus 0.5±0.6 and 0.6±0.8, p < 0.0001) and left (2.1±1.1 versus 0.6±0.7 and 0.8±0.8, p < 0.0001) hemispheres. The average MTA rating in the group with AD (1.9±1.0) and mixed AD with vascular lesions (2.3±1.0) was higher than in the group with VaD (1.5±0.8) but the difference was not significant (p = 0.08).
Corneal nerve fiber measures
The corneal nerve fiber measures in subjects with NCI, MCI and dementia are shown in Fig. 2. Compared to NCI the MCI and dementia group had a significantly lower corneal nerve fiber density (CNFD, fibers/mm2) (32.0±7.5 versus 24.5±9.6 and 20.8±9.3, p < 0.0001), branch density (CNBD, branches/mm2) (90.9±46.5 versus 59.3±35.7 and 53.9±38.7, p≤0.001), and fiber length (CNFL, mm/mm2) (22.9±6.1 versus 17.2±6.5 and 15.8±7.4, p < 0.0001). CNFD (20.8±10.7 versus 19.8±9.1 versus 21.0±8.8, p = 0.93), CNBD (58.1±45.8 versus 51.2±37.2 versus 51.9±36.0, p = 0.84), and CNFL (16.4±8.7 versus 15.9±8.4 versus 15.3±6.4, p = 0.88) were comparable between subjects with AD, VaD, and dementia with mixed AD, respectively.
Fig. 2
Corneal nerve fiber measures, and medial temporal lobe atrophy rating in subjects with NCI, MCI and dementia. (1) Corneal confocal microscopy (CCM) images of the sub-basal nerve plexus in (A) a 73-year old subject with NCI showing normal corneal nerve fiber morphology; (B) a 69-year old subject with MCI and (C) a 74-year old subject with dementia showing a progressive reduction in corneal nerve fiber density, branch density and fiber length. (2) Dot plots of corneal nerve fiber density (CNFD) (red), branch density (CNBD) (green), fiber length (CNFL) (blue) and MTA scoring (grey) in controls, subjects with MCI and dementia. The line that extends from the middle of the vertical line represents the mean and the lines that extend to the top and bottom are the standard deviation with significant differences between NCI, MCI, and dementia group (***p < 0.0001).
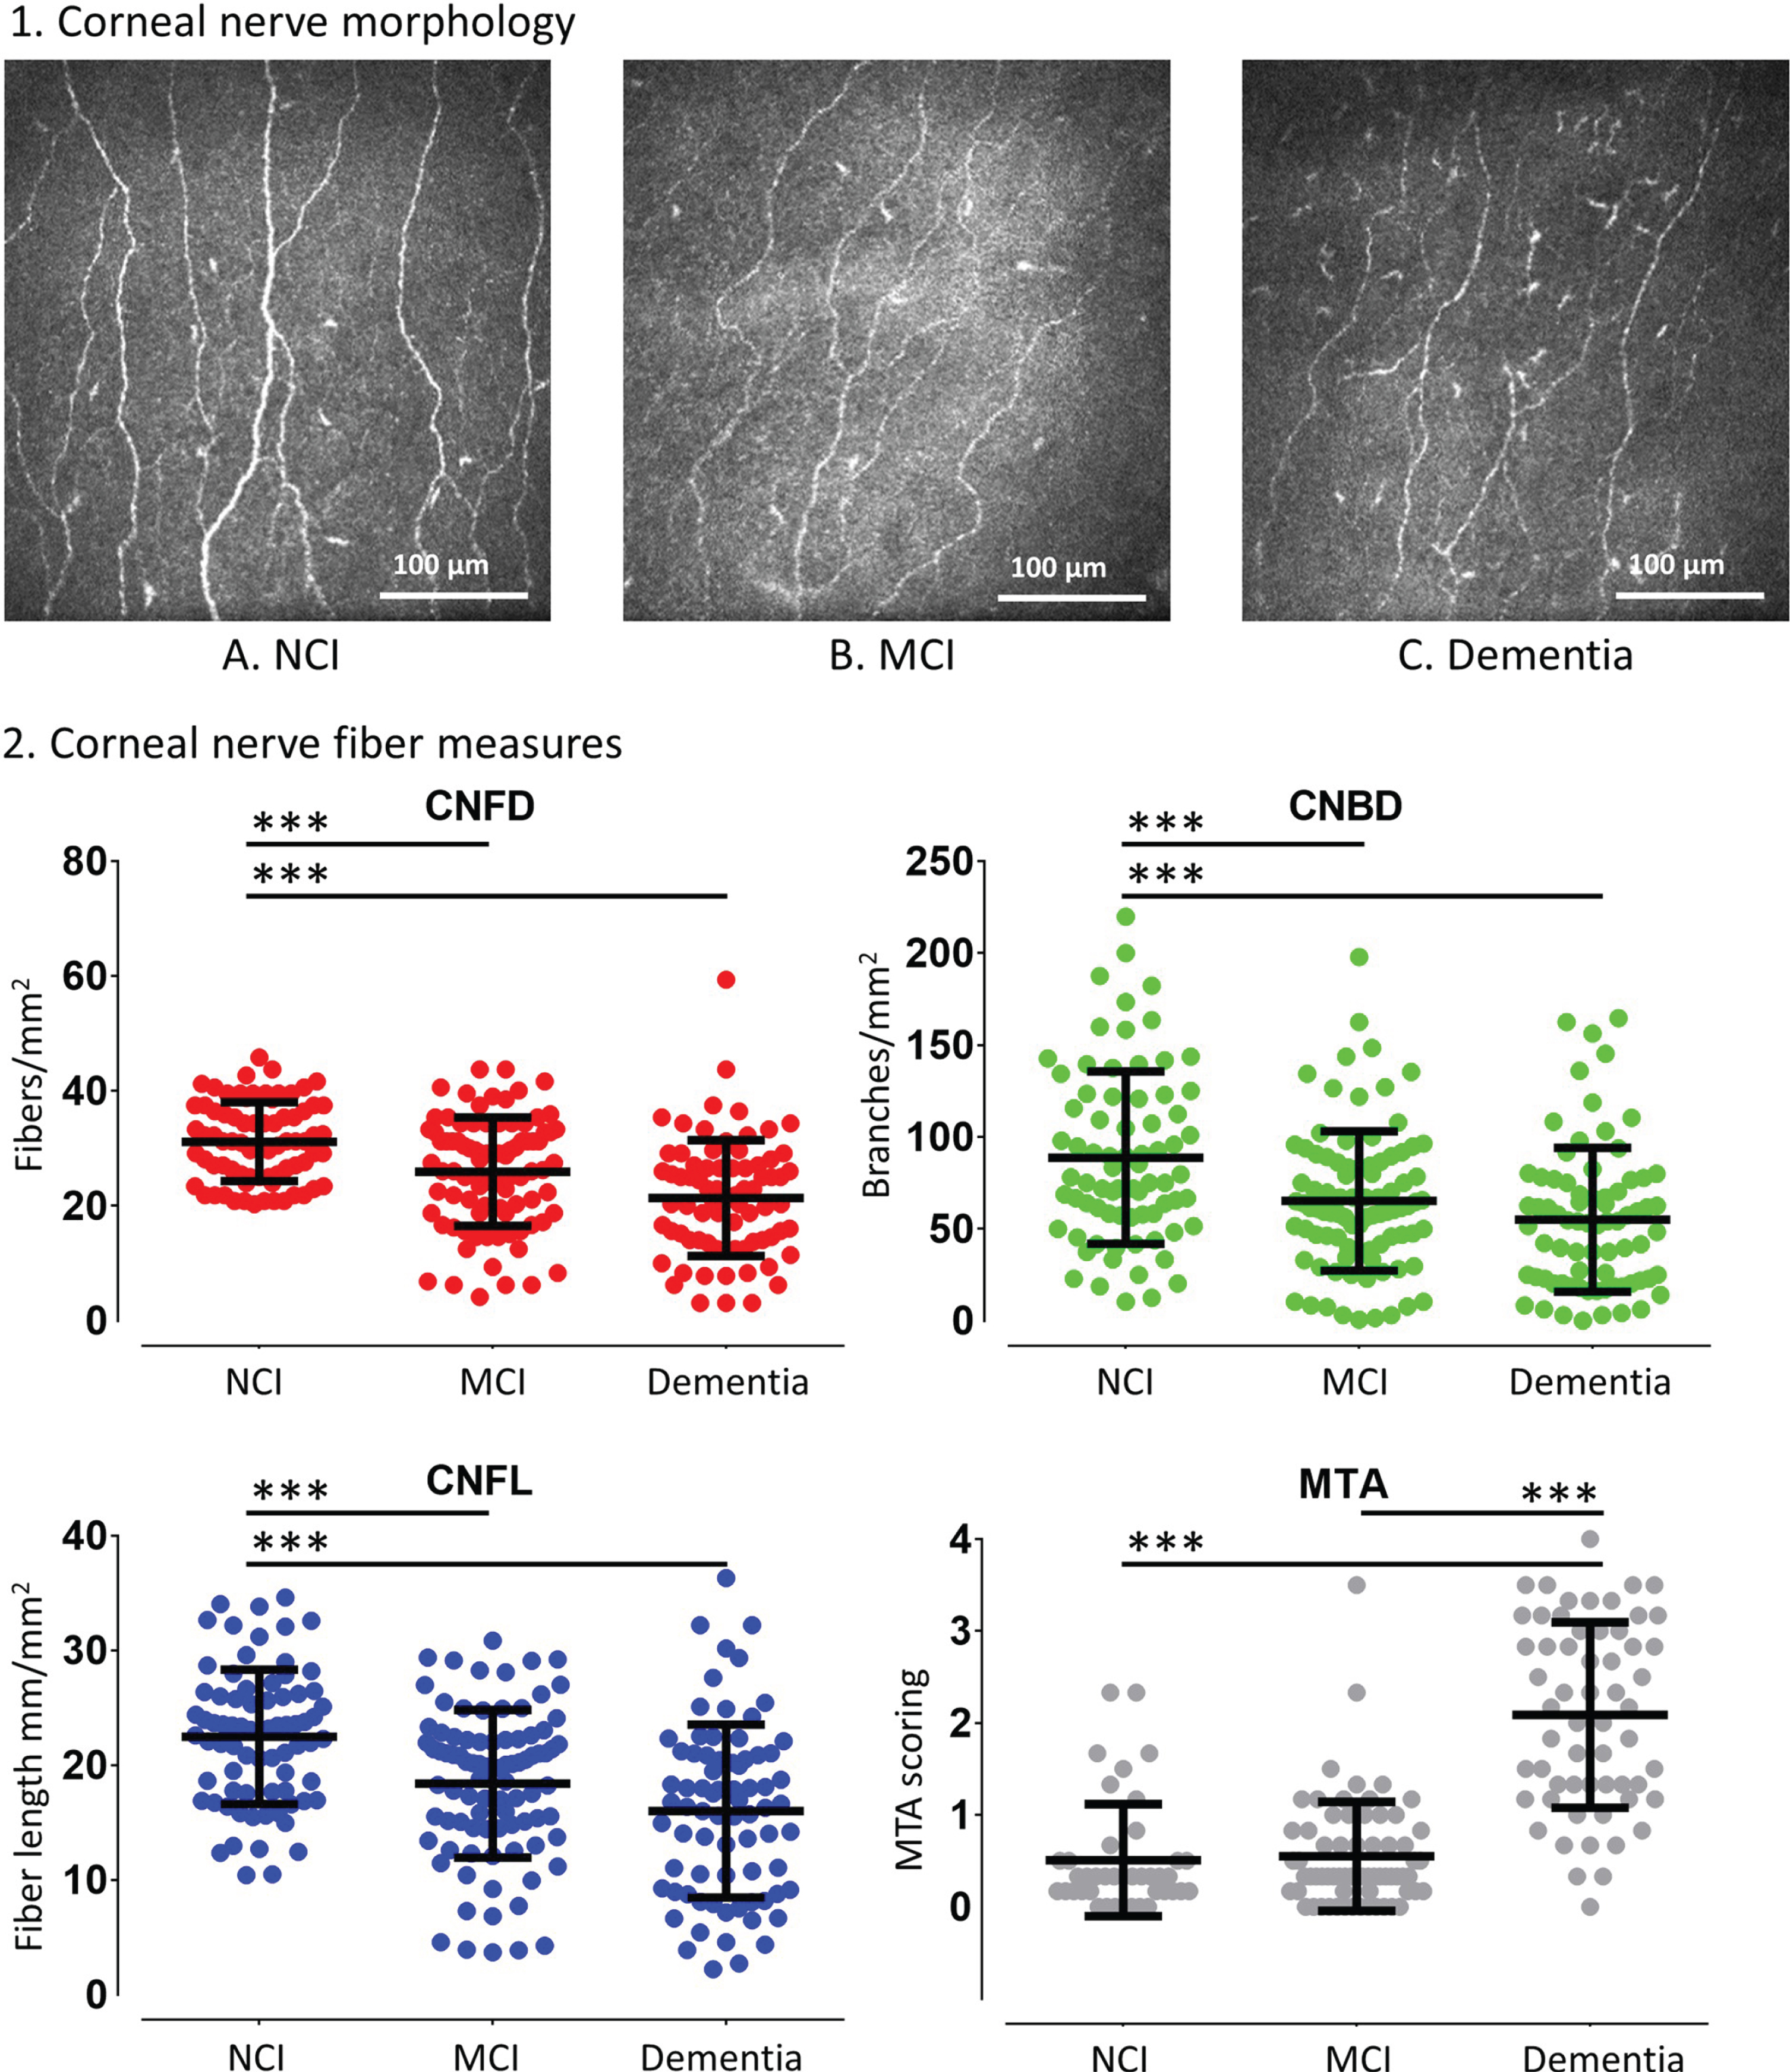
The difference in corneal nerve fiber measures between subjects with NCI, MCI and dementia remained significant after controlling for T2D (p < 0.0001) (Table 1). CNFD was significantly different between subjects with and without T2D (p = 0.04) but not CNBD (p = 0.38) and CNFL (p = 0.12).
MTA sensitivity and specificity
The area under the ROC curve (AUC) (95% CI) to distinguish MCI from NCI for MTA-R and MTA-L was not significant 53% (36–69%) and 40% (25–55%), respectively, while for dementia it was 86% (76–96%) and 82% (72–92%) (p < 0.0001), respectively (Fig. 3 and Table 2). The sensitivity and specificity for dementia was 85% and 71% with MTA-R cut-off <0.8 and 79% and 62% with MTA-L cut-off <1.2.
Fig. 3
The diagnostic accuracy of corneal nerve fiber measures and medial temporal lobe atrophy rating for MCI and dementia. ROC analysis showing the area under the curve for corneal nerve fiber measures and right and left medial temporal lobe atrophy (MTA) rating.
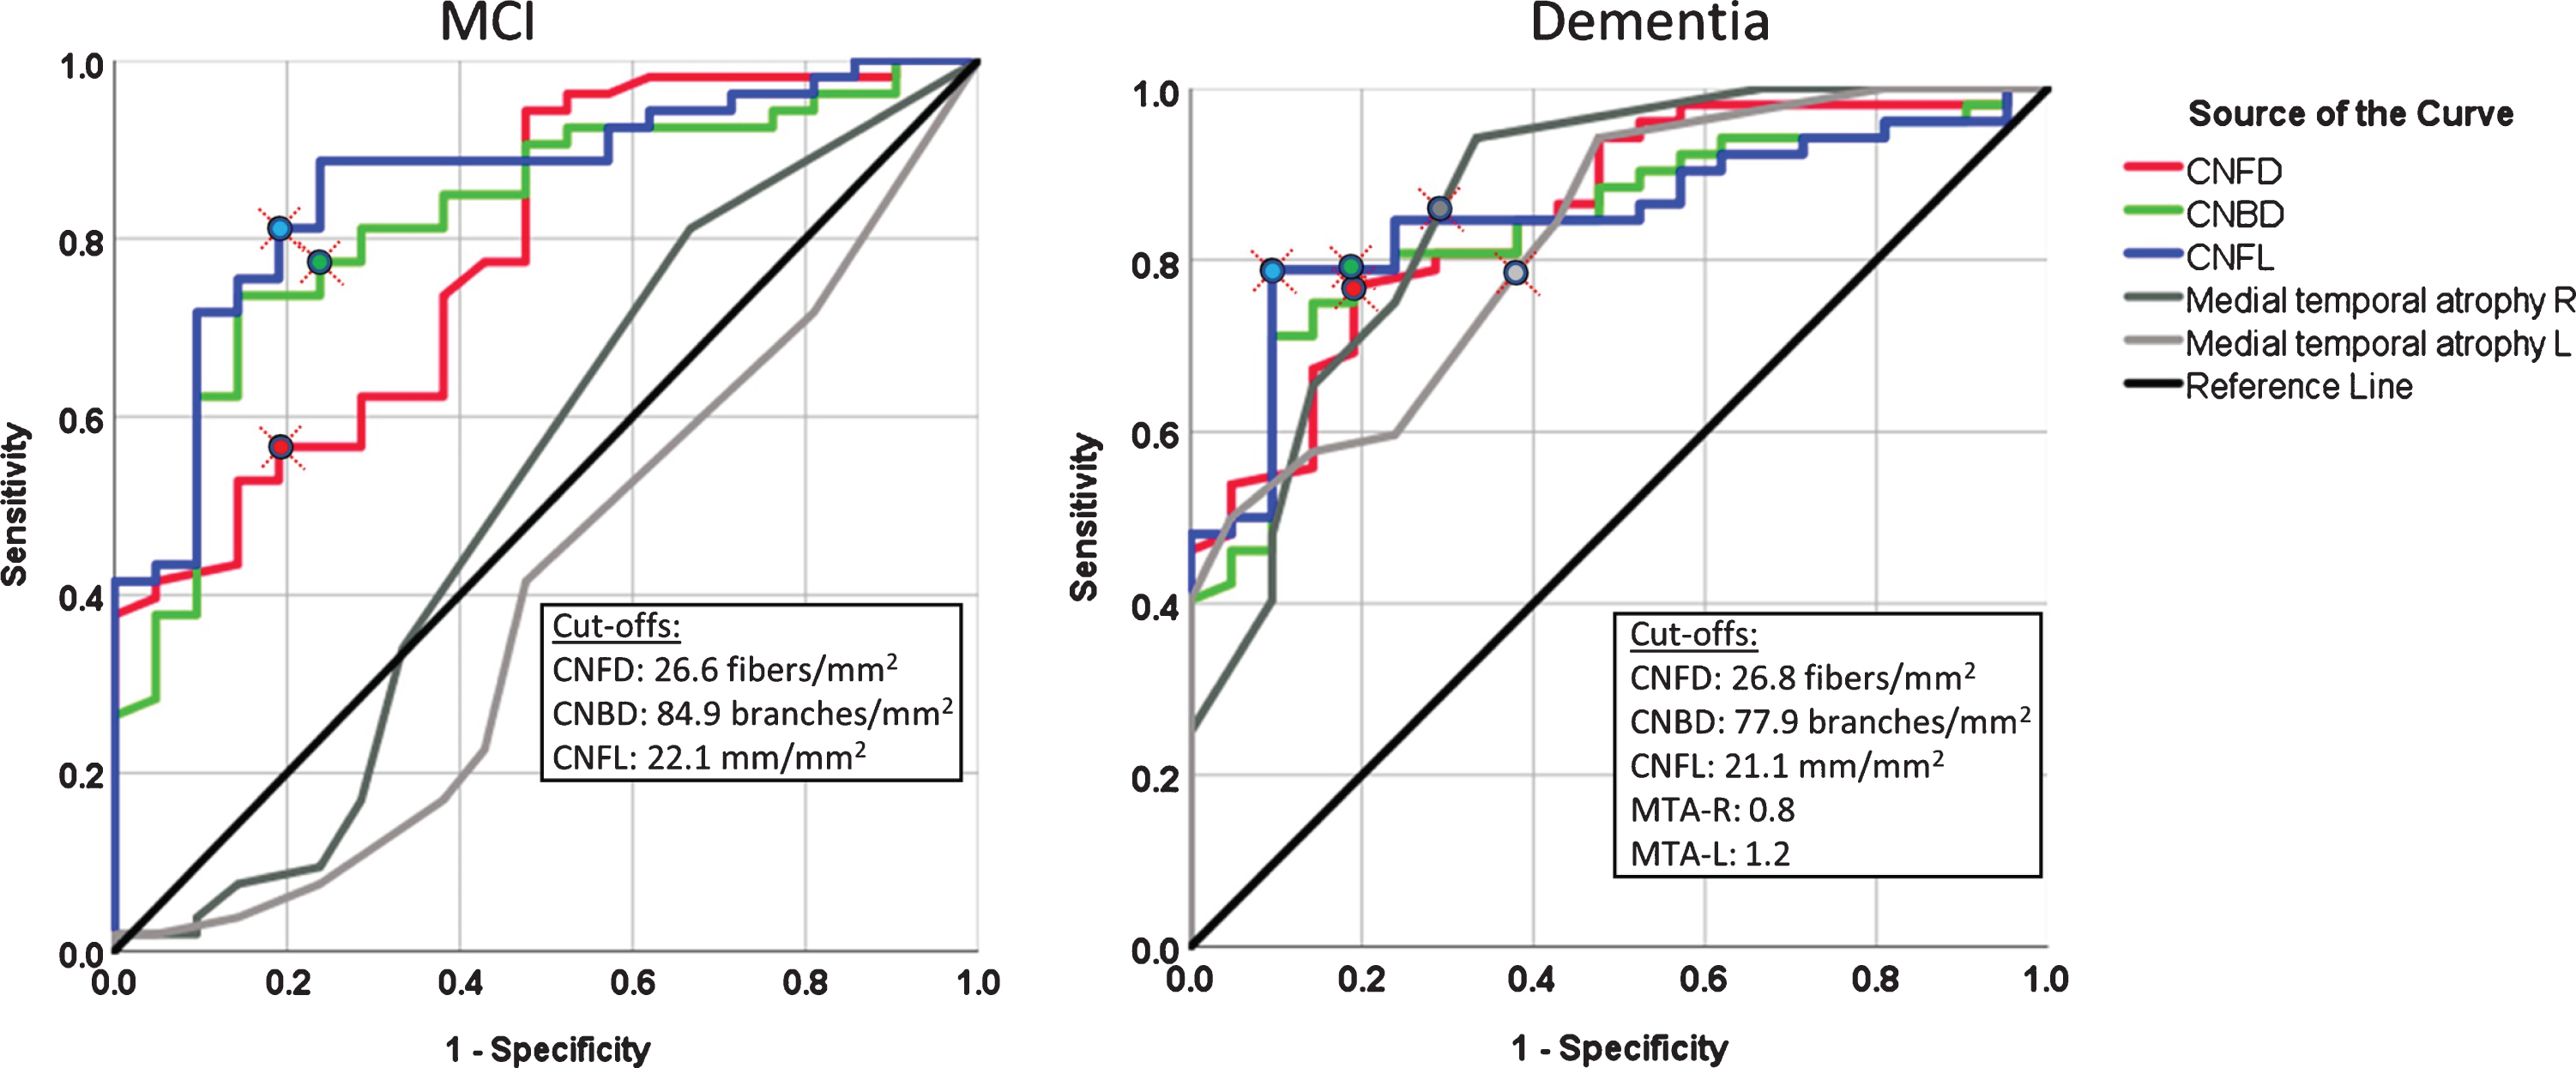
Table 2
Receiver operating characteristic (ROC) curve analysis for the diagnostic accuracy of corneal confocal microscopy and medial temporal lobe atrophy rating for MCI and dementia
| AUC (95% Cl) | Cutoff value | Sensitivity | Specificity | P | |
| NCI versus MCI | |||||
| CNFD, fibers/mm2 | 0.78 (0.67–0.90) | 26.6 | 57% | 81% | < 0.0001 |
| CNBD, branches/mm2 | 0.82 (0.72–0.92) | 84.9 | 77% | 76% | < 0.0001 |
| CNFL, mm/mm2 | 0.86 (0.77–0.95) | 22.1 | 81% | 81% | < 0.0001 |
| MTA-R | 0.53 (0.36–0.69) | NS | |||
| MTA-L | 0.40 (0.25–0.55) | NS | |||
| NCI versus Dementia | |||||
| CNFD, fibers/mm2 | 0.85 (0.76–0.94) | 26.8 | 77% | 81% | < 0.0001 |
| CNBD, branches/mm2 | 0.84 (0.75–0.93) | 77.9 | 79% | 81% | < 0.0001 |
| CNFL, mm/mm2 | 0.85 (0.76–0.94) | 21.1 | 79% | 91% | < 0.0001 |
| MTA-R | 0.86 (0.76–0.96) | 0.8 | 85% | 71% | < 0.0001 |
| MTA-L | 0.82 (0.72–0.92) | 1.2 | 79% | 62% | < 0.0001 |
NCI, no cognitive impairment; MCI, mild cognitive impairment; CNFD, corneal nerve fiber density; CNBD, corneal nerve branch density; CNFL, corneal nerve fiber length; MTA, medial temporal atrophy.
CCM sensitivity and specificity
The area under the ROC curve (95% CI) to distinguish MCI from NCI for CNFD, CNBD, and CNFL was 78% (67–90%), 82% (72–92%), and 86% (77–95%) (p < 0.0001), respectively, and for dementia it was 85% (76–94%), 84% (75–93%), and 85% (76–94%) (p < 0.0001), respectively (Fig. 3 and Table 2). The sensitivity and specificity for MCI was 57% and 81% with CNFD cut-off <27 fibers/mm2, 77% and 76% with CNBD cut-off <85 branches/mm2, and 81% and 81% with a CNFL cut-off <22 mm/mm2. The sensitivity and specificity for dementia was 77% and 81% with a CNFD cut-off <27 fibers/mm2, 79% and 81% with a CNBD cut-off <78 branches/mm2, and 79% and 91% with a CNFL cut-off of <21 mm/mm2.
DISCUSSION
This study compared the diagnostic accuracy of corneal confocal microscopy (CCM), a non-invasive ophthalmic imaging biomarker of neurodegeneration for MCI and dementia [21] with MTA rating, an established biomarker for AD [4, 5]. The diagnostic accuracy of corneal nerve measures of neurodegeneration was high and equivalent to MTA rating for dementia, but it was superior to MTA rating for MCI. MTA rating could not distinguish subjects with MCI from subjects with NCI. Dementia is a neurodegenerative condition characterized with an insidious onset and a slow progression [4]. A diagnosis of MCI requires a change in cognition, evidence of impairment in at least one cognitive domain and preserved ability to function independently in daily life [5]. However, cognitive assessment tests are influenced by age, educational and cultural background [4]. A method that allows for greater diagnostic certainty to distinguish normal cognition due to aging from MCI and dementia is required. Biomarkers can support the diagnosis of MCI and dementia by providing direct or indirect evidence of the underlying pathology of the disease and identify subtypes of MCI which do or do not progress to dementia [4].
MTA rating as a biomarker of neuronal injury is included in the NIA-AA guidelines to support the diagnosis of AD [4, 5]. Pathological changes occurring in the medial temporal lobe have been demonstrated at autopsy in patients with dementia in the earliest stages of the disease [34]. MTA also occurs in VaD but not to the same extent as in AD [13, 14]. A gradual accumulation of infarcts or white matter ischemia is associated with hippocampal neuronal loss. In this study, MTA was detected in subjects with AD, VaD, and mixed AD and vascular lesions. MTA visual rating was developed for use in clinical practice as it is easy to learn and can be quickly scored to support the diagnosis of AD [35]. However, there are conflicting data about the diagnostic accuracy of MTA visual rating for AD. Duara et al. [11] reported that MTA can discriminate probable AD from no cognitive impairment with a good sensitivity (85%) and specificity (82%), above the 80% threshold [8]. Heo et al. [9] and Cavedo et al. [10] also reported that MTA scoring has high diagnostic accuracy for AD. Our findings are in line with the study of Falgas et al. [36] showing that MTA visual rating can distinguish between AD and healthy controls with 94% specificity but 77% sensitivity using ≥1.5 cut-off or 90% sensitivity with 56% specificity using ≥1 cut-off. However, previous studies reporting a high diagnostic accuracy for AD with MTA rating assessed patients with late-onset AD who have more atrophy compared to patients with early-onset AD. Furthermore, Duara et al. [11] used different MTA visual rating cut-offs for different age groups, ≥2 for 63–75 years and ≥3 for ≥75 years, while our cut-off was independent of age. Falgas et al. [36] also reported that MTA rating cannot distinguish patients with early-onset AD and subjects with MCI. The AUC/sensitivity/specificity were 63% /30% /93% for non-amnesic and 67% /34% /93% for amnesic early-onset AD. In this study, the left and right MTA scores could not distinguish subjects with NCI from MCI.
Corneal nerve morphology has been evaluated using CCM in a number of central neurodegenerative disorders, including MCI and dementia [21], Parkinson’s disease [22], amyotrophic lateral sclerosis [23], and multiple sclerosis [24–26]. Previously, we have reported corneal nerve loss associated with cognitive decline and functional independence and reasonable diagnostic accuracy in a smaller cohort of subjects with MCI and dementia [21]. In the present study with a greater number of participants we show improved diagnostic accuracy with an AUC (86% versus 73%), sensitivity (81% versus 70%), and specificity (81% versus 75%) for MCI, superior to MTA rating and a comparable AUC (85% versus 86%) and sensitivity (79% versus 85%) but improved specificity (91% versus 75%) for dementia. This study also shows that the severity of corneal nerve loss was comparable between AD, VaD, and dementia with mixed AD and vascular lesions.
It is important to account for other causes of corneal nerve fiber loss such as impaired glucose tolerance [37] and diabetes [38]. While a large body of data shows that diabetes has a major influence on corneal nerve pathology [15–19], diabetes was not excluded from the study as diabetes is more prevalent in people with cognitive impairment and has a high prevalence in patients aged ≥50 years in Qatar [30]. Indeed, our analysis shows that the difference in corneal nerve fiber measures between subjects with NCI, MCI, and dementia remained significant after controlling for diabetes.
Epidemiological studies also show that individuals with T2D have an increased risk of dementia [39, 40]. The relative risk for AD and VaD for people with diabetes compared to people without diabetes is 1.53 (95% CI 1.42–1.63) [39] and 2.27 (95% CI 1.94–2.66) [40], respectively. The increased risk of dementia in patients with T2D is attributed to non-AD mechanisms of neurodegeneration. Diabetes is not associated with excess amyloid-β (Aβ) plaques and neurofibrillary tangles of hyperphosphorylated tau protein in the brain [41, 42]. However, patients with T2D have 1.57 times increased odds of an infarct, and 1.71 times increased odds of lacunes in the brain [41]. Infarcts and lacunes double the risk of dementia occurring within 5 years [43] and could further decrease cognitive reserve in patients who have accumulating plaques and tangles [44].
The diagnostic accuracy of MTA visual rating and CCM for MCI should be interpreted with caution because diagnosis of MCI was based on clinical evaluation and cognitive examination using the ICD-10 criteria [45]. This is a significant limitation when comparing the diagnostic accuracy of these two techniques for MCI without biological confirmation of the disease including cerebrospinal fluid concentrations of Aβ42, Aβ40, tau/phosphorylated tau [46, 47], or Aβ deposition using positron emission tomography [48, 49]. This could have led to higher rate of misdiagnosis of MCI. The overlap of corneal nerve measures between MCI and dementia may be attributed to the absence or presence, severity of neurodegeneration and stage of the disease. The optimal role of biomarkers for AD should be to identify the disease in its prodromal stages [50]. All three corneal nerve measures are reduced in both MCI and dementia and future larger studies may inform us as to which measure is optimal. A longitudinal study is currently underway to compare the prognostic ability of CCM and quantitative brain atrophy on progression of participants with MCI to dementia. CCM may lack specificity for dementia as it occurs in a range of peripheral and central neurodegenerative diseases, therefore future studies should attempt to define specific patterns of corneal nerve fiber alteration in MCI and dementia and assess its utility alongside more specific biomarkers such as Aβ and tau.
In conclusion, this study shows that CCM has high diagnostic accuracy for MCI and dementia, whereas MTA rating has high diagnostic accuracy for dementia but cannot distinguish subjects with NCI from those with MCI. This suggests that CCM is a promising ophthalmic imaging biomarker of neurodegeneration that could be utilized to screen, diagnose and follow up people with MCI and dementia.
ACKNOWLEDGMENTS
We thank Dr. Hanadi Al-Hamad, the Medical Director of Rumailah Hospital and Qatar Rehabilitation Institute and her staff at Rumailah Hospital for providing the facility and helping to undertake this study. We particularly thank all the participants and their relatives for their efforts, will and commitment to be involved in the study. We also thank the WCM-Q Clinical Research Core for statistical advice.
This work was funded by the Qatar National Research Fund (BMRP-5726113101 & NPRP12S-0213-190080). This publication was made possible by NPRP grant NPRP12S-0213-190080 from the Qatar National Research Fund (a member of Qatar Foundation). The findings achieved herein are solely the responsibility of the authors.
Authors’ disclosures available online (https://www.j-alz.com/manuscript-disclosures/20-0678r1).
REFERENCES
[1] | Wu YT , Beiser AS , Breteler MMB , Fratiglioni L , Helmer C , Hendrie HC , Honda H , Ikram MA , Langa KM , Lobo A , Matthews FE , Ohara T , Peres K , Qiu C , Seshadri S , Sjolund BM , Skoog I , Brayne C ((2017) ) The changing prevalence and incidence of dementia over time - current evidence. Nat Rev Neurol 13: , 327–339. |
[2] | Prince M , Bryce R , Albanese E , Wimo A , Ribeiro W , Ferri CP , Ferri CP ((2013) ) The global prevalence of dementia: A systematic review and metaanalysis. Dement 9: , 63–75 e62. |
[3] | Prince M , Bryce R , Ferri C ((2011) ) World Alzheimer Report 2011. The benefits of early diagnosis and intervention. Alzheimer’s Disease International, London. |
[4] | Albert MS , DeKosky ST , Dickson D , Dubois B , Feldman HH , Fox NC , Gamst A , Holtzman DM , Jagust WJ , Petersen RC , Snyder PJ , Carrillo MC , Thies B , Phelps CH ((2011) ) The diagnosis of mild cognitive impairment due to Alzheimer’s disease: Recommendations from the National Institute on Aging-Alzheimer’s Association workgroups on diagnostic guidelines for Alzheimer’s disease. Dement 7: , 270–279. |
[5] | McKhann GM , Knopman DS , Chertkow H , Hyman BT , Jack CR Jr. , Kawas CH , Klunk WE , Koroshetz WJ , Manly JJ , Mayeux R , Mohs RC , Morris JC , Rossor MN , Scheltens P , Carrillo MC , Thies B , Weintraub S , Phelps CH ((2011) ) The diagnosis of dementia due to Alzheimer’s disease: Recommendations from the National Institute on Aging-Alzheimer’s Association workgroups on diagnostic guidelines for Alzheimer’s disease. Dement 7: , 263–269. |
[6] | Du AT , Schuff N , Amend D , Laakso MP , Hsu YY , Jagust WJ , Yaffe K , Kramer JH , Reed B , Norman D , Chui HC , Weiner MW ((2001) ) Magnetic resonance imaging of the entorhinal cortex and hippocampus in mild cognitive impairment and Alzheimer’s disease. J Neurol Neurosurg Psychiatry 71: , 441–447. |
[7] | Urs R , Potter E , Barker W , Appel J , Loewenstein DA , Zhao W , Duara R ((2009) ) Visual rating system for assessing magnetic resonance images: A tool in the diagnosis of mild cognitive impairment and Alzheimer disease. J Comput Assist Tomogr 33: , 73–78. |
[8] | Thies B , Truschke E , Morrison-Bogorad M , Hodes RJ ((1999) ) Consensus report of the Working Group on: Molecular and biochemical markers of Alzheimer’s disease. Aging 20: , 247. |
[9] | Heo JH , Kim MK , Lee JH , Lee JH ((2013) ) Usefulness of medial temporal lobe atrophy visual rating scale in detecting Alzheimer’s disease: Preliminary study. Ann Indian Acad Neurol 16: , 384–387. |
[10] | Cavedo E , Pievani M , Boccardi M , Galluzzi S , Bocchetta M , Bonetti M , Thompson PM , Frisoni GB ((2014) ) Medial temporal atrophy in early and late-onset Alzheimer’s disease. Aging 35: , 2004–2012. |
[11] | Duara R , Loewenstein DA , Potter E , Appel J , Greig MT , Urs R , Shen Q , Raj A , Small B , Barker W , Schofield E , Wu Y , Potter H ((2008) ) Medial temporal lobe atrophy on MRI scans and the diagnosis of Alzheimer disease. Neurology 71: , 1986–1992. |
[12] | Velickaite V , Ferreira D , Cavallin L , Lind L , Ahlstrom H , Kilander L , Westman E , Larsson EM ((2018) ) Medial temporal lobe atrophy ratings in a large 75-year-old population-based cohort: Gender-corrected and education-corrected normative data. Radiol 28: , 1739–1747. |
[13] | Barber R , Ballard C , McKeith IG , Gholkar A , O’Brien JT ((2000) ) MRI volumetric study of dementia with Lewy bodies: A comparison with AD and vascular dementia. Neurology 54: , 1304–1309. |
[14] | Cho H , Kwon JH , Seo HJ ((2009) ) Medial temporal lobe atrophy in vascular dementia: Visual temporal lobe rating scale. Arch Gerontol Geriatr 48: , 415–418. |
[15] | Petropoulos IN , Manzoor T , Morgan P , Fadavi H , Asghar O , Alam U , Ponirakis G , Dabbah MA , Chen X , Graham J , Tavakoli M , Malik RA ((2013) ) Repeatability of in vivo corneal confocal microscopy to quantify corneal nerve morphology. Cornea 32: , e83–89. |
[16] | Petropoulos IN , Alam U , Fadavi H , Marshall A , Asghar O , Dabbah MA , Chen X , Graham J , Ponirakis G , Boulton AJ , Tavakoli M , Malik RA ((2014) ) Rapid automated diagnosis of diabetic peripheral neuropathy with in vivo corneal confocal microscopy. Invest Ophthalmol Vis Sci 55: , 2071–2078. |
[17] | Petropoulos IN , Alam U , Fadavi H , Asghar O , Green P , Ponirakis G , Marshall A , Boulton AJ , Tavakoli M , Malik RA ((2013) ) Corneal nerve loss detected with corneal confocal microscopy is symmetrical and related to the severity of diabetic polyneuropathy. Diabetes Care 36: , 3646–3651. |
[18] | Malik RA , Kallinikos P , Abbott CA , van Schie CH , Morgan P , Efron N , Boulton AJ ((2003) ) Corneal confocal microscopy: A non-invasive surrogate of nerve fibre damage and repair in diabetic patients. Diabetologia 46: , 683–688. |
[19] | Ahmed A , Bril V , Orszag A , Paulson J , Yeung E , Ngo M , Orlov S , Perkins BA ((2012) ) Detection of diabetic sensorimotor polyneuropathy by corneal confocal microscopy in type 1 diabetes: A concurrent validity study. Diabetes Care 35: , 821–828. |
[20] | Petropoulos IN , Ponirakis G , Khan A , Gad H , Almuhannadi H , Brines M , Cerami A , Malik RA ((2020) ) Corneal confocal microscopy: Ready for prime time. Exp Optom 103: , 265–277. |
[21] | Ponirakis G , Al Hamad H , Sankaranarayanan A , Khan A , Chandran M , Ramadan M , Tosino R , Gawhale PV , Alobaidi M , AlSulaiti E , Elsotouhy A , Elorrabi M , Khan S , Nadukkandiyil N , Osman S , Thodi N , Almuhannadi H , Gad H , Mahfoud ZR , Al-Shibani F , Petropoulos IN , Own A , Al Kuwari M , Shuaib A , Malik RA ((2019) ) Association of corneal nerve fiber measures with cognitive function in dementia. Ann Clin Transl Neurol 6: , 689–697. |
[22] | Misra SL , Kersten HM , Roxburgh RH , Danesh-Meyer HV , McGhee CN ((2017) ) Corneal nerve microstructure in Parkinson’s disease. J Clin Neurosci 39: , 53–58. |
[23] | Ferrari G , Grisan E , Scarpa F , Fazio R , Comola M , Quattrini A , Comi G , Rama P , Riva N ((2014) ) Corneal confocal microscopy reveals trigeminal small sensory fiber neuropathy in amyotrophic lateral sclerosis. Front Aging Neurosci 6: , 278. |
[24] | Petropoulos IN , Kamran S , Li Y , Khan A , Ponirakis G , Akhtar N , Deleu D , Shuaib A , Malik RA ((2017) ) Corneal confocal microscopy: An imaging endpoint for axonal degeneration in multiple sclerosis. Invest Ophthalmol Vis Sci 58: , 3677–3681. |
[25] | Bitirgen G , Akpinar Z , Malik RA , Ozkagnici A ((2017) ) Use of corneal confocal microscopy to detect corneal nerve loss and increased dendritic cells in patients with multiple sclerosis.777-782. JAMA Ophthalmol 135: . |
[26] | Mikolajczak J , Zimmermann H , Kheirkhah A , Kadas EM , Oberwahrenbrock T , Muller R , Ren A , Kuchling J , Dietze H , Pruss H , Paul F , Hamrah P , Brandt AU ((2017) ) Patients with multiple sclerosis demonstrate reduced subbasal corneal nerve fibre density. Scler 23: , 1847–1853. |
[27] | Dabbah MA , Graham J , Petropoulos IN , Tavakoli M , Malik RA ((2011) ) Automatic analysis of diabetic peripheral neuropathy using multi-scale quantitative morphology of nerve fibres in corneal confocal microscopy imaging. Med Image Anal 15: , 738–747. |
[28] | Vagenas D , Pritchard N , Edwards K , Shahidi AM , Sampson GP , Russell AW , Malik RA , Efron N ((2012) ) Optimal image sample size for corneal nerve morphometry. Vis Sci 89: , 812–817. |
[29] | Kalteniece A , Ferdousi M , Adam S , Schofield J , Azmi S , Petropoulos I , Soran H , Malik RA ((2017) ) Corneal confocal microscopy is a rapid reproducible ophthalmic technique for quantifying corneal nerve abnormalities. One 12: , e0183040. |
[30] | Bener A , Zirie M , Janahi IM , Al-Hamaq AO , Musallam M , Wareham NJ ((2009) ) Prevalence of diagnosed and undiagnosed diabetes mellitus and its risk factors in a population-based study of Qatar. Diabetes Res Clin Pract 84: , 99–106. |
[31] | Organization WH ((1992) ) The ICD-10 classification of mental and behavioural disorders: Clinical descriptions and diagnostic guidelines. World Health Organization, Geneva. |
[32] | Dubois B , Picard G , Sarazin M ((2009) ) Early detection of Alzheimer’s disease: New diagnostic criteria. Dialogues Clin Neurosci 11: , 135–139. |
[33] | Roman GC , Tatemichi TK , Erkinjuntti T , Cummings JL , Masdeu JC , Garcia JH , Amaducci L , Orgogozo JM , Brun A , Hofman A , et al. ((1993) ) Vascular dementia: Diagnostic criteria for research studies. Report of the NINDS-AIREN International Workshop. Neurology 43: , 250–260. |
[34] | Barkhof F , Polvikoski TM , van Straaten EC , Kalaria RN , Sulkava R , Aronen HJ , Niinisto L , Rastas S , Oinas M , Scheltens P , Erkinjuntti T ((2007) ) The significance of medial temporal lobe atrophy: A postmortem MRI study in the very old. Neurology 69: , 1521–1527. |
[35] | van de Pol LA , Scheltens P ((2014) ) Medial temporal lobe atrophy scores translated to clinical practice: Editorial comment on ‘influence of age, disease onset and ApoE4 on visual medial temporal lobe atrophy cut-offs’. J Intern Med 275: , 331–333. |
[36] | Falgas N , Sanchez-Valle R , Bargallo N , Balasa M , Fernandez-Villullas G , Bosch B , Olives J , Tort-Merino A , Antonell A , Munoz-Garcia C , Leon M , Grau O , Castellvi M , Coll-Padros N , Rami L , Redolfi A , Llado A ((2019) ) Hippocampal atrophy has limited usefulness as a diagnostic biomarker on the early onset Alzheimer’s disease patients: A comparison between visual and quantitative assessment. Clin 23: , 101927. |
[37] | Asghar O , Petropoulos IN , Alam U , Jones W , Jeziorska M , Marshall A , Ponirakis G , Fadavi H , Boulton AJ , Tavakoli M , Malik RA ((2014) ) Corneal confocal microscopy detects neuropathy in subjects with impaired glucose tolerance. Diabetes Care 37: , 2643–2646. |
[38] | Azmi S , Ferdousi M , Petropoulos IN , Ponirakis G , Alam U , Fadavi H , Asghar O , Marshall A , Atkinson AJ , Jones W , Boulton AJ , Tavakoli M , Jeziorska M , Malik RA ((2015) ) Corneal confocal microscopy identifies small-fiber neuropathy in subjects with impaired glucose tolerance who develop type 2 diabetes. Diabetes Care 38: , 1502–1508. |
[39] | Zhang J , Chen C , Hua S , Liao H , Wang M , Xiong Y , Cao F ((2017) ) An updated meta-analysis of cohort studies: Diabetes and risk of Alzheimer’s disease. Diabetes Res Clin Pract 124: , 41–47. |
[40] | Gudala K , Bansal D , Schifano F , Bhansali A ((2013) ) Diabetes mellitus and risk of dementia: A meta-analysis of prospective observational studies. J Diabetes Investig 4: , 640–650. |
[41] | Abner EL , Nelson PT , Kryscio RJ , Schmitt FA , Fardo DW , Woltjer RL , Cairns NJ , Yu L , Dodge HH , Xiong C , Masaki K , Tyas SL , Bennett DA , Schneider JA , Arvanitakis Z ((2016) ) Diabetes is associated with cerebrovascular but not Alzheimer’s disease neuropathology. Dement 12: , 882–889. |
[42] | Dos Santos Matioli MNP , Suemoto CK , Rodriguez RD , Farias DS , da Silva MM , Leite REP , Ferretti-Rebustini REL , Farfel JM , Pasqualucci CA , Jacob Filho W , Arvanitakis Z , Naslavsky MS , Zatz M , Grinberg LT , Nitrini R ((2017) ) Diabetes is not associated with Alzheimer’s disease neuropathology. J Alzheimers Dis 60: , 1035–1043. |
[43] | Vermeer SE , Prins ND , den Heijer T , Hofman A , Koudstaal PJ , Breteler MM ((2003) ) Silent brain infarcts and the risk of dementia and cognitive decline. N Engl J Med 348: , 1215–1222. |
[44] | Snowdon DA , Greiner LH , Mortimer JA , Riley KP , Greiner PA , Markesbery WR ((1997) ) Brain infarction and the clinical expression of Alzheimer disease. The Nun Study. JAMA 277: , 813–817. |
[45] | International Advisory Group for the Revision of ICDM, Behavioural D ((2011) ) A conceptual framework for the revision of the ICD-10 classification of mental and behavioural disorders. World Psychiatry 10: , 86–92. |
[46] | Mattsson N , Zetterberg H , Hansson O , Andreasen N , Parnetti L , Jonsson M , Herukka SK , van der Flier WM , Blankenstein MA , Ewers M , Rich K , Kaiser E , Verbeek M , Tsolaki M , Mulugeta E , Rosen E , Aarsland D , Visser PJ , Schroder J , Marcusson J , de Leon M , Hampel H , Scheltens P , Pirttila T , Wallin A , Jonhagen ME , Minthon L , Winblad B , Blennow K ((2009) ) CSF biomarkers and incipient Alzheimer disease in patients with mild cognitive impairment. JAMA 302: , 385–393. |
[47] | Hansson O , Zetterberg H , Buchhave P , Londos E , Blennow K , Minthon L ((2006) ) Association between CSF biomarkers and incipient Alzheimer’s disease in patients with mild cognitive impairment: A follow-up study. Lancet Neurol 5: , 228–234. |
[48] | Forsberg A , Engler H , Almkvist O , Blomquist G , Hagman G , Wall A , Ringheim A , Langstrom B , Nordberg A ((2008) ) PET imaging of amyloid deposition in patients with mild cognitive impairment. Aging 29: , 1456–1465. |
[49] | Grimmer T , Wutz C , Drzezga A , Forster S , Forstl H , Ortner M , Perneczky R , Kurz A ((2013) ) The usefulness of amyloid imaging in predicting the clinical outcome after two years in subjects with mild cognitive impairment. Alzheimer Res 10: , 82–85. |
[50] | Jack CR Jr. , Bennett DA , Blennow K , Carrillo MC , Dunn B , Haeberlein SB , Holtzman DM , Jagust W , Jessen F , Karlawish J , Liu E , Molinuevo JL , Montine T , Phelps C , Rankin KP , Rowe CC , Scheltens P , Siemers E , Snyder HM , Sperling R , Contributors ((2018) ) NIA-AA Research Framework: Toward a biological definition of Alzheimer’s disease. Dement 14: , 535–562. |


