
Neuronal Calcium Imaging, Excitability, and Plasticity Changes in the Aldh2–/– Mouse Model of Sporadic Alzheimer’s Disease
Abstract
Background:
Dysregulated signaling in neurons and astrocytes participates in pathophysiological alterations seen in the Alzheimer’s disease brain, including increases in amyloid-β, hyperphosphorylated tau, inflammation, calcium dysregulation, and oxidative stress. These are often noted prior to the development of behavioral, cognitive, and non-cognitive deficits. However, the extent to which these pathological changes function together or independently is unclear.
Objective:
Little is known about the temporal relationship between calcium dysregulation and oxidative stress, as some reports suggest that dysregulated calcium promotes increased formation of reactive oxygen species, while others support the opposite. Prior work has quantified several key outcome measures associated with oxidative stress in aldehyde dehydrogenase 2 knockout (Aldh2–/–) mice, a non-transgenic model of sporadic Alzheimer’s disease.
Methods:
Here, we tested the hypothesis that early oxidative stress can promote calcium dysregulation across aging by measuring calcium-dependent processes using electrophysiological and imaging methods and focusing on the afterhyperpolarization (AHP), synaptic activation, somatic calcium, and long-term potentiation in the Aldh2–/– mouse.
Results:
Our results show a significant age-related decrease in the AHP along with an increase in the slow AHP amplitude in Aldh2–/– animals. Measures of synaptic excitability were unaltered, although significant reductions in long-term potentiation maintenance were noted in the Aldh2–/– animals compared to wild-type.
Conclusion:
With so few changes in calcium and calcium-dependent processes in an animal model that shows significant increases in HNE adducts, Aβ, p-tau, and activated caspases across age, the current findings do not support a direct link between neuronal calcium dysregulation and uncontrolled oxidative stress.
INTRODUCTION
Alzheimer’s disease (AD) is a devastating condition underscored by progressive memory loss and profound reductions in quality of life. Currently, there are no effective disease-modifying pharmaceutical interventions, and those that are available provide only symptomatic relief. It is estimated that 5.4 million Americans currently suffer from AD and this number is projected to grow to 13.8 million individuals by the year 2050 [1]. Moreover, the cost of patient care is cumbersome to society, healthcare providers, and, importantly, the families involved. Although much progress has been made in identifying underlying causes and mechanisms, a treatment for AD, much less a cure, remains elusive.
Several dysregulated intracellular signaling pathways that participate in the development of cognitive, as well as non-cognitive, declines have been described for dementias, including frontotemporal, vascular cognitive impairment, and AD [2–5]. AD has been characterized by several pathological markers including amyloid-β (Aβ) plaque deposition, neurofibrillary tangles, impaired glutamatergic and cholinergic neurotransmission, increased production of inflammatory cytokines and oxidative stress, as well as neuronal calcium dysregulation. A number of transgenic animal models have been developed in an attempt to recapitulate these pathological events, with the goal of identifying how they manifest and promote disease progression [6–12]. Perhaps not surprisingly given the complexity and etiology of the disease, few studies have provided clarity regarding the onset of changes and the temporal associations between these pathological events. For example, while there is strong evidence that neuronal calcium dysregulation can drive oxidative stress, there is also ample evidence to support the contrary; that is, that oxidative stress can dysregulate calcium homeostasis [13–20]. To address this, it is advantageous to determine the exact temporal associations between these markers in an attempt to highlight their role in disease progression [21–25].
Oxidative stress-induced damage is critical in the pathogenesis of AD [26–28]. While this damage also occurs as part of normal aging, it appears significantly increased in the brains of AD patients compared to age-matched elderly controls, suggesting the involvement of additional oxidative factors in AD [29–32]. Oxidative damage can be mediated through lipid peroxidation (LPx), protein, and DNA oxidation, decreases in mitochondrial metabolism, and increases in advanced glycation end products [33]. For example, 4-hydroxynonenal (HNE) is a reactive aldehydic byproduct of oxidative stress-induced LPx, and increases in free HNE and HNE protein adducts have been observed in both the brain and cerebrospinal fluid of AD patients [31, 32, 34–37]. Studies have shown that overproduction of HNE can inhibit dephosphorylation of tau, target key mitochondrial enzymes, alter Aβ peptide deposition, mediate cell death, reduce synaptic processes/communication, and impair cognition [38–42]. These findings squarely position HNE as a mediator of cellular damage in oxidative stress, and perhaps also as an initiating factor in AD pathogenesis. Early and widespread manifestation of oxidative stress byproducts in AD patients and in AD animal models precede the development of Aβ plaques, neurofibrillary tangles, and cognitive decline [43–49]. These temporal associations lead to the formulation of the oxidative stress hypothesis of AD [26–28]. While electrophysiological and synaptic structure/function relationships linked to oxidative stress can impact cellular communication and throughput [50–53], the onset of these changes with respect to the manifestation of the phenotype has not been carefully characterized.
While some studies have investigated the association between calcium dysregulation and oxidative stress, few laboratories have directly measured neuronal calcium in the presence of rising oxidative stress loads with aging. In the current study, we used an oxidative stress-induced model of age-related cognitive impairment with a gene deletion of ALDH2, an enzyme important for the detoxification of endogenous aldehydes arising from LPx [41, 54, 55]. This model presents with marked increases in LPx byproducts (i.e., HNE protein adducts) from as early as 3 months of age, followed by age-related increases in Aβ, phosphorylated tau protein (p-tau), and activated caspases, as well as by decreases in synaptic proteins [41]. Moreover, deficits in hippocampus-dependent working and spatial memory tasks, together with reductions in dorsal CA1 dendritic arborization and spine density, are also present in this animal model [41, 55]. The slow, age-driven progression of LPx byproduct accumulation highlights the model’s utility and uniqueness in recapitulating AD phenotypes in the context of aging, and therefore represents a valuable model of sporadic AD. Here, we sought to characterize the relationship between neuronal calcium dysregulation and oxidative stress in an animal model that overproduces HNE adducts at an early age. We chose specific ages to frame the onset of the histopathology in the model before (1.5 months), soon-after (4 months), and well-after (10 months) AD pathology manifestation. Oregon Green Bapta-1 (OGB-1)-based neuronal calcium fluorescence, synaptic and post-synaptic excitability, and long-term potentiation (LTP) changes were characterized to test the hypothesis that early oxidative stress drives calcium dysregulation. Only mild alterations in physiological parameters were seen. This result, combined with small changes in calcium-dependent processes and LTP, do not support the proposal that oxidative stress in this model leads to calcium dysregulation within CA1 neurons undergoing AD-like dysfunction.
METHODS
Animals
Aldehyde dehydrogenase 2 knockout (Aldh2–/–) mice, derived from a C57BL/6J background and generated by a gene-targeting knockout (KO) as previously described [56], were kindly provided by Dr. T. Kawamoto (University of Occupational and Environmental Health, Kitakyushu, Japan). The wild-type (WT) and Aldh2–/– cohorts used in the current study were generated by the mating of heterozygotes (obtained by backcrossing Aldh2–/– mice with WT C57BL/6J mice for more than 10 generations) and genotyping of the progeny using PCR analysis of genomic DNA (extracted from ear punches) utilizing primers previously reported [57]. This process allowed the generation of age- and gender-matched WT and Aldh2–/– littermates. Experimenters were blinded to the genotype of the animals during all data acquisition and throughout analyses.
LTP experiments were conducted on 8-month-old animals derived and maintained at Queen’s University (Kingston, Ontario, Canada). Young-adult (1.5 months), adult (4 months), and mid-age (10 months) mice were shipped to the University of Kentucky in several cohorts. Each cohort represented animals (male and female Aldh2–/– mice and their WT littermates) at a particular age (e.g., 4.5 weeks, 3.5 months, and 9.5 months). As only one animal could be recorded per day, recording for each cohort was staggered across 3–5 weeks. The average age of each cohort was 1.5, 4, and 10 months. Male mice were housed individually while females were paired together. All animals were maintained on a 12 h on/12 h off light cycle and were fed Teklad Global 18% protein rodent diet ad libitum. Routine assessment of animal health was performed by a veterinarian and animals exhibiting signs of morbidity were excluded from the study. Treatment and handling of all animals was in accordance with both university’s Institutional Animal Care and Use Committee guidelines.
Intracellular recordings and calcium imaging
Slice preparation
Mice were anesthetized using inhalable isoflurane (5%) followed by decapitation. Brains were quickly removed and incubated in ice-cold low calcium, high magnesium artificial cerebrospinal fluid (ACSF): (in mM) 114 NaCl, 3 KCl, 10 glucose, 1.25 KH2PO4, 26 NaHCO3, 0.096 CaCl2 anhydrous, and 7.98 MgCl2 anhydrous. Slices (350μm thick) from the dorsal hippocampus were sectioned using a Vibratome® 3000 (TPI; St. Louis, MO) and incubated for at least 2 h at 32°C in a humidified (95% O2–5% CO2) interface-type chamber in normal calcium ACSF: (in mM) 114 NaCl, 3 KCl, 10 glucose, 1.25 KH2PO4, 26 NaHCO3, 2 CaCl2 anhydrous, and 2 MgCl2 anhydrous. Slices were then placed on a net in a heated recording chamber (RC-22C; Warner Instruments, Co., Hamden, CT) at 32°C with a TC2Bip/HPRE2 in-line heating system (Cell Micro Controls; Norfolk, VA) and perfused (above and below the slice) with a continuous flow of oxygenated normal calcium ACSF at the rate of 1.5 mL/min. Slices were visualized under a Nikon Eclipse E600FN microscope.
Current clamp electrophysiology
Sharp electrodes (∼80–120 MΩ) were pulled from 1.0 mm diameter borosilicate glass capillaries (World Precision Instruments, Inc.; Sarasota, FL) on a Sutter Instruments P80 pipette puller (Novato, CA). Tips were initially backfilled with a bolus of 1.25 mM OGB-1, pH 7.4 (ThermoFisher Scientific, Catalog number: O6806; Waltham, MA). The rest of the electrode was filled with 1 M potassium methyl sulfate (KMeSO4) in 10 mM HEPES. A bipolar stimulating electrode was placed on the Schaffer collaterals (SC) for stimulation (0.1 ms duration) and the sharp electrode was slowly advanced through stratum pyramidale of field CA1 to record primary neurons. A stimulator (SD9K, Astro Med Inc., Grass Instruments; Warwick, RI) was used for synaptic activation. Responses were recorded through an AxoClamp-2B amplifier (Molecular Devices LLC.; San Jose, CA) and digitized at ∼5–10 KHz with a Digidata® 1550B (Molecular Devices LLC.). Data were processed through pClamp (v10.7, Molecular Devices LLC.). While other cell types, including interneurons and astrocytes, are present in field CA1, compactness of the pyramidal layer, morphology of the cell imaged, and spiking properties of the cell were used to limit our recordings to only primary pyramidal neurons.
Afterhyperpolarization (AHP)
For measures of post-synaptic excitability, cells were held at –65 mV and action potential (AP) threshold was set to –55 mV. Four AP were evoked (depolarizing 150 ms current injection) to generate the calcium-dependent AHP every 30 s for 5 min. Three measures of the AHP were quantified: the medium AHP (mAHP), the slow AHP (sAHP), and the AHP duration. The mAHP was defined as the peak hyperpolarization observed immediately after the end of current injection. The sAHP was measured as the change in amplitude at 800 ms post-current injection compared to baseline. Quantification of the AHP duration was defined as the time between peak amplitude of the AHP and the return to baseline. We report data on 12 neurons/8 mice (1.5 months), 11 neurons/8 mice (4 months), and 11 neurons/7 mice (10 months) in the WT dataset, and on 17 neurons/15 mice (1.5 months), 9 neurons/7 mice (4 months), and 13 neurons/6 mice (10 months) in the Aldh2–/– dataset.
Input/Output (I/O) curves
For measures of synaptic excitability, cells were held at –70 mV and stimulated every 10 s. Excitatory post-synaptic potential (EPSP) amplitudes were measured from an increasing series of activation voltages. Amplitudes were used to determine the threshold for an AP and then plotted to generate I/O curves and their slopes. We report on data from 10 neurons/7 mice (1.5 months), 10 neurons/8 mice (4 months), and 11 neurons/7 mice (10 months) in the WT dataset, and 16 neurons/15 mice (1.5 months), 8 neurons/6 mice (4 months), and 11 neurons/6 mice (10 months) in the Aldh2–/– dataset.
Repeated synaptic stimulation
Synaptic stimulation intensity during repeated synaptic stimulation (RSS; 10 s, 7 Hz) was set at the threshold for an AP. Outcome measures included synaptic hyperpolarization and EPSP facilitation in relation to the first EPSP (baseline) in the train. Synaptic hyperpolarization was measured as the mean peak hyperpolarization amplitudes following the 6th through 9th EPSPs. The growth of the EPSP during the train was measured early (EPSPs 6 through 9) and late (last four EPSPs) during RSS. We report on data from 10 neurons/7 mice (1.5 months), 10 neurons/8 mice (4 months), and 11 neurons/7 mice (10 months) in the WT dataset, and 15 neurons/14 mice (1.5 months), 8 neurons/6 mice (4 months), and 11 neurons/6 mice (10 months) in the Aldh2–/– dataset.
Calcium imaging
Cells were visualized under a 40× objective using a filter cube (Ex: 470/40 nm; Em: 525/50; Dichroic 495 nm; Chroma Technology Corp.; Bellows Falls, VT). Imaging Workbench (INDEC BioSystems; Los Altos, CA) was used to quantify signals. A Lambda DG-4 (Sutter Instruments; Novato, CA) was used as a source to activate the fluorophore with exposures in the range of 250–800 ms, depending on the depth of the cell imaged. OGB-1 dye was allowed to diffuse from the tip of the recording electrode for 10–15 min prior to initiation of calcium imaging experiments. A photometrics camera (Teledyne Photometrics; Tucson, AZ) was used to image calcium fluorescence and kinetics. Two regions of interest (ROI) were created: one around the cell body and another of similar size in tissue adjacent to the imaged cell. Background subtraction and normalization to baseline (ΔF/F%) were used during analysis of OGB-1 signal. For quantification of resting fluorescence, values were averaged before RSS and normalized to the depth of the recorded cell. Outcome measures included rise time, peak amplitude, decay time, and area-under-the-curve (AUC) (ΔF/F % *s) during RSS and were derived using ClampFit (Molecular Devices LLC.; San Jose, CA) and SigmaPlot (Systat Software, Inc.; San Jose, CA). Data reported here were taken from 8 neurons/7 mice (1.5 months), 7 neurons/5 mice (4 months), and 9 neurons/6 mice (10 months) for the WT dataset, and 8 neurons/8 mice (1.5 months), 6 neurons/5 mice (4 months), and 11 neurons/6 mice (10 months) for the Aldh2–/– dataset.
Cell health and exclusion criteria
Only neurons that fit the following criteria were included in this study: input resistance ≥30 MΩ, holding current ≤ than –350 pA, and AP peak ≥0 mV. If the number of APs during RSS was greater than two standard deviations (SD) from the mean, the cell was deemed an outlier and removed from the analysis. A summary of these values is reported in Table 1.
Table 1
Measures of Neuronal Health and Resting Fluorescence
| Genotype | Age (months) | Holding Current (pA) | Input Resistance (MΩ) | Action Potential Amplitude (mV) | # of Action Potentials | Resting Fluorescence (ΔF/F) |
| WT | 1.5 | –83.3±25.4 | 67.0±5.4 | 12.8±1.7 | 69.9±0.1 | 68.6±20.2 |
| 4 | –182.5±21.3 | 63.0±3.3 | 7.3±1.6 | 75.6±0.4 | 51.0±17.5 | |
| 10 | –152.7±36.2 | 55.8±4.7 | 11.4±1.6 | 70.2±1.3 | 79.2±19.7 | |
| Aldh2–/– | 1.5 | –105.6±21.2 | 65.3±4.6 | 11.3±1.4 | 70.0±0 | 73.3±27.9 |
| 4 | –167.8±29.6 | 55.2±4.4 | 9.9±1.5 | 76.0±0 | 63.9±23.6 | |
| 10 | –143.8±20.1 | 68.1±4.3 | 7.5±1.1 | 70.5±1.5 | 105.8±24.0 | |
| Significance | - | ∗p < 0.01 | n.s. | n.s. | ∗p < 0.001 | n.s. |
Properties of neuronal health were compared across age and genotype. Holding current and input resistance measures reflect plasma membrane integrity and “leakiness.” Additionally, action potential amplitude during AHP data acquisition and the number of action potentials during calcium imaging are reported. Resting fluorescence was normalized to the depth of each cell imaged. While a significant aging effect on holding current was seen from 1.5 to 4 months (p < 0.01), this was only present within the WT group. A main effect of age on the number of action potentials triggered during imaging was seen (p < 0.001); however, this did not have an impact on calcium (see results). Asterisks (∗) represent significant main effect of age. Numbers represent means±SEM and “n.s.” indicates non-significance.
LTP induction and measures
Slice preparation
Hemi-brain slices from the dorsal hippocampus were obtained from male KO and WT mice at 8 months of age. Animals were sacrificed by decapitation, and the brain was rapidly extracted and transferred into a slicing chamber containing ice-cold ACSF ([in mM] 124 NaCl, 26.2 NaHCO3, 4.4 KCl, 1.3 MgSO4, 1 NaH2PO4, 2.5 CaCl2, 10 glucose, and 19.7 mannitol; pH 7.3–7.4) saturated with carbogen (95% O2/5% CO2). The brain was split into two hemispheres using a scalpel and sectioned into 400μm transverse slices using a vibratome (Leica VT1200s; Leica Microsystems, Concord, ON). Slices were then transferred into a submerged incubation chamber filled with ACSF, continuously bubbled with carbogen, maintained at 33.5°C, and allowed to recover for 2 h prior to recording.
Extracellular recordings
Following incubation, each slice was transferred into a submersion-type recording chamber maintained at 32°C and continuously perfused with carbogen-saturated ACSF at a rate of 2–3 mL/min. A concentric bipolar stimulating electrode (Rhodes Medical instruments, Catalog Number SNE-100X; Tujunga, CA) was placed in the SC fibers, while a glass recording electrode (tip resistance 1–2 MΩ) containing ACSF was placed within the stratum radiatum of area CA1 of the dorsal hippocampus. Stimulation (0.1 ms duration) was delivered by an electrode connected to a stimulus isolation unit (FE180 Stimulus Isolator; AD Instruments, Colorado Springs, CO, USA) providing a constant current output. The field postsynaptic potentials (fPSPs) in CA1 were recorded with glass electrodes referenced against an Ag/AgCl pellet in the recording chamber bath. The recording electrode was connected to an Axopatch-200A amplifier (Molecular Devices LLC.) and A/D converter (PowerLab 4/35 running v8 LabChart; AD Instruments), allowing the signal to be filtered (low pass at 1 kHZ), digitized (10 kHz), and stored for offline analysis. The signal was additionally conditioned online using the Hum Bug (Quest Scientific, Vancouver, BC).
I/O curves
I/O curves were established by stimulating the SC at increasing intensities (0.5–2.0 mA in 0.1 mA increments). Data reported here were taken from 15 WT and 10 Aldh2–/– mice (an error was made saving the data resulting in the loss of one observation point). Based on these curves, a stimulation intensity yielding ∼50–60% of the maximal fPSP amplitude was used for baseline and LTP induction recording.
LTP induction
Data reported here were taken from 15 WT and 11 Aldh2–/– mice. Hippocampal fPSPs (every 30 s) were recorded until 30 min of stable baseline was achieved (≤10% difference between successive data points for fPSPs, averaged over 5 min epochs). Subsequently, high frequency stimulation (HFS) consisting of 100 single pulses (0.1 ms at 100 Hz) per burst (pulse intensity as determined above) was delivered to the SC fibers. Two trains of HFS were delivered in total, with 30 s between trains. Hippocampal fPSPs were recorded for 60 min following the second HFS episode.
Statistical analyses
Electrophysiological and imaging data were tested for significance on main effects of age and genotype using two-way ANOVAs (SigmaPlot; Systat Software, Inc.; San Jose, CA). Sex differences using three-way ANOVAs (SigmaPlot; Systat Software, Inc.; San Jose, CA) were also investigated, but are not reported here (see results). Two-way repeated measures mixed ANOVAs (GraphPad Prism 8) were used to determine differences in the extent of LTP in WT and Aldh2–/– mice. Greenhouse-Geisser corrections were applied where appropriate. Student’s t-tests (unpaired) were used to investigate LTP maintenance 40–60 min after induction. For all LTP experiments, only one recording was obtained per animal. A p value of <0.05 was considered to be significant for all measures. All data are reported as means±standard error of the mean (SEM).
RESULTS
Previous work using Aldh2–/– mice has shown little evidence of sex differences in this KO model [41, 58]. Because statistical significance was quantitatively consistent across the variables measured irrespective of the inclusion of sex, and because of the low number of recorded/imaged cells in some groups, sexes were combined for measures of calcium and both pre- and post-synaptic excitability (Figs. 1–4). Nevertheless, we present ANOVA results on key outcome measures either with sex combined or separated by sex. LTP measures were only conducted in male WT and KO mice (Fig. 5).
Fig. 1
AHP in WT and Aldh2–/– Mice Across Age. A) Representative AHP following post-synaptic depolarization with 4 action potentials. B, C) A main effect of aging (p < 0.02) on the mAHP and sAHP was observed within each genotype. A main effect of genotype was also present on the sAHP (p < 0.04). D) Measures of the AHP duration were unaltered across aging or genotypes. We report data on 12 neurons (1.5 months), 11 neurons (4 months), and 11 neurons (10 months) in the WT dataset, and on 17 neurons (1.5 months), 9 neurons (4 months), and 13 neurons (10 months) in the Aldh2–/– dataset. Asterisks (*) represent significance across aging (above left and right bars) and genotype (top horizontal bar separated by an ampersand) at p < 0.05.
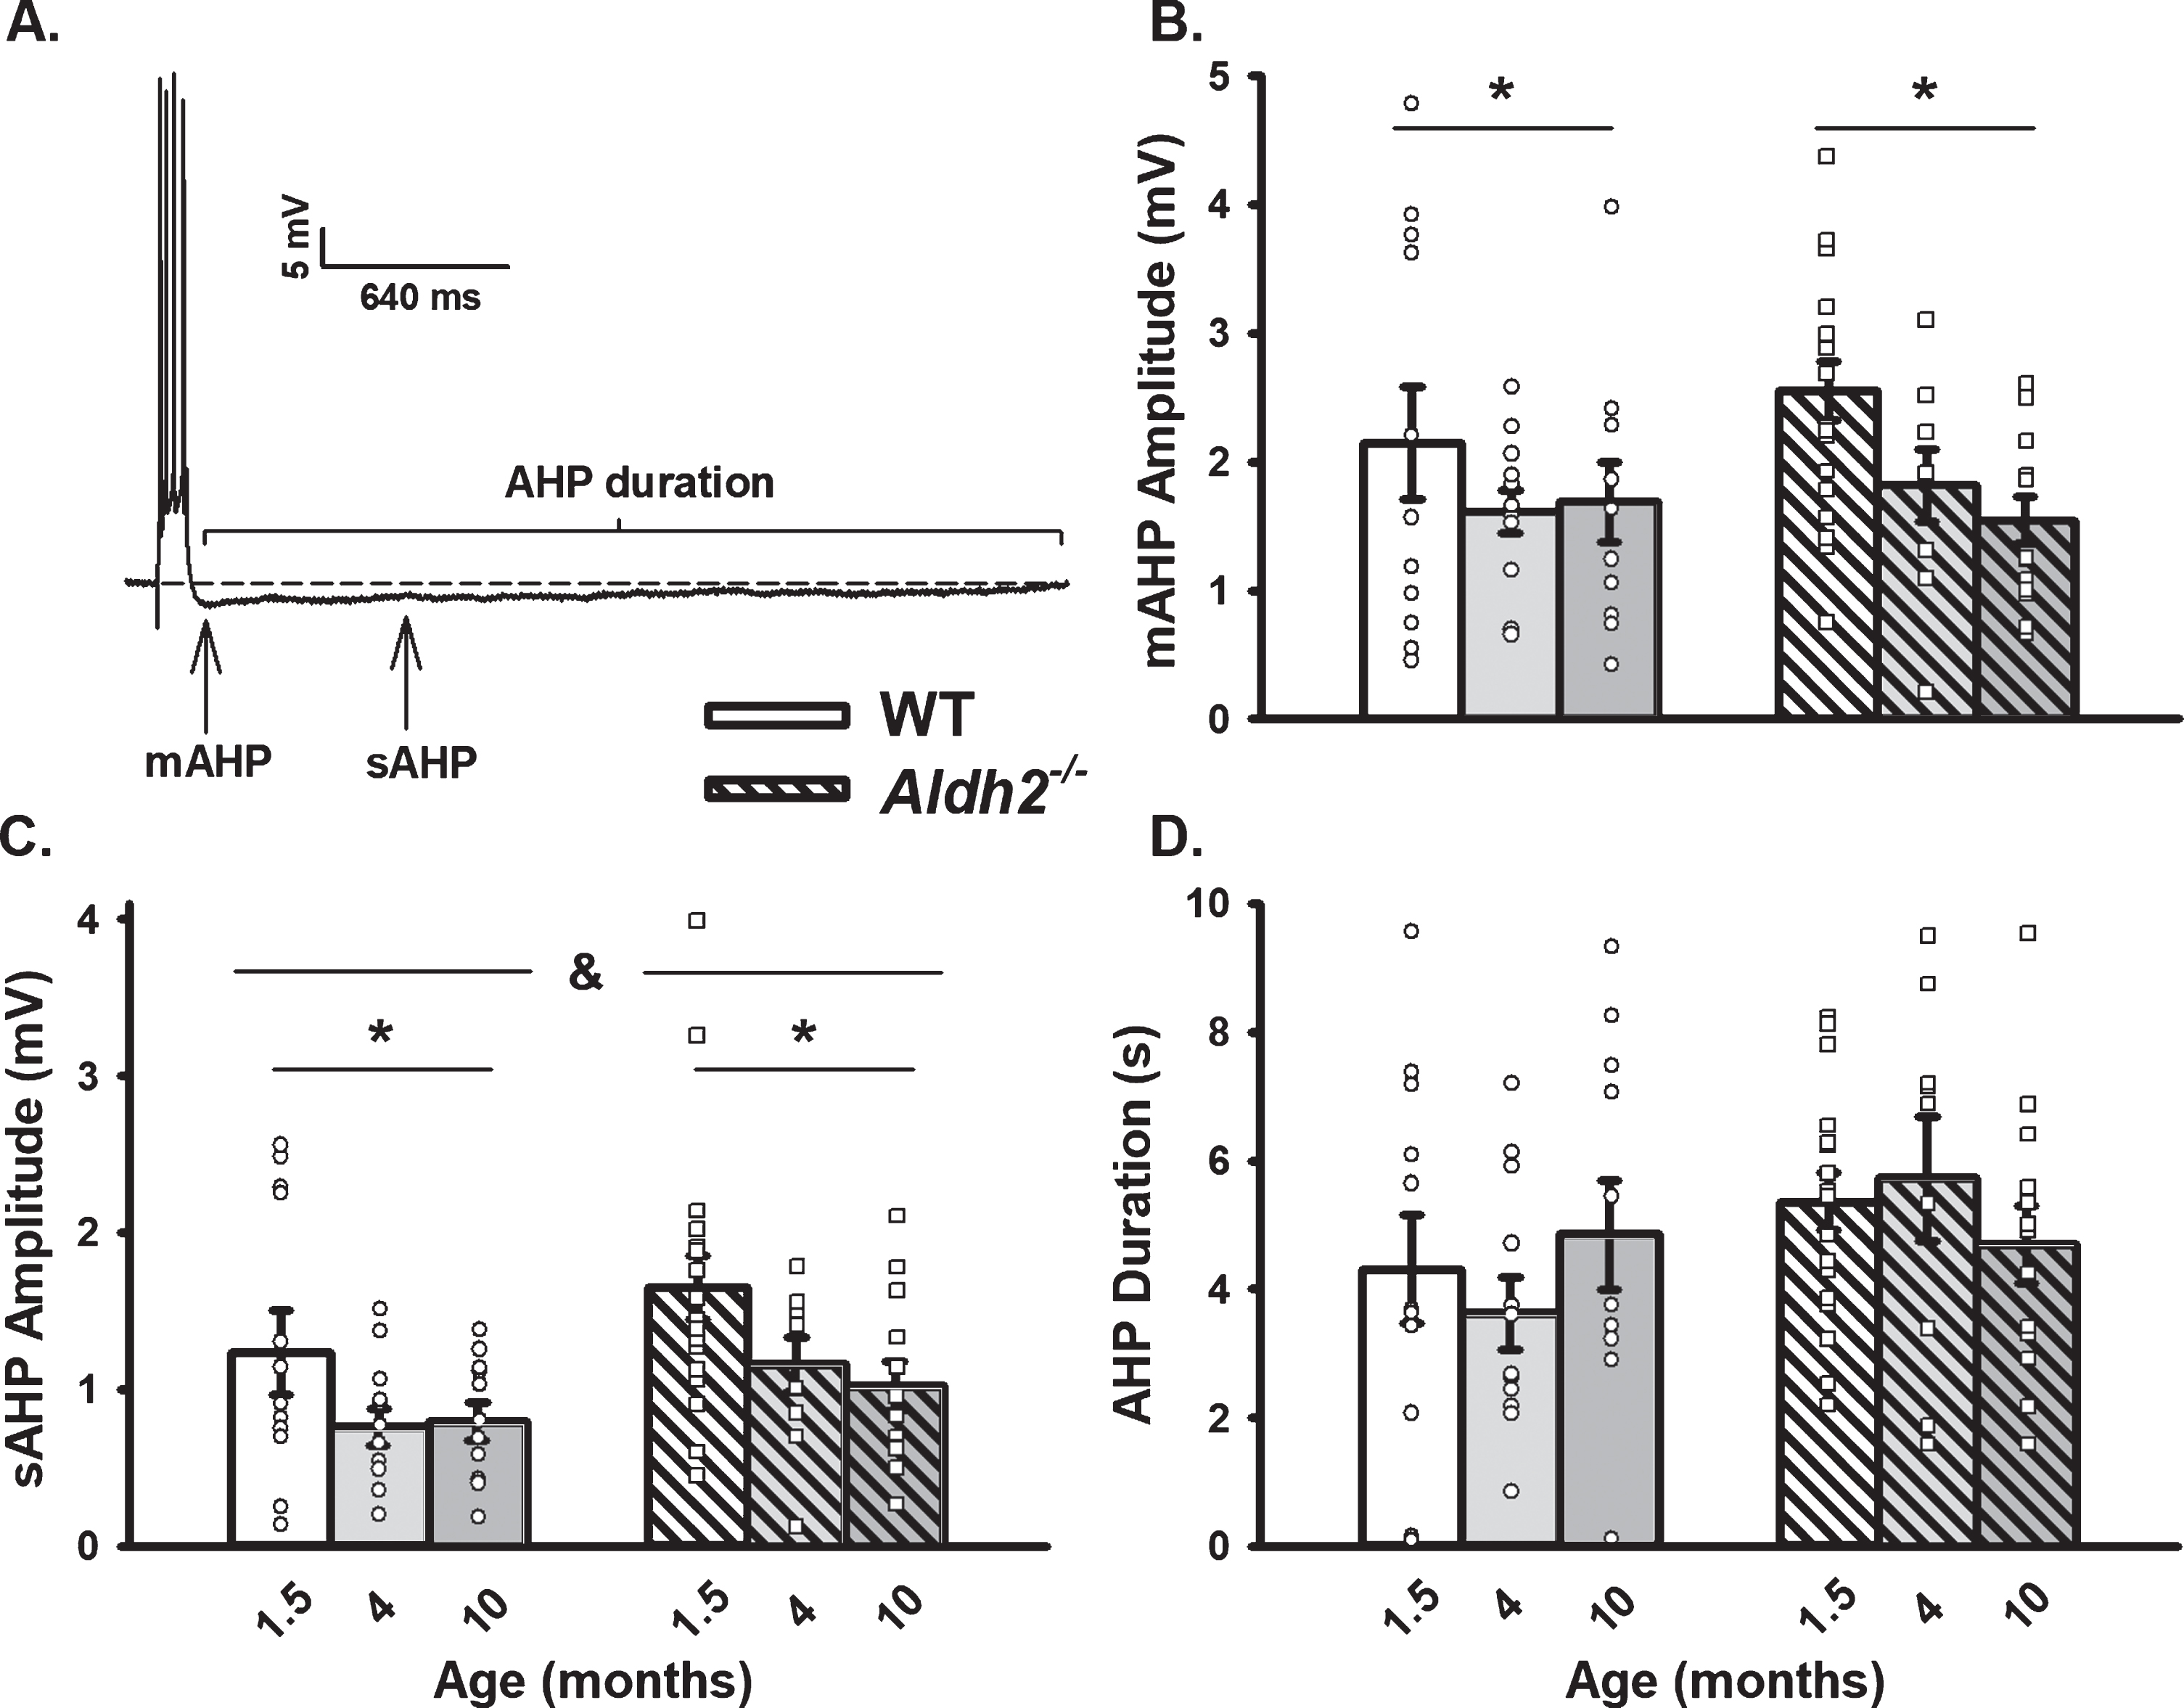
Fig. 2
Extracellular Synaptic Activation. A) Example of EPSPs recorded below and at threshold of an action potential. Inset shows I/O plot fit from EPSP amplitudes with increasing stimulation intensity. B) Synaptic excitability derived from I/O measures (slopes). Black dot represents the time at which synaptic stimulation was initiated. We report on data from 10 neurons (1.5 months), 10 neurons (4 months), and 11 neurons (10 months) in the WT dataset, and 16 neurons (1.5 months), 8 neurons (4 months), and 11 neurons (10 months) in the Aldh2–/– dataset. Results showed no differences across genotype or age (p > 0.05).
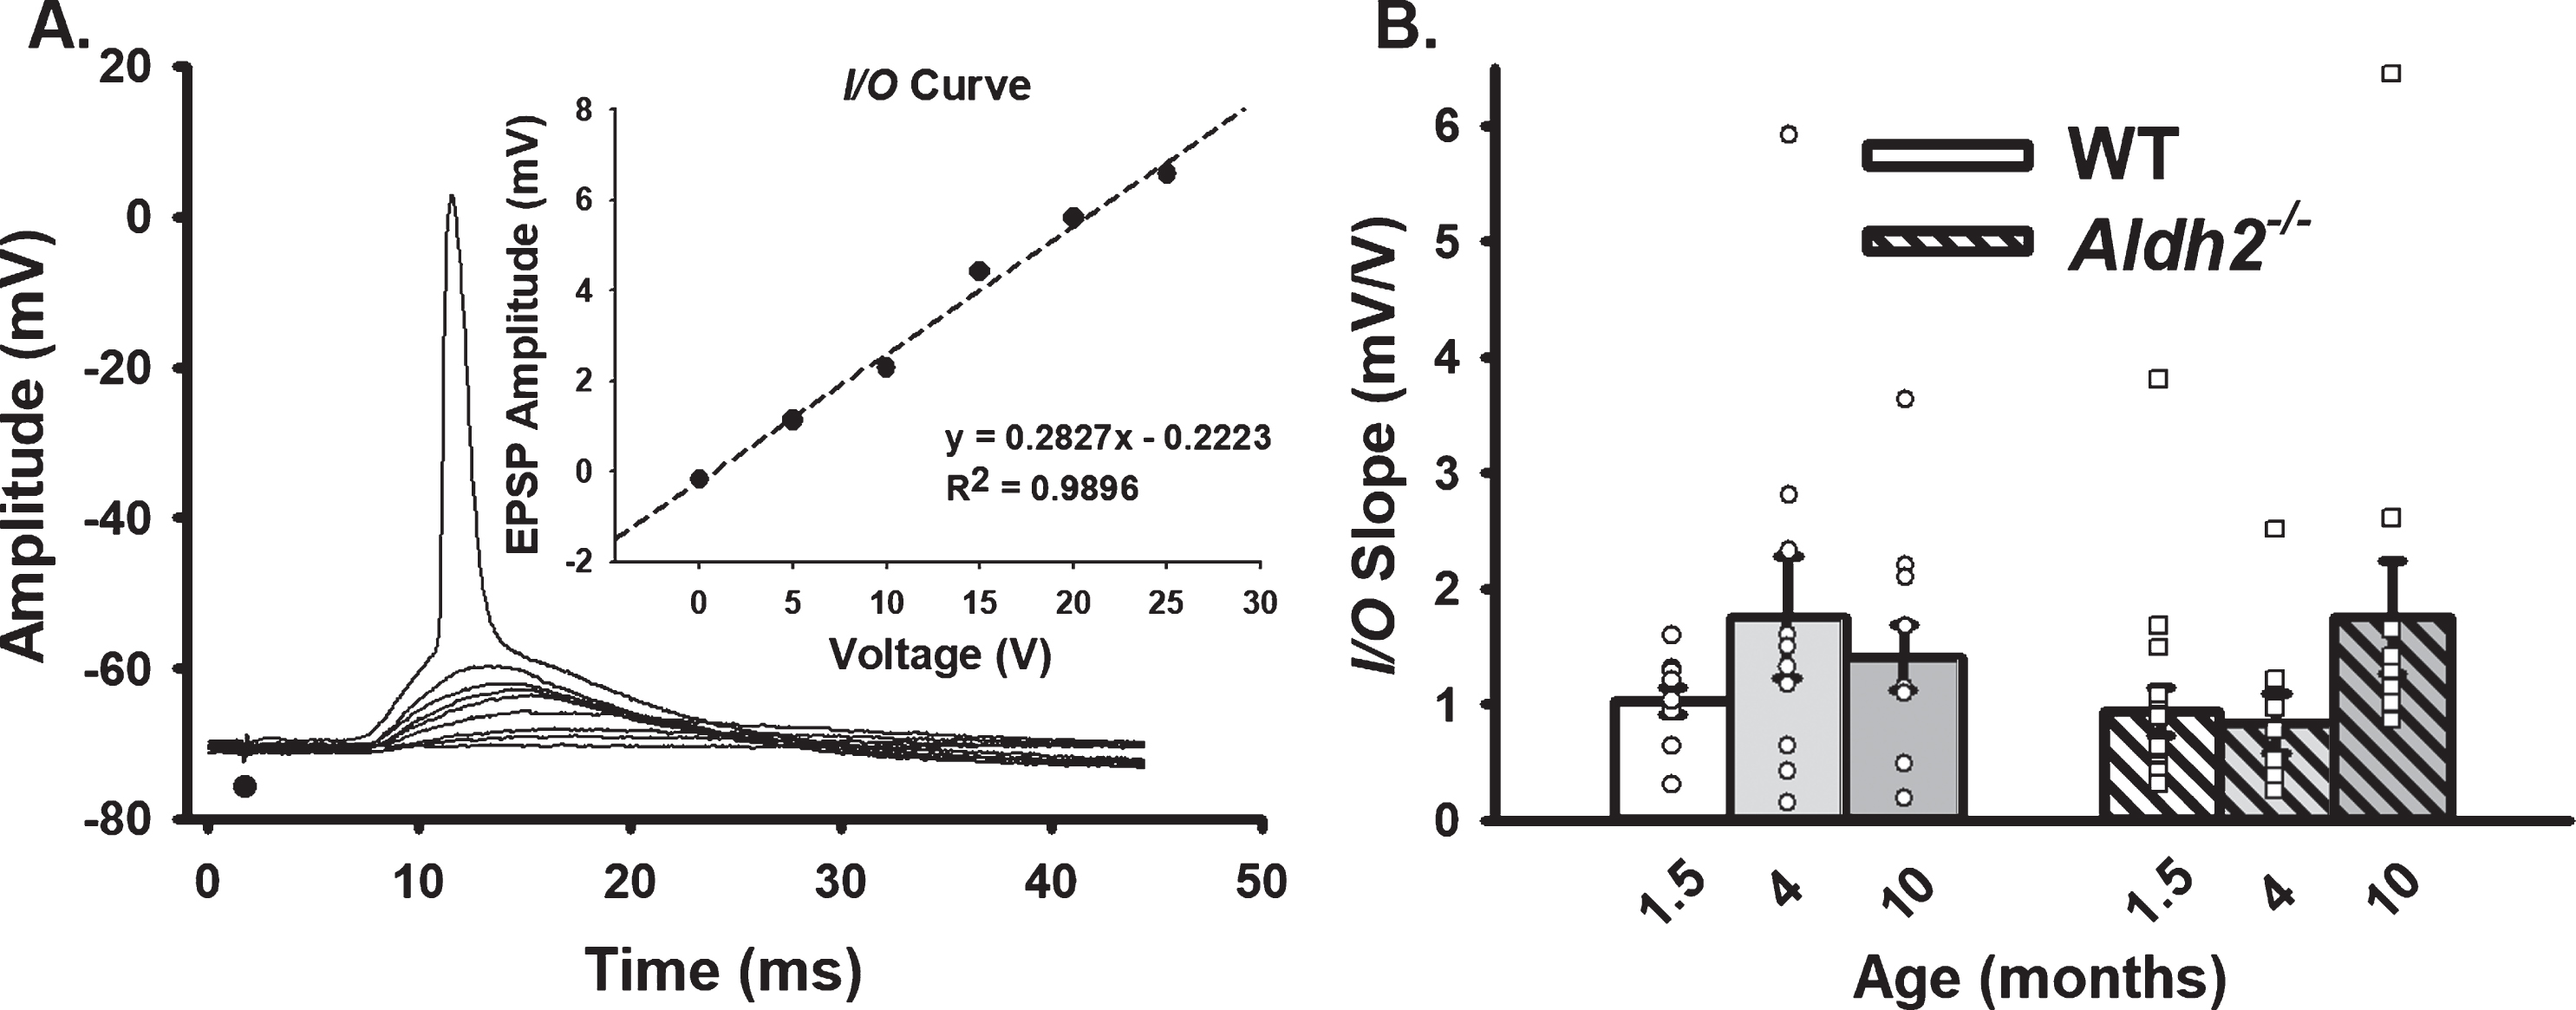
Fig. 3
Repeated Synaptic Stimulation (RSS). A) Example of RSS showing EPSP potentiation and synaptic hyperpolarization. B) Upward arrows illustrate growth in EPSP amplitude during repeated activation (7 Hz for 10 s), while downward arrows show increased amplitude in the synaptic hyperpolarization. Action potentials were truncated for illustration. C–E) Synaptic hyperpolarization measured during RSS and EPSP facilitation taken during the first (early) and last (late) periods of RSS. Black dots represent the time at which synaptic stimulation was initiated. We report on data from 10 neurons (1.5 months), 10 neurons (4 months), and 11 neurons (10 months) in the WT dataset, and 15 neurons (1.5 months), 8 neurons (4 months), and 11 neurons (10 months) in the Aldh2–/– dataset. No differences in synaptic hyperpolarization, early EPSP facilitation, or late EPSP facilitation were detected across age or genotype (p > 0.05).
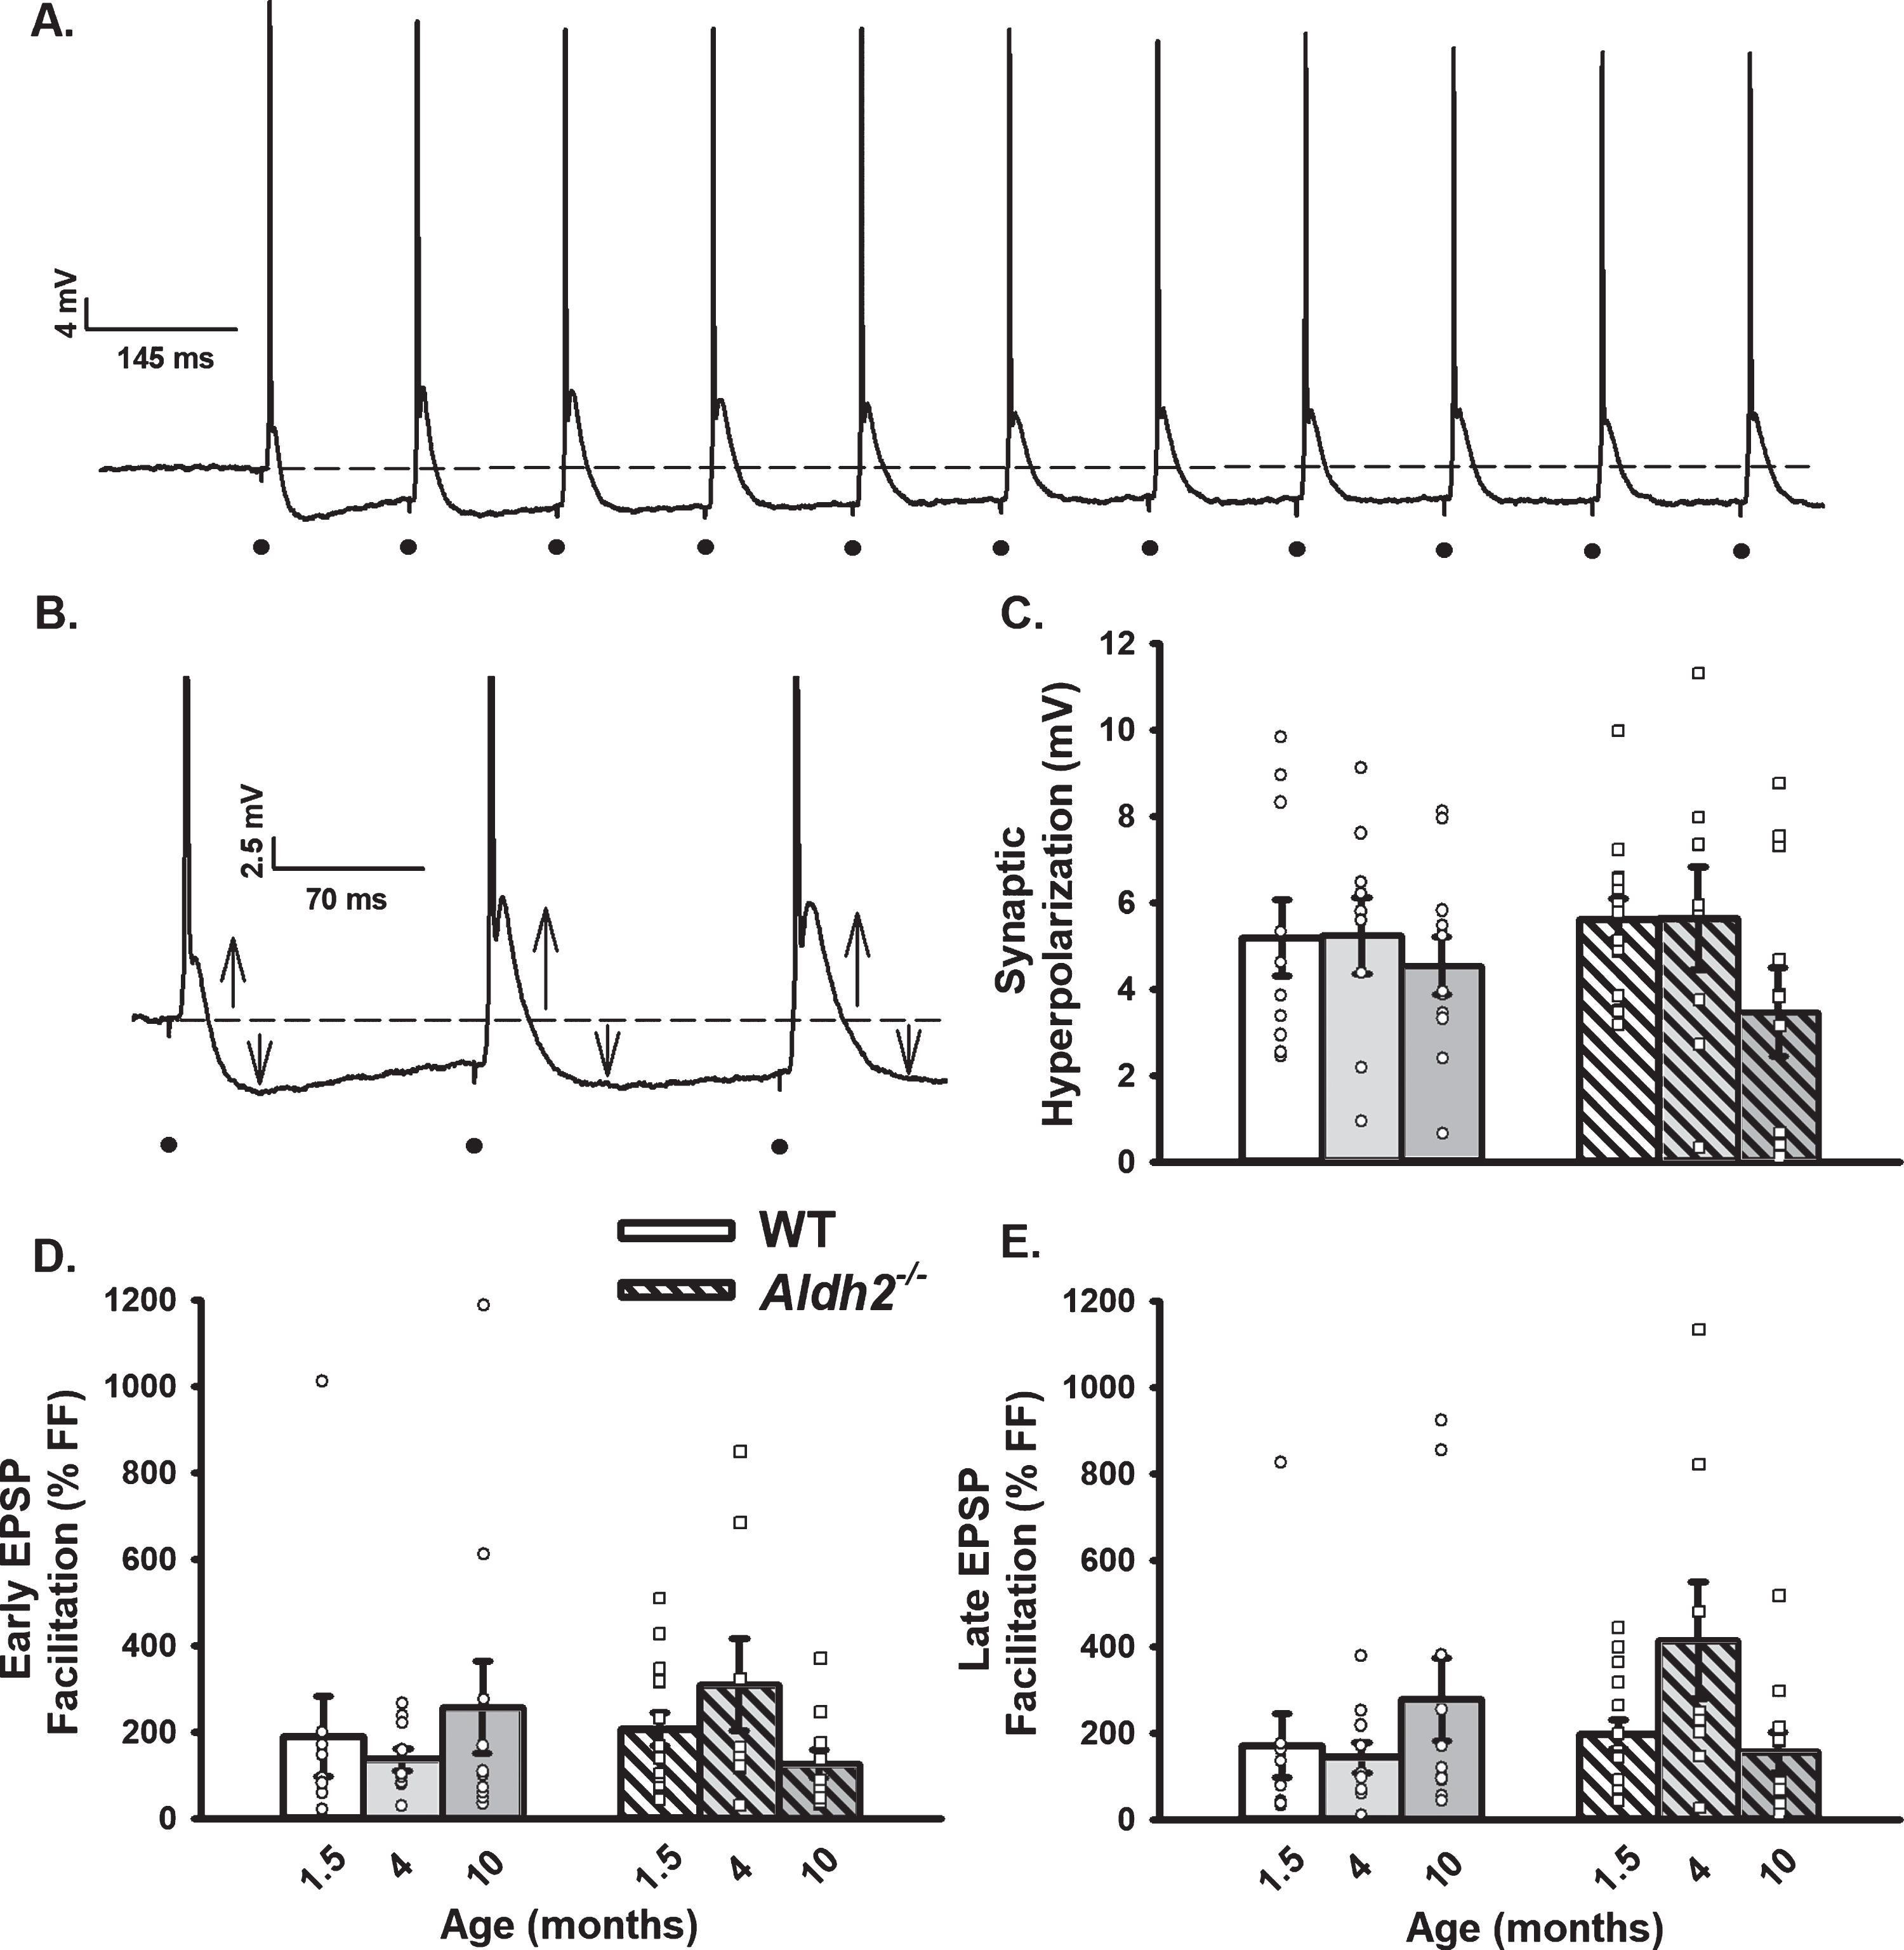
Fig. 4
Changes in OGB-1 Fluorescence During 10 s RSS. A) Example of an imaged neuron loaded with OGB-1. B) Normalized fluorescence change across time (% ΔF/F) before, during, and after synaptic stimulation in the cellular compartment (dark line) and in the extracellular space adjacent to the cell (gray line). C–F) Measures of calcium kinetics (rise and decay time) and somatic calcium levels (peak amplitude and AUC). Data reported here were taken from 8 neurons (1.5 months), 7 neurons (4 months), and 9 neurons (10 months) for the WT dataset, and 8 neurons (1.5 months), 6 neurons (4 months), and 11 neurons (10 months) for the Aldh2–/– dataset. No significant differences across age or genotype were detected (p > 0.05).
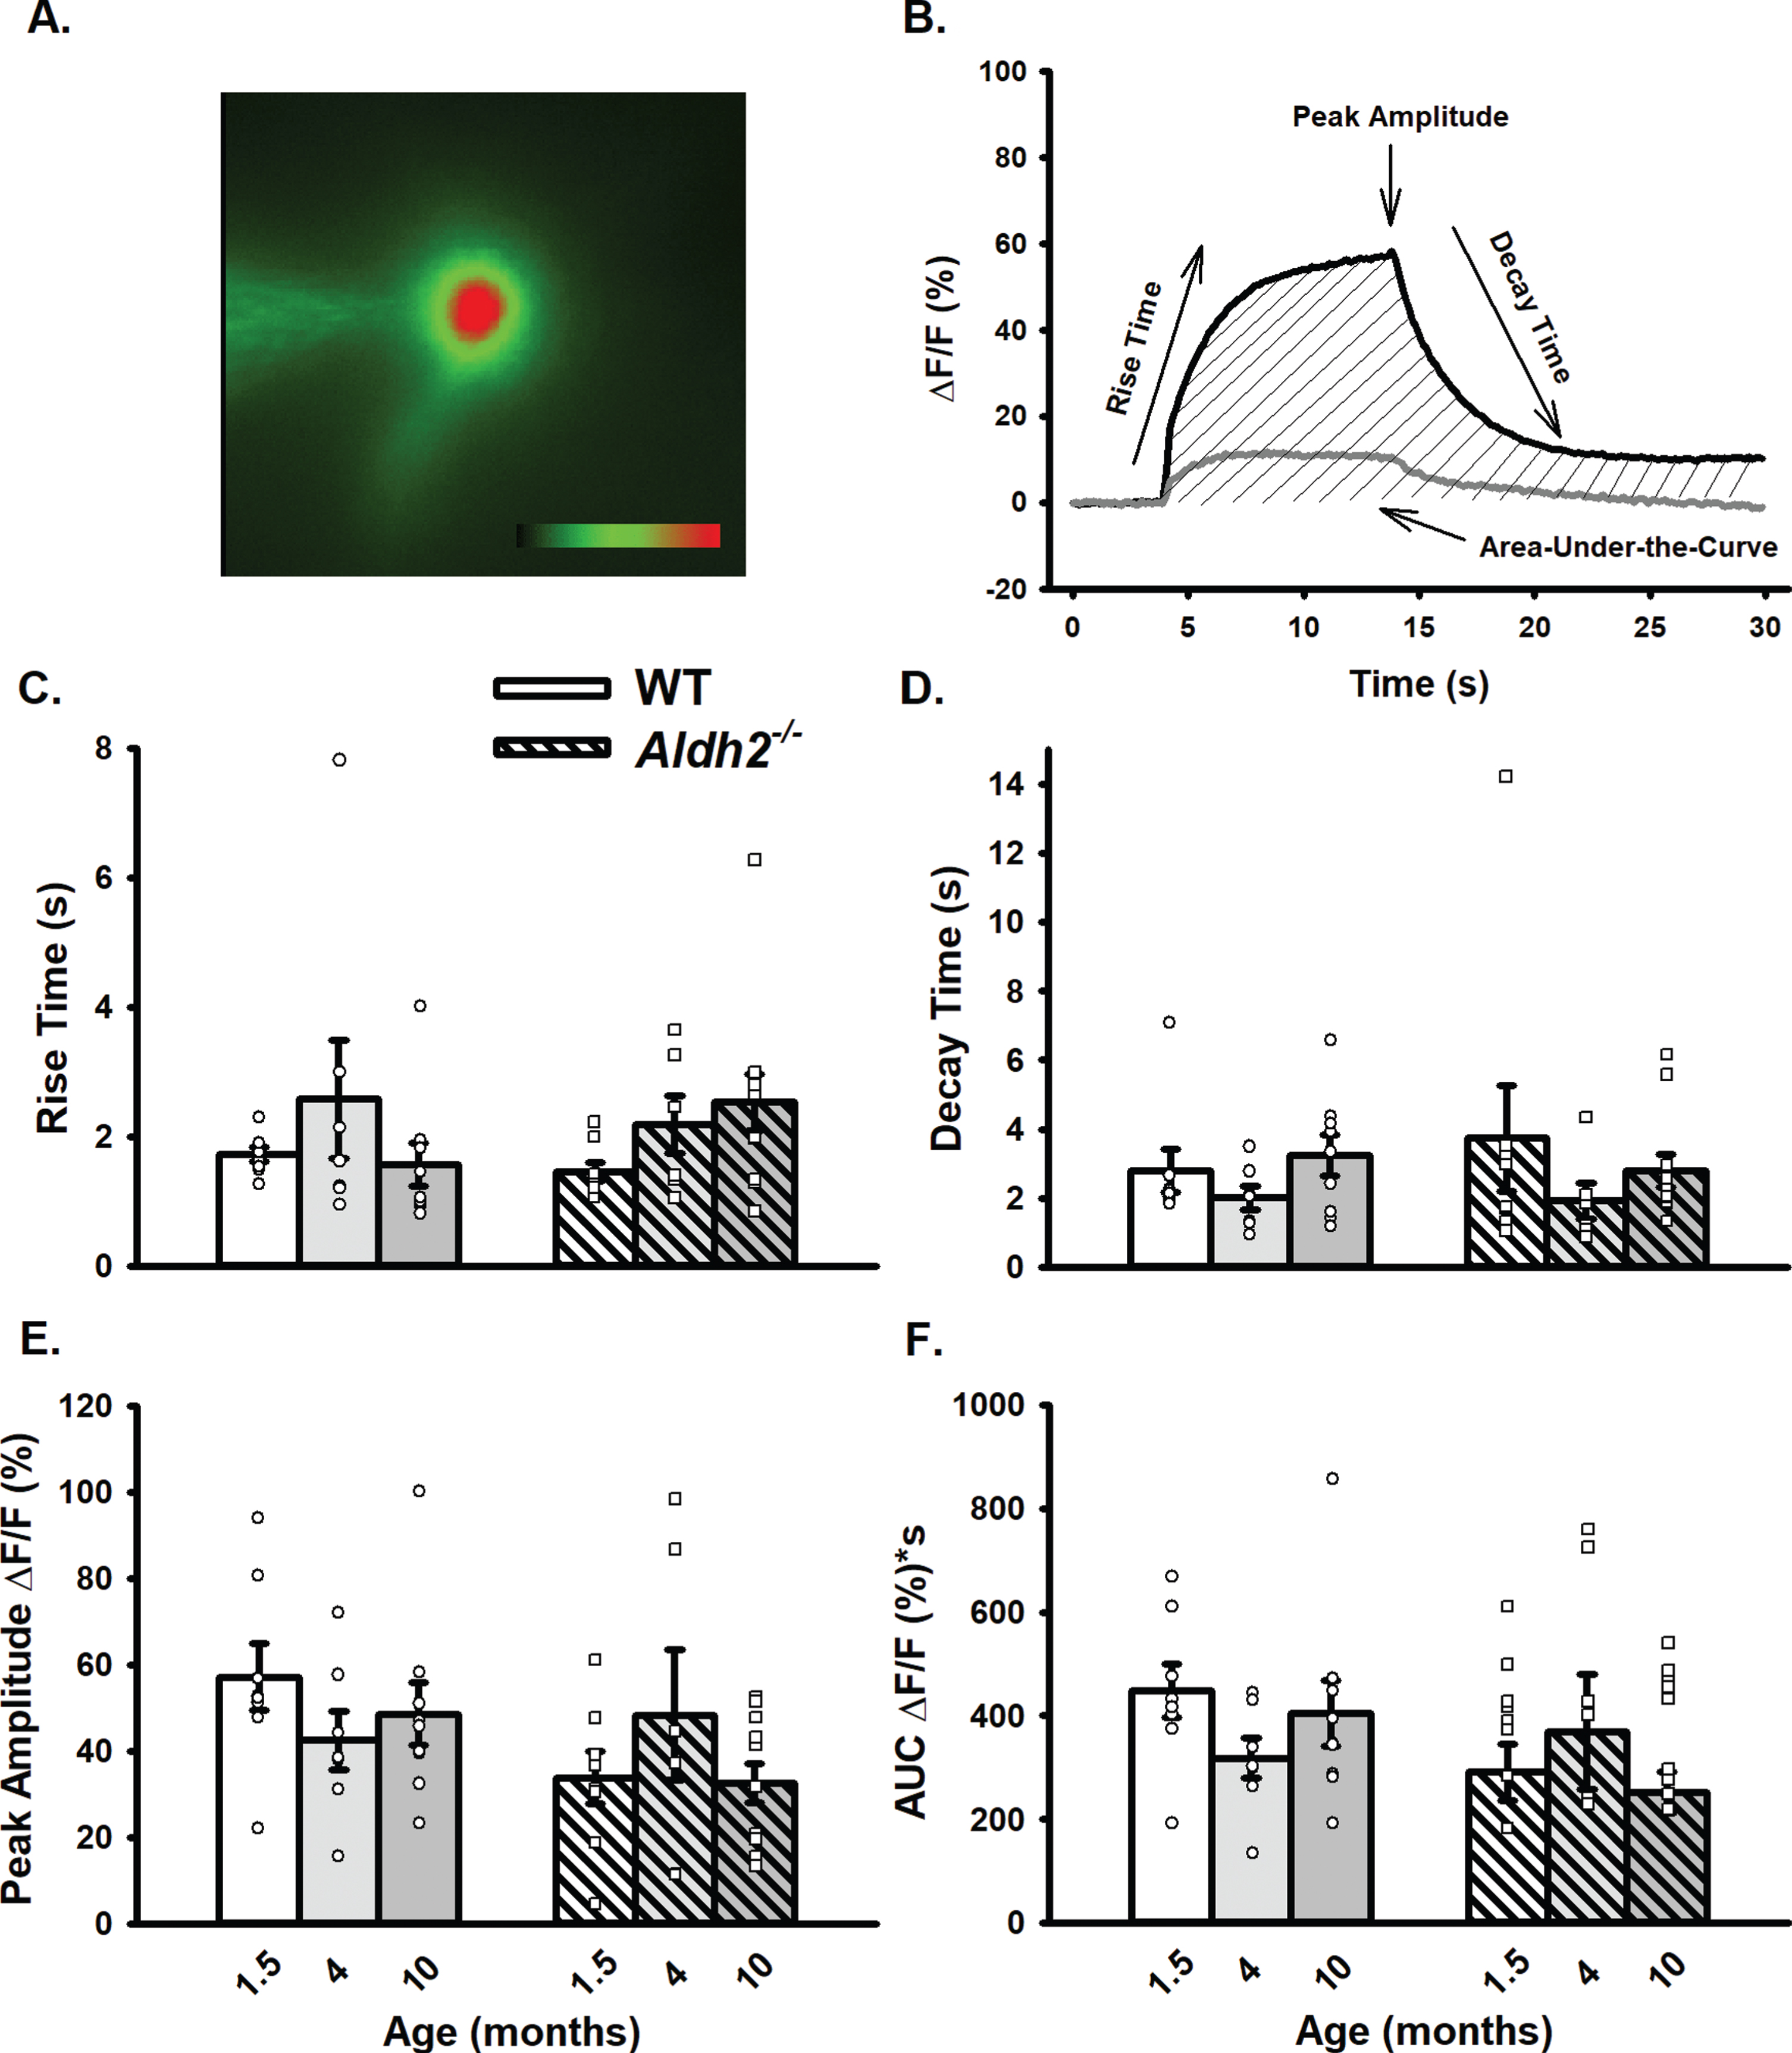
Fig. 5
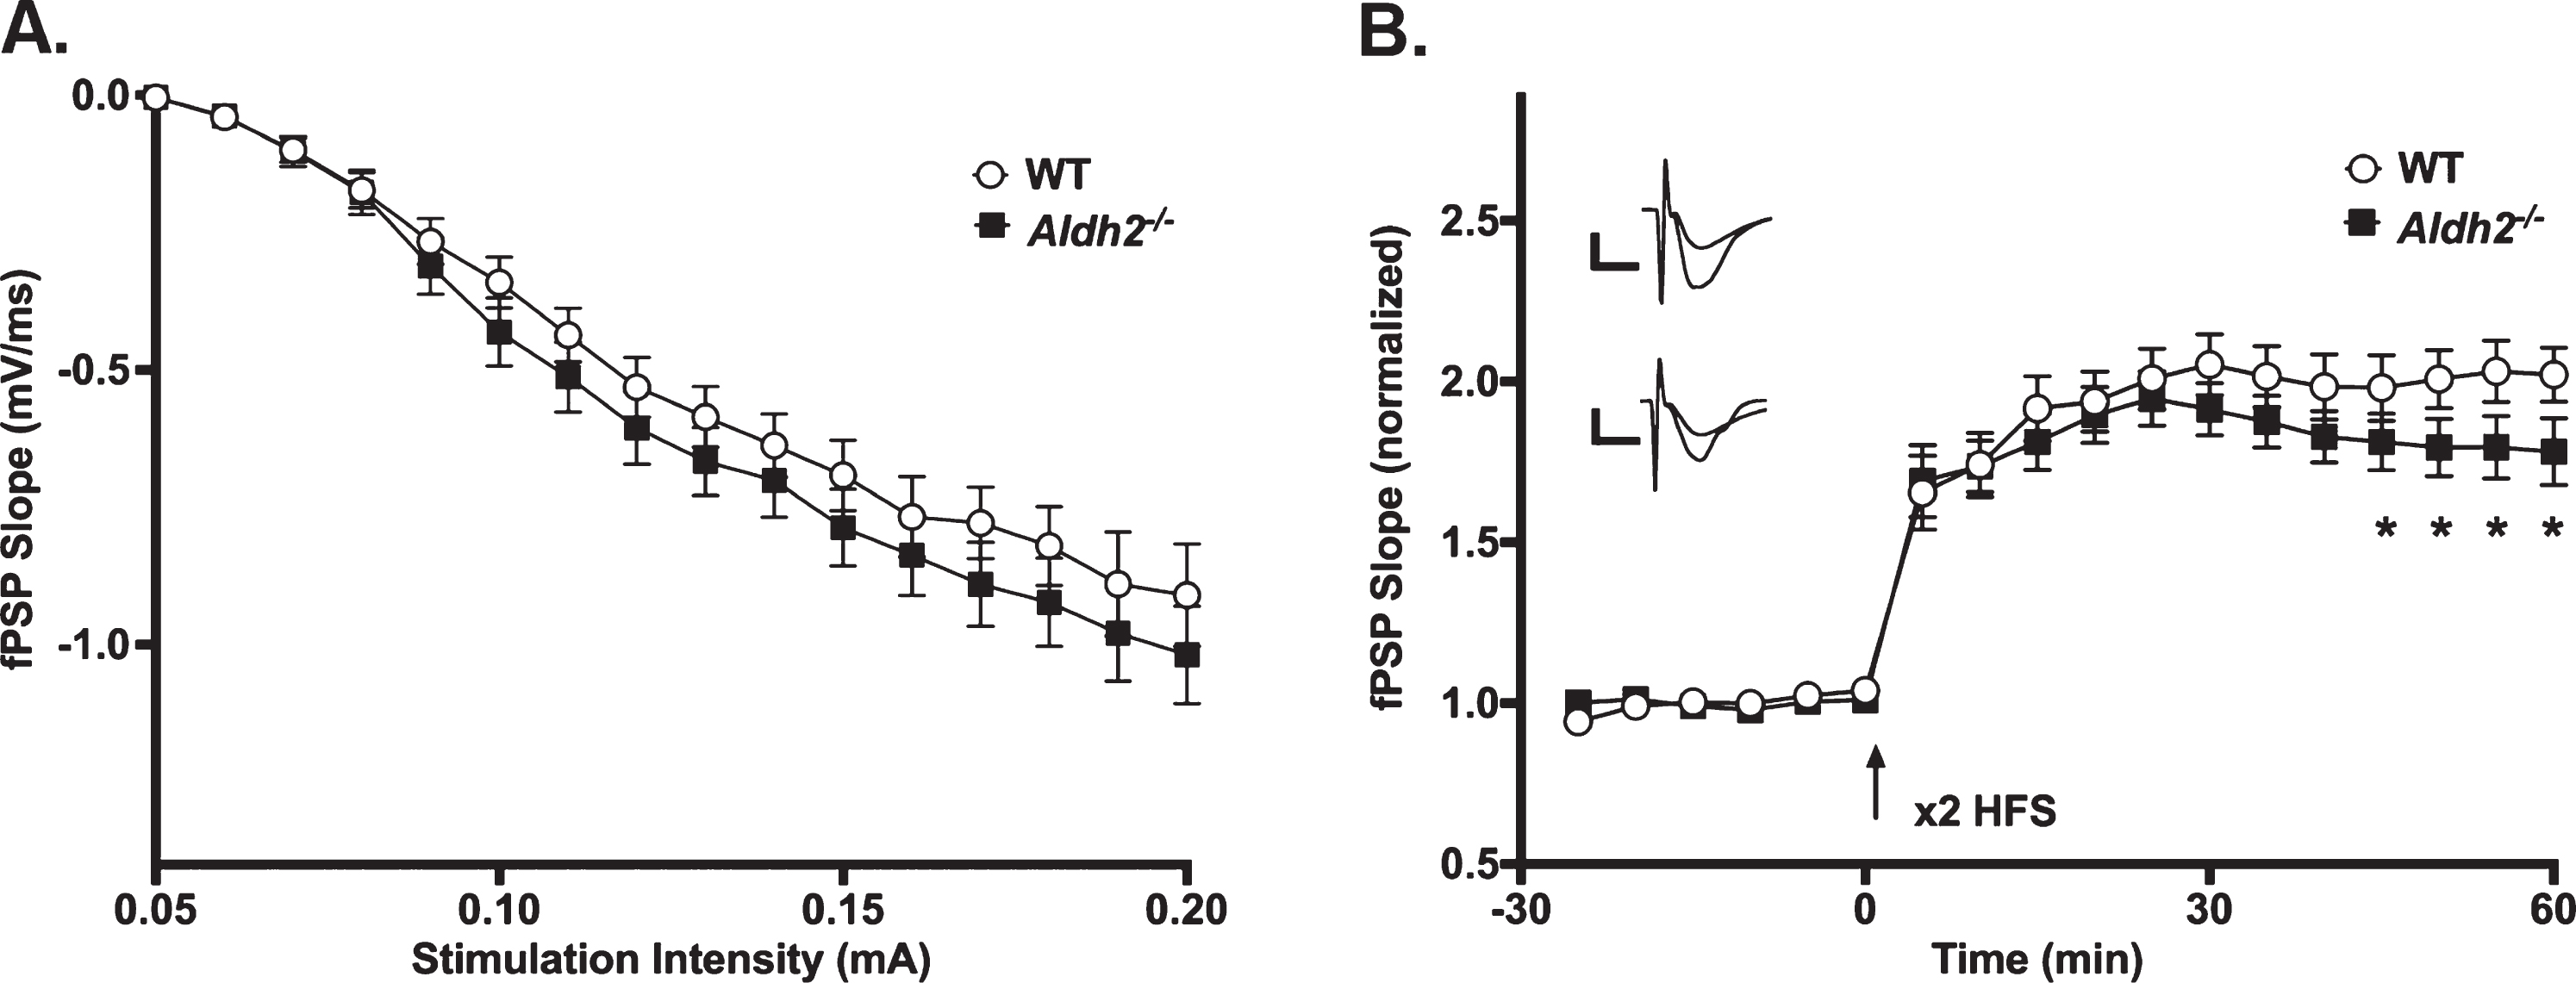
LTP Outcomes. A) I/O curves for fPSP slopes (mV/ms; mean±SEM) elicited in CA1 by single pulse stimulation of the SC in WT and Aldh2–/– mice. The fPSP slope increased with higher stimulation intensities, but no statistical differences between the two groups were detected (p > 0.05). B) fPSP slope (mV/ms; mean±SEM; normalized to baseline) before and after HFS (arrow) in WT and Aldh2–/– mice. Delivery of HFS reliably increased the fPSP slope; however, no main effect of genotype was detected (p > 0.05). Data reported here were taken from 15 WT and 11 Aldh2–/– mice for LTP induction and 15 WT and 10 Aldh2–/– mice for I/O curves. Analysis of the maintenance phase of LTP (the last 20 min) revealed a significant genotype effect with somewhat reduced potentiation in the Aldh2–/– animals (t = 16.84, p < 0.0001; unpaired t-test). Asterisks (*) represent significant group fPSP slope differences at specific time points (t-test) at p < 0.05. Insets depict typical fPSP before (smaller downward deflection) and after (larger downward deflection) HFS in WT (top) and Aldh2–/– mice (bottom; calibration is 0.5 mV and 5 ms).
Neuronal health measures
Table 1 shows outcome measures describing neuronal health during electrophysiological recordings and calcium imaging experiments. Resting fluorescence normalized to cell depth showed no differences across age or genotype (p > 0.05). Input resistance and AP amplitude were unaltered across aging and genotype (p > 0.05). A significant main effect of aging was observed on holding current measures (F (2,74) = 5.288, p < 0.01; two-way ANOVA), however, post hoc analysis revealed this was only present in the WT group (WT p = 0.025, Aldh2–/– p > 0.05). Additionally, a significant main effect of aging was present in the number of APs elicited during imaging across both genotypes (F (2,48) = 17.756, p < 0.001; two-way ANOVA). While the number of APs at 4 months was significantly higher (stimulation setting error), this had no noticeable impact on calcium levels (Fig. 4E, F). In fact, normalization of AUC data to the number of action potentials triggered during activation did not alter outcomes (i.e., no significant change in calcium with age or genotype; data not shown).
Post-synaptic excitability changes (AHP)
We characterized the calcium-dependent AHP in WT and Aldh2–/– animals across age (Fig. 1A) and identified a significant age-dependent reduction in the amplitude of both the mAHP (Fig. 1B; F (2,74) =4.391, p < 0.02; two-way ANOVA) and sAHP (Fig. 1C; F (2,74) =5.050, p < 0.01; two-way ANOVA). A slightly larger sAHP was also present in the Aldh2–/– group, highlighted by a main genotype effect (F (2,74) =4.765, p < 0.04; two-way ANOVA). Despite these observations, the AHP duration remained unaltered (Fig. 1D; p > 0.05). Of interest, a main effect of sex was also observed in the mAHP (F (2,74) =4.141, p < 0.05; three-way ANOVA) in which female mice displayed an overall reduction in AHP amplitude irrespective of genotype (data not shown). No significant sex differences were present in the sAHP or AHP duration (p > 0.05). These findings suggest that a reduction in the AHP seems to develop with age in this animal model irrespective of genotype. Interestingly, our laboratory has previously shown that in 14-month-old APP/PS1 mice, a reduction in L-VGCC density is seen in CA1 neurons when compared to WT [59]. These results differ from those seen in aging rats and rabbits where significant increases in calcium-mediated processes (including the AHP) are typically observed [60–62]. Perhaps this divergence is reflective of the particular genetic background in the Aldh2–/– model, and highlights the nongeneralizable nature of the calcium hypothesis of brain aging and dementia.
Synaptic excitability
Neuronal synaptic excitability was derived from measures of I/O curves (Fig. 2), as well as from EPSP amplitudes during RSS (Fig. 3). Given prior work showing significant decreases in synaptophysin (an integral membrane protein of synaptic terminals [41]), and reports of altered dendritic morphology in the Aldh2–/– mouse, including reduced dendritic length and spine density [55], it is surprising that measures of neuronal excitability (Fig. 2B) and short-term potentiation (Fig. 3C–E) were not significantly different across age or genotype (p > 0.05). This could reflect the resilience of this mouse model to significant alterations in dendritic morphology, highlight the presence of a successful compensatory mechanism, or provide evidence that physiological activation under relatively low frequencies is spared. Sex differences were also investigated, but no significant differences were detected on either I/O or RSS measures (p > 0.05; data not shown).
Calcium imaging
Somatic calcium kinetics before, during, and after RSS were compared across genotype and age (Fig. 4A, B). No significant alterations in calcium handling were seen (Fig. 4C–F; p > 0.05). Given that minor, if any, changes in the AHP were present, these results are perhaps not surprising. Indeed, larger AHPs are often associated with increases in direct/indirect calcium measures [63–65]. Sex differences were not seen on any of the calcium measures quantified (p > 0.05; data not shown).
Long-term synaptic plasticity changes
The slope of fPSPs recorded in dorsal CA1 of WT and Aldh2–/– mice increased with higher stimulation intensities (F (1.827,42.02) = 166.2, p < 0.0001; two-way repeated measures mixed ANOVA); however, no significant effects were noted (Fig. 5A; p > 0.05), highlighting a lack of difference in excitability between the two groups. LTP changes were measured following a robust LTP induction protocol in a subset of mid-age (8 months) male mice. While no main effect of genotype was detected on measures of fPSP slopes across the multiple phases of LTP induction and maintenance (Fig. 5B; p > 0.05), analysis of the data during the maintenance phase of LTP (the last 20 min) revealed a significant genotype effect with greater fPSP slopes in WT (201±5%) compared to Aldh2–/– mice (180±5%; t = 16.84, p < 0.0001; unpaired t-test). Perhaps the use of a strong protocol for LTP induction (2X 100 Hz) masked differences in the initial phases of the potentiation.
DISCUSSION
Measures of calcium-dependent potentials in single neurons are a historically-reliable method of indirectly detecting alterations to calcium homeostasis. Indeed, changes in the AHP with aging reflect calcium channel density and function, as well as calcium buffering and signaling [64, 66–69]. In this study, we measured calcium-related processes in Aldh2–/– and WT mice at different ages in order to draw temporal associations between dysregulated calcium and age-mediated increases in oxidative stress byproducts. Based on previous literature thoroughly characterizing the onset of both behavioral and cellular biomarkers, we hypothesized that in this sporadic model of AD with uncontrolled oxidative stress, early oxidative stress could promote calcium dysregulation. To our surprise, however, calcium-dependent processes were largely unaltered. Further, while age-dependent reductions in the mAHP and sAHP were present, alterations in synaptic processes (both short-term and long-term), as well as calcium kinetics, remained relatively unchanged. However, we did note the presence of a small, albeit significant, reduction in LTP maintenance in the Aldh2–/– animals compared to WT.
In this animal model, behavioral deficits are present as early as 3.5 (novel object recognition and Y-maze) or 6 months of age (Morris water maze) [41]. Aβ and p-tau accumulation is significant by 6 months, while HNE adducts and several caspases are clearly elevated by 3 months when compared to controls. Our analysis of calcium-dependent processes at early time-points (1.5–4 months) does demonstrate a significant reduction in the mAHP and sAHP. However, given that the mAHP and sAHP were reduced in both the WT and the Aldh2–/– groups with age, we cannot dissociate the effect of aging from that of the genetic manipulation. While there has been some evidence of genotype-mediated reductions in calcium processes in animal models of AD [18, 59], it is surprising that a significant age-dependent reduction in the AHP was present here. Given the importance of the genetic backgrounds in animal models and their impact on physiological processes [70–74], it is likely that this particular mouse model, irrespective of the ALDH2 manipulation, presents with a reduction in the AHP across age, thus reflecting on the non-generalizable nature of neuronal calcium dysregulation with age across AD models. Previous work from different labs has reported no loss of hippocampal neurons as well as similar levels of synaptic proteins in behaviorally-impaired aged animals compared to young counterparts [71, 72, 75]. Perhaps the mechanism underlying the age-dependent reduction in the AHP presented here in both the WT and Aldh2–/– groups is dependent on the genetic background of the animals, and may highlight an increase in the resilience of the animal to the impact of elevated HNE adducts. Overall, however, it does not appear that the presence of a greater LPx burden specifically induces calcium dysregulation. While the electrophysiological phenotype and outcome measures were only minimally affected, several potential mechanisms are discussed.
Firstly, in the current study, animals may not have been exposed to sufficient cumulative oxidative stress to alter neurophysiological properties. No electrophysiological studies investigating the Aldh2–/– mouse at more mature ages (i.e., 18 months) have been published. Nevertheless, evidence from other models of AD does suggest a worsening of the phenotype with age. Indeed, while there is a paucity of aging studies characterizing calcium-mediated AD phenotypes at much later ages, a significant age-dependent increase in hippocampal L-VGCC density and AHP amplitude has been reported in transgenic AD mouse models at 12–18 months of age [76, 77]. Given that our work specifically addresses alterations in calcium homeostasis in a sporadic model of AD, it is not clear how these changes align with prior literature that has commonly used transgenic models of familial AD. Thus, it is possible that the Aldh2–/– mouse presents with mild electrophysiological alterations during early to mid-life that worsen with more advanced age. Alternatively, the use of a ‘2-hit’ model could unmask more robust changes at a younger age in this particular model, as previous evidence has demonstrated the effectiveness of using a secondary insult in models of traumatic brain injury (TBI), Parkinson’s disease, and even schizophrenia to detect complex or less-sensitive processes [78–81]. In fact, a previous study using this animal model in combination with mild (TBI) recently reported significant increases in inflammatory cytokines, as well as sustained cognitive deficits, when compared to sham controls [82]. In this work, administration of anti-inflammatory agents post-TBI ameliorated both inflammatory and cognitive impairments of the Aldh2–/– mice.
Moreover, reports conducted in the dorsal hippocampus of Aldh2–/– mice have highlighted morphological changes in this area only, with no alterations detected in the ventral hippocampus or primary sensory cortex [55], suggesting that the impact of oxidative stress may be region-selective. In this animal model, the dissociation between the poor behavioral phenotype and the paucity of calcium-mediated electrophysiological changes in the hippocampus support the notion that brain regions other than the hippocampus can also participate in the encoding, storing, and recalling of memory processes [83–87]. Further, the location of the KCa AHP channels is important to consider. KCa channels, which are critical to neuronal repolarization and the AHP, have been mostly identified in the somatodendritic region of pyramidal neurons [88–92]. Thus, it is possible that recordings of mostly somatic potentials using the sharp electrode technique did not permit identification of synaptic changes in dendritic spines or finer processes negatively impacted in the Aldh2–/– model [55]. Finally, the possibility that the genetic manipulation may have induced a series of compensatory cellular events including increases in calcium buffering, mitochondrial metabolism, or changes in the location and density of calcium or potassium channels, should be considered. Future studies investigating these potential mechanisms are clearly needed.
With respect to the small, albeit significant, reduction in LTP in the Aldh2–/– mouse, it is possible that the robust induction protocol used here may have thwarted more subtle differences in synaptic plasticity. Previous evidence has shown that age-related deficits in LTP induction were only seen when less robust (perithreshold) stimulation protocols were used [93–97]. Future studies investigating calcium dysregulation across different cell types and brain regions at more advanced ages in this animal model should be initiated to better characterize the potential impact of oxidative stress on behavioral outcomes. In summary, with so few changes in calcium and calcium-dependent processes detected in an animal model with significant increases in HNE adducts, Aβ, p-tau, and activated caspases across age, the current findings do not support a direct link between neuronal calcium dysregulation and uncontrolled oxidative stress.
ACKNOWLEDGMENTS
This work was supported by NIH grants R01AG058171 (OT and BMB) and T32 AG05461 (AOG), Canadian Institutes of Health Research grant PJT 153013 (BMB), Heart and Stroke Foundation of Canada grant G-19-0024266 (RDA), and National Science and Engineering Research Council grant RGPN/04624-2017 (RDA).
Authors’ disclosures available online (https://www.j-alz.com/manuscript-disclosures/20-0617r1).
REFERENCES
[1] | Alzheimer’s Association ((2016) ) 2016 Alzheimer’s disease facts and figures. Alzheimers Dement 12: , 459–509. |
[2] | Abner EL , Neltner JH , Jicha GA , Patel E , Anderson SL , Wilcock DM , Van Eldik LJ , Nelson PT ((2018) ) Diffuse amyloid-beta plaques, neurofibrillary tangles, and the impact of APOE in elderly persons’ brains lacking neuritic amyloid plaques. J Alzheimers Dis 64: , 1307–1324. |
[3] | Mathias JL , Morphett K ((2010) ) Neurobehavioral differences between Alzheimer’s disease and frontotemporal dementia: A meta-analysis. J Clin Exp Neuropsychol 32: , 682–698. |
[4] | Pasqualetti G , Brooks DJ , Edison P ((2015) ) The role of neuroinflammation in dementias. Curr Neurol Neurosci Rep 15: , 17. |
[5] | Spires-Jones TL , Attems J , Thal DR ((2017) ) Interactions of pathological proteins in neurodegenerative diseases. Acta Neuropathol 134: , 187–205. |
[6] | Rockenstein E , Crews L , Masliah E ((2007) ) Transgenic animal models of neurodegenerative diseases and their application to treatment development. Adv Drug Deliv Rev 59: , 1093–1102. |
[7] | Van Dam D , De Deyn PP ((2006) ) Drug discovery in dementia: The role of rodent models. Nat Rev Drug Discov 5: , 956–970. |
[8] | Dodart JC , May P ((2005) ) Overview on rodent models of Alzheimer’s disease. Curr Protoc Neurosci Chapter 9: , Unit 9 22. |
[9] | Woodruff-Pak DS ((2008) ) Animal models of Alzheimer’s disease: Therapeutic implications. J Alzheimers Dis 15: , 507–521. |
[10] | Manzano S , Gonzalez J , Marcos A , Payno M , Villanueva C , Matias-Guiu J ((2009) ) Experimental models in Alzheimer’s disease. Neurologia 24: , 255–262. |
[11] | Obulesu M , Rao DM ((2010) ) Animal models of Alzheimer’s disease: An understanding of pathology and therapeutic avenues. Int J Neurosci 120: , 531–537. |
[12] | Braidy N , Munoz P , Palacios AG , Castellano-Gonzalez G , Inestrosa NC , Chung RS , Sachdev P , Guillemin GJ ((2012) ) Recent rodent models for Alzheimer’s disease: Clinical implications and basic research. J Neural Transm (Vienna) 119: , 173–195. |
[13] | Mattson MP , Pedersen WA , Duan W , Culmsee C , Camandola S ((1999) ) Cellular and molecular mechanisms underlying perturbed energy metabolism and neuronal degeneration in Alzheimer’s and Parkinson’s diseases. Ann N Y Acad Sci 893: , 154–175. |
[14] | Mattson MP , Chan SL ((2001) ) Dysregulation of cellular calcium homeostasis in Alzheimer’s disease: Bad genes and bad habits. J Mol Neurosci 17: , 205–224. |
[15] | Sun KH , de Pablo Y , Vincent F , Shah K ((2008) ) Deregulated Cdk5 promotes oxidative stress and mitochondrial dysfunction. J Neurochem 107: , 265–278. |
[16] | von Bernhardi R , Eugenin J ((2012) ) Alzheimer’s disease: Redox dysregulation as a common denominator for diverse pathogenic mechanisms. Antioxid Redox Signal 16: , 974–1031. |
[17] | Magi S , Castaldo P , Macri ML , Maiolino M , Matteucci A , Bastioli G , Gratteri S , Amoroso S , Lariccia V ((2016) ) Intracellular calcium dysregulation: Implications for Alzheimer’s disease. Biomed Res Int 2016: , 6701324. |
[18] | Berkowitz BA , Lenning J , Khetarpal N , Tran C , Wu JY , Berri AM , Dernay K , Haacke EM , Shafie-Khorassani F , Podolsky RH , Gant JC , Maimaiti S , Thibault O , Murphy GG , Bennett BM , Roberts R ((2017) ) In vivo imaging of prodromal hippocampus CA1 subfield oxidative stress in models of Alzheimer disease and Angelman syndrome. FASEB J 31: , 4179–4186. |
[19] | Foster TC , Kyritsopoulos C , Kumar A ((2017) ) Central role for NMDA receptors in redox mediated impairment of synaptic function during aging and Alzheimer’s disease. Behav Brain Res 322: , 223–232. |
[20] | Connolly NM , Prehn JH ((2015) ) The metabolic response to excitotoxicity - lessons from single-cell imaging. J Bioenerg Biomembr 47: , 75–88. |
[21] | Alzheimer’s Association Calcium Hypothesis Workgroup ((2017) ) Calcium Hypothesis of Alzheimer’s disease and brain aging: A framework for integrating new evidence into a comprehensive theory of pathogenesis. Alzheimers Dement 13: , 178–182 e117. |
[22] | Gibson GE , Zhang H , Xu H , Park LC , Jeitner TM ((2002) ) Oxidative stress increases internal calcium stores and reduces a key mitochondrial enzyme. Biochim Biophys Acta 1586: , 177–189. |
[23] | Tosun D , Schuff N , Shaw LM , Trojanowski JQ , Weiner MW , Alzheimer’s Disease Neuroimaging Initiative ((2011) ) Relationship between CSF biomarkers of Alzheimer’s disease and rates of regional cortical thinning in ADNI data. J Alzheimers Dis 26 Suppl 3: , 77–90. |
[24] | Thurfjell L , Lotjonen J , Lundqvist R , Koikkalainen J , Soininen H , Waldemar G , Brooks DJ , Vandenberghe R ((2012) ) Combination of biomarkers: PET [18F]flutemetamol imaging and structural MRI in dementia and mild cognitive impairment. Neurodegener Dis 10: , 246–249. |
[25] | Stricker NH , Dodge HH , Dowling NM , Han SD , Erosheva EA , Jagust WJ , Alzheimer’s Disease Neuroimaging Initiative ((2012) ) CSF biomarker associations with change in hippocampal volume and precuneus thickness: Implications for the Alzheimer’s pathological cascade. Brain Imaging Behav 6: , 599–609. |
[26] | Markesbery WR ((1997) ) Oxidative stress hypothesis in Alzheimer’s disease. Free Radic Biol Med 23: , 134–147. |
[27] | Butterfield DA ((1997) ) beta-Amyloid-associated free radical oxidative stress and neurotoxicity: Implications for Alzheimer’s disease. Chem Res Toxicol 10: , 495–506. |
[28] | Pratico D ((2008) ) Oxidative stress hypothesis in Alzheimer’s disease: A reappraisal. Trends Pharmacol Sci 29: , 609–615. |
[29] | Lovell MA , Ehmann WD , Butler SM , Markesbery WR ((1995) ) Elevated thiobarbituric acid-reactive substances and antioxidant enzyme activity in the brain in Alzheimer’s disease. Neurology 45: , 1594–1601. |
[30] | Hensley K , Maidt ML , Yu Z , Sang H , Markesbery WR , Floyd RA ((1998) ) Electrochemical analysis of protein nitrotyrosine and dityrosine in the Alzheimer brain indicates region-specific accumulation. J Neurosci 18: , 8126–8132. |
[31] | Markesbery WR , Lovell MA ((1998) ) Four-hydroxynonenal, a product of lipid peroxidation, is increased in the brain in Alzheimer’s disease. Neurobiol Aging 19: , 33–36. |
[32] | Lovell MA , Ehmann WD , Mattson MP , Markesbery WR ((1997) ) Elevated 4-hydroxynonenal in ventricular fluid in Alzheimer’s disease. Neurobiol Aging 18: , 457–461. |
[33] | Halliwell B ((2006) ) Oxidative stress and neurodegeneration: Where are we now? J Neurochem 97: , 1634–1658. |
[34] | Markesbery WR , Carney JM ((1999) ) Oxidative alterations in Alzheimer’s disease. Brain Pathol 9: , 133–146. |
[35] | Montine KS , Olson SJ , Amarnath V , Whetsell WO Jr. , Graham DG , Montine TJ ((1997) ) Immunohistochemical detection of 4-hydroxy-2-nonenal adducts in Alzheimer’s disease is associated with inheritance of APOE4. Am J Pathol 150: , 437–443. |
[36] | Reed TT , Pierce WM , Markesbery WR , Butterfield DA ((2009) ) Proteomic identification of HNE-bound proteins in early Alzheimer disease: Insights into the role of lipid peroxidation in the progression of AD. Brain Res 1274: , 66–76. |
[37] | Sultana R , Perluigi M , Butterfield DA ((2013) ) Lipid peroxidation triggers neurodegeneration: A redox proteomics view into the Alzheimer disease brain. Free Radic Biol Med 62: , 157–169. |
[38] | Mattson MP , Fu W , Waeg G , Uchida K ((1997) ) 4-Hydroxynonenal, a product of lipid peroxidation, inhibits dephosphorylation of the microtubule-associated protein tau. Neuroreport 8: , 2275–2281. |
[39] | Floyd RA , Hensley K ((2002) ) Oxidative stress in brain aging. Implications for therapeutics of neurodegenerative diseases. Neurobiol Aging 23: , 795–807. |
[40] | Siegel SJ , Bieschke J , Powers ET , Kelly JW ((2007) ) The oxidative stress metabolite 4-hydroxynonenal promotes Alzheimer protofibril formation. Biochemistry 46: , 1503–1510. |
[41] | D’Souza Y , Elharram A , Soon-Shiong R , Andrew RD , Bennett BM ((2015) ) Characterization of Aldh2 (–/–) mice as an age-related model of cognitive impairment and Alzheimer’s disease. Mol Brain 8: , 27. |
[42] | Kruman I , Bruce-Keller AJ , Bredesen D , Waeg G , Mattson MP ((1997) ) Evidence that 4-hydroxynonenal mediates oxidative stress-induced neuronal apoptosis. J Neurosci 17: , 5089–5100. |
[43] | Butterfield DA , Reed T , Newman SF , Sultana R ((2007) ) Roles of amyloid beta-peptide-associated oxidative stress and brain protein modifications in the pathogenesis of Alzheimer’s disease and mild cognitive impairment. Free Radic Biol Med 43: , 658–677. |
[44] | Matsuoka Y , Picciano M , La Francois J , Duff K ((2001) ) Fibrillar beta-amyloid evokes oxidative damage in a transgenic mouse model of Alzheimer’s disease. Neuroscience 104: , 609–613. |
[45] | Mohmmad Abdul H , Sultana R , Keller JN , St Clair DK , Markesbery WR , Butterfield DA ((2006) ) Mutations in amyloid precursor protein and presenilin-1 genes increase the basal oxidative stress in murine neuronal cells and lead to increased sensitivity to oxidative stress mediated by amyloid beta-peptide (1–42), HO and kainic acid: Implications for Alzheimer’s disease. J Neurochem 96: , 1322–1335. |
[46] | Nunomura A , Perry G , Aliev G , Hirai K , Takeda A , Balraj EK , Jones PK , Ghanbari H , Wataya T , Shimohama S , Chiba S , Atwood CS , Petersen RB , Smith MA ((2001) ) Oxidative damage is the earliest event in Alzheimer disease. J Neuropathol Exp Neurol 60: , 759–767. |
[47] | Nunomura A , Perry G , Pappolla MA , Friedland RP , Hirai K , Chiba S , Smith MA ((2000) ) Neuronal oxidative stress precedes amyloid-beta deposition in Down syndrome. J Neuropathol Exp Neurol 59: , 1011–1017. |
[48] | Pratico D , Uryu K , Leight S , Trojanoswki JQ , Lee VM ((2001) ) Increased lipid peroxidation precedes amyloid plaque formation in an animal model of Alzheimer amyloidosis. J Neurosci 21: , 4183–4187. |
[49] | Resende R , Moreira PI , Proenca T , Deshpande A , Busciglio J , Pereira C , Oliveira CR ((2008) ) Brain oxidative stress in a triple-transgenic mouse model of Alzheimer disease. Free Radic Biol Med 44: , 2051–2057. |
[50] | Watson JB , Arnold MM , Ho YS , O’Dell TJ ((2006) ) Age-dependent modulation of hippocampal long-term potentiation by antioxidant enzymes. J Neurosci Res 84: , 1564–1574. |
[51] | Ma T , Hoeffer CA , Wong H , Massaad CA , Zhou P , Iadecola C , Murphy MP , Pautler RG , Klann E ((2011) ) Amyloid beta-induced impairments in hippocampal synaptic plasticity are rescued by decreasing mitochondrial superoxide. J Neurosci 31: , 5589–5595. |
[52] | Vereker E , O’Donnell E , Lynch MA ((2000) ) The inhibitory effect of interleukin-1beta on long-term potentiation is coupled with increased activity of stress-activated protein kinases. J Neurosci 20: , 6811–6819. |
[53] | Bellinger FP , Madamba S , Siggins GR ((1993) ) Interleukin 1 beta inhibits synaptic strength and long-term potentiation in the rat CA1 hippocampus. Brain Res 628: , 227–234. |
[54] | D’Souza Y , Kawamoto T , Bennett BM ((2014) ) Role of the lipid peroxidation product, 4-hydroxynonenal, in the development of nitrate tolerance. Chem Res Toxicol 27: , 663–673. |
[55] | Mehder RH , Bennett BM , Andrew RD ((2020) ) Morphometric analysis of hippocampal and neocortical pyramidal neurons in a mouse model of late onset Alzheimer’s disease. J Alzheimers Dis 74: , 1069–1083. |
[56] | Kitagawa K , Kawamoto T , Kunugita N , Tsukiyama T , Okamoto K , Yoshida A , Nakayama K , Nakayama K ((2000) ) Aldehyde dehydrogenase (ALDH) 2 associates with oxidation of methoxyacetaldehyde; in vitro analysis with liver subcellular fraction derived from human and Aldh2 gene targeting mouse. FEBS Lett 476: , 306–311. |
[57] | Isse T , Oyama T , Kitagawa K , Matsuno K , Matsumoto A , Yoshida A , Nakayama K , Nakayama K , Kawamoto T ((2002) ) Diminished alcohol preference in transgenic mice lacking aldehyde dehydrogenase activity. Pharmacogenetics 12: , 621–626. |
[58] | Luo J , Lee SH , VandeVrede L , Qin Z , Ben Aissa M , Larson J , Teich AF , Arancio O , D’Souza Y , Elharram A , Koster K , Tai LM , LaDu MJ , Bennett BM , Thatcher GR ((2016) ) A multifunctional therapeutic approach to disease modification in multiple familial mouse models and a novel sporadic model of Alzheimer’s disease. Mol Neurodegener 11: , 35. |
[59] | Thibault O , Pancani T , Landfield PW , Norris CM ((2012) ) Reduction in neuronal L-type calcium channel activity in a double knock-in mouse model of Alzheimer’s disease. Biochim Biophys Acta 1822: , 546–549. |
[60] | Disterhoft JF , Thompson LT , Moyer JR Jr. , Mogul DJ ((1996) ) Calcium-dependent afterhyperpolarization and learning in young and aging hippocampus. Life Sci 59: , 413–420. |
[61] | Moyer JR Jr. , Thompson LT , Black JP , Disterhoft JF ((1992) ) Nimodipine increases excitability of rabbit CA1 pyramidal neurons in an age- and concentration-dependent manner. J Neurophysiol 68: , 2100–2109. |
[62] | Landfield PW , Pitler TA ((1984) ) Prolonged Ca2+-dependent afterhyperpolarizations in hippocampal neurons of aged rats. Science 226: , 1089–1092. |
[63] | Thibault O , Hadley R , Landfield PW ((2001) ) Elevated postsynaptic [Ca2+]i and L-type calcium channel activity in aged hippocampal neurons: Relationship to impaired synaptic plasticity. J Neurosci 21: , 9744–9756. |
[64] | Thibault O , Landfield PW ((1996) ) Increase in single L-type calcium channels in hippocampal neurons during aging. Science 272: , 1017–1020. |
[65] | Deyo RA , Straube KT , Moyer JR Jr. , Disterhoft JF ((1989) ) Nimodipine ameliorates aging-related changes in open-field behaviors of the rabbit. Exp Aging Res 15: , 169–175. |
[66] | Disterhoft JF , Moyer JR Jr. , Thompson LT , Kowalska M ((1993) ) Functional aspects of calcium-channel modulation.S. Clin Neuropharmacol 16 Suppl 1: , 12–24. |
[67] | Norris CM , Halpain S , Foster TC ((1998) ) Reversal of age-related alterations in synaptic plasticity by blockade of L-type Ca2+ channels. J Neurosci 18: , 3171–3179. |
[68] | Moore SJ , Murphy GG ((2020) ) The role of L-type calcium channels in neuronal excitability and aging. Neurobiol Learn Mem, 107230. |
[69] | Murchison D , Griffith WH ((1998) ) Increased calcium buffering in basal forebrain neurons during aging. J Neurophysiol 80: , 350–364. |
[70] | Murphy GG , Fedorov NB , Giese KP , Ohno M , Friedman E , Chen R , Silva AJ ((2004) ) Increased neuronal excitability, synaptic plasticity, and learning in aged Kvbeta1.1 knockout mice. Curr Biol 14: , 1907–1915. |
[71] | Gallagher M , Bizon JL , Hoyt EC , Helm KA , Lund PK ((2003) ) Effects of aging on the hippocampal formation in a naturally occurring animal model of mild cognitive impairment. Exp Gerontol 38: , 71–77. |
[72] | Nicolle MM , Gallagher M , McKinney M ((1999) ) No loss of synaptic proteins in the hippocampus of aged, behaviorally impaired rats. Neurobiol Aging 20: , 343–348. |
[73] | Smith DR , Gallagher M , Stanton ME ((2007) ) Genetic background differences and nonassociative effects in mouse trace fear conditioning. Learn Mem 14: , 597–605. |
[74] | Sung JY , Goo JS , Lee DE , Jin DQ , Bizon JL , Gallagher M , Han JS ((2008) ) Learning strategy selection in the water maze and hippocampal CREB phosphorylation differ in two inbred strains of mice. Learn Mem 15: , 183–188. |
[75] | Scheff SW , Anderson KJ , DeKosky ST ((1985) ) Strain comparison of synaptic density in hippocampal CA1 of aged rats. Neurobiol Aging 6: , 29–34. |
[76] | Wang Y , Mattson MP ((2014) ) L-type Ca2+ currents at CA1 synapses, but not CA3 or dentate granule neuron synapses, are increased in 3xTgAD mice in an age-dependent manner. Neurobiol Aging 35: , 88–95. |
[77] | Stutzmann GE , Smith I , Caccamo A , Oddo S , Laferla FM , Parker I ((2006) ) Enhanced ryanodine receptor recruitment contributes to Ca2+ disruptions in young, adult, and aged Alzheimer’s disease mice. J Neurosci 26: , 5180–5189. |
[78] | Cheng JS , Craft R , Yu GQ , Ho K , Wang X , Mohan G , Mangnitsky S , Ponnusamy R , Mucke L ((2014) ) Tau reduction diminishes spatial learning and memory deficits after mild repetitive traumatic brain injury in mice. PLoS One 9: , e115765. |
[79] | Chen J , Wang Z , Li M ((2011) ) Multiple ‘hits’ during postnatal and early adulthood periods disrupt the normal development of sensorimotor gating ability in rats. J Psychopharmacol 25: , 379–392. |
[80] | Lim AL , Taylor DA , Malone DT ((2012) ) A two-hit model: Behavioural investigation of the effect of combined neonatal MK-801 administration and isolation rearing in the rat. J Psychopharmacol 26: , 1252–1264. |
[81] | Gao HM , Zhang F , Zhou H , Kam W , Wilson B , Hong JS ((2011) ) Neuroinflammation and alpha-synuclein dysfunction potentiate each other, driving chronic progression of neurodegeneration in a mouse model of Parkinson’s disease. Environ Health Perspect 119: , 807–814. |
[82] | Knopp RC , Lee SH , Hollas M , Nepomuceno E , Gonzalez D , Tam K , Aamir D , Wang Y , Pierce E , BenAissa M , Thatcher GRJ ((2020) ) Interaction of oxidative stress and neurotrauma in ALDH2(–/–) mice causes significant and persistent behavioral and pro-inflammatory effects in a tractable model of mild traumatic brain injury. Redox Biol 32: , 101486. |
[83] | Ikegaya Y , Saito H , Abe K ((1994) ) Attenuated hippocampal long-term potentiation in basolateral amygdala-lesioned rats. Brain Res 656: , 157–164. |
[84] | Yaniv D , Vouimba RM , Diamond DM , Richter-Levin G ((2003) ) Simultaneous induction of long-term potentiation in the hippocampus and the amygdala by entorhinal cortex activation: Mechanistic and temporal profiles. Neuroscience 120: , 1125–1135. |
[85] | Vigot R , Batini C , Kado RT , Yamamori T ((2002) ) Synaptic long-term depression (LTD) in vivo recorded on the rat cerebellar cortex. Arch Ital Biol 140: , 1–12. |
[86] | Zhang W , Linden DJ ((2006) ) Long-term depression at the mossy fiber-deep cerebellar nucleus synapse. J Neurosci 26: , 6935–6944. |
[87] | Arruda-Carvalho M , Clem RL ((2014) ) Pathway-selective adjustment of prefrontal-amygdala transmission during fear encoding. J Neurosci 34: , 15601–15609. |
[88] | Child ND , Benarroch EE ((2014) ) Differential distribution of voltage-gated ion channels in cortical neurons: Implications for epilepsy. Neurology 82: , 989–999. |
[89] | Sah P ((1996) ) Ca(2+)-activated K+ currents in neurones: Types, physiological roles and modulation. Trends Neurosci 19: , 150–154. |
[90] | Jaffe DB , Ross WN , Lisman JE , Lasser-Ross N , Miyakawa H , Johnston D ((1994) ) A model for dendritic Ca2+ accumulation in hippocampal pyramidal neurons based on fluorescence imaging measurements. J Neurophysiol 71: , 1065–1077. |
[91] | Traub RD , Wong RK , Miles R , Michelson H ((1991) ) A model of a CA3 hippocampal pyramidal neuron incorporating voltage-clamp data on intrinsic conductances. J Neurophysiol 66: , 635–650. |
[92] | Stocker M , Pedarzani P ((2000) ) Differential distribution of three Ca(2+)-activated K(+) channel subunits, SK1, SK2, and SK3, in the adult rat central nervous system. Mol Cell Neurosci 15: , 476–493. |
[93] | Barnes CA , Rao G , McNaughton BL ((1996) ) Functional integrity of NMDA-dependent LTP induction mechanisms across the lifespan of F-344 rats. Learn Mem 3: , 124–137. |
[94] | Deupree DL , Bradley J , Turner DA ((1993) ) Age-related alterations in potentiation in the CA1 region in F344 rats. Neurobiol Aging 14: , 249–258. |
[95] | Moore CI , Browning MD , Rose GM ((1993) ) Hippocampal plasticity induced by primed burst, but not long-term potentiation, stimulation is impaired in area CA1 of aged Fischer 344 rats. Hippocampus 3: , 57–66. |
[96] | Landfield PW , Lynch G ((1977) ) Impaired monosynaptic potentiation in in vitro hippocampal slices from aged, memory-deficient rats. J Gerontol 32: , 523–533. |
[97] | Landfield PW , McGaugh JL , Lynch G ((1978) ) Impaired synaptic potentiation processes in the hippocampus of aged, memory-deficient rats. Brain Res 150: , 85–101. |


