
White Matter Hyperintensities Are No Major Confounder for Alzheimer’s Disease Cerebrospinal Fluid Biomarkers
Abstract
Background:
The cerebrospinal fluid (CSF) biomarkers amyloid-β 1–42 (Aβ42), total and phosphorylated tau (t-tau, p-tau) are increasingly used to assist in the clinical diagnosis of Alzheimer’s disease (AD). However, CSF biomarker levels can be affected by confounding factors.
Objective:
To investigate the association of white matter hyperintensities (WMHs) present in the brain with AD CSF biomarker levels.
Methods:
We included CSF biomarker and magnetic resonance imaging (MRI) data of 172 subjects (52 controls, 72 mild cognitive impairment (MCI), and 48 AD patients) from 9 European Memory Clinics. A computer aided detection system for standardized automated segmentation of WMHs was used on MRI scans to determine WMH volumes. Association of WMH volume with AD CSF biomarkers was determined using linear regression analysis.
Results:
A small, negative association of CSF Aβ42, but not p-tau and t-tau, levels with WMH volume was observed in the AD (r2 = 0.084, p = 0.046), but not the MCI and control groups, which was slightly increased when including the distance of WMHs to the ventricles in the analysis (r2 = 0.105, p = 0.025). Three global patterns of WMH distribution, either with 1) a low, 2) a peak close to the ventricles, or 3) a high, broadly-distributed WMH volume could be observed in brains of subjects in each diagnostic group.
Conclusion:
Despite an association of WMH volume with CSF Aβ42 levels in AD patients, the occurrence of WMHs is not accompanied by excess release of cellular proteins in the CSF, suggesting that WMHs are no major confounder for AD CSF biomarker assessment.
INTRODUCTION
Alzheimer’s disease (AD) is the most prevalent form of dementia and is a progressive and irreversible neurodegenerative disease. Typical neuropathological lesions observed postmortem in the brains of AD patients are the extracellular accumulation of amyloid-β (Aβ) protein in both plaques and the cerebral vasculature, and the intracellular neurofibrillary tangles containing hyperphosphorylated tau (p-tau) protein [1].
Several lines of evidence suggest that vascular pathology contributes to the development and clinical symptoms of AD. Subcortical vascular lesions visualized by neuroimaging are collectively referred to as cerebral small vessel disease (SVD). Neuroimaging biomarkers of SVD comprise white matter hyperintensities (WMHs), lacunar infarcts, and microbleeds [2]. These abnormalities can be observed in brains of healthy elderly individuals (typically above the age of 60 years), but are observed in increased numbers in AD patients, likely contributing to cognitive decline [3–7]. WMHs are signal abnormalities in the white matter that appear as hyperintensities on fluid-attenuated inversion recovery (FLAIR) T2-weighted magnetic resonance imaging (MRI) scans and are considered biomarkers of SVD [8–13]. WMHs are caused by destruction of the myelin sheath that envelops the axons of neurons. Myelin is the main component of white matter and facilitates the fast signal transmission along neuronal processes [14]. Lacunes of presumed vascular origin are cavities filled with cerebrospinal fluid (CSF), visible as round or ovoid subcortical hypointense areas of 3–15 mm on FLAIR T2-weighted MRI scans. Microbleeds are defined as small hypointense areas of 2–10 mm on T2* gradient-recall echo (GRE) or susceptibility-weighted imaging (SWI) MRI sequences [12].
CSF biomarkers (Aβ42, total tau (t-tau), and p-tau) have been shown to improve the accuracy of AD diagnosis to >85% and have therefore recently been included in the diagnostic criteria for AD [15–17]. In the CSF of AD patients, the combination of decreased levels of Aβ42 and elevated concentrations of both t-tau and p-tau proteins can be observed, reflecting senile plaques and neurofibrillary tangle pathology, respectively [18] and this combination may predict the progression to AD dementia in patients with mild cognitive impairment (MCI) [19, 20]. In patients with vascular dementia or stroke (transiently) increased CSF t-tau and decreased CSF Aβ42 levels can be observed [21–24]. Therefore, it is possible that SVD affects the levels of CSF Aβ and tau proteins and thus affect the diagnostic accuracy of these biomarkers for AD.
This study aims to identify the relation between AD CSF biomarkers (Aβ42, t-tau, and p-tau) and the presence of WMHs. We hypothesize that the occurrence of WMHs, especially when localized close to the ventricles, is accompanied by excess release of cellular components (e.g., tau proteins) in the extracellular space and as such can modify the patterns of biomarkers that are known to be associated with AD pathology.
MATERIALS AND METHODS
Subjects
T1-weighted structural MRI scans, T2-weighted-FLAIR MRI scans, and AD CSF biomarker data were acquired from 9 research centers within the Biomarkers for Alzheimer’s and Parkinson’s Disease (BiomarkAPD) project, a consortium of the European initiative Joint Programme for Neurodegenerative Diseases Research (JPND). The study was approved by local ethics committees or the institutional review board of each center. The participants or their legal representatives gave written informed consent. Initially, 309 subjects were included for analysis (a sub-set of a previous study on ventricular volumes [25], but for several reasons discussed in the results section, 137 subjects were excluded from analysis and therefore n = 172 subjects were finally included in this study.
All subjects underwent clinical and neurological assessment, lumbar puncture, MRI scanning, and CSF analysis at their local laboratory. The patient groups comprised: 52 neurological controls (includ-ing n = 34 healthy controls, n = 10 subjects for whom cognitive disorders were excluded, and n = 8 subjective memory complainers (SMC), based on examination of medical records), 72 MCI patients, of which 42 patients were diagnosed with amnestic MCI, and 48 AD patients. Diagnoses were defined by clinical and neurological assessment and application of diagnostic criteria (see Supplementary Table 1 for the MCI and AD diagnostic criteria used in each center; the locally applied cut-off values for the use of the CSF biomarkers are shown in Supplementary Table 2). We decided to pool the healthy control subjects and SMC in one group as neurological controls. Individuals were labeled as SMC when they presented with cognitive complaints, and results of clinical investigations were within normal range. Individuals were labeled as controls if they were free of neurological disease. SMC are very similar to healthy controls in terms of prevalence of amyloid pathology [26]. CSF Aβ42 (p = 0.42), t-tau (p = 0.28) and p-tau levels (p = 0.28) as well as WMH volumes (p = 0.77) were similar between SMC and healthy control subjects (see Supplementary Table 3).
Table 2
Correlation between WMH volume and AD CSF biomarkers
| Aβ42 | p-tau | t-tau | |||||||
| p | r | r2 | p | r | r2 | p | r | r2 | |
| Control | 0.065 | –0.258 | 0.066 | 0.443 | 0.109 | 0.012 | 0.490 | 0.098 | 0.010 |
| MCI | 0.975 | 0.004 | 0.000 | 0.250 | 0.137 | 0.019 | 0.530 | 0.077 | 0.006 |
| AD | 0.046 | –0.290 | 0.084 | 0.929 | –0.013 | 0.000 | 0.982 | 0.003 | 0.000 |
We collected data of the subjects who fulfilled the following quality requirements: the time between the lumbar puncture and the T1-weighted and T2-weighted-FLAIR MRI scans was less than 6 months; both T1-weighted and T2-weighted-FLAIR MRI scans had a maximum voxel size of 2.0 mm×2.0 mm×2.0 mm. The T1-weighted MRI scans were used to examine the brain structure, while the T2-weighted-FLAIR MRI scans were used for the visualization of WMHs. Additionally, information about age, sex, center, and scanner type were recorded. Ventricular volume and total intracranial volume (TIV) of each subject were previously determined ([25]; Table 1). In Supplementary Tables 4–6, information on the MRI scanner type, acquisition parameters, and whether a center used a specific MRI protocol or not, can be found.
Table 1
Demographic data and CSF biomarker concentrations across the diagnostic groups
| Control | AD | MCI | p | |
| Sample size: n | 52 | 48 | 72 | |
| Sex: female, n (%) | 34 (65) | 29 (60) | 44 (61) | 0.850a |
| Age: y, mean (SD) | 61.1 (8.9) | 69.0 (8.2) | 69.8 (6.8) | <0.0001b |
| Aβ42: mean, pg/mL (SD) [Aβ42-positive, % ]d | 757 (193) [12%] | 482 (194) [79%] | 706 (334) [36%] | <0.0001b |
| t-tau: mean, pg/mL (SD)c [t-tau-positive, % ]d | 225 (104) [13%] | 713 (527) [77%] | 492 (294) [57%] | <0.0001b |
| p-tau: mean, pg/mL (SD) [p-tau-positive, % ]d | 42 (15) [4%] | 95 (51) [60%] | 81 (61) [47%] | <0.0001b |
| # of WMH: mean, n (SD) | 132 (75) | 99 (118) | 89 (63) | 0.0007b |
| WMH volume: mean, mL (SD) | 5.7 (3.1) | 9.0 (7.9) | 8.7 (7.8) | 0.183b |
| WM: mean, mL (SD) | 515 (80) | 540 (79) | 550 (92) | 0.056b |
| VV: mean, mL (SD) | 23 (15) | 42 (23) | 40 (22) | <0.0001b |
| TIV: mean, mL (SD) | 1346 (139) | 1363 (118) | 1374 (121) | 0.364b |
CSF, cerebrospinal fluid; AD, Alzheimer’s disease; MCI, mild cognitive impairment; SD, standard deviation; Aβ42, amyloid-β; t-tau, total tau; p-tau, phosphorylated tau; # of WMH, number of white matter hyperintensities; WM, white matter; VV, ventricular volume; TIV, total intracranial volume. aChi-square test. bKruskal-Wallis with Dunn’s post hoc test. cNot available for n = 1 AD and n = 3 MCI patients dBased on local cut-off values.
Computer aided detection of WMHs
We pre-processed each MRI scan by a visual check. The MRI scans of unsatisfactory quality in terms of low transverse resolution, or low structural visibility due to movement or other sources of noise were excluded. Thereafter, WMHs were detected by a machine learning-based model (computer aided detection algorithm) [27] on the T1 and FLAIR modalities, resulting in the number of WMH voxels per axial-slice as outcome.
Next, the detection of WMHs by the algorithm was visually checked by a trained reader and was adjusted if necessary (post-processing). An example of a structural T1-weighted MRI scan ran by the computer aided detection algorithm can be found in Fig. 1. Using the number of WMH voxels per axial-slice and information about the voxel size (in mm2) and distance of axial-slices (in mm), the WMH volume (expressed in mL) per axial-slice was calculated. The total WMH volume was subsequently calculated by the sum of the WMH volume of each axial-slice.
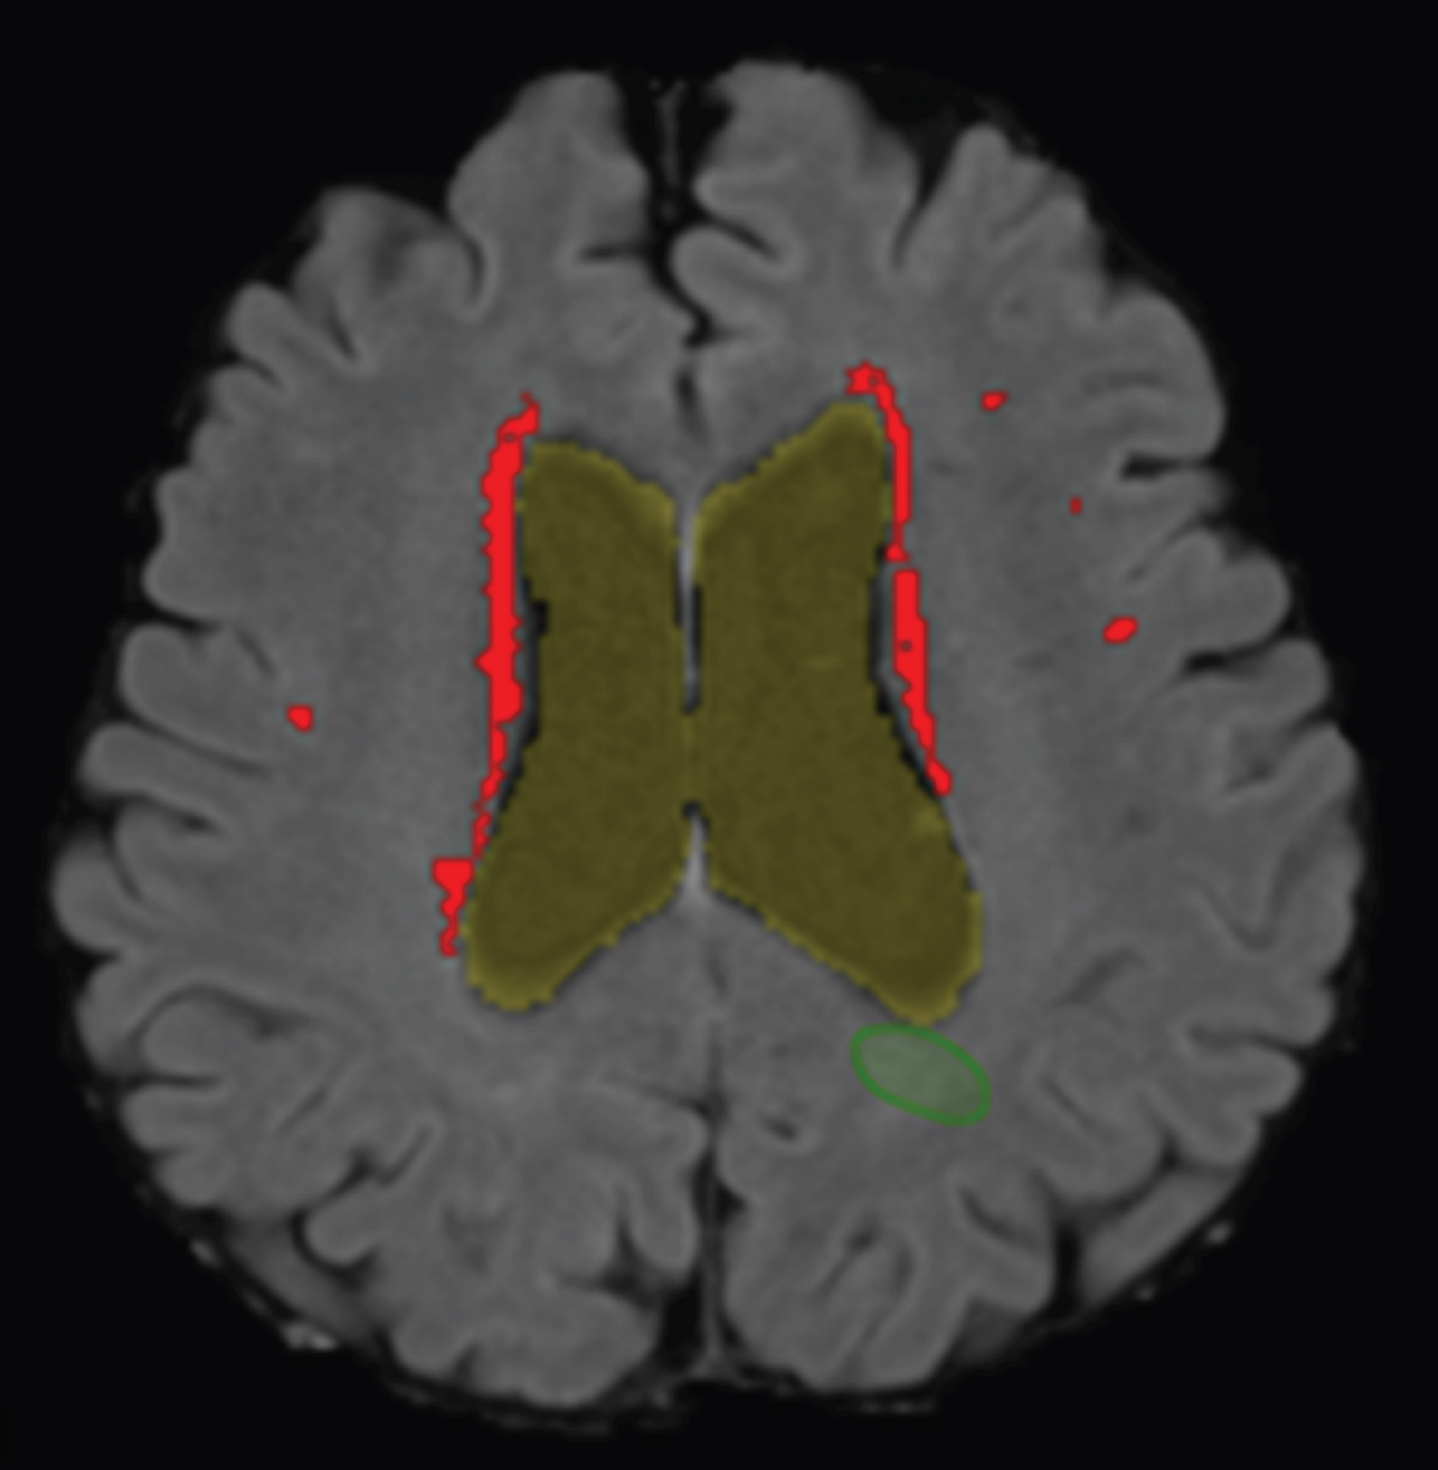
Fig. 1
WMH detection on a structural MRI scan. Segmentation of the WMHs detected by the computer aided detection system in the transverse plane projected on a T1-weighted MRI scan of an AD patient. Periventricular WMHs are indicated in red/light gray. Of note, the (green) circumference, right under ventricle, indicates a false positive WMH and was removed during post-processing.
WMH distribution patterns
The region from ventricles to the skull was divided in 20 layers, with each layer accounting for 5% of the total distance between ventricles to the skull. Data on WMH volumes was available for each of these circular layers; a schematic overview can be found in Fig. 2. In order to analyze the distribution of WMHs across the brain in a standardized manner, we used the following self-defined criteria. Distribution patterns of WMHs were based on AD patient data and defined as follows: low WMH volume in a layer was defined as <20% (<1.32 mL) of the maximum WMH volume (i.e., 6.6 mL) measured in any of the layers of the AD patients. WMH pattern 1 (with low WMH volumes) was defined as low WMH volume (<1.32 mL/layer) in each of the 20 layers of a subjects’ brain. WMH pattern 2 was characterized by a peak in WMH volume close to the ventricles and defined as high WMH volume (>1.32 mL/layer) in one or more layer(s) of the three layers closest to the ventricles, and low WMH volume in other layers. WMH pattern 3 comprised the remaining patterns, generally characterized by a high WMH volume with broad distribution over the brain, and defined as at least one layer distant from the ventricles (layers 4–20) with a high WMH volume (i.e., >1.32 mL).
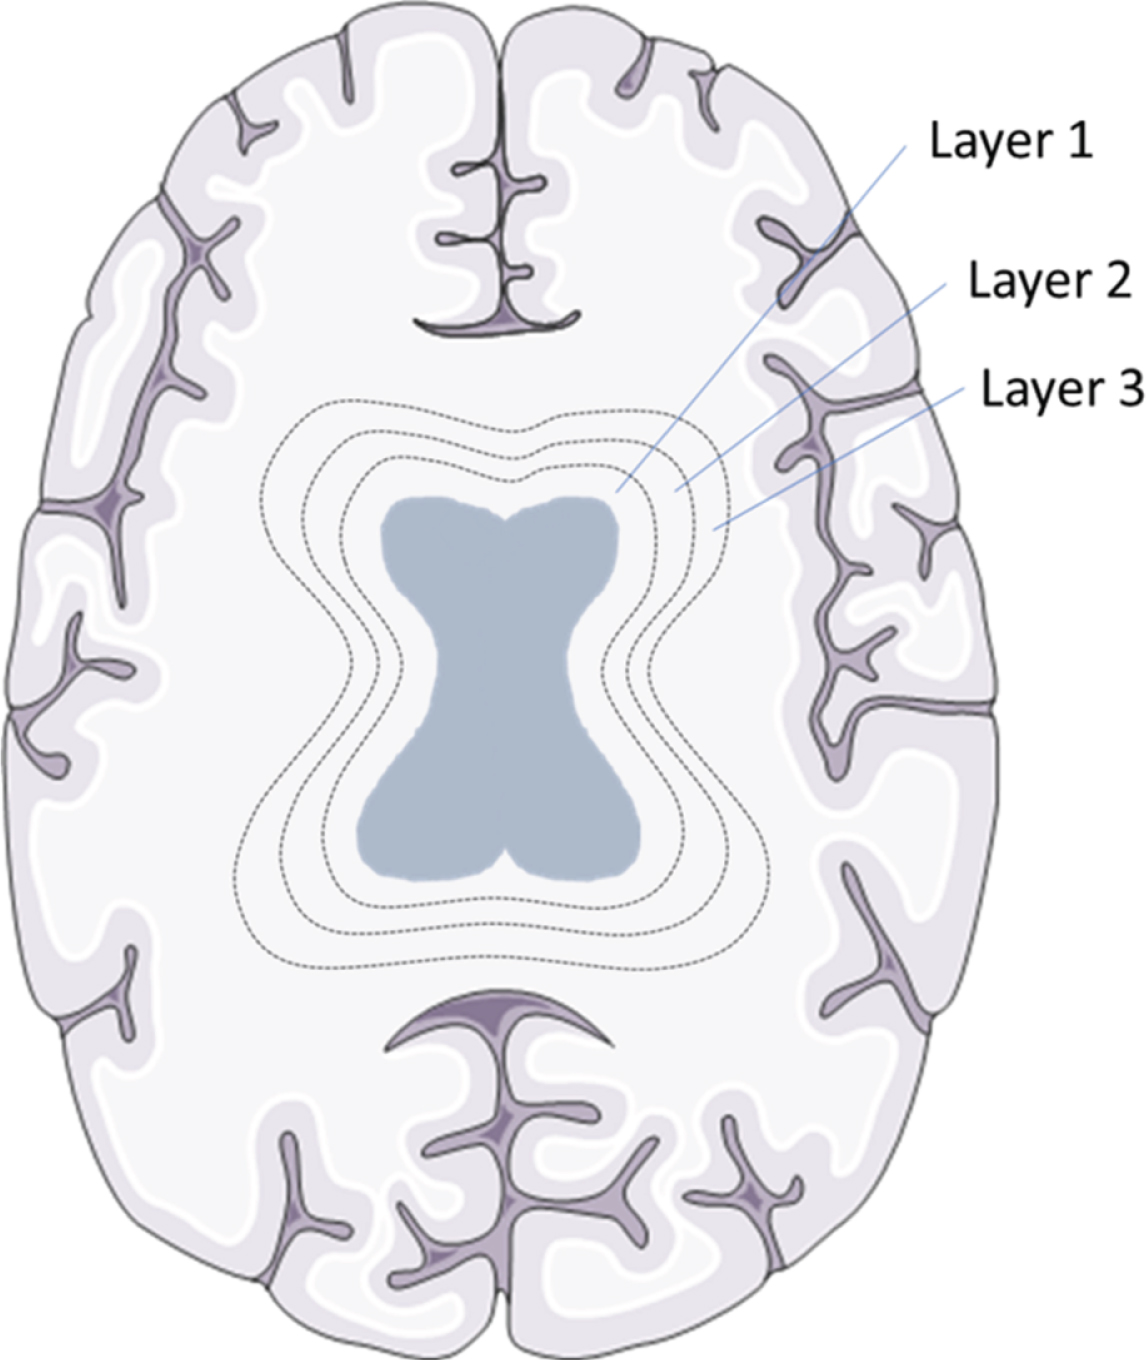
Fig. 2
WMH layers in a schematic overview. Brain tissue was divided into 20 layers, from ventricles to the skull, with each layer accounting for 5% of the total distance between ventricles to the skull. To exemplify this division the first three circular layers around the ventricles are shown in this schematic picture. Brain section image was modified from Smart Servier Medical Art, https://smart.servier.com.
AD CSF biomarkers
The ELISAs from Fujirebio (Gent, Belgium) were used according to the manufacturers’ protocol for the determination of Aβ42 (INNOTEST® β-AMYLOID (1–42)), t-tau (INNOTEST® hTAU Ag), and p-tau (INNOTEST® PHOSPHO-TAU (181P)) at each site separately. Locally applied cut-off values for the use of AD CSF biomarkers are shown in Supplementary Table 2. In all participating laboratories, the CSF samples were collected in polypropylene tubes [16]. The CSF samples were transported directly to the laboratory, centrifuged, and measured or stored at –80°C until use.
Data and statistical analysis
Statistical analyses were performed using IBM SPSS Statistics 22 (Armonk, NY, USA) and Graphpad Prism 5.03 (La Jolla, CA, USA). Normality of data distribution was determined using the D’Agostino and Pearson omnibus normality test. For comparison of two groups, a non-parametric Mann-Whitney test was used. For comparison of three groups, the non-parametric Kruskal-Wallis test with Dunn’s test for multiple comparisons was used. The Chi-square test was used to check for sex differences between the diagnostic groups. Bivariate correlations to determine the association of WMH volume with the CSF biomarkers were performed using linear regression analysis based on normal distribution. To obtain normal distributed data for the linear regression analysis, CSF p-tau, CSF t-tau, WMH/TIV, and the arbitrary WMH*distance values were log transformed. In the linear regression analysis, age and sex were analyzed as covariates, and research center, in combination with or without white matter volume, were subsequently included as additional covariates. The WMH*distance value is an arbitrary factor that combines WMH volume with the relative distance of WMHs to the ventricles, and was calculated using the following formula: WMH*distance =Σlayer [WMH volume (mL) * (100 –relative distance to ventricles (%))]. All tests were two-sided and statistical sig-nificance was defined as p < 0.05.
RESULTS
Exclusion of subjects during processing
Unfortunately, during pre-processing 34 subjects had to be excluded because of movement artefacts, 19 subjects because of “salt and pepper” noise effect, with many small white dots dispersed over the images, and 31 subjects because of insufficient resolution of the MRI scans. Furthermore, after the processing phase, 25 subjects had to be excluded because no data could be obtained due to an algorithm error when the MRI scans of these subjects were run by the computer aided detection system. Moreover, during post-processing, 13 subjects had to be excluded due to WMH segmentation failures and another 13 subjects were excluded due to algorithm failures. A segmentation failure is a failure in the algorithm used for the segmentation of ventricles, while an algorithm failure could be a failure in any of the automated steps (e.g., multi-modal registration, brain extraction, bias field correction, intensity standardization), which potentially have significant impact on the quality of the WMH detection results. Finally, two more patients were excluded for other reasons; one patient due to extreme high WMH volume (116 mL) and another patient with a non-realistic high p-tau value (690 pg/mL). Comparison of available demographic and CSF biomarker data showed that, apart from minor differences in CSF p-tau and t-tau levels in control subjects, these data were comparable between the groups of excluded versus included control, AD, and MCI subjects. Thus 172 subjects remained in the study and their demographics are shown in Table 1. In Supplementary Table 7, the detailed overview of included and excluded patients per center can be viewed.
Clinical validation of AD CSF biomarkers
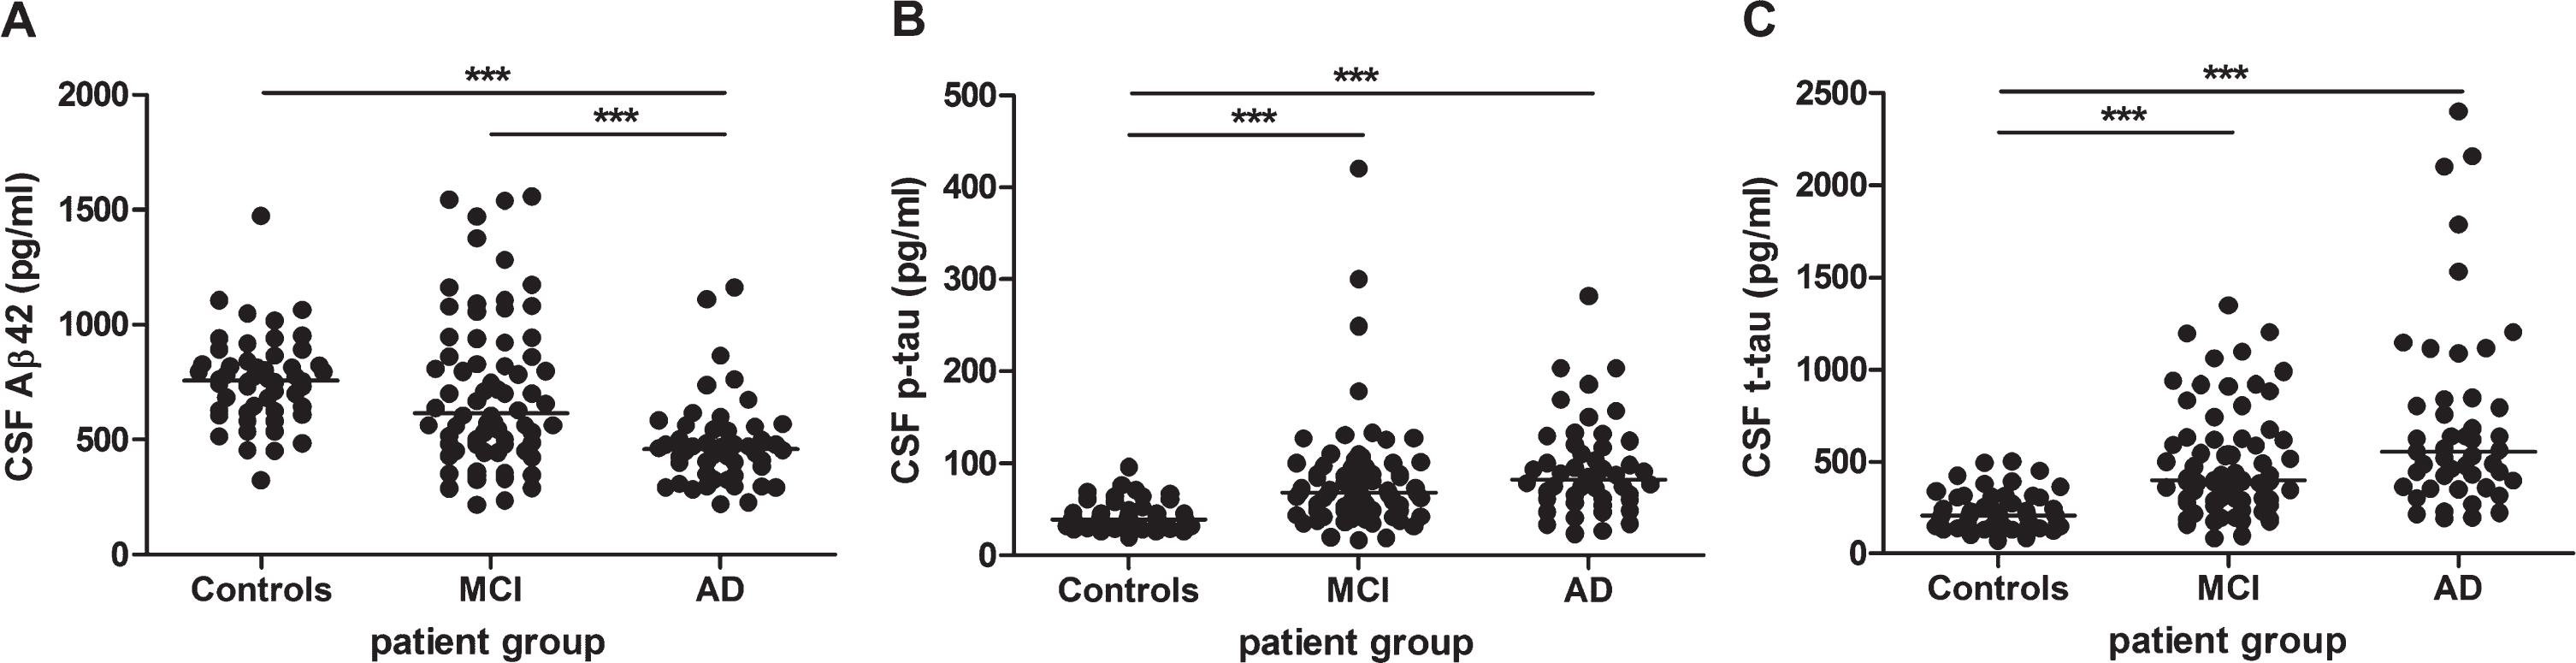
The Aβ42 CSF concentrations were significantly decreased (p < 0.001) in AD patients (mean: 482±194 pg/mL) compared to control subjects (mean: 757±193 pg/mL) and MCI patients (mean: 706±334 pg/mL) (Fig. 3A). The p-tau (Fig. 3B) and t-tau (Fig. 3C) concentrations were significantly increased (p < 0.001) in AD patients (mean p-tau: 95±51 pg/mL, mean t-tau: 713±527 pg/mL) and MCI patients (mean p-tau: 81±61 pg/mL, mean t-tau: 492±294 pg/mL) compared to control subjects (mean p-tau: 42±15 pg/mL, mean t-tau: 225±104 pg/mL). Table 1 provides an overview of the CSF data of all patient groups.
Fig. 3
Analysis of AD CSF biomarkers: Aβ42 (n = 172), p-tau (n = 172), and t-tau (n = 168) in healthy controls, MCI, and AD patients. Analysis of (A) Aβ42 in healthy controls (n = 52), mild cognitive impairment (MCI) (n = 72), and Alzheimer’s disease (AD) patients (n = 48), (B) p-tau in healthy controls (n = 52), MCI (n = 72), and AD patients (n = 48) and (C) t-tau in healthy controls (n = 52), MCI (n = 69), and AD patients (n = 47). Solid bar = median; p-value: ***p < 0.001 (Kruskal-Wallis with Dunn’s post hoc test).
WMH volume and distribution in the diagnostic groups
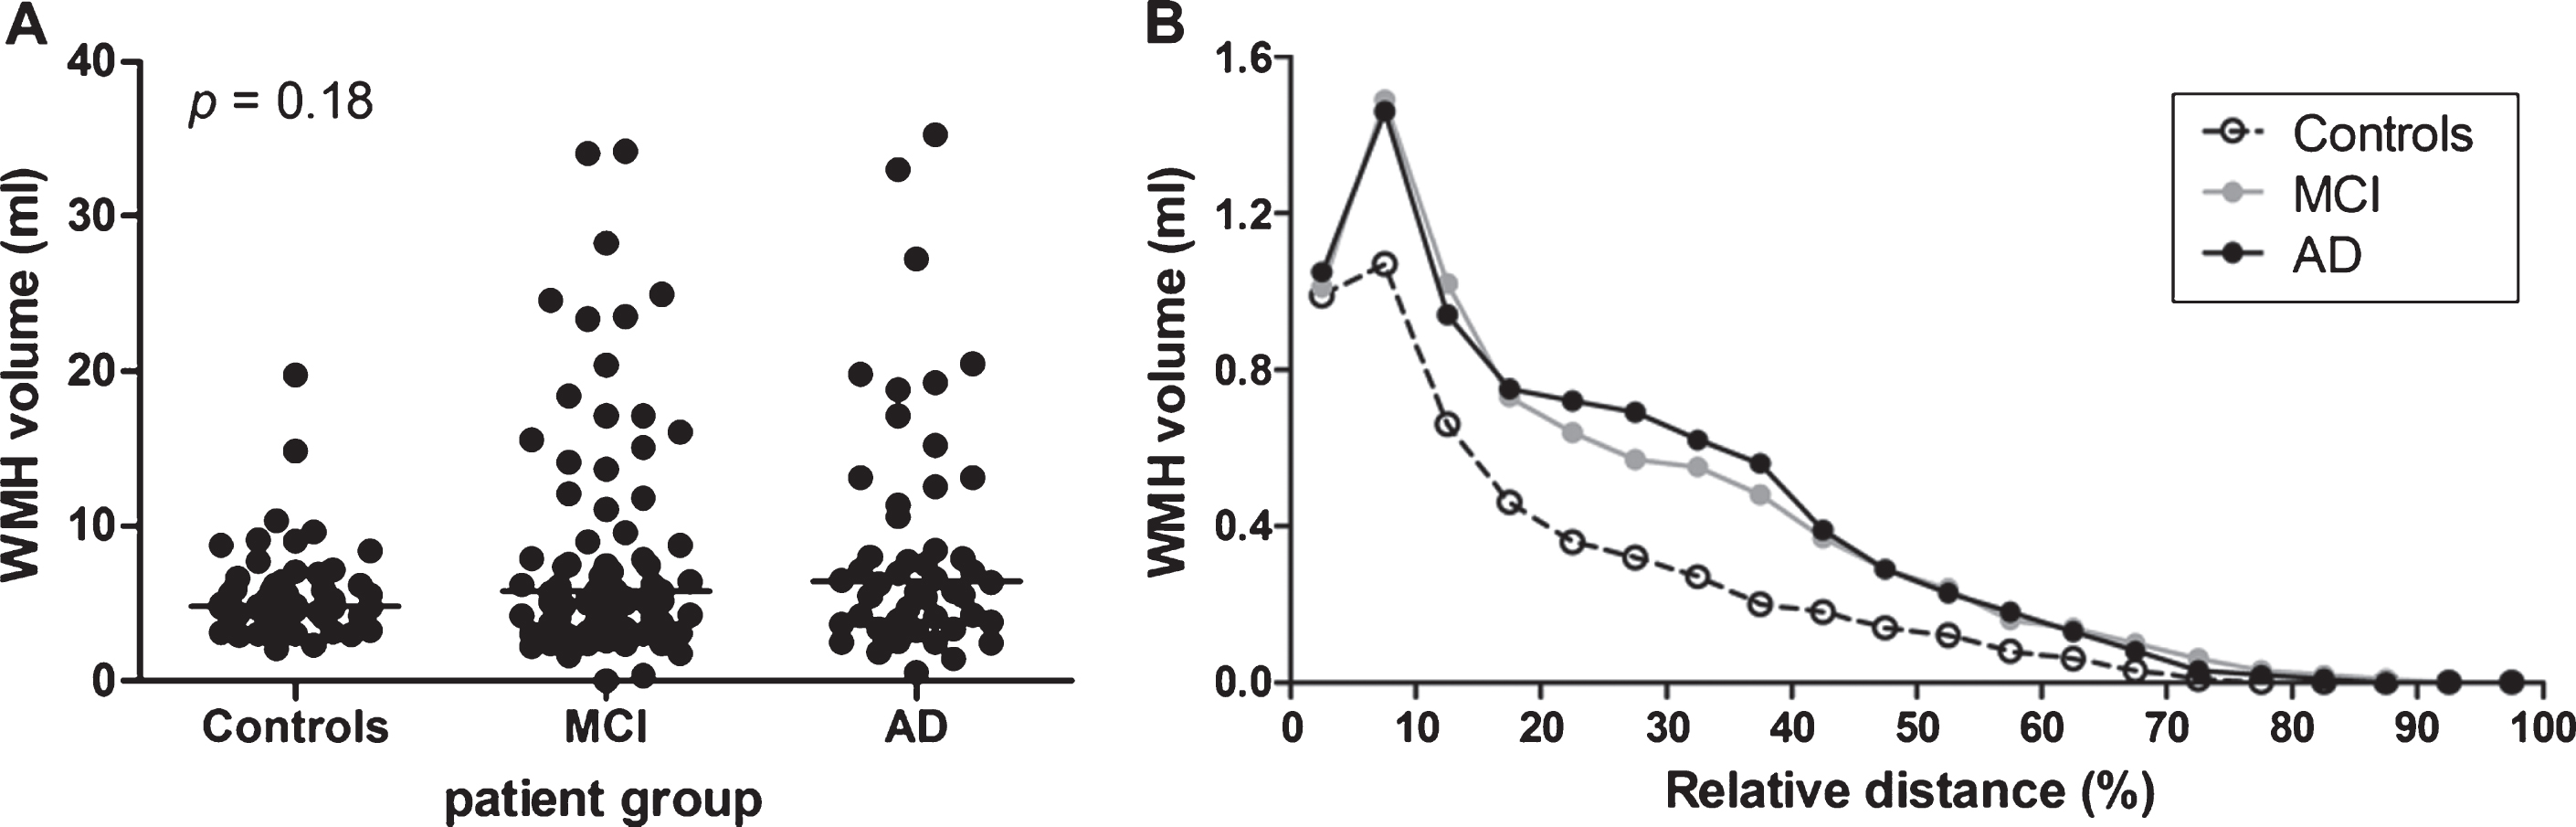
No significant differences (p = 0.18) were observed in the mean WMH volume between the different diagnostic groups (controls, MCI, and AD), see Fig. 4A. We additionally analyzed the distribution of WMH volume measured in the various layers of the MRI scans (Fig. 4B). Overall, a similar distribution of WMH volume across the brain was observed for the three diagnostic groups, with a peak WMH volume relatively close to the ventricles (relative distance; at 5–10% of the distance between ventricles and brain skull).
Fig. 4
WMH volume per diagnostic group. A) WMH volume per diagnostic group: healthy controls (n = 52), mild cognitive impairment (MCI) (n = 72), and Alzheimer’s disease (AD) patients (n = 48). No significant differences were found between the diagnostic groups (p = 0.18). Solid bar = median. B) WMH volume distribution as a function of the relative distance to the ventricles, per diagnostic group. Healthy controls had a lower WMH volume, but showed a similar distribution pattern as MCI and AD patients.
Association of AD CSF biomarkers with WMH
We used linear regression analysis to study the association of AD CSF biomarkers with WMH volume. In these analyses, WMH volume was corrected for the size of the head (TIV). A small, negative correlation between CSF Aβ42 levels and WMH/TIV was observed, i.e., higher CSF Aβ42 levels were associated with slightly, but significantly, lower WMH/TIV values in the AD group (r2 = 0.084, p = 0.046; Fig. 5A), but not in the MCI (r2 = 0.00, p = 0.98) or control group (r2 = 0.066, p = 0.065; correlation data in Table 2). These results for the control group remained similar after exclusion of SMC (n = 8) from this group (r2 = 0.037, p = 0.21). Subgroup analysis showed that in MCI patients positive for CSF Aβ42 (i.e., with decreased levels based on the local cut-off values; Table 1 and Supplementary Table 2), CSF Aβ42 levels tended to associate with WMH/TIV values (n = 26, r2 = 0.14, r = –0.38, p = 0.056), which was not the case in MCI patients negative for CSF Aβ42 (n = 46, r2 = 0.00, r = –0.01, p = 0.97). In contrast, no association of p-tau or t-tau with WMH/TIV was observed in the AD (Fig. 5B, C), MCI or the control groups (correlation data in Table 2). We sequentially added several covariates to the analyses, first age and sex, second center and third total white matter volume. The association of Aβ42 levels with WMH/TIV in the AD group remained significant when age and sex in combination with the center and total white matter volume were included as covariates (overall model: p = 0.045, r2 = 0.230; significance of WMH/TIV in the model: p = 0.031).
Fig. 5
Correlation of WMH volume with CSF Aβ42, t-tau and p-tau. White matter hyperintensity volumes corrected for total intracranial volume (WMH/TIV) versus CSF Aβ42 (A, D, G), p-tau (B, E, H), and t-tau (C, F, I) concentrations in the Alzheimer’s disease (AD) group (A-C), the mild cognitive impairment (MCI) group (D-F), and the control group (G-I). A significant (p < 0.05), negative correlation was found between (log) WML/TIV and CSF Aβ42 concentrations in the AD group (A), but not for (log) p-tau or (log) t-tau in any group or for Aβ42 in the MCI and control groups. p and r values derived from linear regression analyses are plotted. Linear regression lines are shown, except for panels A and G where quadratic relations are shown.
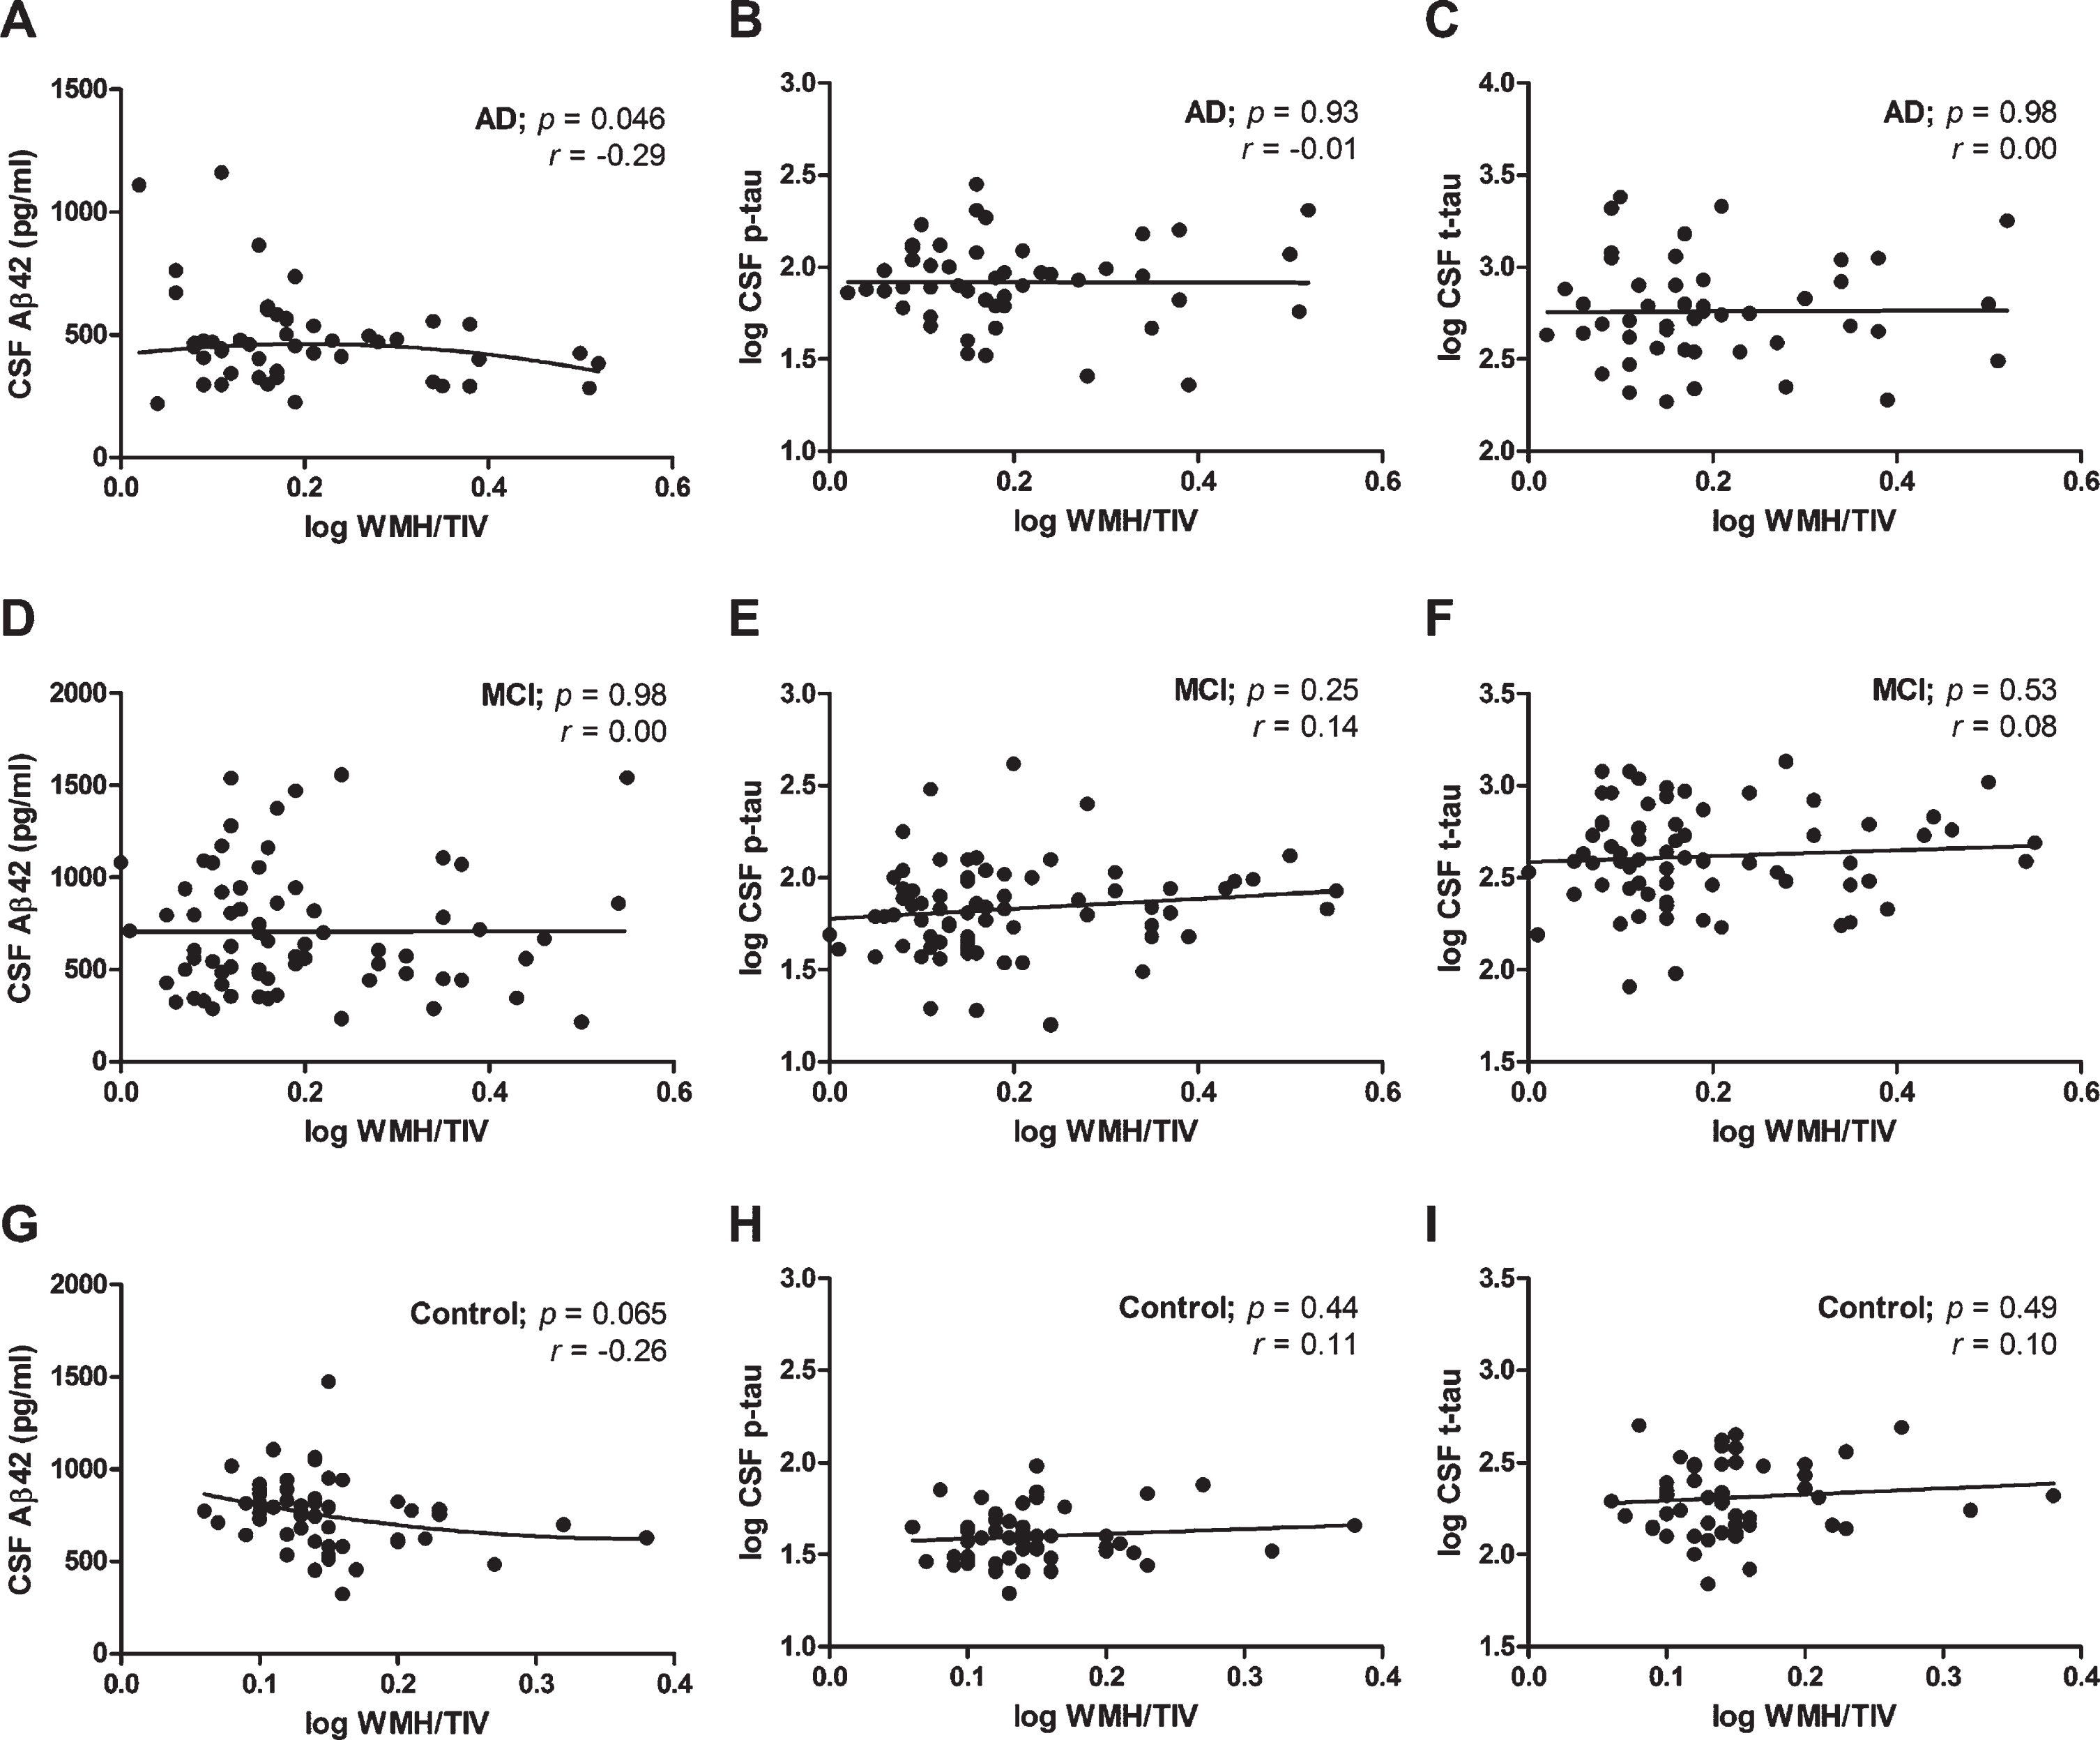
We repeated the linear regression analysis using an arbitrary factor that combines WMH volume with the relative distance of WMHs to the ventricles instead of WMH/TIV. This arbitrary WMH*distance value assigns a higher value to WMH volumes closer to the ventricles. Like for the association with WMH volume, we only observed a significant, negative correlation for CSF Aβ42 with this arbitrary WMH*distance value in the AD group (r2 =0.105, p = 0.025), which remained after including age, sex, center and white matter volume as covariates (overall model: p = 0.025, r2 = 0.252; significance of WMH*distance in the model: p = 0.016).
Association of WMH distribution patterns with CSF biomarker levels
To study the relation between WMH distance to the ventricles and CSF biomarker levels in more detail, we looked at the WMH distribution patterns within a diagnostic group. In the AD group, we could observe three global patterns in the distribution of WMH volume within the brain. The most abundant pattern (pattern 1, Fig. 6A) had an overall low WMH volume across the brain. The second most abundant pattern (pattern 2, Fig. 6B) showed a peak in WMH volume close to the ventricles and a low WMH volume comparable to pattern 1 distant from the ventricles, whereas the last pattern (pattern 3, Fig. 6C) showed a high WMH volume distributed over a broader range of the brain. The WMH volume was significantly higher for AD patients with pattern 3 as compared to pattern 1 and 2, as well as for AD patients with pattern 2 compared to pattern 1 (Fig. 6D). The three WMH patterns could also be observed in MCI patients with comparable WMH peak volumes per pattern (Table 3). In control subjects, patterns 1 and 2 were also frequently observed, in contrast to pattern 3 which was observed only in two control subjects (Table 3).
Fig. 6
WMH distribution patterns in brains of AD patients. WMH in brains of AD patients showed either (A) a distribution of a low WMH volume across the whole brain (pattern 1), or (B) an increased WMH volume (peak) close to the ventricles only (pattern 2), or (C) a high WMH volume distributed across a broader region of the brain (pattern 3). The WMH volume is shown per brain layer for a total of 20 evenly distributed layers per brain (indicated as relative distance from the ventricles in %). The distribution pattern for each patient is shown in grey, with the mean WMH volume per layer for each pattern shown in black. D) Dot plot of the total WMH volumes in the brain of AD patients per WMH pattern. Mean WMH volumes were statistically significant different between the three patterns (Kruskal Wallis test with Dunn’s test for multiple comparisons). Aβ42 CSF levels (E), but not t-tau (F), and p-tau levels (G), were significantly decreased in AD patients with WMH pattern 3 compared to pattern 2. H) Ventricular volume was significantly increased in AD patients with WMH pattern 2 or 3 (high WMH volumes) compared to pattern 1 (low WMH volumes). Solid bar = median; p-value: *< 0.05, **< 0.01, ***< 0.001.
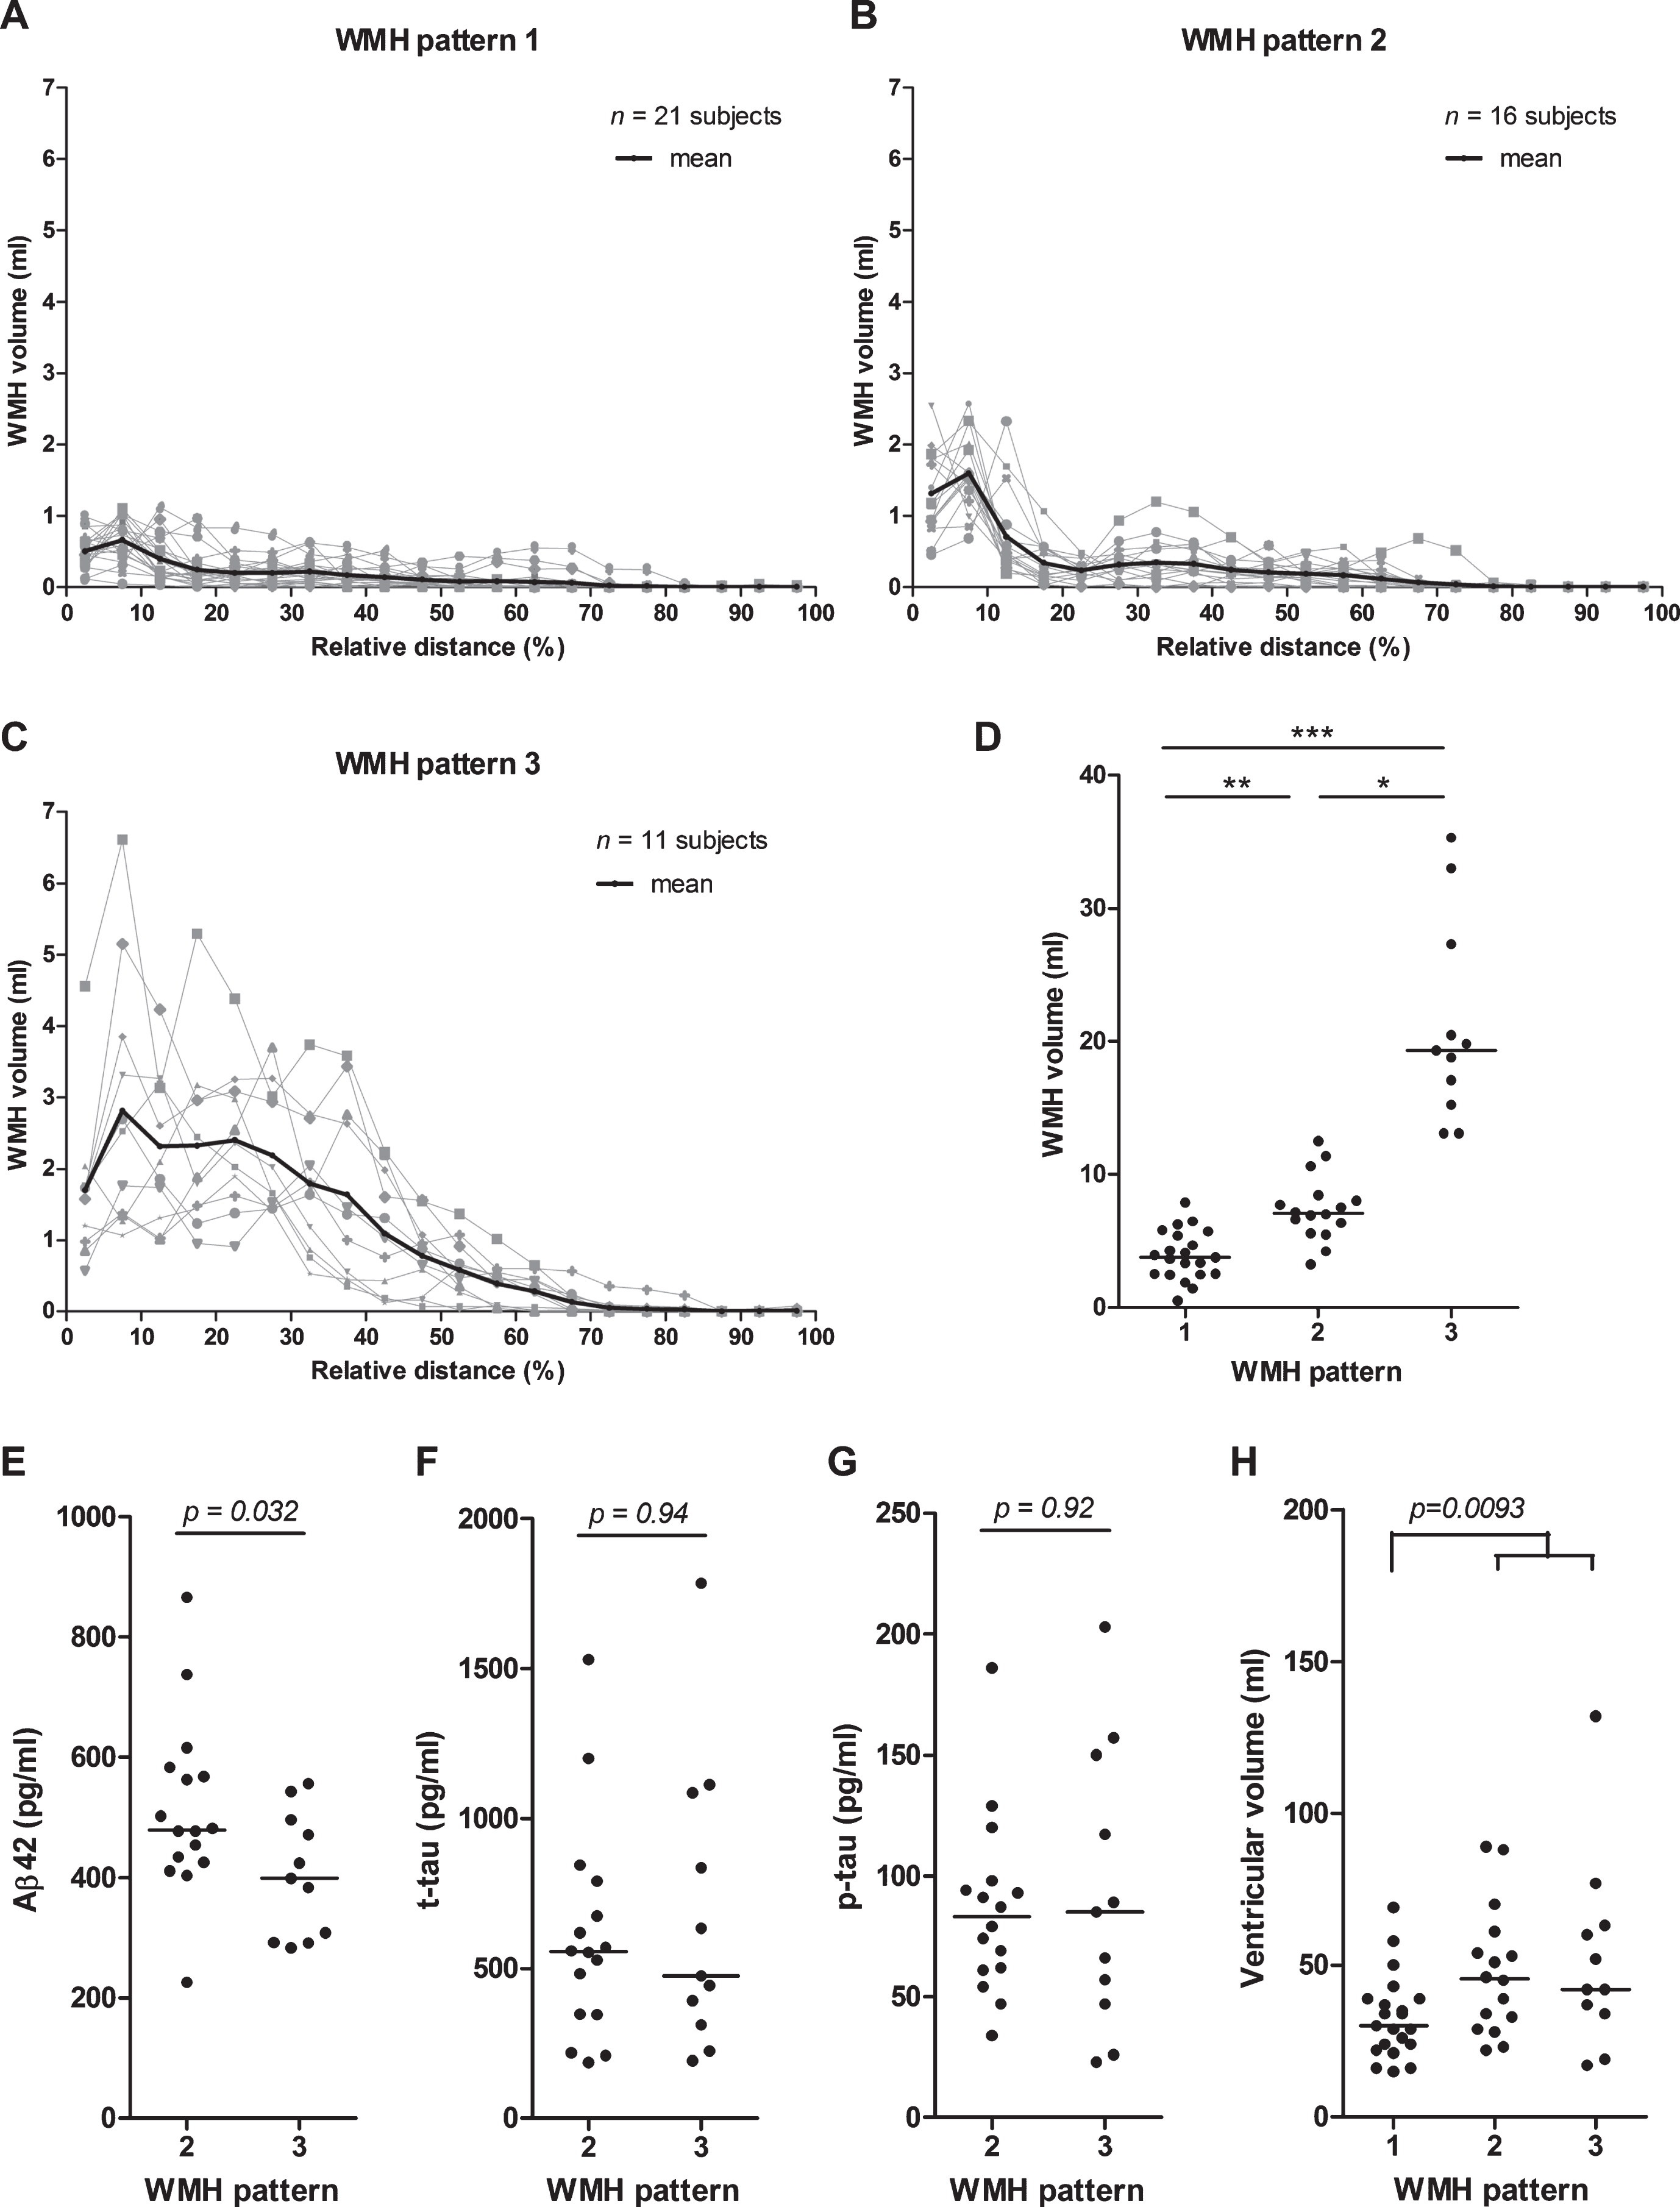
Table 3
WMH pattern characteristics and distribution per patient group
| All (n) | WMH pattern 1 | WMH pattern 2 | WMH pattern 3 | |
| Control | ||||
| n (% of total) | 52 | 30 (58%) | 20 (38%) | 2 (4%) |
| mean WMH peak volume* | 0.76±0.25 | 1.38±0.47 | 2.65±1.36 | |
| MCI | ||||
| n (% of total) | 72 | 36 (50%) | 19 (26%) | 17 (24%) |
| mean WMH peak volume* | 0.71±0.36 | 1.62±0.50 | 3.00±1.25 | |
| AD | ||||
| n (% of total) | 48 | 21 (44%) | 16 (33%) | 11 (23%) |
| mean WMH peak volume* | 0.66±0.30 | 1.59±0.54 | 2.82±1.79 |
*Highest (peak) mean WMH volume (in mL±SD) in a layer per pattern, which was for each pattern and patient group the WMH volume in layer 2. See the Materials and Methods section for a definition of the three WMH patterns.
We compared patients with WMH pattern 2, i.e., WMH close to the ventricles, to patients with WMH pattern 3, i.e., WMH both close and distant from the ventricles. We observed significantly decreased levels of Aβ42, but no differences in t-tau or p-tau levels, in AD patients with WMH pattern 3 (mean Aβ42: 404±103 pg/mL) as compared to pattern 2 (mean Aβ42: 514±146 pg/mL; p = 0.032, Fig. 6E). We neither observed differences in Aβ42 nor in t-tau or p-tau levels between these patterns 2 and 3 in MCI patients (Fig. 6F, G and data not shown). The analysis could not be performed for control subjects, since only few subjects with WMH pattern 3 were available.
We also compared patients with WMH pattern 1 to patients with WMH pattern 2 or 3, but we did not observe any significant differences in these comparisons for Aβ42, t-tau, and p-tau levels in controls, MCI or AD patients (data not shown). Ventricular volumes were, however, significantly increased in MCI and AD patients with WMH pattern 2 or 3 versus WMH pattern 1 (MCI: 50.5±24.1 mL versus 30.0±13.6 mL, p < 0.001; AD: 49.6±25.6 mL versus 32.9±13.8 mL, p = 0.009, Fig. 6H), and weak, but significant, correlations between ventricular and WMH volumes were observed for all three patient groups separately and combined (all: Spearman r = 0.405, p < 0.001).
DISCUSSION
CSF biomarkers have obtained an increasingly prominent position in support of establishing the early clinical diagnosis of AD, and can also support in predicting progression of AD [20]. Establishing and controlling for confounding factors, may further optimize the performance of CSF biomarkers. In a previous study we demonstrated that ventricular volume can be a confounding factor. We showed a slight, but significant, improved diagnostic value of Aβ42 after correction for ventricular volume [25]. In the current study, we evaluated WMHs as possible confounding factor for AD CSF biomarkers (Aβ42, t-tau, p-tau).
Association of AD CSF biomarkers with WMH volume
We hypothesized that the occurrence of WMHs is accompanied by the excess release of cellular components (e.g., tau proteins) in the extracellular space and as a result can modify the patterns of biomarkers that are known to be associated with AD pathology. Unlike this hypothesis, we showed that increased WMH volume, albeit weakly, was significantly associated with decreased CSF Aβ42 concentrations in the AD group. This finding suggests that increased WMH volume is associated with worsened amyloid pathology. We did not observe an association between p-tau or t-tau concentrations and WMH volume in any group, nor between CSF Aβ42 levels and WMH volume in the MCI and control groups. Our findings are not in line with a previous study in which it was shown that decreased CSF Aβ42 and increased neurofilament light chain levels are related to increased WMH volume in a cohort of cognitively intact elderly individuals [28]. Additionally, two other studies also reported a significant negative correlation (p < 0.01; p = 0.013) between CSF Aβ42 and WMH volume in cognitively normal individuals and MCI patients [29, 30]. In all three studies, no AD group was included [28–30]. Recently, another study showed a significant negative association of CSF Aβ42 levels with WMH volume in (healthy) controls and SMCs, and a border-significant association in MCI and AD patients [31]. No associations between vascular risk factors and CSF Aβ42 levels in cognitively normal older individuals and individuals with abnormal biomarkers were found in another study [32]. The absence of an association of CSF Aβ42 levels with WMH volume in our study may be due to the heterogeneity of our MCI group and thus high variability in Aβ42 levels observed in these patients. CSF Aβ42 levels in our MCI group were not significantly decreased compared to control subjects, which is also reflected by a relative low number of MCI patients (36%) positive for Aβ42 (i.e., with decreased CSF Aβ42 level). Indeed, a subgroup in our study diagnosed with amnestic MCI (who are more likely to convert to AD) had significantly lower CSF Aβ42 levels (mean: 680 pg/ml) as compared to the control group (p < 0.05), and had a higher number of patients (48%) positive for Aβ42 than the whole MCI group, which is in line with previous studies [33, 34].
Our finding of the absence of a correlation between p-tau or t-tau and WMH volume is consistent with previous studies [28, 29, 31, 35–38]. Tau is mainly localized in axons, and increased CSF t-tau levels reflect neurodegeneration (formation of neurofibrillary tangles) or neuronal injury and may dominate the potentially more subtle effects of WMHs on tau protein release [28, 38]. However, another study showed an association between vascular risk burden measured by the Framingham Stroke Risk Profile (including WMHs, silent cerebral infarcts and microbleeds) and axonal damage, which was more pronounced in patients with AD pathology [39]. Thus, it cannot be excluded that SVD may affect t-tau levels in CSF if other measures of SVD beyond WMHs are included. However, these data were not available for the current study.
We aimed to study also the relation of the distance of WMHs to the ventricles with AD CSF biomarkers in addition to the WMH volume. WMHs may represent an independent indicator of cerebrovascular impairment in AD patients and may interact with AD pathology [40]. We expected a greater exchange of proteins and influence of WMHs when these are close to the ventricles, where most of the CSF is located, as opposed to more distant WMHs. Hereto, we used an arbitrary value that combined both aspects. We observed a slightly stronger association with CSF Aβ42 levels in the AD group when this arbitrary value was used instead of total WMH volume only. This suggests that the relative distance of WMH to the ventricles contributes to the extent of the association with CSF Aβ42 levels. To explore this further, we analyzed the WMH distribution pattern across the brain. We could observe three different distribution patterns. Interestingly, CSF Aβ42 levels were lower in AD patients with a broad distribution of WMH across the brain (pattern 3) as compared to AD patients with a higher WMH volume only close to the ventricles (pattern 2), further suggesting a possible relation of WMH distance to ventricles with CSF Aβ42 levels. However, the total WMH volume in brains of patients with the broad distribution pattern 3 was also higher than for patients with a peak volume close to the ventricles, and therefore the association of either total WMH volume and distance of WMH lesion from the ventricles could not be separately assessed.
Limitations
The results of this study should be interpreted with caution for a number of reasons. Firstly, CSF biomarker concentrations were determined in different laboratories and, despite that the same assays were used, variation in the pre-analytical and analytical procedures used will influence our data [16, 41]. Efforts for more standardized methods are needed to measure CSF biomarkers, and standardized guidelines are developed using uniform reference materials within the JPND-BiomarkAPD project (https://biomarkapd.org/). Secondly, there was neither a standardized MRI protocol used for this study nor were the patients scanned using the same scanner. Therefore, it cannot be excluded that variations in scanning protocol have influenced our data. Thirdly, we have not evaluated the possible correlations between CSF biomarker levels and disease progression of AD. Patients at a more advanced stage of AD may have both increased WMH volumes and decreased CSF Aβ42 levels compared to patients at earlier stages of disease. Indeed, a systematic literature review showed a trend in which CSF Aβ42 decreases (mean: –0.4 pg/mL/month for 8 studies) over time [42]. In contrast, however, in a longitudinal study no changes were observed in CSF Aβ42 and p-tau levels over time (mean: 24±13 months) in MCI and AD patients [43]; therefore, it remains uncertain to what degree the association of WMHs with CSF Aβ42 can be explained by differences in disease stage. Fourthly, the MCI group in our study is a mixed group and may include both stable MCI patients and MCI patients who will convert to AD at a later stage, which may have affected our findings. Furthermore, some laboratories used CSF biomarkers as support in the clinical diagnosis of MCI (and AD), while other laboratories did not. It should be noted that the proportion of Aβ42-positive cases was comparable when the diagnosis was supported by CSF biomarkers versus when CSF biomarkers were not used to support the diagnosis. Finally, it would be interesting to study the association of WMHs with CSF biomarkers in a larger population and to include additional CSF biomarkers like Aβ40 or covariates like APOE genotype, as well as to develop a model combining different confounding factors to evaluate their combined relation with diagnostic accuracy of CSF biomarkers. We did, unfortunately, not have CSF Aβ40 or APOE genotype data available to include in analyses of the current study.
Conclusion
In summary, we studied if the differences in WMH volume may act as a confounding factor for interpretation of CSF biomarkers. For this purpose, we used a computer aided detection algorithm for the automated measurement of WMHs. We showed that WMH volume, albeit weakly, associated with CSF Aβ42 concentrations in AD, but not in controls and MCI patients. Interestingly, three global patterns in the distribution of WMH volume within the brain could be observed in AD patients. Our data suggests that the distance of WMH to the ventricles in addition to WMH volume also slightly contributes to the association with CSF Aβ42 levels. In conclusion, since only CSF Aβ42 levels weakly and negatively correlated with WMH/TIV, the occurrence of WMHs is not accompanied by excess release of cellular components (tau and Aβ proteins) in the CSF. Therefore, WMHs are no major confounders in assessing CSF levels of tau and Aβ proteins.
ACKNOWLEDGMENTS
We would like to thank Marcel de Bruijn, BSc, for his assistance on the visual quality control of the MRI scans.
BIOMARKAPD is an EU Joint Programme–Neurodegenerative Disease Research (JPND) project. This project was supported through national funding organizations under the aegis of JPND (https://www.jpnd.eu). These national funding organizations included the Netherlands Organisation for Health Research and Development (ZonMw), the Netherlands; the Instituto de Salud Carlos III (ISCIII) (grant numbers: PI11/3035, PI11/02425 and PI14/01126), Spain; the Italian Ministry of Health (grant number: IG-2014-2354450), Italy; Health Research Council of the Academy of Finland (grant number: 263193), Finland; TUBITAK (project number: 112S360), Turkey; Fundação para a Ciência e a Tecnologia (FCT) (grant numbers: PIC/IC/83206/2007 and JPND/0005/2011), Portugal. Additionally, this work was funded by ZonMW and the Dutch national ‘Deltaplan for Dementia’ (zonmw.nl/dementiaresearch), the BIONIC project to Verbeek: nr. 733050822), Alzheimer Nederland, Alzheimer’s drug discovery foundation, ISAO, the CIBERNED program (Program 1, Alzheimer Disease), FondoEuropeo de Desarrollo Regional (FEDER), Unión Europea, “Una manera de hacer Europa” and a “Marató TV3” grant (grant number: 201412.10), Alzheimer’s Association, IMI Project “PharmaCog”, FP7, H2020, and Swiss National Science Foundation.
Authors’ disclosures available online (https://www.j-alz.com/manuscript-disclosures/20-0496r2).
SUPPLEMENTARY MATERIAL
[1] The supplementary material is available in the electronic version of this article: https://dx.doi.org/10.3233/JAD-200496.
REFERENCES
[1] | Blennow K , de Leon MJ , Zetterberg H ((2006) ) Alzheimer’s disease. Lancet 368: , 387–403. |
[2] | Prins ND , Scheltens P ((2015) ) White matter hyperintensities, cognitive impairment and dementia: An update. Nat Rev Neurol 11: , 157–165. |
[3] | Swan GE , DeCarli C , Miller BL , Reed T , Wolf PA , Jack LM , Carmelli D ((1998) ) Association of midlife blood pressure to late-life cognitive decline and brain morphology. Neurology 51: , 986–993. |
[4] | Bigler ED , Kerr B , Victoroff J , Tate DF , Breitner JC ((2002) ) White matter lesions, quantitative magnetic resonance imaging, and dementia. Alzheimer Dis Assoc Disord 16: , 161–170. |
[5] | De Groot JC , De Leeuw FE , Oudkerk M , Van Gijn J , Hofman A , Jolles J , Breteler MM ((2002) ) Periventricular cerebral white matter lesions predict rate of cognitive decline. Ann Neurol 52: , 335–341. |
[6] | Garde E , Lykke Mortensen E , Rostrup E , Paulson OB ((2005) ) Decline in intelligence is associated with progression in white matter hyperintensity volume. J Neurol Neurosurg Psychiatry 76: , 1289–1291. |
[7] | Prins ND , van Dijk EJ , den Heijer T , Vermeer SE , Jolles J , Koudstaal PJ , Hofman A , Breteler MM ((2005) ) Cerebral small-vessel disease and decline in information processing speed, executive function and memory. Brain 128: , 2034–2041. |
[8] | van Dijk EJ , Prins ND , Vrooman HA , Hofman A , Koudstaal PJ , Breteler MM ((2008) ) Progression of cerebral small vessel disease in relation to risk factors and cognitive consequences: Rotterdam Scan study. Stroke 39: , 2712–2719. |
[9] | Selnes P , Blennow K , Zetterberg H , Grambaite R , Rosengren L , Johnsen L , Stenset V , Fladby T ((2010) ) Effects of cerebrovascular disease on amyloid precursor protein meta-bolites in cerebrospinal fluid. Cerebrospinal Fluid Res 7: , 10. |
[10] | Schmidt R , Berghold A , Jokinen H , Gouw AA , van der Flier WM , Barkhof F , Scheltens P , Petrovic K , Madureira S , Verdelho A , Ferro JM , Waldemar G , Wallin A , Wahlund LO , Poggesi A , Pantoni L , Inzitari D , Fazekas F , Erkinjuntti T ((2012) ) White matter lesion progression in LADIS: Frequency, clinical effects, and sample size calculations. Stroke 43: , 2643–2647. |
[11] | Verhaaren BF , Vernooij MW , de Boer R , Hofman A , Niessen WJ , van der Lugt A , Ikram MA ((2013) ) High blood pressure and cerebral white matter lesion progression in the general population. Hypertension 61: , 1354–1359. |
[12] | Wardlaw JM , Smith EE , Biessels GJ , Cordonnier C , Fazekas F , Frayne R , Lindley RI , O’Brien JT , Barkhof F , Benavente OR , Black SE , Brayne C , Breteler M , Chabriat H , Decarli C , de Leeuw FE , Doubal F , Duering M , Fox NC , Greenberg S , Hachinski V , Kilimann I , Mok V , Oostenbrugge R , Pantoni L , Speck O , Stephan BC , Teipel S , Viswanathan A , Werring D , Chen C , Smith C , van Buchem M , Norrving B , Gorelick PB , Dichgans M ((2013) ) Neuroimaging standards for research into small vessel disease and its contribution to ageing and neurodegeneration. Lancet Neurol 12: , 822–838. |
[13] | van Leijsen EMC , de Leeuw FE , Tuladhar AM ((2017) ) Disease progression and regression in sporadic small vessel disease-insights from neuroimaging. Clin Sci (Lond) 131: , 1191–1206. |
[14] | Schnaar RL ((2010) ) Brain gangliosides in axon-myelin stability and regeneration. FEBS Lett 584: , 1741–1747. |
[15] | McKhann GM , Knopman DS , Chertkow H , Hyman BT , Jack CR Jr. , Kawas CH , Klunk WE , Koroshetz WJ , Manly JJ , Mayeux R , Mohs RC , Morris JC , Rossor MN , Scheltens P , Carrillo MC , Thies B , Weintraub S , Phelps CH ((2011) ) The diagnosis of dementia due to Alzheimer’s disease: Recommendations from the National Institute on Aging-Alzheimer’s Association workgroups on diagnostic guidelines for Alzheimer’s disease. Alzheimers Dement 7: , 263–269. |
[16] | del Campo M , Mollenhauer B , Bertolotto A , Engelborghs S , Hampel H , Simonsen AH , Kapaki E , Kruse N , Le Bastard N , Lehmann S , Molinuevo JL , Parnetti L , Perret-Liaudet A , Saez-Valero J , Saka E , Urbani A , Vanmechelen E , Verbeek M , Visser PJ , Teunissen C ((2012) ) Recommendations to standardize preanalytical confounding factors in Alzheimer’s and Parkinson’s disease cerebrospinal fluid biomarkers: An update. Biomark Med 6: , 419–430. |
[17] | Molinuevo JL , Blennow K , Dubois B , Engelborghs S , Lewczuk P , Perret-Liaudet A , Teunissen CE , Parnetti L ((2014) ) The clinical use of cerebrospinal fluid biomarker testing for Alzheimer’s disease diagnosis: A consensus paper from the Alzheimer’s Biomarkers Standardization Initiative. Alzheimers Dement 10: , 808–817. |
[18] | Clark CM , Xie S , Chittams J , Ewbank D , Peskind E , Galasko D , Morris JC , McKeel DW Jr. , Farlow M , Weitlauf SL , Quinn J , Kaye J , Knopman D , Arai H , Doody RS , DeCarli C , Leight S , Lee VM , Trojanowski JQ ((2003) ) Cerebrospinal fluid tau and beta-amyloid: How well do these biomarkers reflect autopsy-confirmed dementia diagnoses? Arch Neurol 60: , 1696–1702. |
[19] | Diniz BS , Pinto Junior JA , Forlenza OV ((2008) ) Do CSF total tau, phosphorylated tau, and beta-amyloid 42 help to predict progression of mild cognitive impairment to Alzheimer’s disease? A systematic review and meta-analysis of the literature. World J Biol Psychiatry 9: , 172–182. |
[20] | Blennow K , Dubois B , Fagan AM , Lewczuk P , de Leon MJ , Hampel H ((2015) ) Clinical utility of cerebrospinal fluid biomarkers in the diagnosis of early Alzheimer’s disease. Alzheimers Dement 11: , 58–69. |
[21] | Hesse C , Rosengren L , Andreasen N , Davidsson P , Vanderstichele H , Vanmechelen E , Blennow K ((2001) ) Transient increase in total tau but not phospho-tau in human cerebrospinal fluid after acute stroke. Neurosci Lett 297: , 187–190. |
[22] | de Jong D , Jansen RW , Kremer BP , Verbeek MM ((2006) ) Cerebrospinal fluid amyloid beta42/phosphorylated tau ratio discriminates between Alzheimer’s disease and vascular dementia.. J Gerontol A Biol Sci Med Sci 61: , 755–758. |
[23] | Koopman K , Le Bastard N , Martin JJ , Nagels G , De Deyn PP , Engelborghs S ((2009) ) Improved discrimination of autopsy-confirmed Alzheimer’s disease (AD) from non-AD dementias using CSF P-tau(181P). Neurochem Int 55: , 214–218. |
[24] | Spies PE , Slats D , Sjogren JM , Kremer BP , Verhey FR , Rikkert MG , Verbeek MM ((2010) ) The cerebrospinal fluid amyloid beta42/40 ratio in the differentiation of Alzheimer’s disease from non-Alzheimer’s dementia. Curr Alzheimer Res 7: , 470–476. |
[25] | van Waalwijk van Doorn LJ , Gispert JD , Kuiperij HB , Claassen JA , Arighi A , Baldeiras I , Blennow K , Bozzali M , Castelo-Branco M , Cavedo E , Emek-Savas DD , Eren E , Eusebi P , Farotti L , Fenoglio C , Ormaechea JF , Freund-Levi Y , Frisoni GB , Galimberti D , Genc S , Greco V , Hampel H , Herukka SK , Liu Y , Llado A , Lleo A , Nobili FM , Oguz KK , Parnetti L , Pereira J , Picco A , Pikkarainen M , de Oliveira CR , Saka E , Salvadori N , Sanchez-Valle R , Santana I , Scarpini E , Scheltens P , Soininen H , Tarducci R , Teunissen C , Tsolaki M , Urbani A , Vilaplana E , Visser PJ , Wallin AK , Yener G , Molinuevo JL , Meulenbroek O , Verbeek MM ((2017) ) Improved cerebrospinal fluid-based discrimination between Alzheimer’s disease patients and controls after correction for ventricular volumes. J Alzheimers Dis 56: , 543–555. |
[26] | Jansen WJ , Ossenkoppele R , Knol DL , Tijms BM , Scheltens P , Verhey FR , Visser PJ , Aalten P , Aarsland D , Alcolea D , et al. ((2015) ) Prevalence of cerebral amyloid pathology in persons without dementia: A meta-analysis. JAMA 313: , 1924–1938. |
[27] | Ghafoorian M , Karssemeijer N , van Uden IW , de Leeuw FE , Heskes T , Marchiori E , Platel B ((2016) ) Automated detection of white matter hyperintensities of all sizes in cerebral small vessel disease. Med Phys 43: , 6246. |
[28] | Osborn KE , Liu D , Samuels LR , Moore EE , Cambronero FE , Acosta LMY , Bell SP , Babicz MA , Gordon EA , Pechman KR , Davis LT , Gifford KA , Hohman TJ , Blennow K , Zetterberg H , Jefferson AL ((2018) ) Cerebrospinal fluid beta-amyloid42 and neurofilament light relate to white matter hyperintensities. Neurobiol Aging 68: , 18–25. |
[29] | Wei K , Tran T , Chu K , Borzage MT , Braskie MN , Harrington MG , King KS ((2019) ) White matter hypointensities and hyperintensities have equivalent correlations with age and CSF beta-amyloid in the nondemented elderly. Brain Behav 9: , e01457. |
[30] | Marnane M , Al-Jawadi OO , Mortazavi S , Pogorzelec KJ , Wang BW , Feldman HH , Hsiung GY ((2016) ) Periventricular hyperintensities are associated with elevated cerebral amyloid. Neurology 86: , 535–543. |
[31] | Walsh P , Sudre CH , Fiford CM , Ryan NS , Lashley T , Frost C , Barnes J ((2020) ) CSF amyloid is a consistent predictor of white matter hyperintensities across the disease course from aging to Alzheimer’s disease. Neurobiol Aging 91: , 5–14. |
[32] | Bos I , Vos SJB , Schindler SE , Hassenstab J , Xiong C , Grant E , Verhey F , Morris JC , Visser PJ , Fagan AM ((2019) ) Vascular risk factors are associated with longitudinal changes in cerebrospinal fluid tau markers and cognition in preclinical Alzheimer’s disease. Alzheimers Dement 15: , 1149–1159. |
[33] | Mendes T , Cardoso S , Guerreiro M , Maroco J , Silva D , Alves L , Schmand B , Gerardo B , Lima M , Santana I , de Mendonça A ((2019) ) Can subjective memory complaints identify Aβ positive and Aβ negative amnestic mild cognitive impairment patients? J Alzheimers Dis 70: , 1103–1111. |
[34] | Hampel H , Teipel SJ , Fuchsberger T , Andreasen N , Wiltfang J , Otto M , Shen Y , Dodel R , Du Y , Farlow M , Möller HJ , Blennow K , Buerger K ((2004) ) Value of CSF beta-amyloid1-42 and tau as predictors of Alzheimer’s disease in patients with mild cognitive impairment. Mol Psychiatry 9: , 705–710. |
[35] | Guzman VA , Carmichael OT , Schwarz C , Tosto G , Zimmerman ME , Brickman AM ((2013) ) White matter hyperintensities and amyloid are independently associated with entorhinal cortex volume among individuals with mild cognitive impairment. Alzheimers Dement 9: , 124–S124–131. |
[36] | Gold BT , Zhu Z , Brown CA , Andersen AH , LaDu MJ , Tai L , Jicha GA , Kryscio RJ , Estus S , Nelson PT , Scheff SW , Abner E , Schmitt FA , Van Eldik LJ , Smith CD ((2014) ) White matter integrity is associated with cerebrospinal fluid markers of Alzheimer’s disease in normal adults. Neurobiol Aging 35: , 2263–2271. |
[37] | Kester MI , Goos JD , Teunissen CE , Benedictus MR , Bouwman FH , Wattjes MP , Barkhof F , Scheltens P , van der Flier WM ((2014) ) Associations between cerebral small-vessel disease and Alzheimer disease pathology as measured by cerebrospinal fluid biomarkers. JAMA Neurol 71: , 855–862. |
[38] | Soldan A , Pettigrew C , Zhu Y , Wang MC , Moghekar A , Gottesman RF , Singh B , Martinez O , Fletcher E , DeCarli C , Albert M ((2020) ) White matter hyperintensities and CSF Alzheimer disease biomarkers in preclinical Alzheimer disease. Neurology 94: , e950–e960. |
[39] | Osborn KE , Alverio JM , Dumitrescu L , Pechman KR , Gifford KA , Hohman TJ , Blennow K , Zetterberg H , Jefferson AL ((2019) ) Adverse vascular risk relates to cerebrospinal fluid biomarker evidence of axonal injury in the presence of Alzheimer’s disease pathology. J Alzheimers Dis 71: , 281–290. |
[40] | Brickman AM ((2013) ) Contemplating Alzheimer’s disease and the contribution of white matter hyperintensities. Curr Neurol Neurosci Rep 13: , 415. |
[41] | Bjerke M , Portelius E , Minthon L , Wallin A , Anckarsater H , Anckarsater R , Andreasen N , Zetterberg H , Andreasson U , Blennow K ((2010) ) Confounding factors influencing amyloid Beta concentration in cerebrospinal fluid. Int J Alzheimers Dis 2010: , 986310. |
[42] | Zhou B , Teramukai S , Yoshimura K , Fukushima M ((2009) ) Validity of cerebrospinal fluid biomarkers as endpoints in early-phase clinical trials for Alzheimer’s disease. J Alzheimers Dis 18: , 89–102. |
[43] | Kester MI , Scheffer PG , Koel-Simmelink MJ , Twaalfhoven H , Verwey NA , Veerhuis R , Twisk JW , Bouwman FH , Blankenstein MA , Scheltens P , Teunissen C , van der Flier WM ((2012) ) Serial CSF sampling in Alzheimer’s disease: Specific versus non-specific markers. Neurobiol Aging 33: , 1591–1598. |


