
The Risk of Dementia in Relation to Cognitive and Brain Reserve
Abstract
Background:
Individual differences in the risk to develop dementia remain poorly understood. These differences may partly be explained through reserve, which is the ability to buffer cognitive decline due to neuropathology and age.
Objective:
To determine how much early and late–life cognitive reserve (CR) and brain reserve (BR) contribute to the risk of dementia.
Methods:
4,112 dementia-free participants (mean age = 66.3 years) from the Rotterdam Study were followed up for on average 6.0 years. Early-life CR and BR were defined as attained education and intracranial volume, respectively. Late-life CR was derived through variance decomposition based on cognition. Late-life BR was set as the total non-lesioned brain volume divided by intracranial volume.
Results:
Higher early-life CR (hazard ratio = 0.48, 95% CI = [0.21; 1.06]) but not early-life BR associated with a lower risk of incident dementia. Higher late-life CR (hazard ratio = 0.57, 95% CI = [0.48; 0.68]) and late-life BR (hazard ratio = 0.54, 95% CI = [0.43; 0.68]) also showed lower levels of dementia. Combining all proxies into one model attenuated the association between early-life CR and dementia (hazard ratio = 0.56, 95% CI = [0.25; 1.25]) whereas the other associations were unaffected. These findings were stable upon stratification for sex, age, and APOE ɛ4. Finally, high levels of late-life CR and BR provided additive protection against dementia.
Conclusion:
The findings illustrate the importance of late-life over early-life reserve in understanding the risk of dementia, and show the need to study CR and BR conjointly.
INTRODUCTION
Susceptibility to develop dementia varies greatly across individuals and is thought to be influenced by both early and late-life factors [1–10]. These factors shape the risk of dementia through a mechanism called reserve. Cognitive reserve (CR) buffers the effects of dementia-related pathology through cognitive flexibility or recruitment of alternative neural networks, while brain reserve (BR) buffers pathology through the structure of the brain [11, 12]. CR and BR are generally estimated through proxies. Educational attainment is the most commonly used proxy for the maximum attained CR throughout early-life [5, 6]. BR is commonly estimated through intracranial volume (ICV) as it a strong proxy for maximal brain volume early in life [11, 13]. However, reserve changes as people grow older, and these fluctuations cannot be captured with educational attainment and ICV. Recently, a method was proposed to quantify CR in late-life from cross-sectional data [14, 15]. It uses structural equation modeling based on demographics, accumulated white matter lesions as a measure of neuropathology and cognitive functioning. BR in late-life can be estimated through brain volume [11, 16].
Against this background, several knowledge gaps need to be addressed. First, both early-life and late-life proxies of reserve have been associated with onset of dementia. However, given that reserve builds up and diminishes with age, it remains unclear whether early-life or late-life reserve proxies are more relevant to study for the risk of developing dementia. Second, even though CR and BR are conceptually related, they have generally been studied in isolation. It is unclear whether they independently protect against dementia or if one effect is confounded by the other. Finally, most studies on CR and BR focused on patients with memory complaints, mild cognitive impairment or dementia at baseline [17]. The extent to which these associations hold for dementia-free individuals in the general population is unclear.
The present study aimed to elucidate the relative importance of early-life and late-life CR and BR in the risk of developing dementia. The study was performed as part of the Rotterdam Study, a population-based prospective cohort.
MATERIALS AND METHODS
Study population
The Rotterdam Study is a prospective population-based cohort in the Ommoord district of Rotterdam, the Netherlands [18]. The study started in 1989 with the RS-I cohort, and encompassed 7,983 participants aged 55 years and older. In 2000, the study was expanded with the RS-II cohort, which consisted of an additional 3,011 individuals aged 55 years and older. In 2006, the RS-III cohort started and included 3,932 participants aged 45 years and older. At study entry and subsequent follow-up visits, the participants partook in a home visit as well as one or several visits to a dedicated research center. MR neuroimaging was included into the core protocol from 2005 onwards. For the participants included in the current analysis, we used their first MRI exam between 2005 and 2014 as the baseline [19]. Cognitive tests closest to the MRI with respect to date of assessment were used.
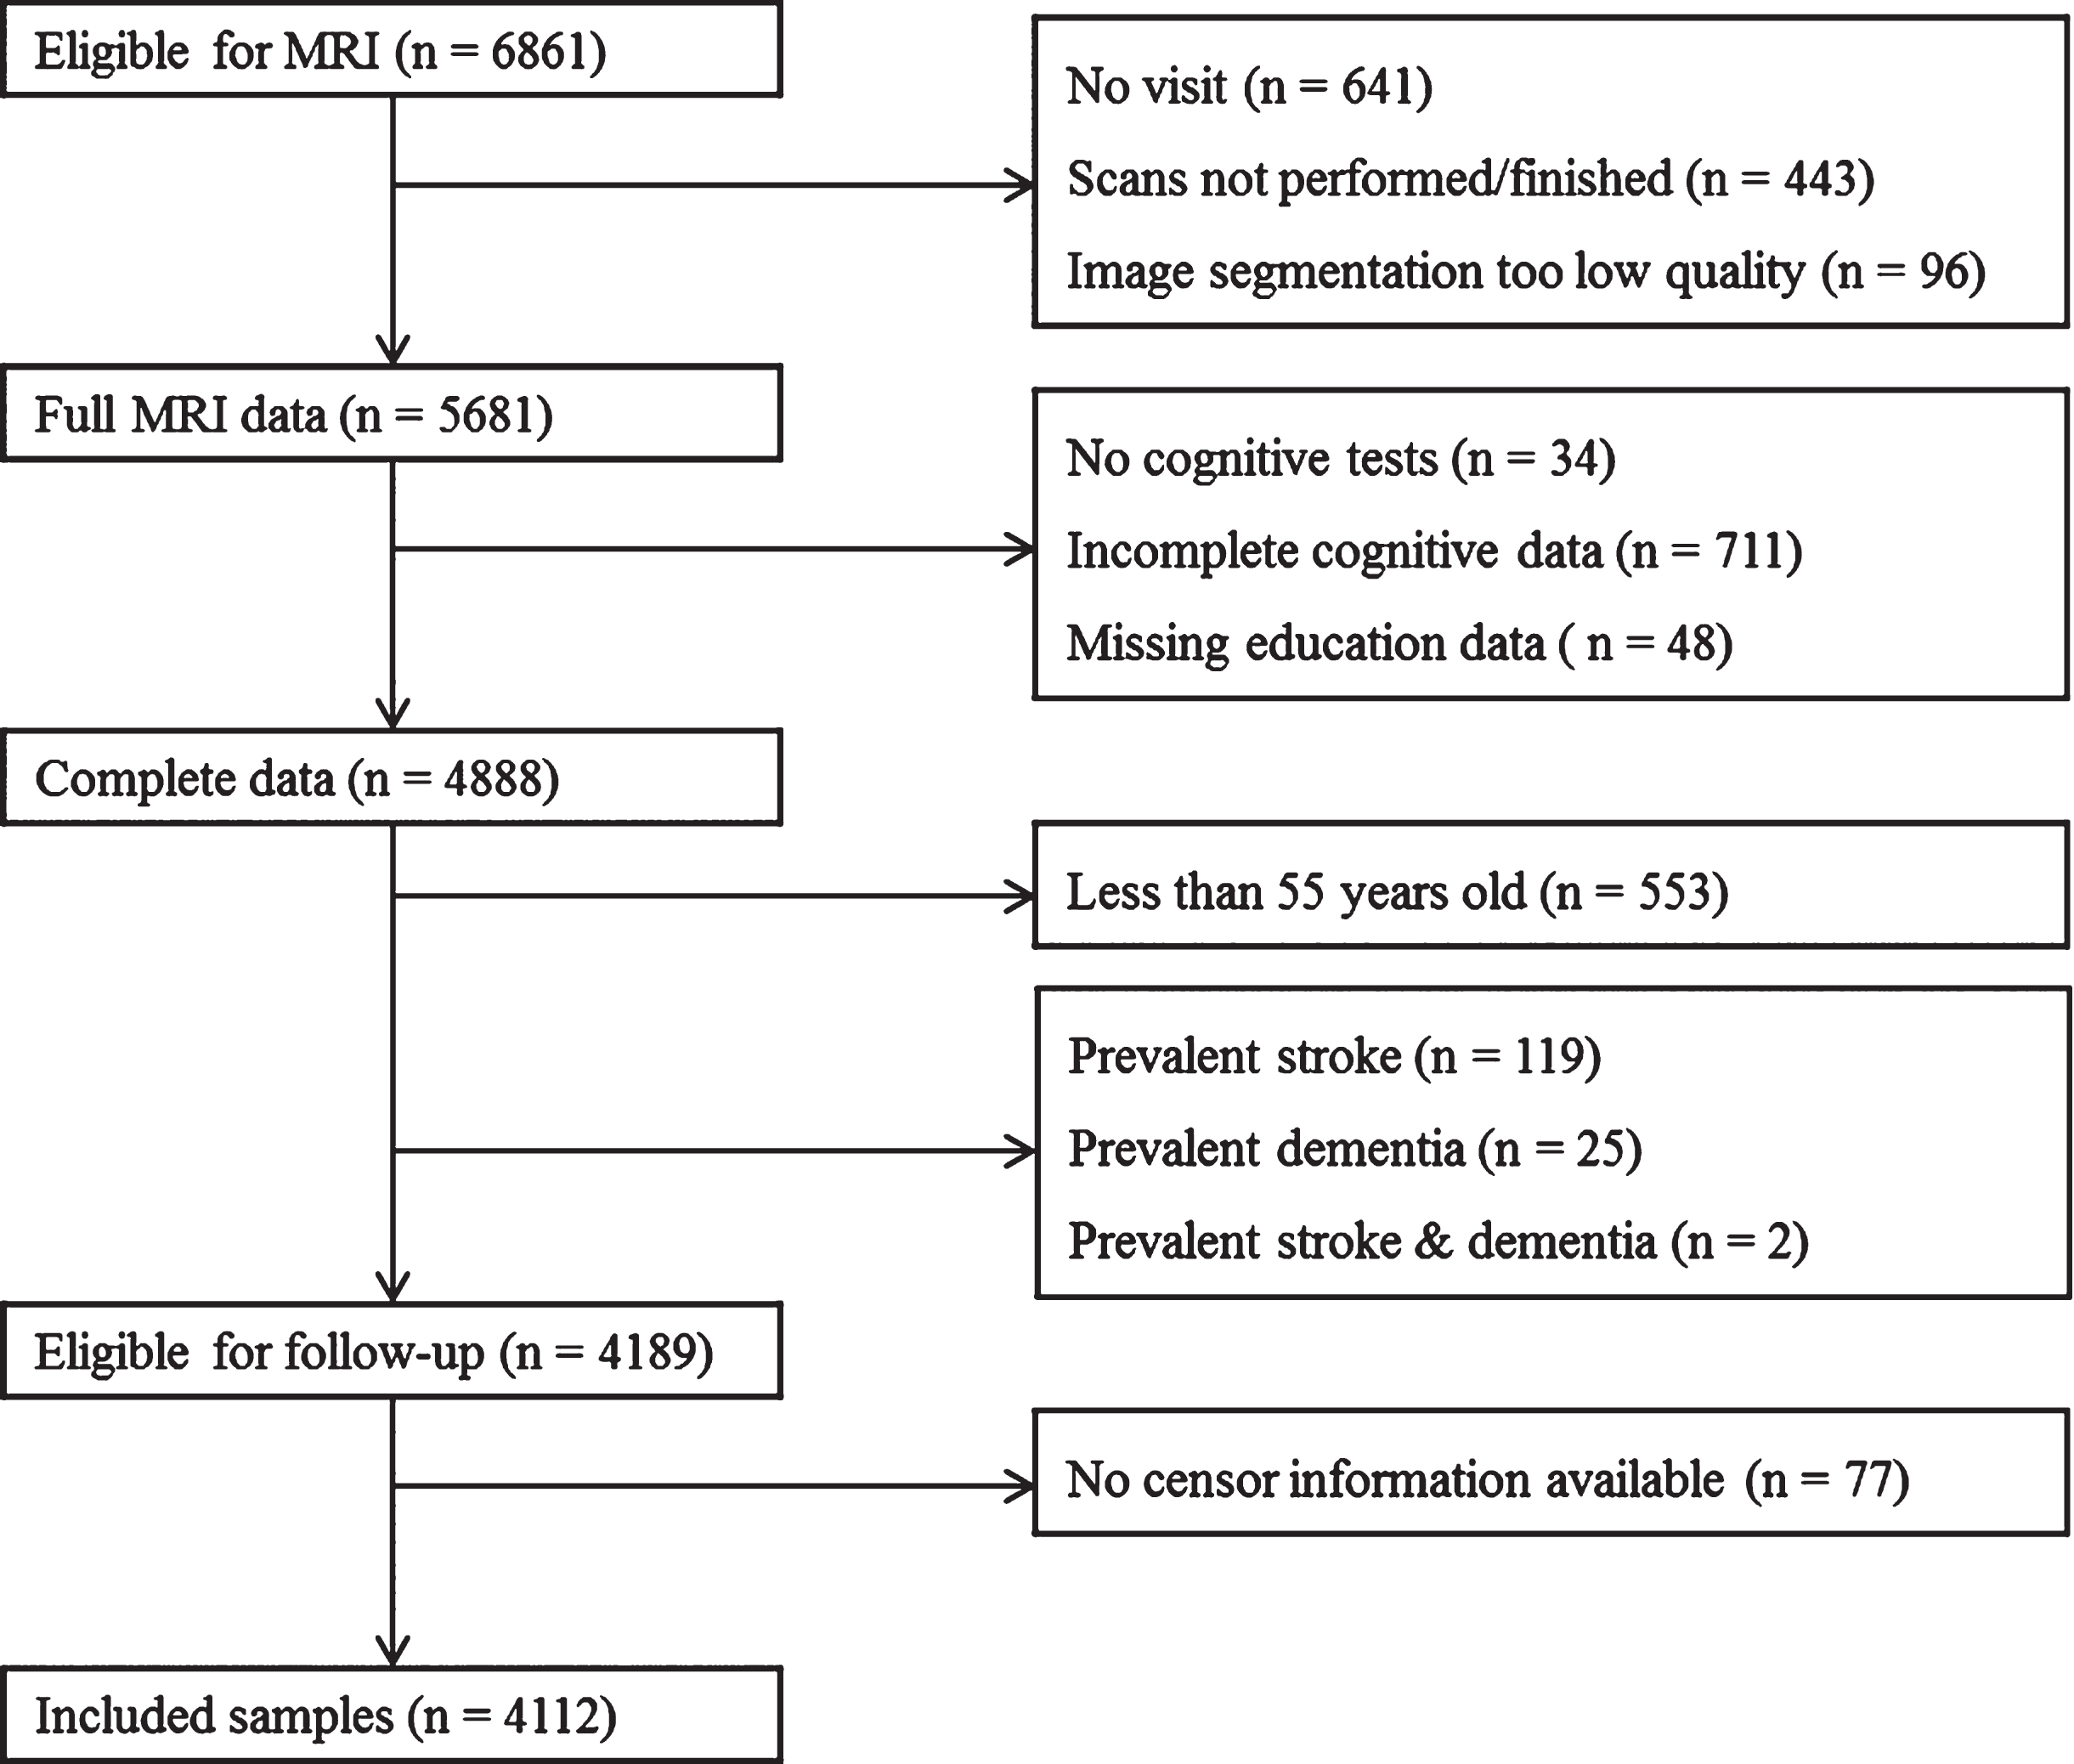
A flow chart of the inclusion process is presented in Fig. 1. A total of 4,888 participants had complete data on both the MRI and the cognitive test battery. We excluded all participants below the age of 55 years old (n = 553) as none of them developed dementia during follow-up. Furthermore, we excluded all individuals who were diagnosed with stroke (n = 119), dementia (n = 25), or both (n = 2) before follow-up started. Finally, participants were excluded if no information on follow-up was available (n = 77). The final sample used in the analyses included 4,112 participants.
Fig. 1
Flowchart of the selection process.
Standard protocol approvals, registrations, and patient consents
The Rotterdam Study has been approved by the Medical Ethics Committee of the Erasmus MC and by the Dutch Ministry of Health, Welfare and Sport (Population Screening Act WBO, license number 1071272-159521-PG). All participants provided written informed consent to participate in the study and to have their information obtained from their treating physicians.
Operationalization of reserve
The primary aim of this study was to investigate the role of early-life and late-life reserve in the incidence of dementia. As participants were included during middle and late adulthood, proxies were used for early-life CR and BR. Educational attainment was used as a proxy for early-life CR and ICV as a proxy for early-life BR. Late-life CR was estimated using a structural equation model similar to the model used in the study by Petkus and colleagues [15]. For late-life BR, measurements were chosen that closely related to early-life BR, i.e., ICV. Hence, late-life BR was defined as the proportion of MRI-based normal appearing brain tissue. Non-lesioned brain volume is conceptually close to ICV as a proxy for early-life BR, as both describe the total neural capacity. Late-life BR was calculated according to the equation: [total brain volume –white matter lesion volume]/ICV. The white matter lesion volume was removed from the total brain volume as BR denotes the neural capacity to buffer neuropathology, and white matter lesions are a type of neuropathology and should thus not be counted toward BR. The metric was divided by ICV for two reasons. First, this proportional metric has been shown to have a stronger association with dementia than brain volume by itself [20]. Second, the strong correlation between brain volume and ICV (Pearson’s r = 0.90) introduced unwanted multicollinearity in the models that contained both ICV and late-life BR.
Educational attainment and cognitive function
Education level was assessed at baseline and classified into four categories according to the UNESCO classification. The levels used were primary education (“primary”), lower/intermediate general education or lower vocational education (“low”), intermediate vocational education or higher education (“intermediate”), and higher vocational education or university (“high”). Primary education was used as the reference class. This was because previous studies have indicated that educational attainment particularly reduces the risk of incident dementia at lower levels of educational attainment [21].
To assess cognitive function all participants underwent a cognitive test battery. The protocol has been described elsewhere [22]. In brief, the battery consisted of a 15-word verbal learning test [23], the Stroop test [24], the letter-digit substitution test [25], a verbal fluency task [26], and the Purdue pegboard Test [27].
Late-life CR
Late-life CR was estimated using a structural equation model (Fig. 2), which was based on a previous study [15]. In brief, CR can be described as the level of cognitive function when considering the degree of neuropathology and age-related decline. The structural equation model therefore defined late-life CR as a latent variable that is calculated by controlling the cognitive scores for demographic factors and brain-related factors including neuropathology. This approach is known as variance decomposition and has been validated as an appropriate method to assess late-life CR [14, 15, 28].
Fig. 2
Structural equation to estimate late-life cognitive reserve. Comparative Fit Index = 0.991; Tucker-Lewis Index = 0.965; root mean square error of approximation = 0.050 [95% CI = 0.043; 0.056].
![Structural equation to estimate late-life cognitive reserve. Comparative Fit Index = 0.991; Tucker-Lewis Index = 0.965; root mean square error of approximation = 0.050 [95% CI = 0.043; 0.056].](https://content.iospress.com:443/media/jad/2020/77-2/jad-77-2-jad200264/jad-77-jad200264-g002.jpg)
The full model was designed as follows. Scores were obtained for the five cognitive tests and for each we regressed out the effects of age, sex, educational attainment, the natural log of the white matter lesion volume, and the volume of normal appearing brain matter. Normal appearing brain matter and the log of the white matter lesions were adjusted for intracranial volume, age, sex, and educational attainment. Late-life CR was defined as a latent variable on which all cognitive test scores loaded. Thus, CR was the difference between the actual cognitive functioning and the predicted level of cognition based on demographic factors and brain structure. The distribution of the Stroop test times had a strong positive skew, which led to violation of the normality assumption of the residuals in the structural equation model. This was amended by log transforming the Stroop test time distribution. The model fit was evaluated using the comparative fit index (CFI) >0.95, the Tucker Lewis Index (TLI) >0.95 and the root-mean-squared error of approximation (RMSEA) <0.06, in accordance with commonly used criteria [29].
Assessment of intracranial volume and brain volume
Neuroimaging was performed on a 1.5 Tesla MRI scanner with an eight-channel head coil (GE Signa Excite, General Electric Healthcare, Milwaukee, USA). The imaging sequence and processing details have been described extensively elsewhere [19]. In brief, images from three sequences were utilized, i.e., a T1-weighted sequence, a proton density-weighted sequence, and a fluid-attenuated inversion recovery (FLAIR) sequence.
The images were segmented into grey matter, cerebrospinal fluid, and white matter using an automated processing algorithm based on a k-nearest-neighbor classifier, which has been described previously [30]. In brief, the classifier automatically registers six manually segmented atlases non-rigidly to the images. By considering the k nearest voxels, voxel-wise tissue class probabilities can be calculated, which are then used to classify the voxel to a tissue type. All segmentations were visually inspected and corrections were applied where necessary. Total brain volume was estimated by summing total gray and white matter volumes. ICV was calculated as the sum of the total brain volume and the cerebrospinal fluid volume.
White matter lesions were quantified through an automated method [31]. In brief, white matter lesions are typically detected on FLAIR images as hyperintense regions in the white matter. The automated method utilized the gray matter classification to determine the optimal intensity threshold for the white matter lesions on the FLAIR images, thus enabling automated segmentation [31].
Assessment of incident dementia
Participants were screened for dementia at study entry and subsequent center visits with the Mini-Mental State Examination [32] and the Geriatric Mental Schedule organic level [33]. Those with a Mini-Mental State Examination score below 26 or Geriatric Mental Schedule score above 0 underwent a physician interview and additional testing using the Cambridge examination for mental disorders in the elderly (CAMDEX) [34]. In addition, the entire cohort was continuously under surveillance for dementia through electronic linkage of the study database with medical records from general practitioners and the regional institute for outpatient mental health care. Study physicians biannually evaluate all records, and combine information from medical records with in-person screening to draw up individual case reports. In these reports, the physicians covered all gathered relevant information to establish the presence, probability and subtype of dementia. A consensus panel led by a consultant neurologist established the final diagnosis according to standard criteria for dementia using the revised third edition of the Diagnostic and Statistical Manual of Mental Disorders version III (DSM-III-R) [35].
Stroke
Participants were excluded if they had prevalent stroke, i.e., if they were diagnosed with stroke before the start of follow-up (see “Study Population”). The stroke ascertainment has been described previously [36]. In brief, during the baseline interview participants were asked whether they had suffered a stroke, as diagnosed by a physician. These answers were then verified through medical records. After the baseline interview, participants were continuously monitored for the occurrence of events through automatic linkage with the files of the general practitioners. If an event occurred, a consensus panel would consider the event based on information from the general practitioner and hospital discharge records if available. The event was defined as a probable stroke if typical clinical symptoms were present but no clinical information on neuroimaging was available. MRI scans obtained as part of the Rotterdam Study were not used in the consensus panel to maintain consistency of ascertainment among those that did and did not participate in the MRI scanning. For the current paper, all participants with definite or probable stroke before the start of follow-up were excluded.
Covariates
Hypertension was defined as a resting blood pressure exceeding 140/90 mmHg or the use of blood pressure lowering medication. Blood pressure was measured twice with a sphygmomanometer after 5 minutes of rest, and the mean was taken as the participant’s reading. Use of blood pressure lowering medication was derived from information collected at the home interview. Alcohol use was assessed during the home interview, and assessed consumption of beer, wine, liquor, and other alcohol types. To define the total alcohol intake, the number of each beverage consumed was converted to alcohol intake in grams per day and then summed up. The algorithm to calculate alcohol in grams per day is described elsewhere [37]. Smoking status was obtained during home interviews and defined as never, former, and current. Body mass index (BMI) was calculating using the height and weight obtained with calibrated scales during the research center visit. The number of APOE ɛ4 alleles was determined by DNA sequencing procedures which have been described elsewhere [38].
Statistical analysis
The primary aim of the study was to examine the associations of early-life and late-life CR and BR with the risk of developing dementia. To do so, Cox regression models were constructed. The beginning of follow-up time was defined as the moment of completion of the cognitive measures or the MRI visit, whichever occurred last. The censor date was based on the date of dementia diagnosis, date of loss to follow-up, date of death, or January 1, 2016, whichever came first. All analyses were performed with age as the time scale. All reserve proxies but educational attainment were standardized.
To adjust for potential confounding, the models included the following covariates: Cohort (RS-I, RS-II or RS-III), sex, age difference between cognitive testing and MRI scan (years), hypertension (yes/no), alcohol intake (g/day), smoking status (never/past/current), BMI (kg/m2), and APOE ɛ4 allele count. Given the strong correlation between ICV and body height, body height was also considered as a confounder. However, adjusting for body height may lead to overadjustment and thus an underestimation of the association between ICV and the incidence of dementia [13]. Furthermore, the results were unattenuated when body height was included as a covariate (data not shown). Therefore, only the findings from the models that were not adjusted for body height were reported.
To study the relative contribution of all factors in the incidence of dementia, three different types of Cox regression models were constructed. In Model 1, to examine the effect of each proxy in isolation, each reserve proxy was examined in a separate Cox regression model:
• Early-life CR:
• Early-life BR:
• Late-life CR:
• Late-life BR:
where
• CR:
• BR:
In Model 3, all four reserve proxies were combined into a single model to see whether CR and BR exert independent effects on the risk of dementia:
For each model, the hazard ratios, 95% confidence intervals (95% CI) and p-values are reported.
To see how CR and BR interact in their protective effects, two new models were created: one containing early-life CR and BR, and one containing late-life CR and BR. In both models, both variables were dichotomized along their mean values and created four groups of individuals based on their levels of CR and BR. We consequently looked at whether these groups differed in their risk of dementia.
To see how stable the findings were, the analyses were stratified by for sex, age at baseline (below or equal and above 77 years of age) and APOE ɛ4 carriership to see how stable the associations were. Missing data were imputed twenty times using chained equations and the estimates from the models were pooled subsequently [39–41]. All statistical analyses were performed in R 3.4.2 using the ‘survival’ package [42, 43]. The structural equation model was built with the ‘lavaan’ package [44].
Data availability statement
The datasets for this manuscript are not automatically publicly available due to legal and informed consent restrictions. Reasonable requests to access the datasets should be directed to the management team of the Rotterdam Study (), which has a protocol for approving data requests.
RESULTS
Table 1 shows the baseline characteristics of the 4,112 participants. The mean age at baseline was 66.3 years (standard deviation = 8.7), and 2,278 (55.4%) were women. The median duration between the cognitive testing and the MRI scanning was 0.13 years (interquartile range: 0.26; from 0.08 to 0.34). Most participants achieved low to intermediate education (primary = 8.1%, low = 39.3%, intermediate = 29.5%, high = 23.1%). The mean ICV was 1,139.4 cm3 (standard deviation = 115.9 cm3). Both late-life CR and BR were standardized and had a mean of 0 (standard deviation = 1). The structural equation for late-life CR had a satisfactory fit (CFI = 0.991, TLI = 0.965, RMSEA = 0.050 [95% CI = 0.043; 0.056]).
Table 1
Baseline characteristics of the study population (N = 4,112)
| Characteristics | M±SD |
| N (%) | |
| RS cohort | |
| RS-I | 806 (19.6%) |
| RS-II | 1,134 (27.6%) |
| RS-III | 2,172 (52.8%) |
| Sex, female | 2,278 (55.4%) |
| Age at start of follow-up in years | 66.3±8.7 |
| Years difference between cognitive testing and MRI scan (median; IQR) | 0.13±0.26 |
| Hypertension, yesa | 2,696 (65.7%) |
| Alcohol in g/daya | 9.7±10.6 |
| Smoking statusa | |
| Never | 1,277 (31.2%) |
| Past | 2,096 (51.1%) |
| Current | 722 (17.6%) |
| Body mass index in kg/m2a | 27.4±4.1 |
| APOE ɛ4 number of allelesa | |
| 0 | 2,850 (71.3%) |
| 1 | 1,053 (26.4%) |
| 2 | 92 (2.3%) |
| Education level | |
| Primary | 333 (8.1%) |
| Low | 1,617 (39.3%) |
| Medium | 1,215 (29.5%) |
| High | 947 (23.0%) |
| ICV in cm3 | 1,139.4±115.9 |
| Late-life BR ((BV –WMHV) / ICV) | 0.82±0.04 |
RS, Rotterdam Study; ICV, intracranial volume; BV, brain volume; WMHV, white matter hyperintensity volume; IQR, interquartile range. aMissingness was present in the variables hypertension (0.2%), alcohol intake (6.3%), smoking status (0.4%), body mass index (0.2%) and APOE ɛ4 allele count (2.8%).
Incidence of dementia and separate models of the reserve proxies
During 24,631 person-years of follow-up (mean follow-up time = 6.0 years, SD = 2.8), a total of 110 participants developed dementia. As expected, the incidence rate increased with age (0.09% at 70 years, 0.80% at 80 years and 3.91% at 90 years).
Table 2 shows the results of the Cox regressions for the risk of dementia associated with each reserve proxy. In Model 1, compared to those with only a primary education, the risk of dementia was lower in those with low education (hazard ratio (HR) = 0.68 [95% CI = 0.38; 1.24], p = 0.20), intermediate education (HR = 0.59 [0.31; 1.12], p = 0.11), and high education (HR = 0.48 [0.21; 1.06], p = 0.07), although none of these associations reached statistical significance. Similarly, higher ICV associated with a reduced risk of dementia (HR = 0.94 [0.74; 1.19], p = 0.62), but this also did not reach statistical significance. Both late-life CR (HR = 0.57 [0.48; 0.68], p < 0.0001) and late-life BR (HR = 0.54 [0.43; 0.68], p < 0.0001) associated with a lower risk of dementia.
Table 2
Hazard ratios of incident dementia related to early and late-life proxies of reserve
| Life phase | Domain | Measure | Model 1a | Model 2b | Model 3c |
| HR (95% CI) | HR (95% CI) | HR (95% CI) | |||
| Early-life | CR | Education | |||
| Primary | (reference) | (reference) | (reference) | ||
| Low | 0.68 (0.38; 1.24) | 0.77 (0.42; 1.39) | 0.82 (0.45; 1.49) | ||
| Intermediate | 0.59 (0.31; 1.12) | 0.73 (0.38; 1.40) | 0.80 (0.41; 1.56) | ||
| High | 0.48 (0.21; 1.06) | 0.56 (0.25; 1.25) | 0.56 (0.24; 1.28) | ||
| Early-life | BR | ICV, per SD | 0.94 (0.74; 1.19) | 0.85 (0.67; 1.07) | 0.89 (0.70; 1.12) |
| Late-life | CR | Predicted CR, per SD | 0.57 (0.48; 0.68) | 0.58 (0.48; 0.68) | 0.62 (0.52; 0.74) |
| Late-life | BR | Proportion of healthy brain tissue, per SD | 0.54 (0.43; 0.68) | 0.52 (0.41; 0.66) | 0.59 (0.46; 0.75) |
A total of 110 events occurred during a mean follow-up time of 6.0 years (SD: 2.8). ICV, late-life CR and late-life BR were standardized. Included covariates were cohort, sex, age difference between cognitive testing and MRI scan (years), hypertension (yes/no), alcohol intake (g/day), smoking status (never/past/current), BMI (kg/m2), and APOE ɛ4 allele count. HR, hazard ratio; CR, cognitive reserve; BR, brain reserve; ICV, intracranial volume. aSeparate models for each of the four proxies. bSeparate models for the CR proxies and the BR proxies. cCombination of all four proxies into a single model.
Incidence of dementia and combined models of the reserve proxies
In Model 2, the CR proxies were combined into one model and the BR proxies into another model. The effect for educational attainment was attenuated (HRprimary - vs - low = 0.77 [0.42; 1.39], p = 0.38; HRprimary - vs - intermediate = 0.73 [0.38; 1.40], p = 0.34; HRprimary - vs - high = 0.56 [0.25; 1.25], p = 0.15), whereas late-life CR remained strongly associated with a lower risk of dementia (HR = 0.58 [0.48; 0.68], p < 0.0001). The combined model for the BR proxies did not change the results compared to the separate models. In Model 3, all proxies were combined into a single model. The results of Model 2 and Model 3 were very similar, with both late-life CR (HR = 0.62 [0.52; 0.74], p < 0.0001) and late-life BR (HR = 0.59 [0.46; 0.75], p < 0.0001) associating with a lower risk of dementia.
Interaction between CR and BR
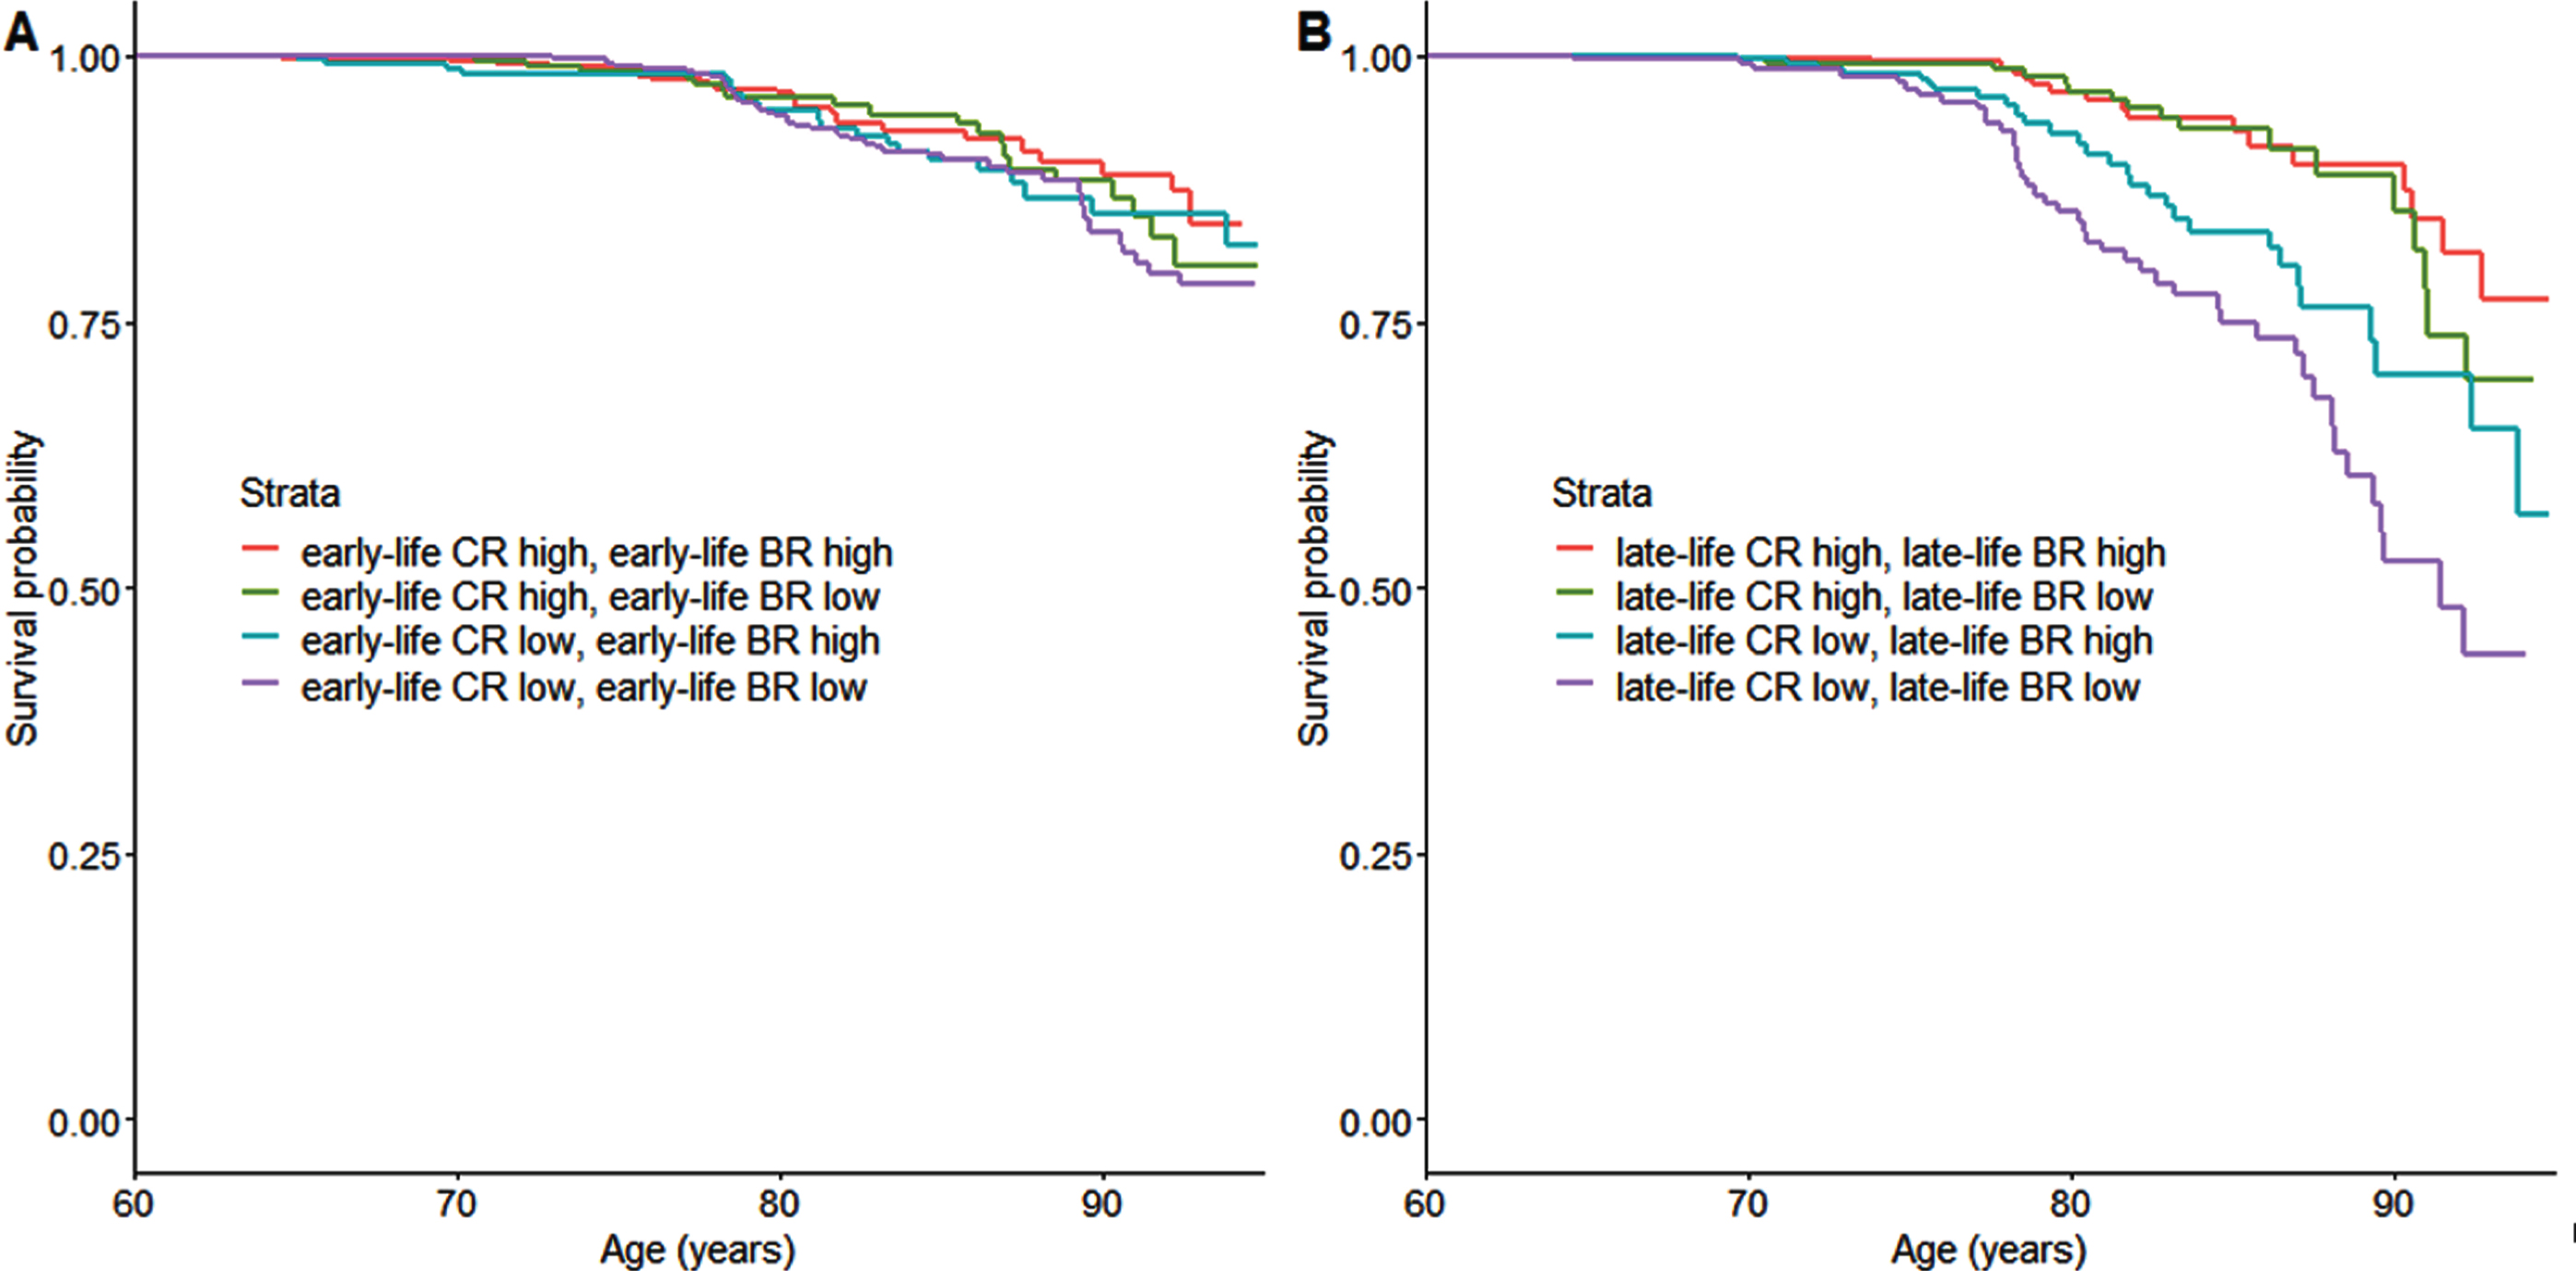
Participants were divided into four groups: high CR with high BR, high CR with low BR, low CR with high BR, and low CR with low BR. This was done for both early-life and late-life reserve proxies separately. The survival curves for each early-life group are shown in Fig. 3A, and for each late-life group in Fig. 3B. No statistically significant differences were found between the early-life groups (all p > 0.05). In contrast, differences between the groups were present in the late-life proxies. Compared to the high CR high BR group, the high CR low BR group did not differ in incidence of dementia (HR = 1.14 [0.58; 2.25], p = 0.70), whereas both the low CR with high BR group (HR = 2.24 [1.21; 4.13], p = 0.01) and the low CR with low CR group (HR = 3.93 [2.24; 6.87], p < 0.0001) had higher rates of dementia.
Fig. 3
Dementia survival curves for the low and high CR and BR strata. Panel A displays the curves for early-life reserve, and Panel B for late-life reserve. The variables were dichotomized along the mean. CR, cognitive reserve; BR, brain reserve.
Sensitivity analyses
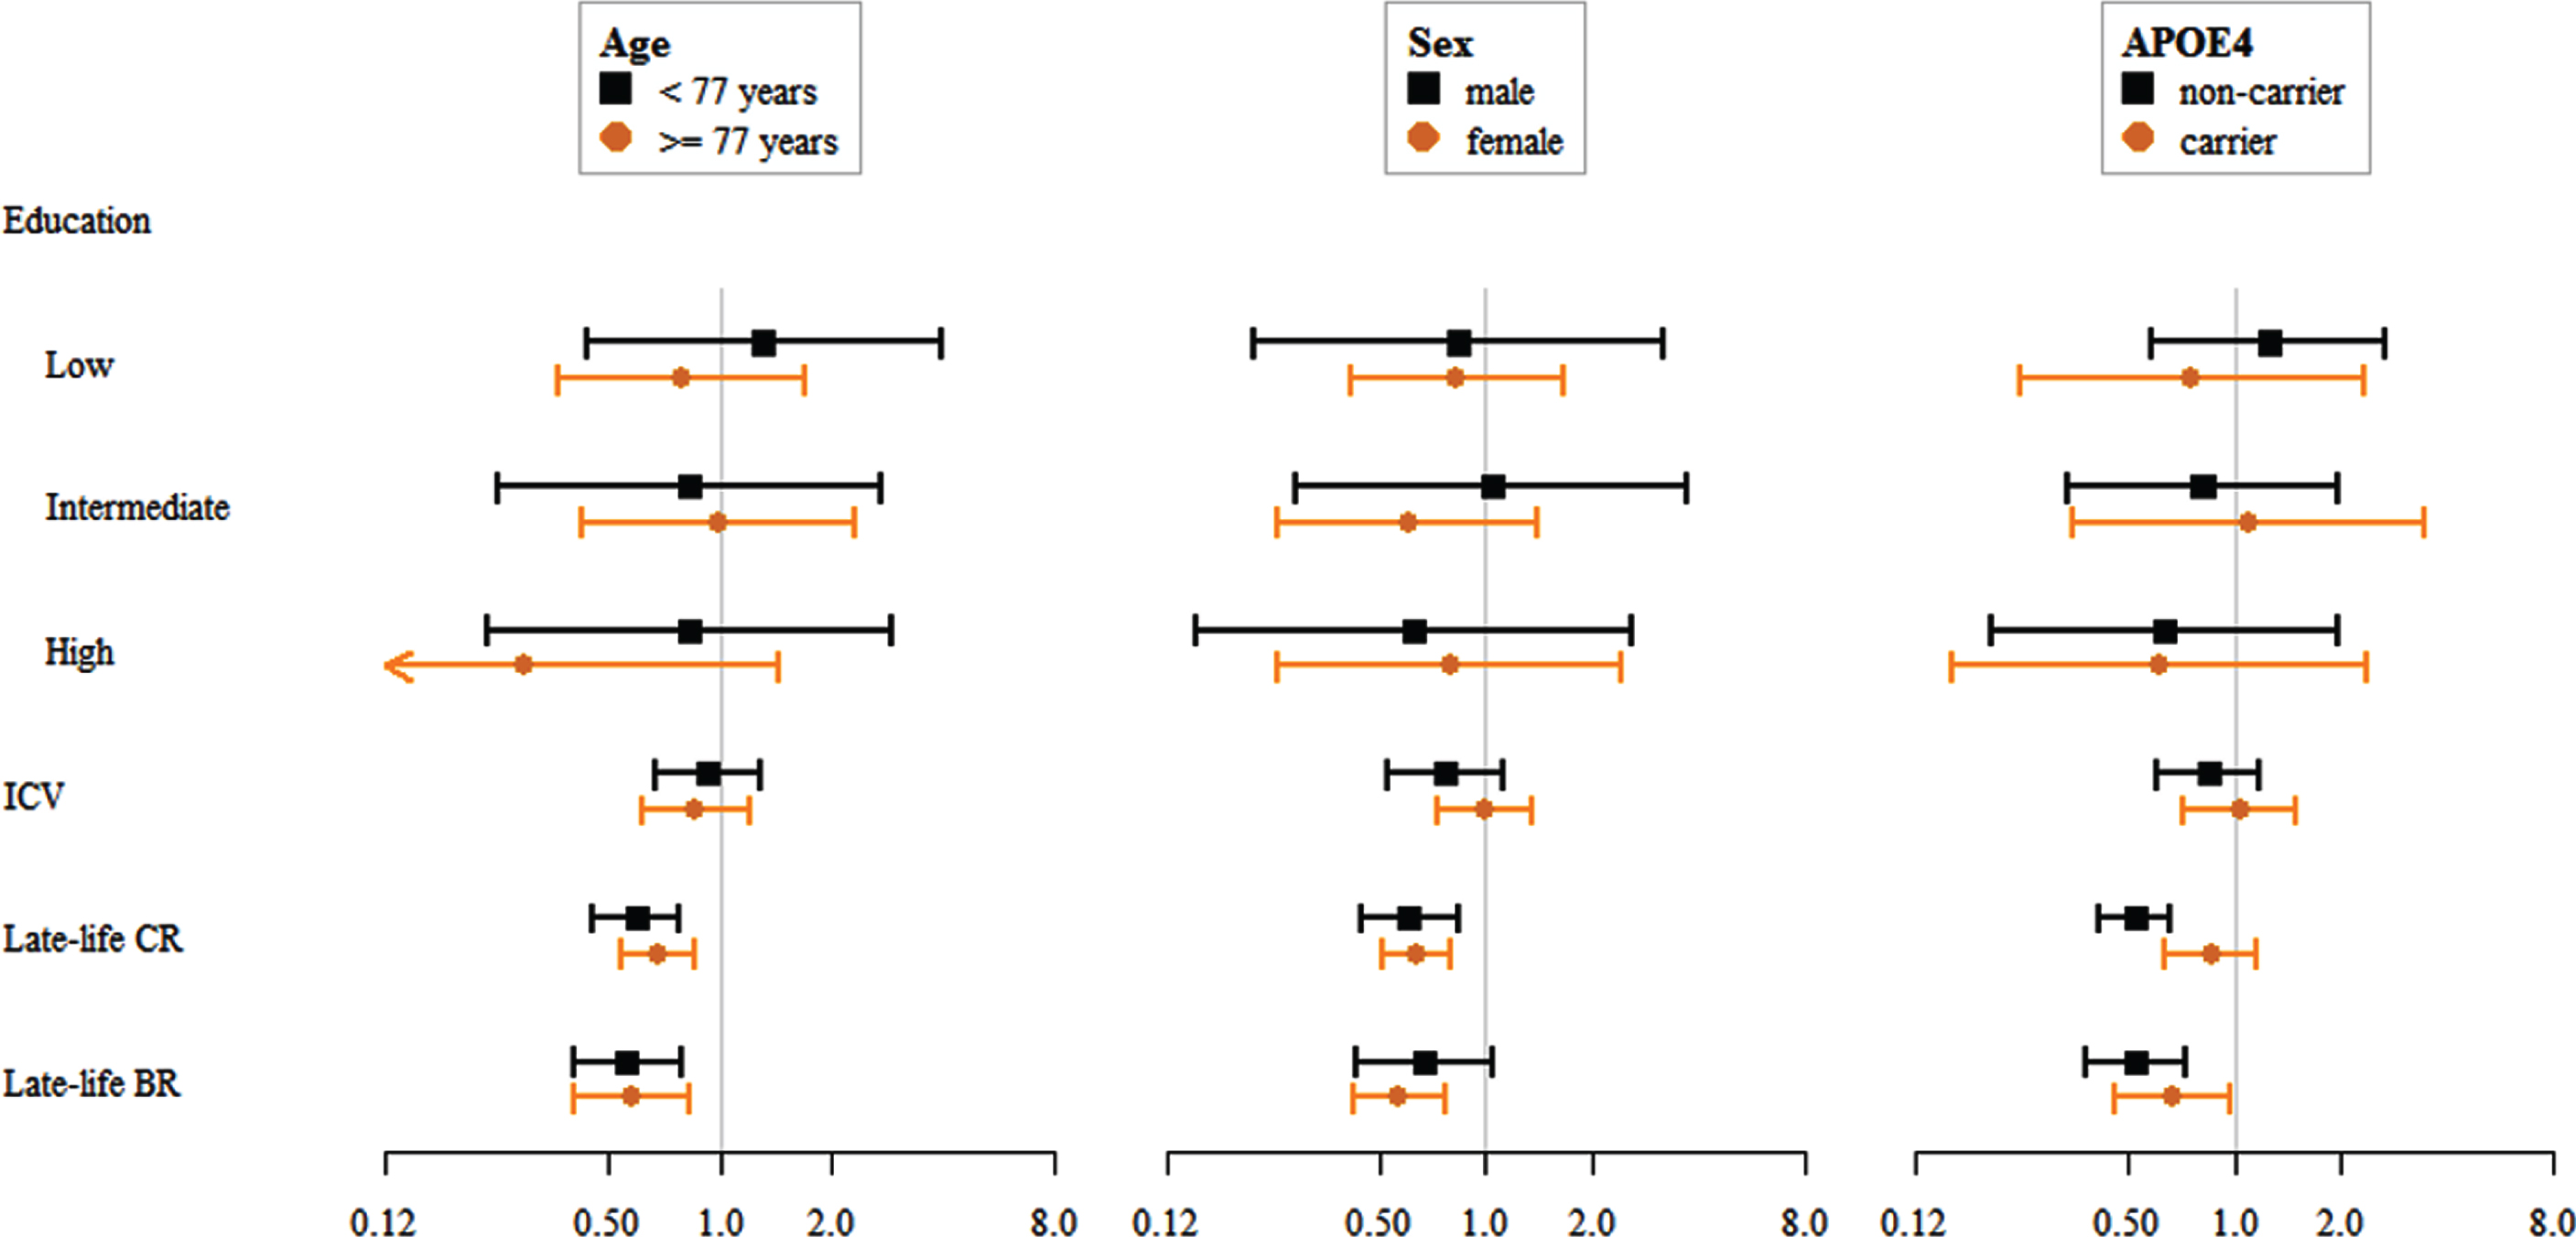
Within model 3, the effect of stratification on age, sex, and APOE ɛ4 carriership was further assessed. All HRs for these sensitivity analyses are displayed in Fig. 4. The proxies for reserve did not show statistically significant differences in their associations with incident dementia for those aged below 77 years old versus those 77 years and older (all p > 0.05). Moreover, no differences were found when comparing the associations in men and women (all p > 0.05). For APOE ɛ4 carriership we found that carriers showed a weaker association between the late-life CR and incidence of dementia (HR = 0.86 [0.63; 1.16], p = 0.32) than non-carriers (HR = 0.52 [0.41; 0.66], p < 0.0001), although in the same direction.
Fig. 4
Hazard ratios for incident dementia and their 95% CIs, stratified for age, sex, and APOE ɛ4 carriership.
DISCUSSION
Late-life constructs of reserve—both CR and BR—related more strongly to incidence of dementia than early-life constructs. Furthermore, while early-life CR reduced the risk of dementia, this effect was attenuated when considering late-life CR simultaneously. Finally, late-life CR and late-life BR protected both independently and interactively against the incidence of dementia.
Previous literature on reserve has mostly focused on proxies that are relatively constant throughout life, such as educational attainment and ICV [11, 13]. Educational attainment has been extensively studied in both patients and dementia-free populations, and it is an integral part of most theories related to resilience towards dementia. For example, higher levels of education could lead to healthier lifestyle choices and therefore better cardiovascular and brain health [45]. Still, in a systematic review of 88 population-based studies only 51 studies found a statistically significant association between education and the prevalence or incidence of dementia [21]. Our findings also showed a protective effect of education on dementia, but the association did not reach statistical significance. The practical utility of educational attainment as a proxy for CR should therefore be examined more critically, especially considering the existence of latent variable methods to estimate CR from a wider range of variables.
The comparison between reserve proxies from different life phases has been studied previously [5, 6]. One study analyzed data from 7,574 individuals on primary school grades, educational attainment, and occupational complexity [6]. The analyses showed that high levels of these factors independently lowered the risk of dementia to a comparable degree. These findings were extended by a similar study in 602 participants of the Kungsholmen Project, a prospective longitudinal cohort [5]. Late-life CR was defined as a latent variable based on physical, social, and mental activity during late life. They found that early-life, mid-life, and late-life CR related to the incidence of dementia. More importantly, when all CR measures were combined into a single model the early-life and mid-life CR effects were attenuated. The present study extended these findings by using a more direct measure of late-life CR, i.e., structural equation modeling that incorporates sociodemographic and brain factors.
A recent meta-analysis showed that a larger ICV tends to correlate with better cognitive function after adjusting for pathology [13]. Several other studies have suggested that individuals with a larger ICV show slower rates of cognitive decline [46, 47]. Still, ICV does not seem to differ between dementia patients and healthy controls [48–51]. The present study also did not yield support for a link between ICV and dementia. Rather, we found that late-life BR, which was defined as the amount of healthy brain tissue, protects against incident dementia with a comparable effect as late-life CR. Moreover, the effects for CR and BR seemed to be additive, where higher levels of reserve in either decreased the risk for dementia. These findings emphasize the need to reconsider the role of ICV as the most appropriate proxy for BR [13], especially when more dynamic measures likely have greater clinical relevance.
The present study had several limitations. First, education and ICV are commonly used proxies for early-life CR and BR, but they arguably do not reflect early-life reserve accurately. For example, educational attainment is strongly influenced by sociodemographic and cultural factors. During the 1950s and 1960s, women did not necessarily have equal access to education as men did [52], regardless of their cognitive and academic functioning, which may compromise the value of education as a CR proxy. A second limitation of the study is the limited number of cases within the study. While the Rotterdam Study included 1,741 incident dementia cases by the end of 2016, most of these occurred before brain MRI scanning was introduced into the Rotterdam Study. A third limitation is that no information was available on earlier phases of cognitive decline, such as mild cognitive impairment. Reserve likely plays a role during those phases too, and the effects of BR and CR may differ from those observed in this study. Finally, the ascertainment of dementia relied on the DSM-III-R criteria rather than newer guidelines such as those proposed by the NIA-AA [53]. The reason for relying on the DSM-III-R criteria is because they have been in place since the beginning of the Rotterdam Study in 1989. By maintaining the same standards and using the same screening tools over the last 30 years, the Rotterdam Study data have been instrumental in understanding how the incidence of dementia develops over time. However, this does mean that the findings should be interpreted in the context of the DSM-III-R criteria.
The study also had several strengths. The dementia ascertainment procedures were extensive, with continuous screening of medical records and follow-up based on research center results. In addition, loss to follow-up was low in participants who partook in both cognitive testing and the brain MRI scan. The number of missed dementia cases was therefore likely low. Finally, we were able to correct for a wide range of factors that may have confounded the associations.
Conclusion
Late-life reserve proxies are relatively more important than early-life reserve proxies in the incidence of dementia. Additionally, late-life CR and late-life BR have independent and additive protective effects against incidence of dementia. This study emphasizes the need to consider CR and BR simultaneously to further elucidate the etiology of dementia.
ACKNOWLEDGMENTS
The authors are grateful to the study participants, the staff of the Rotterdam Study, and the participating general practitioners and pharmacists.
This project has received funding from the European Research Council (ERC) under the European Union’s Horizon 2020 research and innovation programme (project: ORACLE, grant agreement No: 678543). Dr. M. A. Ikram received further support from Alzheimer Nederland and ZonMW (projectnumber 733051082) for the SHARED project as part of the EU JPsustaiND programme. The Rotterdam Study is funded by Erasmus Medical Center and Erasmus University, Rotterdam, Netherlands Organization for the Health Research and Development (ZonMw), the Research Institute for Diseases in the Elderly (RIDE), the Ministry of Education, Culture and Science, the Ministry for Health, Welfare and Sports, the European Commission (DG XII), and the Municipality of Rotterdam.
Authors’ disclosures available online (http://www.j-alz.com/manuscript-disclosures/20-0264r2).
REFERENCES
[1] | Peters R , Booth A , Rockwood K , Peters J , D’Este C , Anstey KJ ((2019) ) Combining modifiable risk factors and risk of dementia: A systematic review and meta-analysis. BMJ Open 9: , e022846. |
[2] | Najar J , Ostling S , Gudmundsson P , Sundh V , Johansson L , Kern S , Guo X , Hallstrom T , Skoog I ((2019) ) Cognitive and physical activity and dementia: A 44-year longitudinal population study of women. Neurology 92: , e1322–e1330. |
[3] | Vemuri P , Lesnick TG , Przybelski SA , Machulda M , Knopman DS , Mielke MM , Roberts RO , Geda YE , Rocca WA , Petersen RC , Jack CR Jr ((2014) ) Association of lifetime intellectual enrichment with cognitive decline in the older population. JAMA Neurol 71: , 1017–1024. |
[4] | Borenstein AR , Copenhaver CI , Mortimer JA ((2006) ) Early-life risk factors for Alzheimer disease. Alzheimer Dis Assoc Disord 20: , 63–72. |
[5] | Wang HX , MacDonald SW , Dekhtyar S , Fratiglioni L ((2017) ) Association of lifelong exposure to cognitive reserve-enhancing factors with dementia risk: A community-based cohort study. PLoS Med 14: , e1002251. |
[6] | Dekhtyar S , Wang HX , Scott K , Goodman A , Koupil I , Herlitz A ((2015) ) A life-course study of cognitive reserve in dementia–from childhood to old age. Am J Geriatr Psychiatry 23: , 885–896. |
[7] | Whalley LJ , Starr JM , Athawes R , Hunter D , Pattie A , Deary IJ ((2000) ) Childhood mental ability and dementia. Neurology 55: , 1455–1459. |
[8] | Stern Y , Gurland B , Tatemichi TK , Tang MX , Wilder D , Mayeux R ((1994) ) Influence of education and occupation on the incidence of Alzheimer’s disease. JAMA 271: , 1004–1010. |
[9] | Meng X , D’Arcy C ((2012) ) Education and dementia in the context of the cognitive reserve hypothesis: A systematic review with meta-analyses and qualitative analyses. PLoS One 7: , e38268. |
[10] | Dekhtyar S , Wang HX , Fratiglioni L , Herlitz A ((2016) ) Childhood school performance, education and occupational complexity: A life-course study of dementia in the Kungsholmen Project. Int J Epidemiol 45: , 1207–1215. |
[11] | Stern Y , Arenaza-Urquijo EM , Bartres-Faz D , Belleville S , Cantilon M , Chetelat G , Ewers M , Franzmeier N , Kempermann G , Kremen WS , Okonkwo O , Scarmeas N , Soldan A , Udeh-Momoh C , Valenzuela M , Vemuri P , Vuoksimaa E , Reserve R , Protective Factors PIAED, Conceptual Frameworks W ((2018) ) Whitepaper: Defining and investigating cognitive reserve, brain reserve, and brain maintenance. Alzheimers Dement. doi: 10.1016/j.jalz.2018.07.219. |
[12] | Cabeza R , Albert M , Belleville S , Craik FIM , Duarte A , Grady CL , Lindenberger U , Nyberg L , Park DC , Reuter-Lorenz PA , Rugg MD , Steffener J , Rajah MN ((2018) ) Maintenance, reserve and compensation: The cognitive neuroscience of healthy ageing. Nat Rev Neurosci 19: , 701–710. |
[13] | van Loenhoud AC , Groot C , Vogel JW , van der Flier WM , Ossenkoppele R ((2018) ) Is intracranial volume a suitable proxy for brain reserve? . Alzheimers Res Ther 10: , 91. |
[14] | Reed BR , Mungas D , Farias ST , Harvey D , Beckett L , Widaman K , Hinton L , DeCarli C ((2010) ) Measuring cognitive reserve based on the decomposition of episodic memory variance. Brain 133: , 2196–2209. |
[15] | Petkus AJ , Resnick SM , Rapp SR , Espeland MA , Gatz M , Widaman KF , Wang X , Younan D , Casanova R , Chui H , Barnard RT , Gaussoin S , Goveas JS , Hayden KM , Henderson VW , Sachs BC , Saldana S , Shadyab AH , Shumaker SA , Chen JC ((2019) ) General and domain-specific cognitive reserve, mild cognitive impairment, and dementia risk in older women. Alzheimers Dement (N Y) 5: , 118–128. |
[16] | Stern Y ((2017) ) An approach to studying the neural correlates of reserve. Brain Imaging Behav 11: , 410–416. |
[17] | Lawrence E , Vegvari C , Ower A , Hadjichrysanthou C , De Wolf F , Anderson RM ((2017) ) A systematic review of longitudinal studies which measure Alzheimer’s disease biomarkers. J Alzheimers Dis 59: , 1359–1379. |
[18] | Ikram MA , Brusselle GGO , Murad SD , van Duijn CM , Franco OH , Goedegebure A , Klaver CCW , Nijsten TEC , Peeters RP , Stricker BH , Tiemeier H , Uitterlinden AG , Vernooij MW , Hofman A ((2017) ) The Rotterdam Study: 2018 update on objectives, design and main results. Eur J Epidemiol 32: , 807–850. |
[19] | Ikram MA , van der Lugt A , Niessen WJ , Koudstaal PJ , Krestin GP , Hofman A , Bos D , Vernooij MW ((2015) ) The Rotterdam Scan Study: Design update 2016 and main findings. Eur J Epidemiol 30: , 1299–1315. |
[20] | Bigler ED , Tate DF ((2001) ) Brain volume, intracranial volume, and dementia. Invest Radiol 36: , 539–546. |
[21] | Sharp ES , Gatz M ((2011) ) Relationship between education and dementia: An updated systematic review. Alzheimer Dis Assoc Disord 25: , 289–304. |
[22] | Hoogendam YY , Hofman A , van der Geest JN , van der Lugt A , Ikram MA ((2014) ) Patterns of cognitive function in aging: The Rotterdam Study. Eur J Epidemiol 29: , 133–140. |
[23] | Bleecker ML , Bolla-Wilson K , Agnew J , Meyers DA ((1988) ) Age-related sex differences in verbal memory. J Clin Psychol 44: , 403–411. |
[24] | Houx PJ , Jolles J , Vreeling FW ((1993) ) Stroop interference: Aging effects assessed with the Stroop Color-Word Test. Exp Aging Res 19: , 209–224. |
[25] | van der Elst W , van Boxtel MP , van Breukelen GJ , Jolles J ((2006) ) The Letter Digit Substitution Test: Normative data for 1,858 healthy participants aged 24-81 from the Maastricht Aging Study (MAAS): Influence of age, education, and sex. J Clin Exp Neuropsychol 28: , 998–1009. |
[26] | Welsh KA , Butters N , Mohs RC , Beekly D , Edland S , Fillenbaum G , Heyman A ((1994) ) The Consortium to Establish a Registry for Alzheimer’s Disease (CERAD). Part V. A normative study of the neuropsychological battery. Neurology 44: , 609–614. |
[27] | Tiffin J , Asher EJ ((1948) ) The Purdue pegboard; norms and studies of reliability and validity. J Appl Psychol 32: , 234–247. |
[28] | Zahodne LB , Manly JJ , Brickman AM , Siedlecki KL , Decarli C , Stern Y ((2013) ) Quantifying cognitive reserve in older adults by decomposing episodic memory variance: Replication and extension. J Int Neuropsychol Soc 19: , 854–862. |
[29] | Hu LT , Bentler PM ((1999) ) Cutoff criteria for fit indexes in covariance structure analysis: Conventional criteria versus new alternatives. Struct Equ Modeling 6: , 1–55. |
[30] | Vrooman HA , Cocosco CA , van der Lijn F , Stokking R , Ikram MA , Vernooij MW , Breteler MM , Niessen WJ ((2007) ) Multi-spectral brain tissue segmentation using automatically trained k-Nearest-Neighbor classification. Neuroimage 37: , 71–81. |
[31] | de Boer R , Vrooman HA , van der Lijn F , Vernooij MW , Ikram MA , van der Lugt A , Breteler MM , Niessen WJ ((2009) ) White matter lesion extension to automatic brain tissue segmentation on MRI. Neuroimage 45: , 1151–1161. |
[32] | Folstein MF , Folstein SE , McHugh PR ((1975) ) “Mini-mental state”. A practical method for grading the cognitive state of patients for the clinician. J Psychiatr Res 12: , 189–198. |
[33] | Copeland JR , Kelleher MJ , Kellett JM , Gourlay AJ , Gurland BJ , Fleiss JL , Sharpe L ((1976) ) A semi-structured clinical interview for the assessment of diagnosis and mental state in the elderly: The Geriatric Mental State Schedule. I. Development and reliability. Psychol Med 6: , 439–449. |
[34] | Roth M , Tym E , Mountjoy CQ , Huppert FA , Hendrie H , Verma S , Goddard R ((1986) ) CAMDEX. A standardised instrument for the diagnosis of mental disorder in the elderly with special reference to the early detection of dementia. Br J Psychiatry 149: , 698–709. |
[35] | American Psychiatric Association (1987) Diagnostic and statistical manual of mental disorders. Washington, DC. |
[36] | Hollander M , Bots ML , Del Sol AI , Koudstaal PJ , Witteman JC , Grobbee DE , Hofman A , Breteler MM ((2002) ) Carotid plaques increase the risk of stroke and subtypes of cerebral infarction in asymptomatic elderly: The Rotterdam study. Circulation 105: , 2872–2877. |
[37] | Vliegenthart R , Geleijnse JM , Hofman A , Meijer WT , van Rooij FJ , Grobbee DE , Witteman JC ((2002) ) Alcohol consumption and risk of peripheral arterial disease: The Rotterdam study. Am J Epidemiol 155: , 332–338. |
[38] | van der Lee SJ , Wolters FJ , Ikram MK , Hofman A , Ikram MA , Amin N , van Duijn CM ((2018) ) The effect of APOE and other common genetic variants on the onset of Alzheimer’s disease and dementia: A community-based cohort study. Lancet Neurol 17: , 434–444. |
[39] | Bodner TE ((2008) ) What improves with increased missing data imputations? . Struct Equ Modeling 15: , 651–675. |
[40] | van Buuren S , Groothuis-Oudshoorn K ((2011) ) Mice: Multivariate imputation by chained equations in R. J Stat Softw 45: , 1–67. |
[41] | Rubin DB ((1987) ) Multiple imputation for nonresponse in surveys, John Wiley & Sons, New York. |
[42] | Therneau T , Grambsch P ((2000) ) Modeling survival data: Extending the Cox model, Springer, New York. |
[43] | R Core Team (2016) R: A language and environment for statistical computing, R Foundation for Statistical Computing, Vienna, Austria. |
[44] | Rosseel Y ((2012) ) Lavaan: An R package for structural equation modeling. J Stat Softw 48: , 1–36. |
[45] | Clare L , Wu YT , Teale JC , MacLeod C , Matthews F , Brayne C , Woods B , team CF-Ws ((2017) ) Potentially modifiable lifestyle factors, cognitive reserve, and cognitive function in later life: A cross-sectional study. PLoS Med 14: , e1002259. |
[46] | Perneczky R , Wagenpfeil S , Lunetta KL , Cupples LA , Green RC , Decarli C , Farrer LA , Kurz A ; MIRAGE Study Group ((2010) ) Head circumference, atrophy, and cognition: Implications for brain reserve in Alzheimer disease. Neurology 75: , 137–142. |
[47] | An H , Son SJ , Cho S , Cho EY , Choi B , Kim SY ; Alzheimer’s Disease Neuroimaging Initiative ((2016) ) Large intracranial volume accelerates conversion to dementia in males and APOE4 non-carriers with mild cognitive impairment. Int Psychogeriatr 28: , 769–778. |
[48] | Wolf H , Julin P , Gertz HJ , Winblad B , Wahlund LO ((2004) ) Intracranial volume in mild cognitive impairment, Alzheimer’s disease and vascular dementia: Evidence for brain reserve? . Int J Geriatr Psychiatry 19: , 995–1007. |
[49] | Tate DF , Neeley ES , Norton MC , Tschanz JT , Miller MJ , Wolfson L , Hulette C , Leslie C , Welsh-Bohmer KA , Plassman B , Bigler ED ((2011) ) Intracranial volume and dementia: Some evidence in support of the cerebral reserve hypothesis. Brain Res 1385: , 151–162. |
[50] | Jenkins R , Fox NC , Rossor AM , Harvey RJ , Rossor MN ((2000) ) Intracranial volume and Alzheimer disease: Evidence against the cerebral reserve hypothesis. Arch Neurol 57: , 220–224. |
[51] | Edland SD , Xu Y , Plevak M , O’Brien P , Tangalos EG , Petersen RC , Jack CR Jr ((2002) ) Total intracranial volume: Normative values and lack of association with Alzheimer’s disease. Neurology 59: , 272–274. |
[52] | van Hek M , Kraaykamp G , Wolbers MHJ ((2016) ) Comparing the gender gap in educational attainment: The impact of emancipatory contexts in 33 cohorts across 33 countries. Educ Res Eval 22: , 260–282. |
[53] | McKhann GM , Knopman DS , Chertkow H , Hyman BT , Jack CR Jr. , Kawas CH , Klunk WE , Koroshetz WJ , Manly JJ , Mayeux R , Mohs RC , Morris JC , Rossor MN , Scheltens P , Carrillo MC , Thies B , Weintraub S , Phelps CH ((2011) ) The diagnosis of dementia due to Alzheimer’s disease: Recommendations from the National Institute on Aging-Alzheimer’s Association workgroups on diagnostic guidelines for Alzheimer’s disease. Alzheimers Dement 7: , 263–269. |


