
Amyloidogenic Nanoplaques in Cerebrospinal Fluid: Relationship to Amyloid Brain Uptake and Clinical Alzheimer’s Disease in a Memory Clinic Cohort
Abstract
Background:
Aggregation of amyloid-β (Aβ) is an early pathological event in Alzheimer’s disease (AD). Consequently, measures of pathogenic aggregated Aβ are attractive biomarkers for AD. Here, we use a recently developed Thioflavin-T-Fluorescence Correlation Spectroscopy (ThT-FCS) assay to quantify structured ThT-responsive protein aggregates, so-called nanoplaques, in the cerebrospinal fluid (CSF).
Objective:
The overall aim of this work was to assess whether ThT-FCS determined CSF nanoplaque levels could predict amyloid brain uptake as determined by 18F-Flutemetamol PET analysis. Further, we assess whether nanoplaque levels could predict clinical AD.
Methods:
Nanoplaque levels in the CSF from 54 memory clinic patients were compared between sub-groups classified by 18F-Flutemetamol PET as amyloid-positive or amyloid-negative, and by clinical assessment as AD or non-AD.
Results:
Nanoplaque levels did not differ between amyloid groups and could not predict brain amyloid uptake. However, nanoplaque levels were significantly increased in patients with clinical AD, and were significant predictors for AD when adjusting for age, sex, cognitive function, and apolipoprotein E (APOE) genotype.
Conclusion:
The concentration of nanoplaques in the CSF differentiates patients with clinical AD from non-AD patients.
INTRODUCTION
Accumulation of aggregated amyloid-β (Aβ) peptides is an early pathological event in the most common cause of dementia, Alzheimer’s disease (AD) [1, 2]. Together with intracellular neurofibrillary tangles, the deposition of aggregated Aβ into extracellular plaques defines AD neuropathology [3]. Neuropathology progressively accumulates in a long preclinical period, eventually causing synaptic and neuronal loss as well as cognitive decline [1]. Historically, probable AD has been diagnosed based on symptomatic presentation, and confirmed by histological stains postmortem [4]. Today, updated diagnostic criteria for clinical use suggest that biomarkers reflecting the AD pathological process may be incorporated in the diagnostic procedure [5]. Recently published research criteria further emphasize the use of biomarkers, suggesting that AD should not be defined based on clinical presentation at all, but rather as a purely biological disorder [6]. While this definition of AD is currently debated (e.g., [7, 8]), it is generally accepted that biomarkers can aid AD diagnosis and patient selection for clinical trials both at the dementia stage and at the earlier stages of cognitive impairment.
Both the decrease of Aβ42 levels in the cerebrospinal fluid (CSF) and positive results on amyloid positron emission tomography (PET) brain imaging are reliable biomarkers of amyloid pathology [9, 10]. While most studies have found high concordance between the two methods (e.g., [11]), results are discordant in 10–20% of cases [12]. In vitro, Aβ exists in a multitude of states, from unstructured monomers containing different fractions of secondary structural elements, over dimers, multimers, oligomers, small soluble pre-fibrillar aggregates, protofibrils, fibrils, fibrillar bundles to large insoluble aggregates that precipitate out from the solution, which are in a dynamic equilibrium [13]. In vivo, this multitude of states is further expanded by physiological turnover, interactions with a myriad of other molecules and local spatial heterogeneities [14]. Analytical techniques recognize only a subset of these states: amyloid PET measures the accumulation of insoluble, structured aggregates in the brain to which derivatives of Thioflavin-T (ThT), such as the Pittsburgh compound B (11C-PIB) or 18F-Flutemetamol, bind with high selectivity and binding affinity [15], while CSF analysis with enzyme-linked immunosorbent assays characterizes the instantaneous levels of predominantly monomeric Aβ . CSF levels of monomeric Aβ are inversely correlated with the amyloid brain load and thus indirectly measures brain amyloid plaques [16]. Importantly, monomeric Aβ is present physiologically and the self-association of Aβ into aggregated forms is necessary to cause neurodegeneration [17]. As aggregated forms are directly involved in the pathogenic process, they are hypothesized to be valuable biomarkers [18]. Currently, no established CSF biomarkers capture the misfolding and aggregation of Aβ [19].
In one of the first studies of Aβ aggregates in the CSF, Pitschke and colleagues added labeled Aβ monomers to the CSF, theorizing that the monomers would bind existing aggregates and allow their visualization. Fluorescence correlation spectroscopy (FCS) allowed the detection of large fluorescence bursts indicative of aggregates in the AD-patient samples, but not in the control samples [20]. Since then, further studies have found increased levels of Aβ aggregates in the CSF from AD patients compared to healthy controls [18, 21]. However, some studies have failed to detect Aβ aggregates in the CSF from AD patients [22] and others have found increased numbers of aggregates in the CSF of healthy controls compared to that of AD patients [23]. In sum, research on CSF amyloid aggregates has provided inconsistent results, and few studies have been validated against established markers of AD pathology.
The fluorescent dye Thioflavin-T (ThT) can identify structured amyloidogenic aggregates, such as protofibrils and fibrils, with high specificity, dissociation constant ranging from 1–20μM [24]. ThT fluorescence increases in a linear fashion with increasing concentrations of amyloid fibrils in vitro [25]. A ThT-based FCS assay has recently been used to monitor the heterogeneity and turnover of intermediates during Aβ aggregation in vitro; this method allowed the detection of amyloid aggregates with single-molecule sensitivity [26]. Recently, ThT-FCS analysis has been used to study ThT-reactive amyloid aggregates composed of >40 monomers, hereafter called nanoplaques, in blood serum from AD patients and healthy controls. Higher nanoplaque levels and larger nanoplaques distinguished AD patients from healthy controls [27]. These results are promising and whether the method could be useful in clinical practice should be explored in a naturalistic memory clinic cohort.
This study aimed to determine the relationship between CSF nanoplaque concentration and size determined by the newly developed ThT-FCS analysis and amyloid brain uptake measured by the amyloid-PET tracer 18F-Flutemetamol in a naturalistic memory clinic cohort. We assessed whether nanoplaque concentration could predict amyloid pathology and/or clinical AD.
MATERIALS AND METHODS
CSF was obtained from the Norwegian Registry of Persons Assessed for Cognitive Symptoms (NorCog) biobank. All CSF was collected at the Oslo University Hospital Memory Clinic.
Study cohort
This study included patients from NorCog who were referred for cognitive complaints to the Oslo University Hospital Memory Clinic. The included patients, assessed between September 2014 and September 2019, underwent both 18F-Flutemetamol PET and CSF sampling as part of the diagnostic procedure. CSF samples were made available for further analysis by the NorCog biobank. The maximum interval between 18F-Flutemetamol PET and CSF sampling was 365 days. Clinical data was extracted from NorCog. When data was missing from the registry, the patients’ medical records were consulted.
Clinical assessment
Patient assessment followed a standardized research protocol wherein patients and caregivers were interviewed about demographic information, symptoms, medical history and medication use [28]. The cognitive assessment comprised several neurocognitive tests, including the Mini-Mental State Examination (MMSE) [29], Clock Drawing Test [30], Trail Making tests (TMT) A and B [31], Controlled Oral Word Association Test (COWAT-FAS) [32], and the Consortium to Establish a Registry of Alzheimer’s Disease (CERAD) 10-item word list, animal naming test, modified 15-word Boston Naming Test, and constructional praxis exercise [33]. The physical assessment included blood sampling, CSF sampling, 18F- Flutemetamol PET imaging and for most cases, magnetic resonance imaging (MRI, n = 43).
Stage of cognitive impairment (subjective cognitive decline (SCD), mild cognitive impairment (MCI), or dementia) and clinical diagnoses were determined retrospectively by two experienced memory clinic physicians. SCD was diagnosed according to the Subjective Cognitive Decline Initiative-criteria [34]. MCI and dementia were diagnosed according to the 2011 National Institute of Aging and the Alzheimer’s Association (NIA-AA)-criteria [5, 35]. Clinical diagnoses were grouped into AD and non-AD groups. The clinical AD group comprised patients with probable AD, possible AD (atypical presentation or mixed AD, e.g., with concomitant vascular pathology) or MCI due to AD. The non-AD group included patients with SCD, vascular dementia [36], frontotemporal dementia [37], and other/uncategorized neurological disorders). Patients with known amyloidogenic diseases other than AD, e.g., dementia with Lewy bodies, were excluded from the non-AD group. Patients were also categorized according to amyloid status. The amyloid positive group corresponds to “Alzheimer’s continuum”, whereas the amyloid negative group corresponds to “Non-AD pathologic change” or “Normal biomarkers” biomarker categories in the 2018 NIA-AA research framework [6]. The categorization is described below in “Visual classification and assessment of amyloid load (SUVR)”.
18F-Flutemetamol PET/CT acquisition
All patients were imaged with the same PET/CT scanner (Siemens Biograph40 mCT, Siemens Healthineers, Erlangen, Germany). Patients received a bolus injection of 185 MBq 18F-Flutemetamol and image acquisition started 75 to 117 min post-injection. First, a low-dose CT scan without contrast enhancement (120 kV, 70 mAs, 3 mm slice thickness) was performed for attenuation correction and anatomical information. The PET acquisition lasted 20 min (4×5 min frames). One patient received a smaller injection (94 MBq) and in this case acquisition time was extended to 30 min. A resolution recovery algorithm with time of flight (TrueX: two iterations, 21 subsets and a Gaussian filter with 2 mm full-width half-maximum and 400×400 matrix size) was used to reconstruct 3D dynamic emission data. Reconstructed images had a 2 mm slice thickness and a 2×2×2 mm3 voxel size.
Visual classification and assessment of amyloid uptake (SUVR)
The process for visual classification is described in full in Müller et al. [11]. Images were visually classified as positive or negative according to the validated image reader program [38]. A Siemens SyngoVia workstation (version VB20, Erlangen, Germany) was used for the classification. Based on the visual classification, patients were categorized as amyloid-positive or amyloid-negative. Henceforth amyloid group refers to visual classification outcome.
Amyloid uptake was semi-quantified using CortexID Suite (GE Medical Systems, Waukesha, WI, USA). 18F-Flutemetamol PET images were anatomically normalized using a T1-weighted MRI-template, and automated gray matter segmentation was performed to define nine reference regions: frontal cortex, anterior and posterior cingulate cortex, mesial and lateral temporal cortex, parietal cortex, occipital cortex, whole cortex and cerebellar cortex. Standardized uptake values were obtained for all these regions. Standardized uptake value ratios (SUVR) were calculated using the cerebellar cortex as reference.
CSF sampling
Lumbar puncture was performed before 11 am for all patients. CSF was collected in sterile cryotubes and centrifuged for 10 min at 2000 G. Research samples were transferred to 0.5 ml cryotubes and frozen immediately at –20°C. Samples were transferred to the biobank for long-term storage at –80°C within 10 working days.
Standard protocol approval, registration, and patient consent
The study was conducted in accordance with the Declaration of Helsinki, and was approved by the Regional Committee for Medical and Health Research Ethics (REK 2017/2235). Data and CSF samples were collected after informed consent from the patients. At the time of inclusion, all patients were deemed to have sufficient cognitive capacity to provide informed consent.
Table 1
Demographic characteristics for all patients and by amyloid group
| Amyloid group | ||||
| All | Negative | Positive | p | |
| n (%) | 54 | 22 (40.7) | 32 (59.3) | |
| Women, n (%) | 28 (51.9) | 7 (31.8) | 21 (65.6) | 0.015* |
| Age | 66.2 (6.8) | 64.9 (61.8–68.0), 7.0 | 67.2 (64.8–69.5), 6.6 | 0.23 |
| Years of education | 14.3 (3.5) | 14.6 (13.3–15.9), 3.0 | 14.1 (12.7–15.5), 3.9 | 0.43 |
| MMSE† | 25.3 (4.0) | 25.8 (24.3–27.3), 3.4 | 24.9 (23.3–26.5), 4.4 | 0.40 |
| APOE ɛ4, n (%)†† | 35 (68.6) | 12 (57.1) | 23 (76.7) | 0.14* |
| Stage, n (%) | 0.07* | |||
| SCD | 4 (7.4) | 3 (13.6) | 1 (3.1) | |
| MCI | 21 (38.9) | 11 (50.0) | 10 (31.2) | |
| Dementia | 29 (53.7) | 8 (36.4) | 21 (65.6) | |
| Clinical diagnosis, n (%) | <0.001* | |||
| AD | 39 (72.2) | 10 (45.4) | 29 (90.6) | |
| Non-AD | 15 (27.8) | 12 (54.6) | 3 (9.4) | |
| SUVR | 1.8 (0.5) | 1.3 (1.25–1.37), 0.1 | 2.1 (2.0–2.3), 0.4 | <0.001 |
| fSEO, median (IQR) | 17.4 (11.4–24) | 13.2 (10.2–24) | 19.8 (12.6–23.7) | 0.15‡ |
p values are for comparisons between amyloid-negative and positive groups. Data are shown as mean (CIs), SD and p value for t-test comparisons unless otherwise specified. AD, Alzheimer’s disease; APOE, apolipoprotein; fSEO, frequency of single event occurrence; IQR, interquartile range; MCI, mild cognitive impairment; MMSE, Mini-Mental State Examination; n, number of patients; SCD, subjective cognitive decline; SUVR, standardized uptake value ratio. *Pearson Chi-Square test; †n = 53, one patient did not have MMSE results available; ‡Mann-Whitney U test; ††n = 51, three patients did not have APOE status available.
Time-resolved ThT fluorescence intensity fluctuation measurement and FCS
Principles of the ThT-FCS analysis are described in detail in Tiiman et al. [27]. Briefly, 1.6μl of 2.5 mM ThT in deionized water was added to a 200μl aliquot of CSF allowed to reach ambient temperature (20°C). Fluorescence intensity fluctuations were recorded using an individually modified ConfoCor 3 system (Carl Zeiss, Jena, Germany) [39]. The optical setting, instrument calibration, data collection and analysis procedures are described in detail in the Supplementary Material and Supplementary Figures 1–3. The measurements were performed in duplicates, and the average was used for further analysis. In each independent measurement, the signal was collected for 3000 s, i.e., in 30 series of 10 consecutive 10 s measurements. Automated fluorescence intensity fluctuation analysis was used to identify rare bursts in ThT fluorescence intensity that reflect the passage of ThT-responsive structured amyloidogenic aggregates, i.e., nanoplaques, through the observation volume element. A fluorescence burst, called “single event” was identified as an increase in fluorescence intensity that differed from the mean of the 10 s time series by a value more than five times larger than the standard deviation of the whole time series (Supplementary Figure 1A, B). The frequency of single event occurrence, fSEO was calculated by normalizing the total number of observed “single events” to the total measurement time. The fSEO is a direct measure of the concentration of nanoplaques [27].
Data analysis
Double-blind masking was applied. The researchers performing the ThT-FCS analysis were blinded to patient diagnosis and clinical data until data analysis was completed. Clinical diagnoses were established independently of the ThT-FCS analysis results.
Statistical analysis
Group differences were explored with t-tests for normally distributed data, Mann-Whitney U tests for non-normal data and Pearson Chi-Square tests for categorical variables. The fSEO levels were not normally distributed, and a log-transformed version of the variable (log fSEO) was used in all regression analyses. Three models were constructed to explore the relationship between fSEO, amyloid-group, brain amyloid uptake and clinical diagnosis: 1) a univariate model including only log fSEO, 2) a multivariate model including sex, age, MMSE-score and apolipoprotein E (APOE) ɛ4 genotype, hereby referred to as the clinical model, and 3) a multivariate model combining the two previous models, hereby referred to as the full model. For all models, linear regression analysis was used to explore their explanatory power for brain amyloid uptake, and logistic regressions were used to assess their predictive power for amyloid-group and clinical diagnosis. Only patients with complete data for all covariates were included in regression analyses (N = 50 for prediction of 18F-Flutemetamol results, N = 41 for prediction of clinical AD). The odds ratios presented account for a 1-unit increase in continuous variables, or the presence of the variable listed for categorical variables. The sensitivity and specificity of the logistic regression models were investigated by receiver operating characteristic (ROC) curves. Statistical analyses were conducted using STATA version 15.1 (StataCorp, College Station, TX, USA).
RESULTS
In total, 54 patients were included. Characteristics for all patients are presented in Table 1. Thirty-two patients were classified as amyloid positive, and 22 patients were classified as amyloid negative. Thirty-nine patients were clinically evaluated to have AD, and 15 patients to have non-AD disorders. The fSEO variable was independent of CSF sample storage time (Supplementary Figure 4).
Table 2
Summary of logistic regression models with amyloid group as the dependent variable
| Characteristic | Univariate model | Clinical model | Full model | |||
| OR (95% CI) | p | OR (95% CI) | p | OR (95% CI) | p | |
| Log fSEO | 1.92 (0.72–5.06) | 0.19 | – | 2.53 (0.78–8.22) | 0.12 | |
| Age | – | 1.06 (0.96–1.16) | 0.24 | 1.08 (0.97–1.19) | 0.17 | |
| Male sex | – | 0.22 (0.06–0.82) | 0.02 | 0.24 (0.06–0.92) | 0.04 | |
| MMSE | – | 0.93 (0.80–1.09) | 0.38 | 0.90 (0.76–1.07) | 0.23 | |
| APOE ɛ4 | – | 1.92 (0.50–7.39) | 0.34 | 2.31 (0.55–9.64) | 0.25 | |
| Pseudo-R2 | 0.03 | 0.15 | 0.19 | |||
Logistic regression models were used to assess predictors of amyloid group after adjustment by selected covariates in 50 patients. Abbreviations: APOE, apolipoprotein; CI, confidence intervals; fSEO, frequency of single event occurrence; MMSE, Mini-Mental State Examination; OR, odds ratio.
Relationship between nanoplaque levels in CSF and 18F-Flutemetamol PET
Comparisons between amyloid-positive and amyloid-negative groups
The demographic and clinical characteristics for the amyloid groups are presented in Table 1. The fSEO did not differ significantly between the amyloid-positive and amyloid-negative groups in the unadjusted analysis.
Prediction of 18F-Flutemetamol PET results
Results of logistic regression analyses for the prediction of amyloid-group are summarized in Table 2. Log fSEO was not a significant predictor in the univariate model, p = 0.19. Furthermore, it remained non-significant in the full model, after adjusting for age, sex, MMSE-score, and APOE ɛ4 carrier status, p = 0.12. Male sex significantly reduced the odds of amyloid positivity in both the full model (odds-ratio 0.24 for males, p = 0.04) and the clinical model (odds-ratio 0.22 for males, p = 0.02). The full model did not perform significantly better than the clinical model, likelihood-ratio test, χ2 = 2.69, p = 0.10.
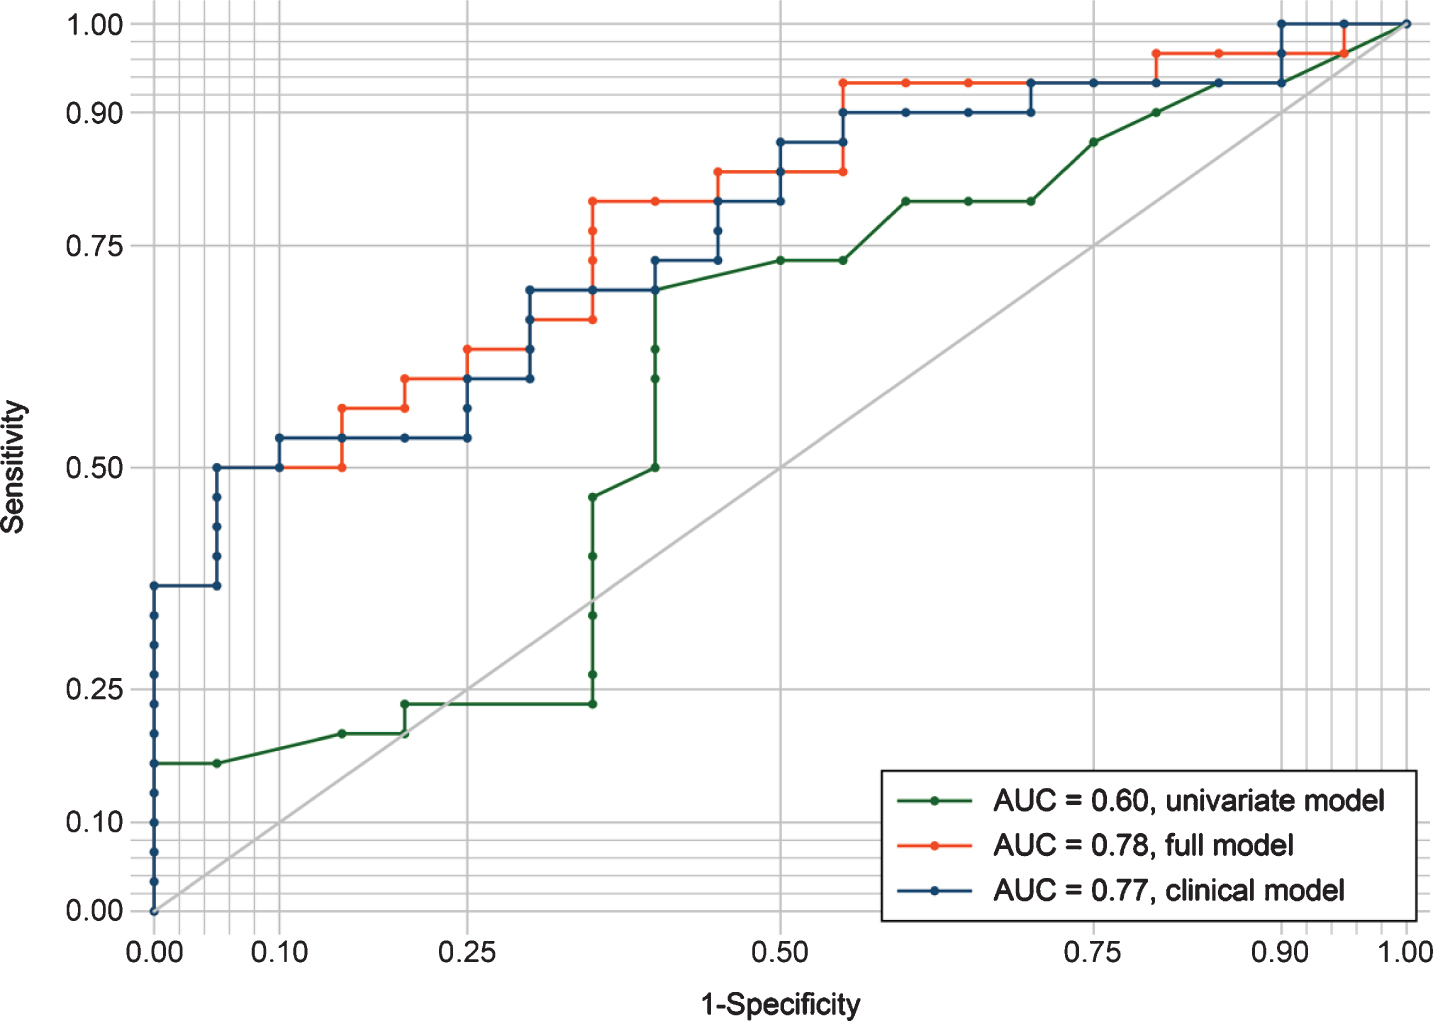
The ROC-curves for the three logistic regression models are presented in Fig. 1. The univariate model had inferior sensitivity and specificity compared to the clinical- and full model, with an area under the curve of 0.60. Classification was similar for the clinical- and the full model, with areas under the curve of 0.77 and 0.78, respectively.
Fig.1
ROC curves evaluating the discrimination between amyloid groups by the three different regression models. The univariate model included only log fSEO as a predictor; the clinical model included age, sex, MMSE, and APOE ɛ4 status; the full model combined the univariate and clinical model. AUC, area under the curve; ROC, receiver operating characteristic.
Log fSEO was not a significant predictor for SUVR in neither the univariate (B = 0.05, p = 0.70) nor the full (B = 0.02, p = 0.84) linear regression models (Supplementary Table 1).
Relationship between nanoplaque levels in CSF and clinical AD
Ten amyloid-negative patients met the clinical criteria for AD; as this suggests underlying non-AD pathology, these patients were excluded from the AD group for the following analyses.
Comparisons between AD and non-AD groups
Results from the comparison of AD and non-AD groups are presented in Table 3. The median fSEO was significantly higher in the AD (20.4) group compared to the non-AD (12.6) group, p = 0.03. However, the groups also differed significantly in terms of age, sex distribution, clinical stage, and brain amyloid uptake.
Table 3
Demographic characteristics by clinical diagnosis
| Clinical diagnosis | |||
| Non-AD | AD | p | |
| N | 15 | 29 | |
| Women, n (%) | 4 (26.7) | 20 (69.0) | <0.001* |
| Age | 64.7 (60.6–68.7), 7.3 | 67.5 (65.1–70.0) | 0.19 |
| Years of education | 15.3 (13.5–17.0), 3.1 | 13.9 (12.5–15.3) | 0.22 |
| MMSE† | 26.9 (25.4–28.4), 2.6 | 24.5 (22.8–26.1) | 0.06 |
| APOE ɛ4, n (%)†† | 9 (60.0) | 21 (72.4)** | 0.22* |
| Stage, n (%) | <0.001* | ||
| SCD | 4 (26.7) | 0 (0) | |
| MCI | 9 (60.0) | 8 (27.6) | |
| Dementia | 2 (13.3) | 21 (72.4) | |
| Amyloid group, n (%) | <0.001* | ||
| Positive | 3 (20.0) | 29 (100.0) | |
| Negative | 12 (80.0) | 0 (0.0) | |
| SUVR | 1.3 (1.2–1.5), 0.2 | 2.2 (2.0–2.3), 0.5 | <0.001 |
| fSEO, median (IQR) | 12.6 (10.2–16.8) | 20.4 (12–24.6) | 0.03‡ |
p values are for comparisons between non-AD and AD clinical diagnoses. Data are shown as mean (CIs), SD and p value for t-test comparison unless otherwise specified. AD, Alzheimer’s disease; APOE, apolipoprotein; fSEO, frequency of single event occurrence; IQR, interquartile range; MCI, mild cognitive impairment; MMSE, Mini-Mental State Examination; SCD, subjective cognitive decline; SUVR, standardized uptake value ratio. *Pearson Chi-Square test; †n = 43, one patient did not have MMSE results available; ‡Mann-Whitney U test; ††n = 42, two patients did not have APOE status available.
Prediction of clinical diagnosis
Results of the logistic regression analyses for the prediction of clinical diagnosis are summarized in Table 4. The univariate logistic regression analysis showed that log fSEO was not a significant predictor of diagnosis, odds-ratio = 3.37, p = 0.07. However, in the adjusted full model one unit of log fSEO significantly increased the odds of clinical AD, odds-ratio = 9.14, p = 0.03. Translating to the non-transformed variable, this means that a 10% increase in fSEO increased the odds of clinical AD with 23% (odds-ratio = 1.23).
Table 4
Summary of logistic regression models with clinical diagnosis as the dependent variable
| Characteristic | Univariate model | Clinical model | Full model | |||
| OR (95% CI) | p | OR (95% CI) | p | OR (95% CI) | p | |
| Log fSEO | 3.37 (0.89–12.72) | 0.07 | – | 9.14 (1.28 – 65.04) | 0.03 | |
| Age | – | 1.05 (0.94–1.18) | 0.34 | 1.11 (0.95–1.30) | 0.19 | |
| Male sex | – | 0.20 (0.04–0.94) | 0.04 | 0.17 (0.03 – 0.97) | 0.05 | |
| MMSE | – | 0.83 (0.67–1.03) | 0.09 | 0.73 (0.55–0.98) | 0.03 | |
| APOE ɛ4 | – | 2.04 (0.41–10.06) | 0.38 | 2.70 (0.39–18.67) | 0.31 | |
| Pseudo-R2 | 0.08 | 0.22 | 0.36 | |||
Logistic regression models were used to assess predictors of clinical AD after adjustment by selected covariates in 41 patients. APOE, apolipoprotein; CI, confidence intervals; fSEO, frequency of single event occurrence; MMSE, Mini-Mental State Examination; OR, odds ratio.
MMSE was also a significant predictor of clinical AD in the full model, with one unit increase on the MMSE reducing the odds of clinical AD with 27%, odds-ratio = 0.73, p = 0.03. MMSE was not a significant predictor in the clinical model, p = 0.09. In other words, fSEO was a confounder for the effect of MMSE. By including it in the model, the effect of MMSE was more accurately estimated. Male sex significantly reduced the odds of clinical AD both in the full model (odds-ratio = 0.17, p = 0.05) and the clinical model (0.20, p = 0.04).
The full model performed significantly better than the clinical model, χ2 = 7.35, p < 0.01.
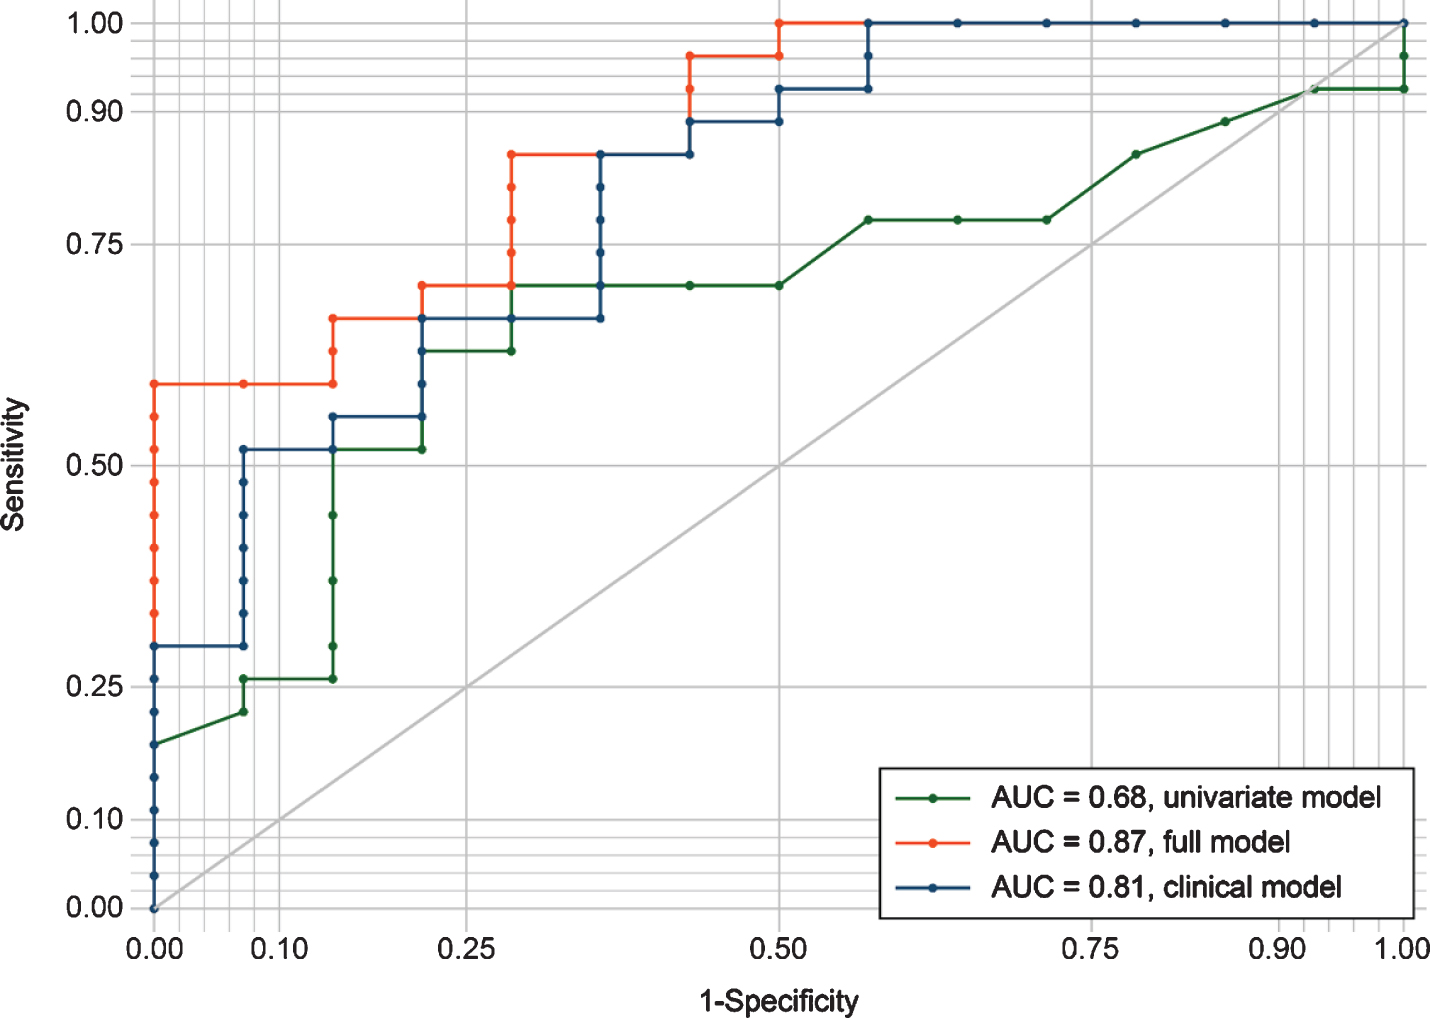
The ROC-curves for the three logistic regression models are presented in Fig. 2. The univariate model had the lowest sensitivity and specificity with an area under the curve of 0.68. The clinical model performed better with an area under the curve of 0.81. The full model had the best classifier performance, with an area under the curve of 0.87.
Fig.2
ROC curves evaluating the discrimination between AD and non-AD patients by the three different regression models. The univariate model included only log fSEO as a predictor; the clinical model included age, sex, MMSE, and APOE ɛ4 status; the full model combined the univariate and clinical model. AUC, area under the curve; ROC, receiver operating characteristic.
DISCUSSION
The main finding of this study was that the instantaneous concentration of nanoplaques in the CSF was not associated with brain amyloid uptake as determined by 18F-Flutemetamol PET. As such, it was not related to amyloid pathology and thus, the Alzheimer’s continuum, as defined by the 2018 research criteria [6]. However, the concentration of nanoplaques in the CSF significantly differed between patients with clinical AD and patients with non-AD disorders. The concentration of nanoplaques was a significant predictor for clinical AD in the full model.
The lack of association between CSF nanoplaques levels and 18F-Flutemetamol PET determined amyloid brain uptake could be due to relevant differences between these methods. As 18F-Flutemetamol PET is a derivative of ThT [40, 41], both methods measure misfolded amyloid with β-sheet secondary structure. Even so, amyloid PET measures the insoluble amyloid burden accumulated over time, whereas ThT-FCS measures the instantaneous level of nanoplaques at a specific time point. Moreover, the methods differ in their sensitivity; amyloid PET detects sizable insoluble deposits that are 2 mm3 or larger [11, 42], while ThT-FCS detects structured aggregates with single-molecule sensitivity. Research on CSF fibrillar amyloid and the relation to amyloid PET is sparse, although a nonlinear association between amyloid brain uptake and monomeric Aβ42 in the CSF has been shown [43]. An association between amyloid PET and nanoplaques should be explored in a larger cohort. The ThT-FCS method is recently developed, and the dynamics of nanoplaque levels at different AD stages are not currently known. Plausibly, nanoplaque levels in CSF could be increased in early disease stages, and plateau or even decrease in later stages as Aβ aggregates precipitate forming macroscopic plaques.
In line with previous research on amyloid aggregates in the CSF [18], the concentration of nanoplaques was increased in the CSF of clinical AD patients. This mirrors the findings of increased ThT-active nanoplaques in AD patient blood serum [27]. Most studies on amyloid aggregates in CSF have compared AD patients with healthy controls [18, 20, 21, 23]. Nabers et al. [44] employed other disease controls (i.e., patients with dementia due to non-AD causes and other neurological and/or psychiatric disorders); however, they excluded controls with abnormal amyloid biomarkers. By virtue of an immuno-infrared-sensor, they found indications that Aβ aggregates enriched in β-sheet structure were increased in the CSF from AD patients compared to other disease controls. Our study supports and extends this finding with a different approach to quantification of β-sheet-enriched aggregates.
A major strength of the current study was the use of a well-characterized clinical cohort. This is a relatively young clinical cohort, which is of note because brain amyloidosis is associated with increased age [45, 46]. In the current study, age was not associated with amyloid brain load. Clinical diagnoses were made according to updated criteria [5, 35], encompassing current knowledge about the clinical presentations of AD. Unfortunately, the sample size was limited by the number of patients who had undergone both 18F-Flutemetamol-PET and CSF sampling as part of their clinical assessment. As this is not standard procedure, the total sample size was relatively small, restricting the opportunity to do within-group analysis.
In this study, the recently developed ThT-FCS assay has been used to analyze CSF samples for the first time. The ThT-FCS method has considerable benefits as a method for biomarker studies. Firstly, FCS is suitable for biomarker studies as it requires small sample volumes and can measure a wide range of concentrations (∼10 pM – 100 nM) [47]. Secondly, ThT is highly specific for amyloidosis, which is a central process in many neurodegenerative diseases [48]; ThT does not react with non-pathological protein monomers [49]. Because Aβ aggregates are more heterogeneous and less numerous in biological fluids than their monomeric counterparts [19], quantification of aggregates in CSF with immune-based assays has been challenging. Nonetheless, the ThT-FCS assay achieves the ultimate sensitivity, allowing the detection of single aggregated particles. The ThT-FCS method does not rely on signal-amplification, protein separation, or immune probes. Beyond the potential application as a diagnostic tool, a better understanding of these aggregates may illuminate the contribution of protein aggregation in AD pathology [50].
The ThT-FCS assay is structure-based, which entails two main limitations. The first limitation is that the assay only detects aggregates with β-sheet secondary structure, and is not sensitive to smaller oligomers (dimers, trimers, tetramers, etc.), nor oligomers with a non-β-sheet secondary structure. More precisely, the ThT-FCS assay detects amyloidogenic aggregates composed of a minimum of 40 monomers, and smaller aggregates do not give rise to an observable change in fluorescence [26]. While smaller oligomers are considered to be among the most toxic species [51], most small oligomers are considered on pathway to aggregation, and the concentration of large aggregates is thought to increase quite rapidly following increased concentration of oligomers [19]. Recently, it has been demonstrated that while smaller oligomers exert toxicity through membrane permeabilization, larger ThT-reactive aggregates exert toxicity by provoking inflammatory responses in microglia cells [52, 53]. Hence, also larger aggregates are relevant targets for disease-modifying treatments.
A second limitation of the assay is that ThT is not selective for a specific amino acid sequence. A wide range of polypeptides with different amino acid sequences, i.e., different primary structure (including Aβ, α-synuclein, and prion protein PrP) aggregate to amyloid fibrils with similar secondary structure [54]; ThT cannot discriminate between their aggregates [25, 41]. Thus, the detected nanoplaques are not necessarily composed of Aβ or Aβ only [55]. While this limitation also relates to 18F-Flutemetamol PET imaging, it is not a trivial one as it may limit the potential for differential diagnosis between AD and other amyloidogenic disorders, e.g., Parkinson’s disease [56]. In the current study, we excluded patients with other amyloidogenic disorders. Therefore, while the results indicate that this method can detect clinical AD, it remains to be determined whether it can discriminate patients with different amyloidogenic disorders.
Future research should extend these findings to a larger cohort, and explore the dynamics of nanoplaque levels and sizes at earlier disease stages. It should also be addressed whether the level of nanoplaques in the CSF is associated with other established CSF markers of AD, namely CSF levels of Aβ42, total tau, and phosphorylated tau. Moreover, future studies should address the important question of the nanoplaques’ biochemical composition. Finally, the use of this method to detect nanoplaques in the blood serum, and the potential application of blood nanoplaque levels or sizes as diagnostic or prognostic biomarkers for AD should also be explored in further cross-sectional and longitudinal studies.
In conclusion, the concentration of nanoplaques in the CSF was not related to the cumulated amyloid brain uptake as determined by 18F-Flutemetamol PET. Nonetheless, the concentration of nanoplaques was increased in patients with clinical AD, and was a significant predictor of clinical AD when combined with clinical variables. The relationship between CSF nanoplaque levels and other established CSF markers should be determined to further explore its potential as a biomarker for AD.
ACKNOWLEDGMENTS
This work was supported by funding from the Olav Thon Foundation, Swedish Foundation for Strategic Research (SBE13-0115), Swedish Research Council (VR 2018-05337), Olle Engkvists Foundation (199-0480), Magnus Bergvalls Foundation (2018-02642) and by grants provided by Region Stockholm (ALF projects 20180365 and 20190561). The funding agencies had no influence on the study design, methods, collection, analysis or interpretation of data, manuscript writing or the decision to submit the article for publication.
We want to acknowledge the Norwegian Registry of Persons Assessed for Cognitive Symptoms (NorCog) for providing access to patient data and CSF samples. We thank the patients who have participated in NorCog.
Authors’ disclosures available online (https://www.j-alz.com/manuscript-disclosures/20-0237r2).
SUPPLEMENTARY MATERIAL
[1] The supplementary material is available in the electronic version of this article: https://dx.doi.org/10.3233/JAD-200237.
REFERENCES
[1] | Jack CR Jr. , Knopman DS , Jagust WJ , Petersen RC , Weiner MW , Aisen PS , Shaw LM , Vemuri P , Wiste HJ , Weigand SD , Lesnick TG , Pankratz VS , Donohue MC , Trojanowski JQ ((2013) ) Tracking pathophysiological processes in Alzheimer’s disease: an updated hypothetical model of dynamic biomarkers. Lancet Neurol 12: , 207–216. |
[2] | Hardy JA , Higgins GA ((1992) ) Alzheimer’s disease: the amyloid cascade hypothesis. Science 256: , 184–185. |
[3] | Serrano-Pozo A , Frosch MP , Masliah E , Hyman BT ((2011) ) Neuropathological alterations in Alzheimer disease. Cold Spring Harb Perspect Med 1: , a006189. |
[4] | McKhann G , Drachman D , Folstein M , Katzman R , Price D , Stadlan EM ((1984) ) Clinical diagnosis of Alzheimer’s disease: report of the NINCDS-ADRDA Work Group under the auspices of Department of Health and Human Services Task Force on Alzheimer’s Disease. Neurology 34: , 939–944. |
[5] | McKhann GM , Knopman DS , Chertkow H , Hyman BT , Jack CR Jr. , Kawas CH , Klunk WE , Koroshetz WJ , Manly JJ , Mayeux R , Mohs RC , Morris JC , Rossor MN , Scheltens P , Carrillo MC , Thies B , Weintraub S , Phelps CH ((2011) ) The diagnosis of dementia due to Alzheimer’s disease: recommendations from the National Institute on Aging-Alzheimer’s Association workgroups on diagnostic guidelines for Alzheimer’s disease. Alzheimers Dement 7: , 263–269. |
[6] | Jack CR Jr. , Bennett DA , Blennow K , Carrillo MC , Dunn B , Haeberlein SB , Holtzman DM , Jagust W , Jessen F , Karlawish J , Liu E , Molinuevo JL , Montine T , Phelps C , Rankin KP , Rowe CC , Scheltens P , Siemers E , Snyder HM , Sperling R ((2018) ) NIA-AA Research Framework: Toward a biological definition of Alzheimer’s disease. Alzheimers Dement 14: , 535–562. |
[7] | McCleery J , Flicker L , Richard E , Quinn TJ ((2019) ) When is Alzheimer’s not dementia-Cochrane commentary on The National Institute on Ageing and Alzheimer’s Association Research Framework for Alzheimer’s Disease. Age Ageing 48: , 174–177. |
[8] | Jack CR , Holtzman DM , Sperling R ((2019) ) Dementia is not synonymous with Alzheimer’s disease. Sci Transl Med 11: , eaav0511. |
[9] | Clark CM , Pontecorvo MJ , Beach TG , Bedell BJ , Coleman RE , Doraiswamy PM , Fleisher AS , Reiman EM , Sabbagh MN , Sadowsky CH , Schneider JA , Arora A , Carpenter AP , Flitter ML , Joshi AD , Krautkramer MJ , Lu M , Mintun MA , Skovronsky DM ((2012) ) Cerebral PET with florbetapir compared with neuropathology at autopsy for detection of neuritic amyloid-beta plaques: a prospective cohort study. Lancet Neurol 11: , 669–678. |
[10] | Hansson O , Zetterberg H , Buchhave P , Londos E , Blennow K , Minthon L ((2006) ) Association between CSF biomarkers and incipient Alzheimer’s disease in patients with mild cognitive impairment: a follow-up study. Lancet Neurol 5: , 228–234. |
[11] | Muller EG , Edwin TH , Stokke C , Navelsaker SS , Babovic A , Bogdanovic N , Knapskog AB , Revheim ME ((2019) ) Amyloid-beta PET-Correlation with cerebrospinal fluid biomarkers and prediction of Alzheimer s disease diagnosis in a memory clinic. PLoS One 14: , e0221365. |
[12] | de Wilde A , Reimand J , Teunissen CE , Zwan M , Windhorst AD , Boellaard R , van der Flier WM , Scheltens P , van Berckel BNM , Bouwman F , Ossenkoppele R ((2019) ) Discordant amyloid-β PET and CSF biomarkers and its clinical consequences. Alzheimers Res Ther 11: , 78. |
[13] | Nag S , Sarkar B , Bandyopadhyay A , Sahoo B , Sreenivasan VKA , Kombrabail M , Muralidharan C , Maiti S ((2011) ) Nature of the amyloid-beta monomer and the monomer-oligomer equilibrium. J Biol Chem 286: , 13827–13833. |
[14] | Finder VH , Glockshuber R ((2007) ) Amyloid-beta aggregation. Neurodegener Dis 4: , 13–27. |
[15] | Cui M ((2014) ) Past and recent progress of molecular imaging probes for beta-amyloid plaques in the brain. Curr Med Chem 21: , 82–112. |
[16] | Tapiola T , Alafuzoff I , Herukka S-K , Parkkinen L , Hartikainen P , Soininen H , Pirttilä T ((2009) ) Cerebrospinal fluid β-amyloid 42 and tau proteins as biomarkers of Alzheimer-type pathologic changes in the brain. Arch Neurol 66: , 382–389. |
[17] | Funke SA , Birkmann E , Willbold D ((2009) ) Detection of Amyloid-beta aggregates in body fluids: a suitable method for early diagnosis of Alzheimer’s disease? Curr Alzheimer Res 6: , 285–289. |
[18] | Funke SA , Birkmann E , Henke F , Gortz P , Lange-Asschenfeldt C , Riesner D , Willbold D ((2007) ) Single particle detection of Abeta aggregates associated with Alzheimer’s disease. Biochem Biophys Res Commun 364: , 902–907. |
[19] | Schuster J , Funke SA ((2016) ) Methods for the specific detection and quantitation of amyloid-beta oligomers in cerebrospinal fluid. J Alzheimers Dis 53: , 53–67. |
[20] | Pitschke M , Prior R , Haupt M , Riesner D ((1998) ) Detection of single amyloid beta-protein aggregates in the cerebrospinal fluid of Alzheimer’s patients by fluorescence correlation spectroscopy. Nat Med 4: , 832–834. |
[21] | Wang-Dietrich L , Funke SA , Kuhbach K , Wang K , Besmehn A , Willbold S , Cinar Y , Bannach O , Birkmann E , Willbold D ((2013) ) The amyloid-beta oligomer count in cerebrospinal fluid is a biomarker for Alzheimer’s disease. J Alzheimers Dis 34: , 985–994. |
[22] | Greiner ER , Kelly JW , Palhano FL ((2014) ) Immunoprecipitation of amyloid fibrils by the use of an antibody that recognizes a generic epitope common to amyloid fibrils. PLoS One 9: , e105433. |
[23] | Zhang WI , Antonios G , Rabano A , Bayer TA , Schneider A , Rizzoli SO ((2015) ) Super-resolution microscopy of cerebrospinal fluid biomarkers as a tool for Alzheimer’s disease diagnostics. J Alzheimers Dis 46: , 1007–1020. |
[24] | Groenning M ((2010) ) Binding mode of Thioflavin T and other molecular probes in the context of amyloid fibrils-current status. J Chem Biol 3: , 1–18. |
[25] | Xue C , Lin TY , Chang D , Guo Z ((2017) ) Thioflavin T as an amyloid dye: fibril quantification, optimal concentration and effect on aggregation. R Soc Open Sci 4: , 160696. |
[26] | Tiiman A , Jarvet J , Graslund A , Vukojevic V ((2015) ) Heterogeneity and turnover of intermediates during amyloid-beta (Abeta) peptide aggregation studied by fluorescence correlation spectroscopy. Biochemistry 54: , 7203–7211. |
[27] | Tiiman A , Jelic V , Jarvet J , Jaremo P , Bogdanovic N , Rigler R , Terenius L , Graslund A , Vukojevic V ((2019) ) Amyloidogenic nanoplaques in blood serum of patients with Alzheimer’s disease revealed by time-resolved Thioflavin T fluorescence intensity fluctuation analysis. J Alzheimers Dis 68: , 571–582. |
[28] | Braekhus A , Ulstein I , Wyller TB , Engedal K ((2011) ) The Memory Clinic–outpatient assessment when dementia is suspected. Tidsskr Nor Laegeforen 131: , 2254–2257. |
[29] | Folstein MF , Folstein SE , McHugh PR ((1975) ) “Mini-mental state”. A practical method for grading the cognitive state of patients for the clinician. J Psychiatr Res 12: , 189–198. |
[30] | Shulman KI ((2000) ) Clock-drawing: is it the ideal cognitive screening test? Int J Geriatr Psychiatry 15: , 548–561. |
[31] | Reitan R ((1958) ) Validity of the Trail Making Test as an indicator of organic brain damage. Percept Mot Skills 8: , 271–276. |
[32] | Malek-Ahmadi M , Small BJ , Raj A ((2011) ) The diagnostic value of controlled oral word association test-FAS and category fluency in single-domain amnestic mild cognitive impairment. Dement Geriatr Cogn Disord 32: , 235–240. |
[33] | Morris JC , Heyman A , Mohs RC , Hughes JP , van Belle G , Fillenbaum G , Mellits ED , Clark C ((1989) ) The Consortium to Establish a Registry for Alzheimer’s Disease (CERAD). Part I. Clinical and neuropsychological assessment of Alzheimer’s disease. Neurology 39: , 1159–1165. |
[34] | Jessen F , Amariglio RE , van Boxtel M , Breteler M , Ceccaldi M , Chetelat G , Dubois B , Dufouil C , Ellis KA , van der Flier WM , Glodzik L , van Harten AC , de Leon MJ , McHugh P , Mielke MM , Molinuevo JL , Mosconi L , Osorio RS , Perrotin A , Petersen RC , Rabin LA , Rami L , Reisberg B , Rentz DM , Sachdev PS , de la Sayette V , Saykin AJ , Scheltens P , Shulman MB , Slavin MJ , Sperling RA , Stewart R , Uspenskaya O , Vellas B , Visser PJ , Wagner M ((2014) ) A conceptual framework for research on subjective cognitive decline in preclinical Alzheimer’s disease. Alzheimers Dement 10: , 844–852. |
[35] | Albert MS , DeKosky ST , Dickson D , Dubois B , Feldman HH , Fox NC , Gamst A , Holtzman DM , Jagust WJ , Petersen RC , Snyder PJ , Carrillo MC , Thies B , Phelps CH ((2011) ) The diagnosis of mild cognitive impairment due to Alzheimer’s disease: Recommendations from the National Institute on Aging-Alzheimer’s Association workgroups on diagnostic guidelines for Alzheimer’s disease. Alzheimers Dement 7: , 270–279. |
[36] | Sachdev P , Kalaria R , O’Brien J , Skoog I , Alladi S , Black SE , Blacker D , Blazer DG , Chen C , Chui H , Ganguli M , Jellinger K , Jeste DV , Pasquier F , Paulsen J , Prins N , Rockwood K , Roman G , Scheltens P ((2014) ) Diagnostic criteria for vascular cognitive disorders: a VASCOG statement. Alzheimer Dis Assoc Disord 28: , 206–218. |
[37] | Rascovsky K , Hodges JR , Knopman D , Mendez MF , Kramer JH , Neuhaus J , van Swieten JC , Seelaar H , Dopper EG , Onyike CU , Hillis AE , Josephs KA , Boeve BF , Kertesz A , Seeley WW , Rankin KP , Johnson JK , Gorno-Tempini ML , Rosen H , Prioleau-Latham CE , Lee A , Kipps CM , Lillo P , Piguet O , Rohrer JD , Rossor MN , Warren JD , Fox NC , Galasko D , Salmon DP , Black SE , Mesulam M , Weintraub S , Dickerson BC , Diehl-Schmid J , Pasquier F , Deramecourt V , Lebert F , Pijnenburg Y , Chow TW , Manes F , Grafman J , Cappa SF , Freedman M , Grossman M , Miller BL ((2011) ) Sensitivity of revised diagnostic criteria for the behavioural variant of frontotemporal dementia. Brain 134: , 2456–2477. |
[38] | Buckley CJ , Sherwin PF , Smith APL , Wolber J , Weick SM , Brooks DJ ((2017) ) Validation of an electronic image reader training programme for interpretation of [18F]flutemetamol β-amyloid PET brain images. Nucl Med Commun 38: , 234–241. |
[39] | Vukojevic V , Heidkamp M , Ming Y , Johansson B , Terenius L , Rigler R ((2008) ) Quantitative single-molecule imaging by confocal laser scanning microscopy. Proc Natl Acad Sci U S A 105: , 18176–18181. |
[40] | Mathis CA , Mason NS , Lopresti BJ , Klunk WE ((2012) ) Development of positron emission tomography β-amyloid plaque imaging agents. Semin Nucl Med 42: , 423–432. |
[41] | Cao KJ , Yang J ((2018) ) Translational opportunities for amyloid-targeting fluorophores. Chem Commun (Camb) 54: , 9107–9118. |
[42] | Morris E , Chalkidou A , Hammers A , Peacock J , Summers J , Keevil S ((2016) ) Diagnostic accuracy of (18)F amyloid PET tracers for the diagnosis of Alzheimer’s disease: a systematic review and meta-analysis. Eur J Nucl Med Mol Imaging 43: , 374–385. |
[43] | Toledo JB , Bjerke M , Da X , Landau SM , Foster NL , Jagust W , Jack C Jr. , Weiner M , Davatzikos C , Shaw LM , Trojanowski JQ ((2015) ) Nonlinear association between cerebrospinal fluid and Florbetapir F-18 beta-amyloid measures across the spectrum of Alzheimer disease. JAMA Neurol 72: , 571–581. |
[44] | Nabers A , Ollesch J , Schartner J , Kotting C , Genius J , Hafermann H , Klafki H , Gerwert K , Wiltfang J ((2016) ) Amyloid-beta-secondary structure distribution in cerebrospinal fluid and blood measured by an immuno-infrared-sensor: a biomarker candidate for Alzheimer’s disease. Anal Chem 88: , 2755–2762. |
[45] | Ossenkoppele R , Jansen WJ , Rabinovici GD , Knol DL , van der Flier WM , van Berckel BN , Scheltens P , Visser PJ , Verfaillie SC , Zwan MD , Adriaanse SM , Lammertsma AA , Barkhof F , Jagust WJ , Miller BL , Rosen HJ , Landau SM , Villemagne VL , Rowe CC , Lee DY , Na DL , Seo SW , Sarazin M , Roe CM , Sabri O , Barthel H , Koglin N , Hodges J , Leyton CE , Vandenberghe R , van Laere K , Drzezga A , Forster S , Grimmer T , Sánchez-Juan P , Carril JM , Mok V , Camus V , Klunk WE , Cohen AD , Meyer PT , Hellwig S , Newberg A , Frederiksen KS , Fleisher AS , Mintun MA , Wolk DA , Nordberg A , Rinne JO , Chételat G , Lleo A , Blesa R , Fortea J , Madsen K , Rodrigue KM , Brooks DJ ((2015) ) Prevalence of amyloid PET positivity in dementia syndromes: a meta-analysis. JAMA 313: , 1939–1949. |
[46] | Jansen WJ , Ossenkoppele R , Knol DL , Tijms BM , Scheltens P , Verhey FR , Visser PJ , Aalten P , Aarsland D , Alcolea D , Alexander M , Almdahl IS , Arnold SE , Baldeiras I , Barthel H , van Berckel BN , Bibeau K , Blennow K , Brooks DJ , van Buchem MA , Camus V , Cavedo E , Chen K , Chetelat G , Cohen AD , Drzezga A , Engelborghs S , Fagan AM , Fladby T , Fleisher AS , van der Flier WM , Ford L , Forster S , Fortea J , Foskett N , Frederiksen KS , Freund-Levi Y , Frisoni GB , Froelich L , Gabryelewicz T , Gill KD , Gkatzima O , Gomez-Tortosa E , Gordon MF , Grimmer T , Hampel H , Hausner L , Hellwig S , Herukka SK , Hildebrandt H , Ishihara L , Ivanoiu A , Jagust WJ , Johannsen P , Kandimalla R , Kapaki E , Klimkowicz-Mrowiec A , Klunk WE , Kohler S , Koglin N , Kornhuber J , Kramberger MG , Van Laere K , Landau SM , Lee DY , de Leon M , Lisetti V , Lleo A , Madsen K , Maier W , Marcusson J , Mattsson N , de Mendonca A , Meulenbroek O , Meyer PT , Mintun MA , Mok V , Molinuevo JL , Mollergard HM , Morris JC , Mroczko B , Van der Mussele S , Na DL , Newberg A , Nordberg A , Nordlund A , Novak GP , Paraskevas GP , Parnetti L , Perera G , Peters O , Popp J , Prabhakar S , Rabinovici GD , Ramakers IH , Rami L , Resende de Oliveira C , Rinne JO , Rodrigue KM , Rodriguez-Rodriguez E , Roe CM , Rot U , Rowe CC , Ruther E , Sabri O , Sanchez-Juan P , Santana I , Sarazin M , Schroder J , Schutte C , Seo SW , Soetewey F , Soininen H , Spiru L , Struyfs H , Teunissen CE , Tsolaki M , Vandenberghe R , Verbeek MM , Villemagne VL , Vos SJ , van Waalwijk van Doorn LJ , Waldemar G , Wallin A , Wallin AK , Wiltfang J , Wolk DA , Zboch M , Zetterberg H ((2015) ) Prevalence of cerebral amyloid pathology in persons without dementia: a meta-analysis. JAMA 313: , 1924–1938. |
[47] | Chatterjee M , Noding B , Willemse EAJ , Koel-Simmelink MJA , van der Flier WM , Schild D , Teunissen CE ((2017) ) Detection of contactin-2 in cerebrospinal fluid (CSF) of patients with Alzheimer’s disease using Fluorescence Correlation Spectroscopy (FCS). Clin Biochem 50: , 1061–1066. |
[48] | Chiti F , Dobson CM ((2017) ) Protein misfolding, amyloid formation, and human disease: a summary of progress over the last decade. Annu Rev Biochem 86: , 27–68. |
[49] | LeVine H 3rd , ((1999) ) Quantification of beta-sheet amyloid fibril structures with thioflavin T. Methods Enzymol 309: , 274–284. |
[50] | Funke SA ((2011) ) Detection of soluble amyloid-beta oligomers and insoluble high-molecular-weight particles in CSF: development of methods with potential for diagnosis and therapy monitoring of Alzheimer’s disease. Int J Alzheimers Dis 2011: , 151645. |
[51] | Kirkitadze MD , Bitan G , Teplow DB ((2002) ) Paradigm shifts in Alzheimer’s disease and other neurodegenerative disorders: the emerging role of oligomeric assemblies. J Neurosci Res 69: , 567–577. |
[52] | De S , Wirthensohn DC , Flagmeier P , Hughes C , Aprile FA , Ruggeri FS , Whiten DR , Emin D , Xia Z , Varela JA , Sormanni P , Kundel F , Knowles TPJ , Dobson CM , Bryant C , Vendruscolo M , Klenerman D ((2019) ) Different soluble aggregates of Aβ42 can give rise to cellular toxicity through different mechanisms. Nat Commun 10: , 1541. |
[53] | De S , Whiten DR , Ruggeri FS , Hughes C , Rodrigues M , Sideris DI , Taylor CG , Aprile FA , Muyldermans S , Knowles TPJ , Vendruscolo M , Bryant C , Blennow K , Skoog I , Kern S , Zetterberg H , Klenerman D ((2019) ) Soluble aggregates present in cerebrospinal fluid change in size and mechanism of toxicity during Alzheimer’s disease progression. Acta Neuropathol Commun 7: , 120. |
[54] | Soto C , Pritzkow S ((2018) ) Protein misfolding, aggregation, and conformational strains in neurodegenerative diseases. Nat Neurosci 21: , 1332–1340. |
[55] | Luo J , Wärmländer SKTS , Gräslund A , Abrahams JP ((2016) ) Cross-interactions between the Alzheimer disease amyloid-β peptide and other amyloid proteins: a further aspect of the amyloid cascade hypothesis. J Biol Chem 291: , 16485–16493. |
[56] | Horrocks MH , Lee SF , Gandhi S , Magdalinou NK , Chen SW , Devine MJ , Tosatto L , Kjaergaard M , Beckwith JS , Zetterberg H , Iljina M , Cremades N , Dobson CM , Wood NW , Klenerman D ((2016) ) Single-molecule imaging of individual amyloid protein aggregates in human biofluids. ACS Chem Neurosci 7: , 399–406. |


