
Identification of a Cascade of Changes in Activities of Daily Living Preceding Short-Term Clinical Deterioration in Mild Alzheimer’s Disease Dementia via Lead-Lag Analysis
Abstract
Background:
Cognitive functions and activities of daily living (ADL) become increasingly impaired with progressing Alzheimer’s disease. However, the temporal dynamics of this decline are inconsistent.
Objective:
To gain insight into the classical temporal cascade of specific cognitive and ADL changes, which may aid in improving detection of an impending clinical deterioration in patients, and to select ADL items and tests most sensitive to change in a specific disease stage.
Methods:
Patients with mild Alzheimer’s dementia (AD; MMSE = 23.9±2.88) were followed at 12 and 24 months. Lead-lag analysis of changes in cognitive and functional outcome measures (CDR-SOB, 12 neuropsychological subtest scores from the CERAD + test battery, 25 Bayer-ADL items) was applied to rank the temporal sequence of changes on an ordinal scale.
Results:
Of 164 patients with mild AD, moderate disease progression was identified in 84 patients over 24 months (ΔMMSE 5.8±8.64; ΔCDR-SOB 4.32±4.03). Ten Bayer-ADL item measures were altered early in moderate progressors and included in a new ADL composite score. Accordingly, the new ADL score surpassed all neuropsychological measures in repeated lead-lag analysis. The Bayer-ADL total score, TMT-A, and MMSE were lagging variables in all lead-lag analyses.
Conclusion:
Short-term clinical deterioration in mild AD is initially preceded by changes (i.e., decline) in a well-defined set of ADL and not in classical cognitive measures.
INTRODUCTION
Progressive cognitive and functional decline over the disease course is the main hallmark of Alzheimer’s disease [1]. However, activities of daily living (ADL) and cognitive tests show different rates of change along the Alzheimer’s continuum [2, 3]. Time-saving and easy to apply instruments, whose longitudinal changes precede a cascade of changes in other neuropsychological instruments and consequent pronounced clinical deterioration, are essential for planning appropriate pharmacological and psychosocial interventions. Timely implementation of such measures might compensate, maintain, or enhance neuropsychological abilities, improve the quality of life of both patients and caregivers by reducing distress, depression, and psychological morbidity, facilitate planning of subsequent care, personal, financial and health-related decision-making, and delay nursing home admission of patients [4–6]. Although most studies monitoring longitudinal changes focused on the Mini-Mental State Examination (MMSE) [3, 7–11], the Clinical Dementia Rating-Sum of Boxes (CDR-SOB) [3, 9, 12], and the Alzheimer’s Disease Assessment Scale-cognitive subscale (ADAS-Cog) [3, 8, 9, 11, 13, 14], the most optimal instrument reflecting longitudinal disease progression in mild dementia of Alzheimer-type remains elusive [9]. In this framework, the hierarchy of functional loss measured by changes in ADL has been generally relegated to the background. However, as ADL are sustained by multiple cognitive domains, they could consequently be even more vulnerable to imminent marked clinical deterioration than classical cognitive instruments. Based on this concept, Reppermund and colleagues [15, 16] conducted two predictive studies based on the Bayer-ADL (B-ADL) scale. The B-ADL is a 25 item, informant-based instrument developed to assess functional disabilities in the early stages of dementia [17]. Unlike the Alzheimer’s Disease Cooperative Study ADL scale [18], which is more time-consuming and requires an interviewer, the B-ADL is a time-saving questionnaire that is usually completed by the primary caregiver. Reppermund and colleagues divided the B-ADL into high and low cognitive demanding items. Difficulties in highly cognitive demanding activities at baseline were identified as an early marker of both progression to mild cognitive impairment (MCI) and dementia at 24-month follow-up [16].
In the present study, a new approach was applied by performing lead-lag analysis of changes in B-ADL items and subscales, including those described by Reppermund and colleagues [15, 16]), as well as classical cognitive measures in a sample of patients with mild Alzheimer’s disease dementia (AD) over 24 months. Lead-lag analysis identifies items that either precede (“lead”) or follow (“lag”) that of other items in capturing change over time. To make our analysis comprehensible, one could compare this to a road bicycle race. Most cyclists pedal at a similar and constant speed; however, one cyclist frequently detaches from the group. In some cases, the sprinter generates a large distance to the remainder of the group, which maintains a constant speed. However, in other cases, the sprinter causes the speed of the group to increase as the remainder desire to catch up with the leader. Accordingly, the sprinter here represents an early marker of the acceleration of the group. As there is no gold standard for assessing disease progression in the early stages of AD, we aimed to identify alterations in a functional or cognitive measure preceding a cascade of changes in other neuropsychological variables (the “group” catching up with the “sprinter”), and, accordingly, imminent marked clinical deterioration.
METHODS
Participants
Patients from the long-term diagnostic and prognostic study (DAP study) as part of the German Dementia Competence Network (DCN) observational cohort with a mild dementia syndrome at baseline, etiologically classified as due to Alzheimer’s disease, were included in the study (n = 164). Inclusion criteria were the collection of outcome measures at baseline and two annual follow-ups. Diagnostic criteria for AD and study procedures have been described in detail elsewhere [19]. The DCN study was approved by the local ethics committees at each center, and conducted in accordance with the Declaration of Helsinki.
B-ADL questionnaire to detect functional impairment
Functional decline was assessed by the B-ADL, whereby a cumulative score is obtained that rates impairment severity. The B-ADL covers a wide range of ADL with the majority of items relating to complex, instrumental tasks. All items were selected for their sensitivity to cognitive impairment, simplicity of the concept, international applicability, and relevance to patients coping with the demands of everyday life [17]. The B-ADL instrument is suitable for both cross-sectional screening as well as longitudinal follow-up to monitor clinical deterioration within the Alzheimer’s disease continuum [17]. The following items constituted the applied questionnaire: 1) appliances: using domestic appliances; 2) care: self-care; 3) continuation: task persistence following a brief interruption; 4) conversation: participation; 5) cooking: ability to prepare food; 6) dates: observing important dates or events; 7) describing: outlining what was observed or heard; 8) directions: ability to provide directions upon questioning; 9) everyday: managing daily activities; 10) finances: understanding personal financial affairs; 11) hygiene: personal hygiene; 12) leisure: participating in leisure activities; 13) medication: self-medication; 14) message: taking a message for another individual; 15) money: correct counting; 16) orientation: finding the way in an unfamiliar setting; 17) parallel act.: synchronous task management; 18) pressure: performing a task under pressure; 19) reading: concentration; 20) safety: taking precaution; 21) shopping: ability to purchase items; 22) telephone: ability to use; 23) transportation: ability to use; 24) unfamiliar situation: coping with unknown circumstances; and 25) walking: taking a walk without getting lost.
Application and scoring of the B-ADL scale
The following paragraph is extracted from the original manuscript of Hindmarch and colleagues describing the application and scoring of the B-ADL scale [17]:
“The relative or caregiver assessing the patient’s difficulties with ADLs using the B-ADL is instructed to indicate how often difficulties occur with the activity in question by drawing a line through one of the circles numbered ‘1’ to ‘10’. Additionally, a ‘not applicable’ category is provided for instances where a question is not appropriate or relevant to a given patient. Only when a choice cannot be reasonably made is the informant asked to tick the box ‘unknown’. To compute a global scale score, first the individual item scores are summed up. Items rated ‘not applicable’ and ‘unknown’ are not used for the computation of this sum score. The total is then divided by the number of items rated between ‘1’ and ‘10’. Thus, the scale’s sum score is corrected for the number of irrelevant items and missing scores. The resulting figure is rounded to two decimal places, ensuring that total scores of the B-ADL range between values 1.00 and 10.00” [17].
Neuropsychological tests and scales to detect cognitive and functional impairment
Dementia severity was assessed via the CDR-SOB [20]. The CDR-SOB is a summed total score of ratings across six domains (memory, orientation, judgment and problem solving, community affairs, home, and hobbies, and personal care), with scores ranging from 0 to 18 [21]. Impairment is defined only when caused by cognitive loss rather than by a physical disability or other non-cognitive factors [22]. This instrument is used to assess disease progression and frequently utilized as a primary efficacy endpoint [23]. Global cognitive functioning was assessed using a standardized, neuropsychological test battery published by the Consortium to Establish a Registry for Alzheimer’s Disease (CERAD; [24]), supplemented by the Wechsler Memory Scale – Revised (WMS-R) immediate and delayed logical memory [25]), the Mini-Mental State Examination (MMSE) [26]) and the Clock Drawing Test (CDT; [27]). The CERAD comprised the following subtests: 1) BNT-15 = 15-Item Version of the Boston Naming Test; 2) Semantic fluency (animals) 3) Word list (immediate recall); 4) Word list (immediate recall, intrusions); 5) Word list (delayed recall); 6) Word list (delayed recall, intrusions); 7) Word list (recognition task, correct inclusions); 8) Word list (recognition task, correct rejections); 9) Figure constructional praxia (copy); 10) Figure constructional praxia (delayed recall); 11) TMT-A = Trail Making Test A; 12) TMT-B = Trail Making Test B. There were insufficient data for the TMT-B to generate comparisons, as most patients reached the time ceiling (5 min) and showed a floor effect. Accordingly, the TMT-B was not included in further analyses.
Definition of collective
Lead and lag relationships have been investigated in biological, computational, and social sciences (e.g., [28, 29]). Since we intended to identify functional and cognitive measures changing early in short-term, marked disease progression and lead-lag analyses methodologically required a sufficient dynamic of change to ensure the significance of the results, patients with a deterioration of CDR-SOB ≥2 within 24 months were identified for analyses. Although most authors have defined a mean individual annual increase between 1.28 and 1.91 points, there remains a lack of general consensus regarding the rate of progression of the CDR-SOB score in mild AD [21, 30–32].
Imputation
Lead-lag analyses were based on participants who fulfilled the eligibility criteria and all outcome assessments at all visits. For each patient, missing values of 10% were permitted. Rates of missing data in longitudinal research vary from 5 to 20%, although the acceptable consensus among most researchers is 10% [33–34]. Patients exceeding the applied value were excluded. Missing values were imputed using the Multivariate Imputations by Chained Equations (MICE) algorithm, with predictive mean matching provided by R-package mice version 2.3.0 (R-version 3.4.0) [35]. Differences in mean values±standard deviations between groups were evaluated with Student’s t-test or Welch’s unequal variances t-test after the F-test of equality of variances.
Lead and lag analysis
To identify and rank-order on an ordinal scale, changes in functional and cognitive measures preceding a cascade of changes in other neuropsychological variables, and accordingly imminent marked clinical deterioration, two lead-lag analyses were conducted sequentially. In the first analysis, functional changes (i.e., decline) in individual B-ADL item measures over 24 months (i.e., 12 and 24-month follow-ups) were rank-ordered by median lead-lag coefficients. Consequently, two composite scores comprising all leading items with median lead-lag coefficients above zero (B-ADL LEAD) and all lagging items with median lead-lag coefficients below zero (B-ADL LAG) were created. A high average lead-lag coefficient indicated a leading variable for many patients. Furthermore, a change in variables with high and positive lead-lag median coefficients chronologically preceded imminent marked clinical deterioration. The first analysis intended to create a B-ADL LEAD composite score for comparison in a further lead-lag analysis with a set of classical cognitive measures. Therefore, the aim of the second lead-lag analysis was to explore whether the impending clinical deterioration in mild AD is first preceded by changes in a well-defined set of ADL items (i.e., B-ADL LEAD) or classical cognitive measures (i.e., variables of the CERAD+, WMS-R immediate and delayed logical memory, MMSE, CDT, and CDR). The second lead-lag analysis was performed as described for the first lead-lag analysis.
Data discretization
To perform all lead-lag analyses, each functional and cognitive variable was described by a profile comprising three time points: baseline, first follow-up, and second follow-up measurements. For noise reduction, the change in the variables was subdivided into five discrete categories, namely very low, low, medium, high, and very high, according to the quintiles of the complete variable distribution (20%, 40%, 60%, 80%, and 100%, respectively). Therefore, the data of the variables were separated into five equal-sized parts (20% quantiles). In addition to filtering noise, the advantage of this transformation is based on rendering the different variables comparable.
Cross-correlation analyses
Cross-correlation is one of the most common metrics used to align time-series data [36]. To identify whether one variable leads before another, standard cross-correlation coefficients of the discretized profiles were calculated patient-wise and averaged for all patients. Therefore, average lead-lag coefficients were the result of cross-correlation of each variable against all others. Variables were ordered by median lead-lag coefficients. Details of cross-correlation analyses can be found in the Supplementary Material.
Bootstrapping estimates
Lead-lag analyses were assessed by calculating bootstrapping estimates. Bootstrapping was used to estimate the internal validity. To perform resampling, time-profiles of each patient were shuffled, followed by reanalysis. Therefore, lead-lag coefficients were recalculated for 1000 resampling replications. For each variable, a normal distribution was fitted to the corresponding resampling using median lead-lag coefficients. The Shapiro-Wilk test was used to determine the normality of the variables. The estimated normal distribution was used to calculate the p value of a given variable. The Benjamini-Hochberg procedure was used to correct for multiple testing. Significance is indicated by an asterisk: *p value < 0.05; **p value < 0.01; and ***p value < 0.001. The null hypothesis was that the median lead-lag coefficient was due to chance. A significant p value indicated non-randomness. In addition, a p value was calculated for the complete lead-lag analysis. Therefore, the variance of the original median lead-lag coefficients was compared with the variance of 1000 resamples. A fitted normal distribution using these 1000 resampled variances (background distribution) was used to calculate the p value for non-randomness.
Interpretation of the differences in medians for lead-lag coefficients
Since our lead-lag analysis was customized especially for this study, we do not have a good reference for interpreting the absolute values of the median lead-lag coefficients. However, resampling was applied to overcome this issue. This method provides a reference for what could be expected from random data. A significant p value indicated non-randomness. Therefore, in the current manuscript, we did not assess the absolute values of the median lead-lag coefficients but rather the ordering of the items. Together with resampling, we are in the opinion that this is the appropriate manner of interpreting results.
RESULTS
Patient characteristics
Of the 351 patients with mild AD from the DAP cohort, 164 were eligible for the study (Fig. 1). Complete outcome measures or <10% of missing values at baseline, 12 months, and 24 months of follow-up were available from these patients (Fig. 1). Of the 164 patients with mild AD, clinical deterioration was identified in 86 patients, with a CDR-SOB ≥2 within 24 months (Δ MMSE 5.8±8.64; Δ CDR-SOB 4.32±4.03). These patients were termed moderate progressors and selected for subsequent analyses. Demographic and clinical characteristics of the subcohorts at baseline are depicted in Table 1 and Supplementary Table 1. Differences between the study sample and the DAP study population (AD patients only) were identified for several cognitive and functional variables, however, not for demographic variables (Table 1 and Supplementary Table 1).
Fig.1
Study flow of dementia patients of the DAP study population. AD, Alzheimer’s disease dementia; DAP, Diagnostic and prognostic study.
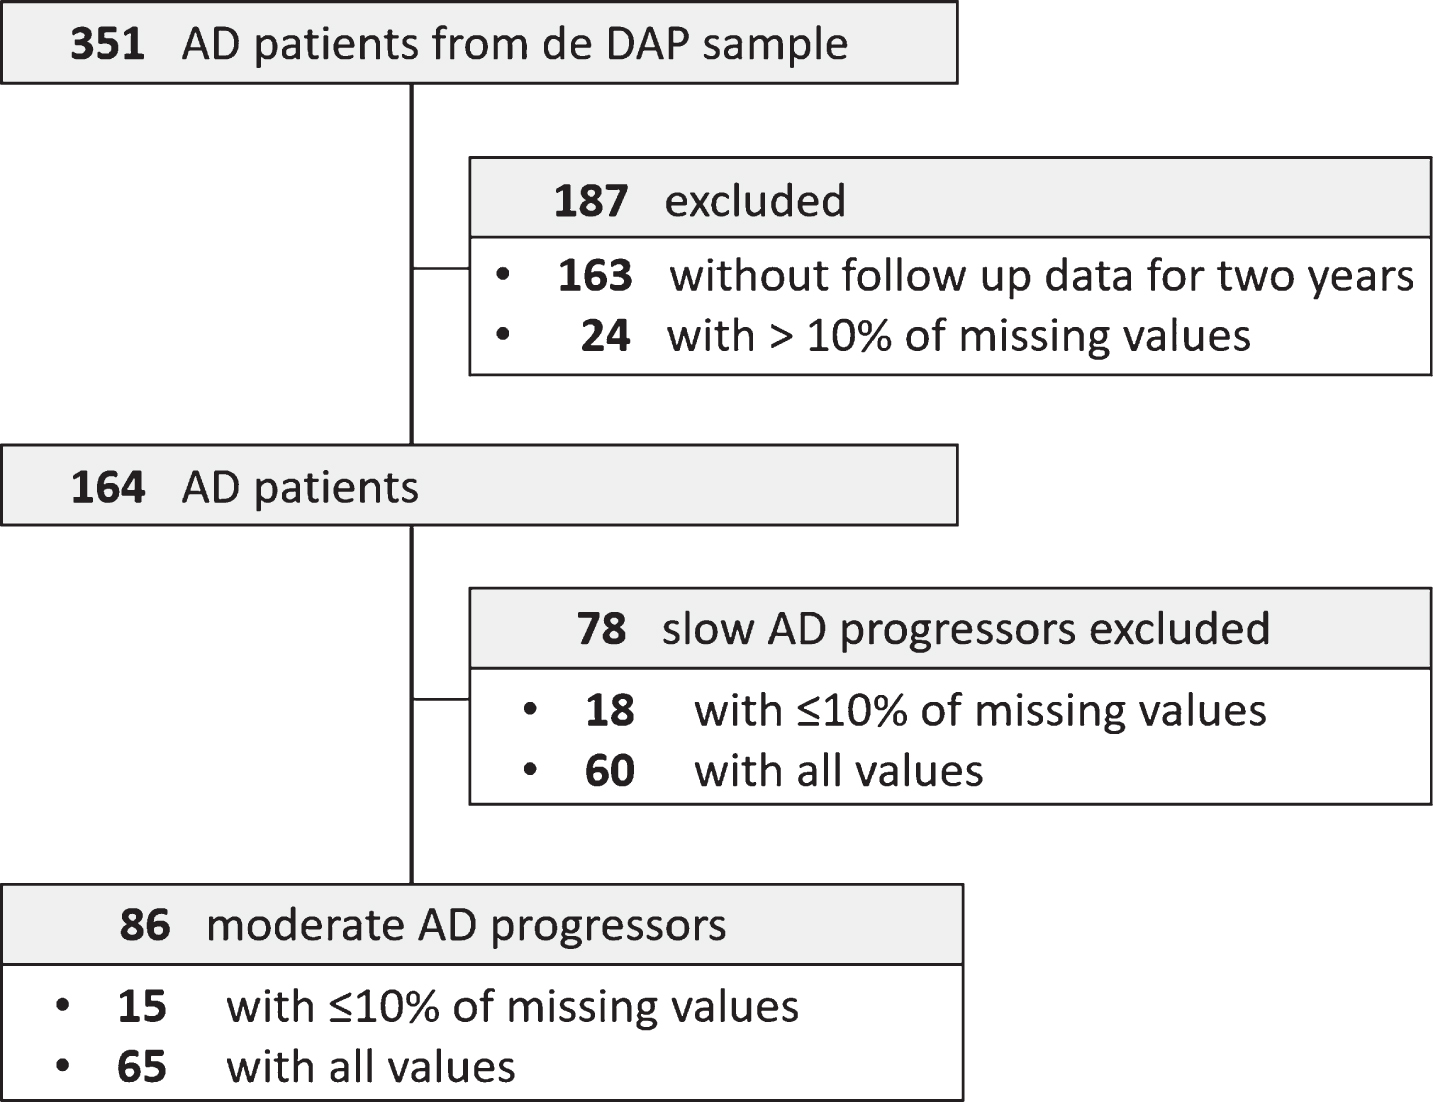
Table 1
Demographic and clinical characteristics at baseline
| Slow AD progressors | Moderate AD progressors | p | AD patients from the DAP study | p | |
| n = 78 | n = 86 | n = 351 | |||
| Age | 69 (7.76) | 72.3 (8.26) | < 0.05 | 72.8 (8.30) | 0.59 |
| Female % | 57.69% | 47.67% | 0.27 | 45.46 % | 0.99 |
| Education (y) | 9.06 (1.96) | 9.45 (1.92) | 0.27 | 9.23 (1.98) | 1 |
| MMSE | 24.6 (2.49) | 23.3 (3.09) | < 0.01 | 22.7 (3.25) | < 0.05 |
| CDR (SOB) | 4.53 (1.35) | 4.32 (1.37) | 0.39 | 4.87 (1.57) | 0.14 |
| CDT | 2.53 (1.12) | 2.76 (1.15) | 0.27 | 3.03 (1.18) | 0.09 |
| B-ADL (TS) | 3.76 (1.69) | 3.96 (2.09) | 0.57 | 4.64 (2.10) | < 0.05 |
AD, Alzheimer’s disease dementia; B-ADL (TS), Bayer-activities of daily living (total score); CDR (SOB), Clinical Dementia Rating Scale (sum of boxes); CDT, Clock Drawing Test; DAP, Diagnostic and prognostic study; MMSE, Mini-Mental State Examination; y, years.
Some functional skills deteriorate early in moderate progressors
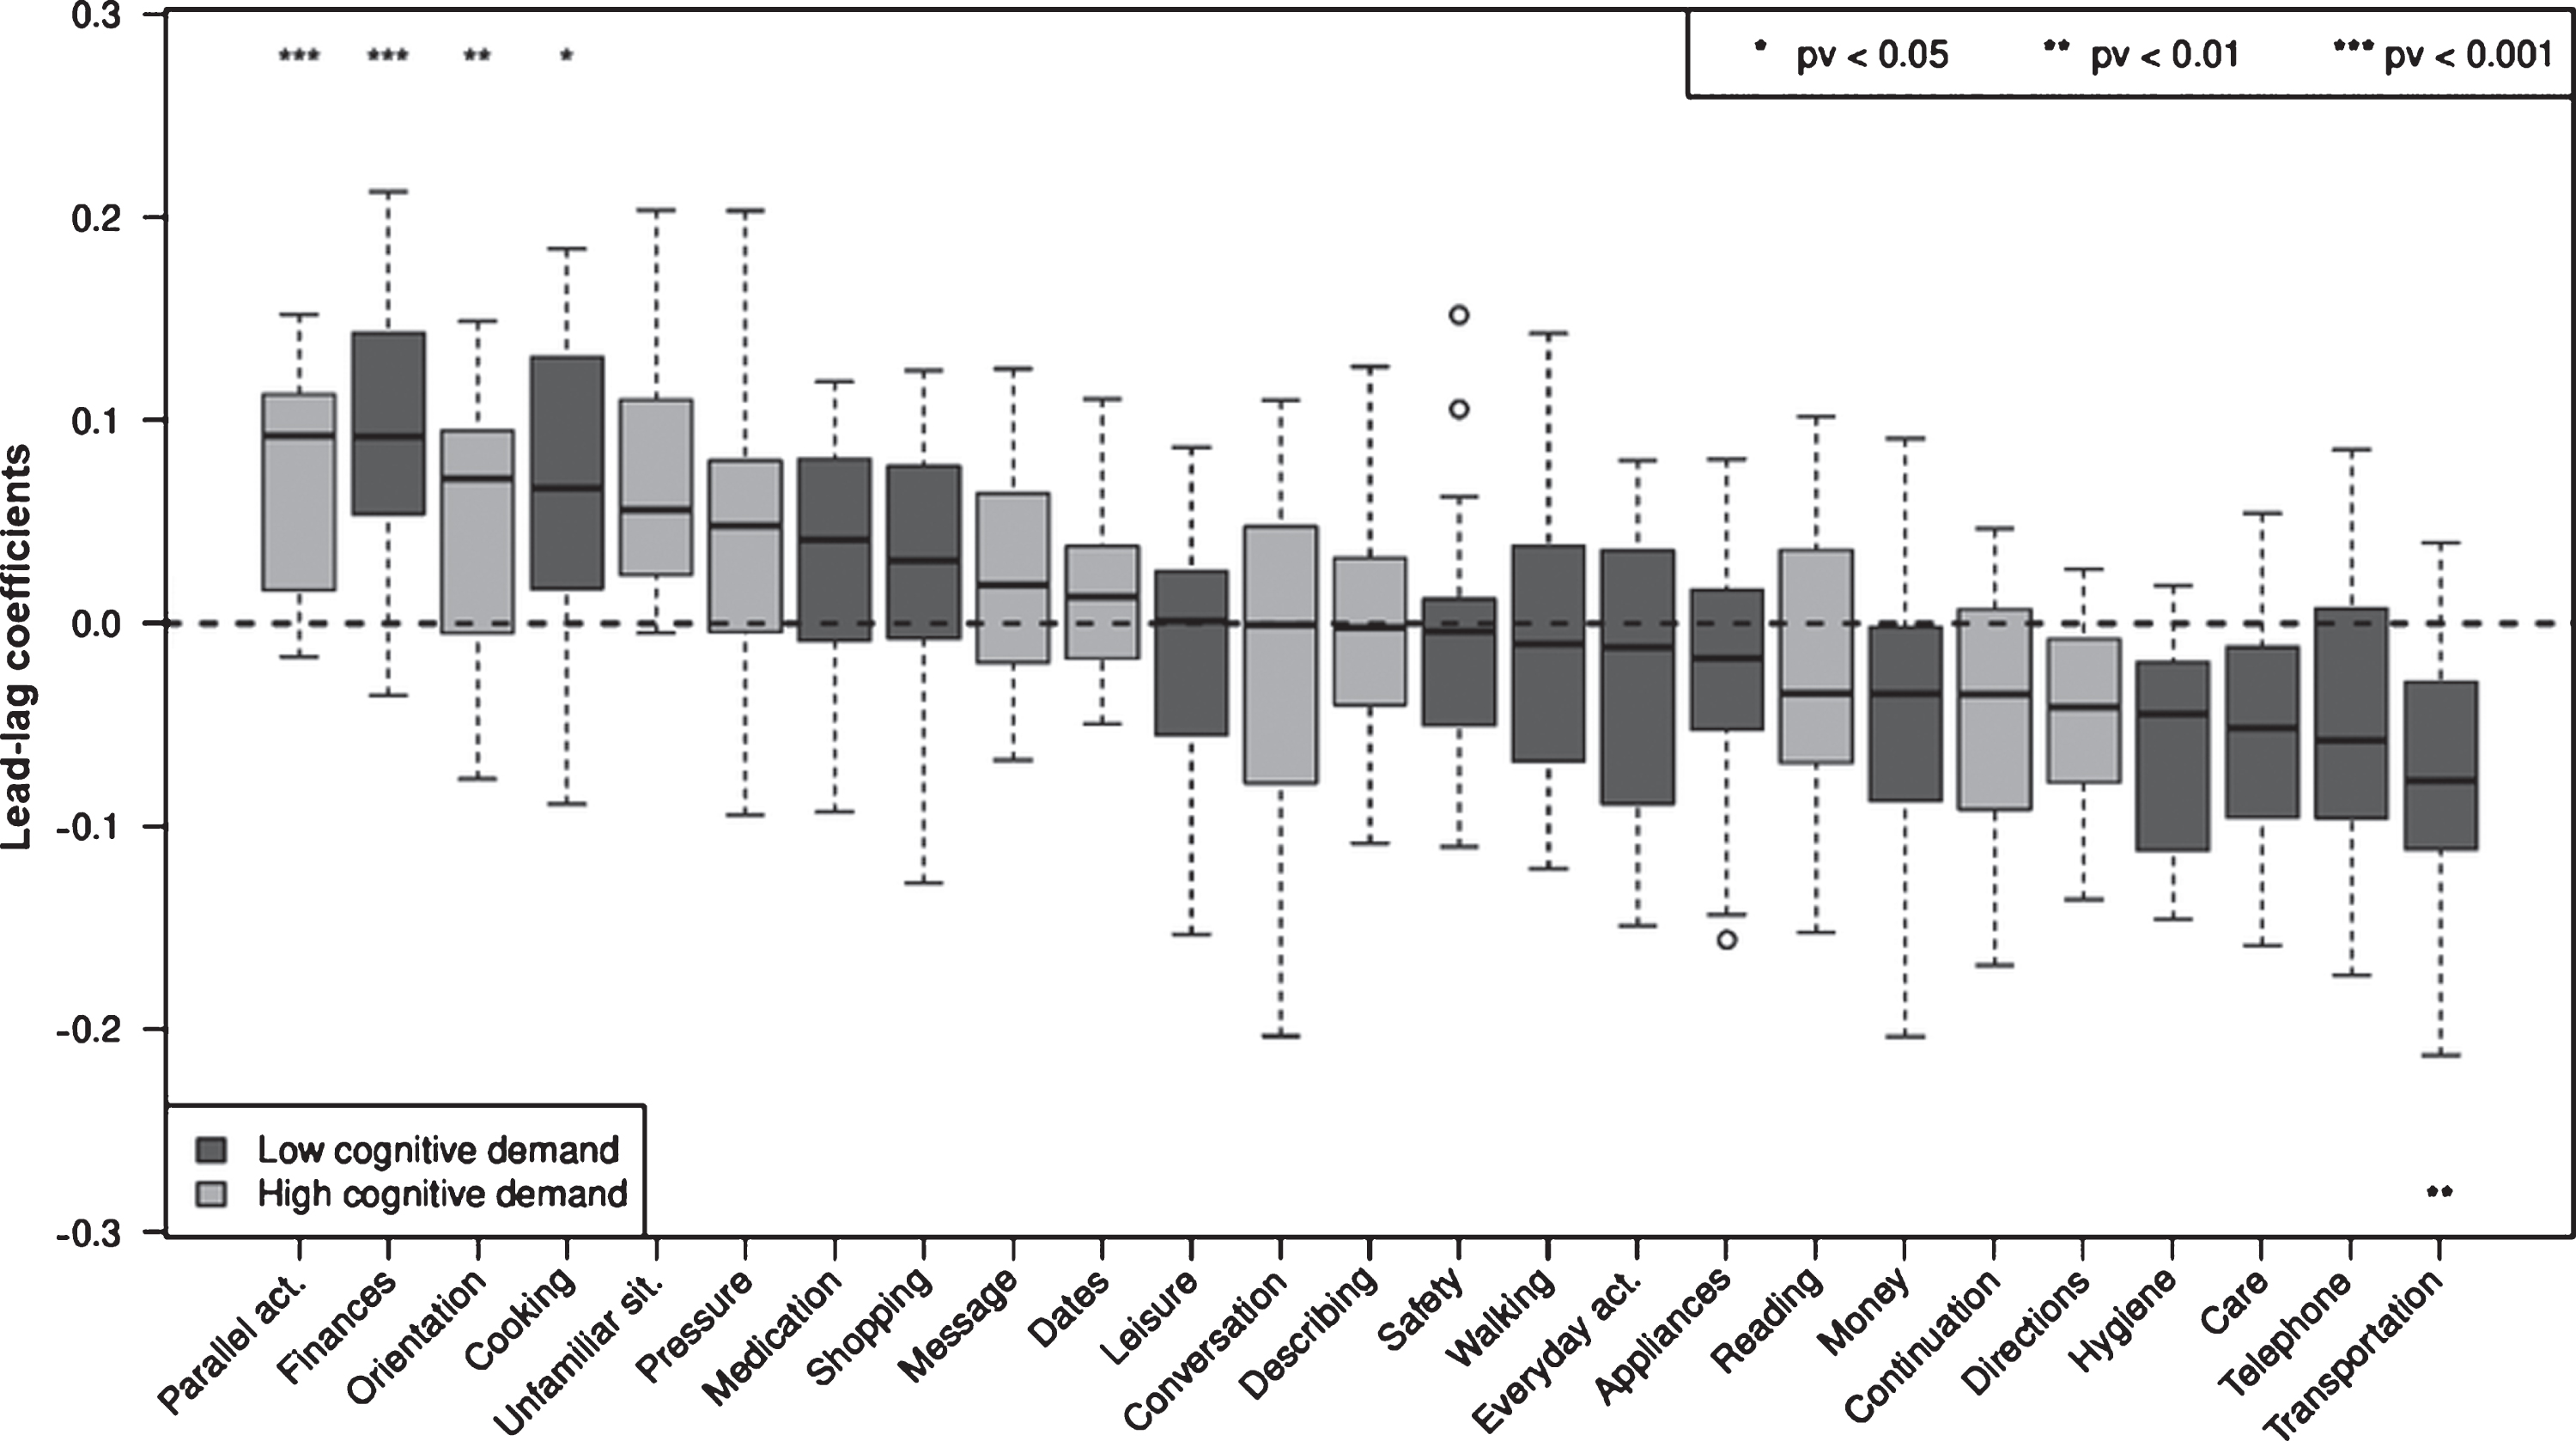
Cross-correlation analysis results ranking B-ADL items in leading and lagging clinical changes are shown in Fig. 2. In the first lead-lag analysis, changes (i.e., decline) in the four B-ADL items “parallel activities” (p < 0.001), “finances” (p < 0.001), “orientation” (p < 0.01), and “cooking” (p < 0.05) preceded all other B-ADL items. p values were calculated with resampling. Additionally, the six B-ADL items “unfamiliar situation”, “pressure”, “medication”, “shopping”, “message”, and “dates” had median lead-lag coefficients above zero (Fig. 2). Using bootstrapping estimates, the p value for complete lead-lag analysis was <0.001.
Fig.2
Box plots of average lead-lag coefficients comprising individual B-ADL items: moderate AD progressors. Each box is composed of 24 values. Items are ordered by median lead-lag coefficients. A change in items with positive and high lead-lag coefficients occurs earlier in moderate AD progressors. p values were calculated with resampling. Using a bootstrapping estimate, the p value for complete lead-lag analysis was <0.001. Appliances, using domestic appliances; care, self-care; continuation, task persistence following a brief interruption; conversation, participation; cooking, ability to prepare food; dates, observing important dates or events; describing, outlining what was observed or heard; directions, ability to provide directions upon questioning; everyday, managing daily activities; finances, understanding personal financial affairs; hygiene, personal hygiene; leisure, participating in leisure activities; medication, self-medication; message, taking a message for another individual; money, correct counting; orientation, finding the way in an unfamiliar setting; parallel act., synchronous task management; pressure, performing a task under pressure; reading, concentration; safety, taking precaution; shopping, ability to purchase items; telephone, ability to use; transportation, ability to use; unfamiliar situation, coping with unknown circumstances; and walking, taking a walk without getting lost.
The 10 leading B-ADL items with median lead-lag coefficients above zero were included in a B-ADL composite score (B-ADL LEAD), whereas the remaining 15 items were included in a second composite score (B-ADL LAG). Next, we analyzed whether imminent marked clinical deterioration is preceded by changes in the B-ADL LEAD composite score or in classical cognitive tests.
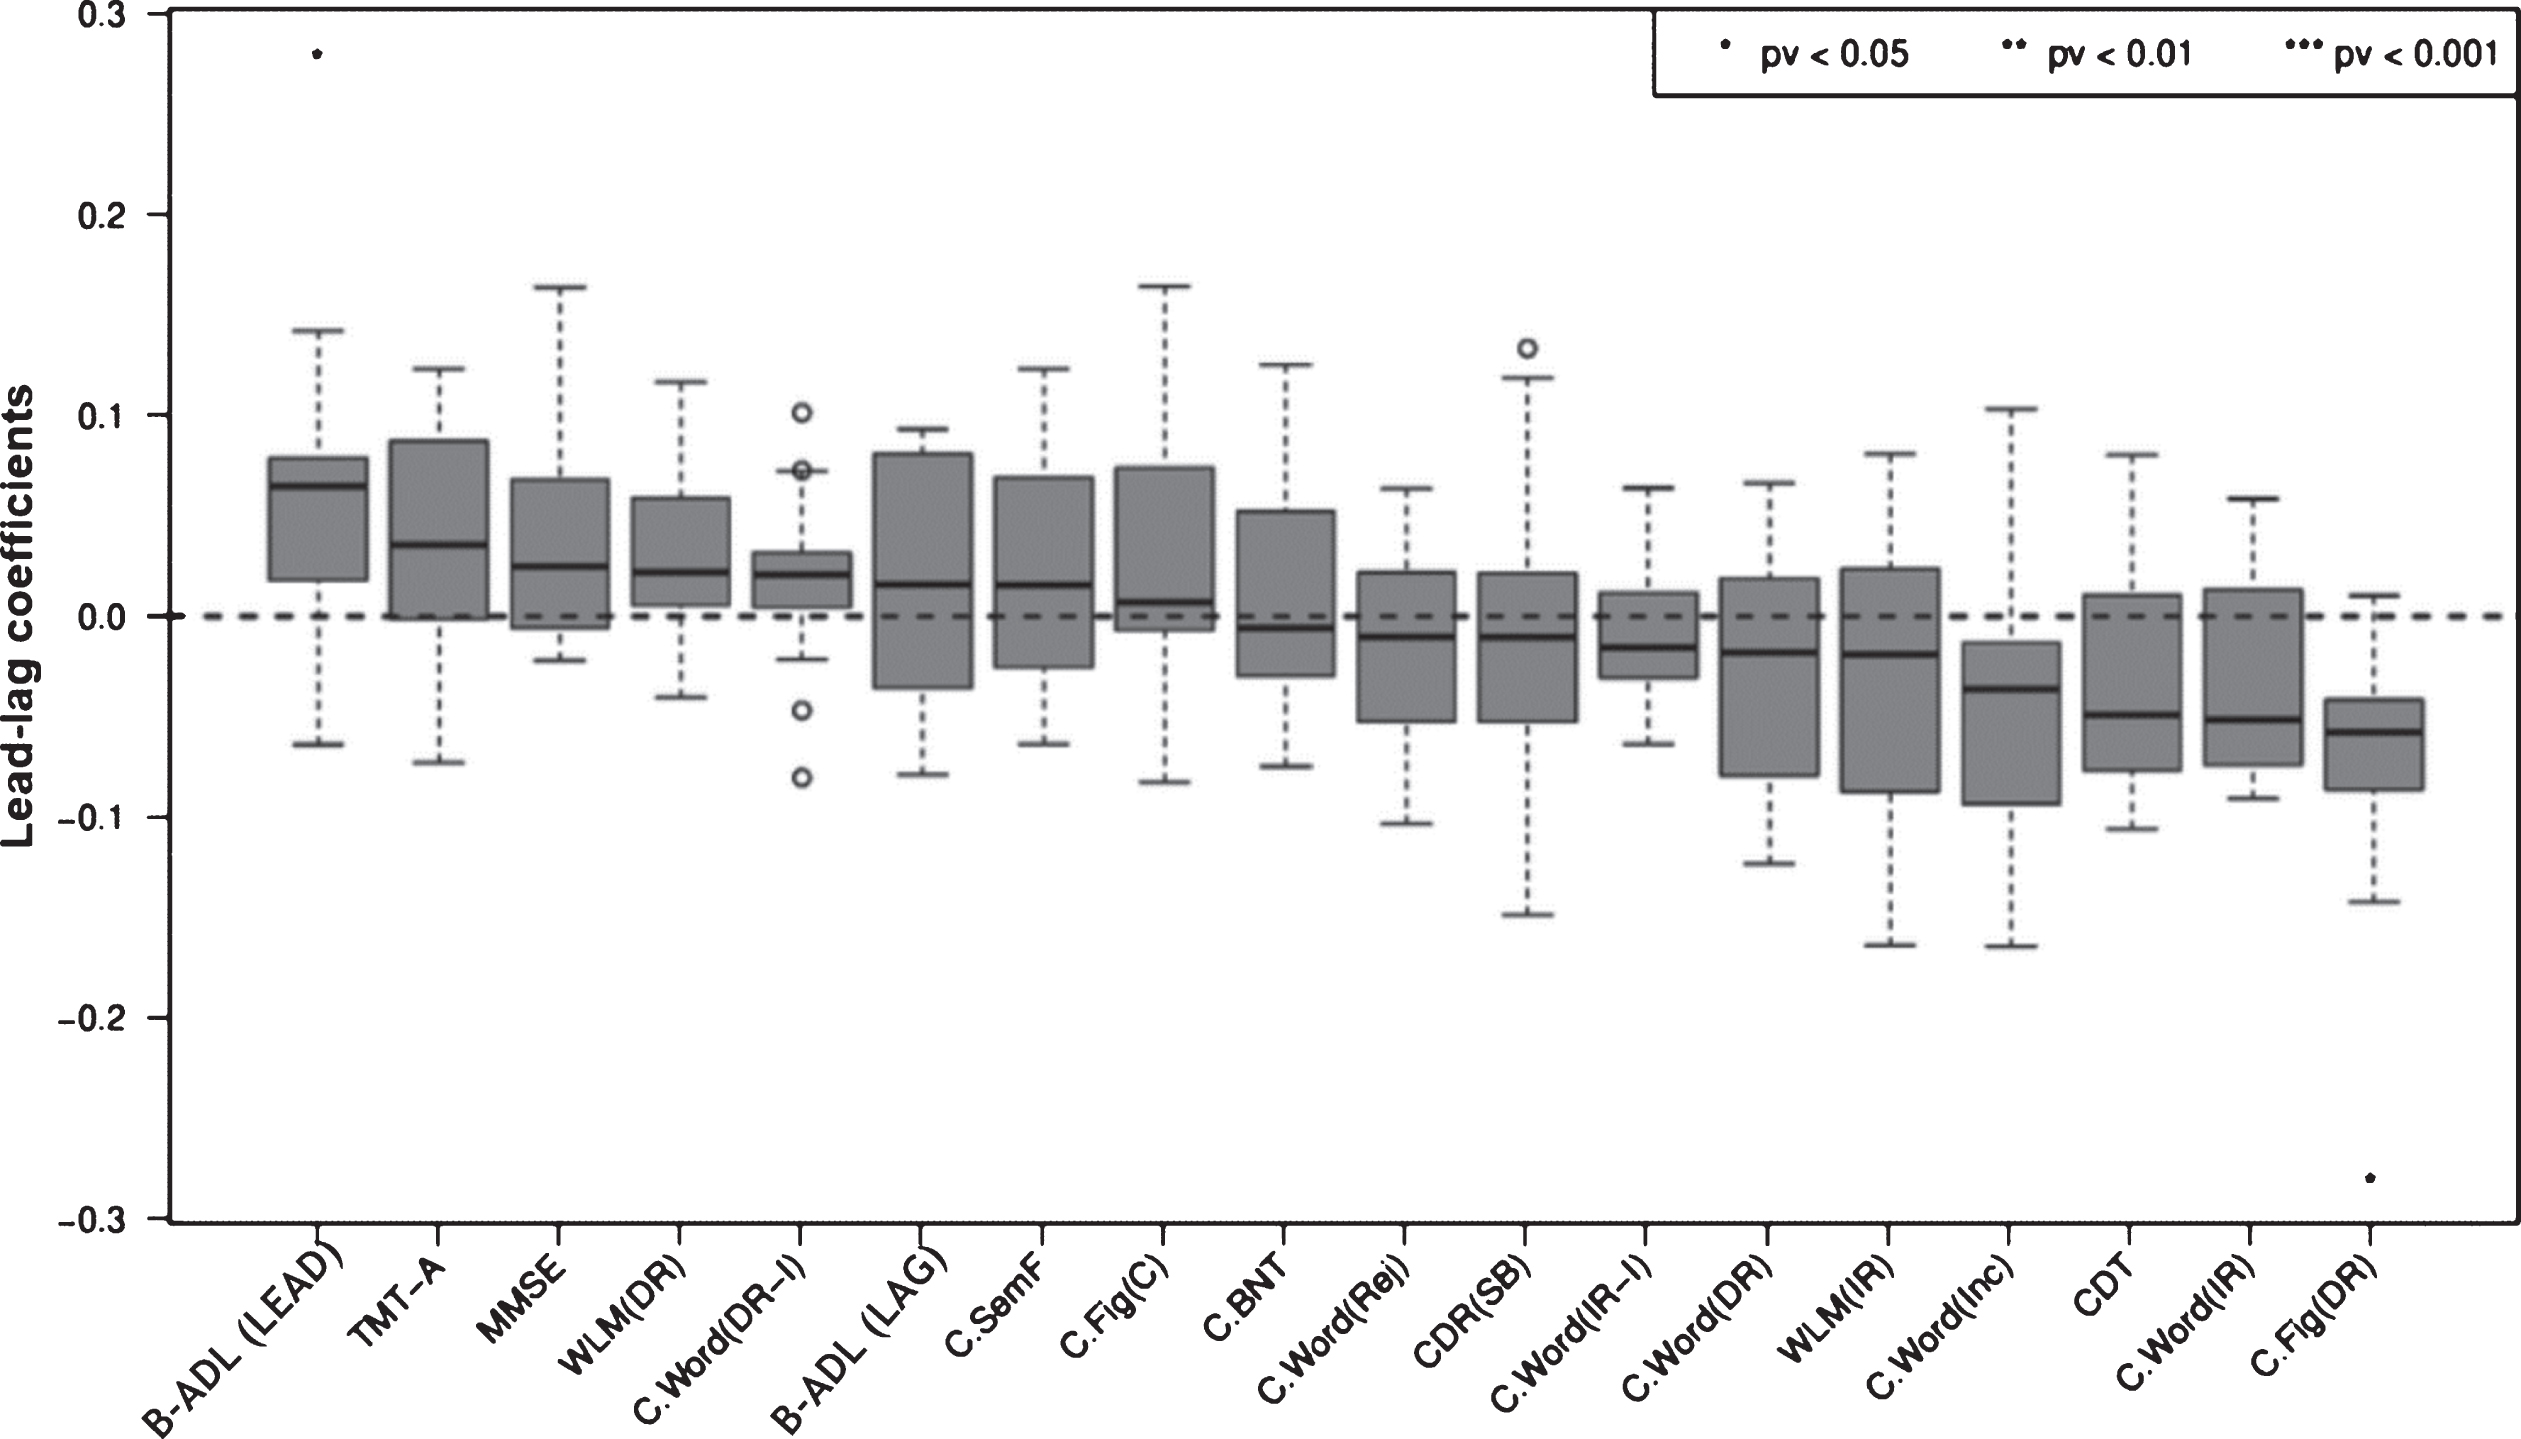
Lead-lag analysis comprising classical cognitive variables, as well as the B-ADL (LEAD) and (LAG) composite scores, demonstrated the B-ADL (LEAD) to be ranked first (p < 0.05), followed by TMT-A, MMSE, WMS-R delayed logical memory, Word list (delayed recall, intrusions), B-ADL (LAG), Semantic fluency (animals), and Figure constructional praxia (copy), which were not significant for all variables (Fig. 3). Using bootstrapping estimates, the p value for the complete lead-lag analysis was <0.01.
Fig.3
Box plots of average lead-lag coefficients comprising the B-ADL (LEAD) and (LAG) composite scores, as well as cognitive variables: moderate AD progressors. Each box is composed of 17 values. Variables are ordered by median lead-lag coefficients. A change in variables with positive and high lead-lag coefficients occurs earlier in moderate AD progressors. p values were calculated with resampling. Using a bootstrapping estimate, the p value for complete lead-lag analysis was 0.000892. B-ADL (LEAD), Bayer-activities of daily living (i.e., B-ADL items with median lead-lag coefficients >0); B-ADL (LAG), Bayer-activities of daily living (i.e., B-ADL items with median lead-lag coefficients <0); C.BNT, CERAD. 15-Item Version of the Boston Naming Test; C. Fig (C), CERAD. Figure constructional praxia (copy); C. Fig (DR), CERAD. Figure constructional praxia (delayed recall); C. SemF, CERAD. Semantic fluency (animals); C. Word(DR), CERAD. Word list (delayed recall); C. Word (DR-I), CERAD. Word list (delayed recall, intrusions); C. Word (Inc), CERAD. Word list (recognition task, correct inclusions); C. Word (IR), CERAD. Word list (immediate recall).; C. Word (IR-I), CERAD. Word list (immediate recall, intrusions); C. Word (Rej), CERAD. Word list (recognition task, correct rejections); CDR (SB), Clinical Dementia Rating Scale (sum of boxes); CDT, Clock Drawing Test; MMSE, Mini-Mental State Examination; TMT-A, Trail Making Test A; WLM (DR), Wechsler Memory Scale-Revised (delayed recall, logical memory); WLM (IR), Wechsler Memory Scale-Revised (immediate recall, logical memory).
As the B-ADL measures (i.e., LEAD, LAG, total score as well as the composite scores described by Reppermund and colleagues [15, 16], namely high cognitive demand and low cognitive demand) share several individual items, their correlation could favor individual median lead-lag coefficients and, therefore, leading positions in a general lead-lag analysis comprising all B-ADL, as well as classical cognitive measures. To prevent this effect and indirectly examine the consistency of our results, individual lead-lag subanalyses were performed. The first subanalysis included the B-ADL total score and all cognitive variables (Supplementary Figure 1). The second subanalysis included the B-ADL high cognitive demand factor, low cognitive demand factor, and all cognitive variables (Supplementary Figure 2).
All lead-lag analyses comprising B-ADL and cognitive variables showed similar results except for a few subtle changes in the temporal order of several measures. These variations were due to minimal differences between several median lead-lag coefficients. All B-ADL variables exhibited positive median lead-lag coefficients and leading positions for several variables. In the first subanalysis, the B-ADL total score ranked first, followed by the TMT-A and MMSE, with results not significant for all variables. Using bootstrapping estimates, the p value for the complete lead-lag analysis was <0.05 (Supplementary Figure 1). In the second subanalysis, the B-ADL low cognitive demand factor ranked fourth, followed by Word list (delayed recall, intrusions) and the B-ADL high cognitive demand factor. These variables were preceded by the TMT-A, MMSE, and Figure constructional praxia (copy), with all variables not significant. Using bootstrapping estimates, the p value for complete lead-lag analysis was 0.01 (Supplementary Figure 2). A comparison of the results of all lead-lag analyses comprising B-ADL and cognitive variables demonstrated the following ranking: 1) B-ADL (LEAD), 2) B-ADL total score, 3) TMT-A, and 4) MMSE. Although the B-ADL (LEAD) and the B-ADL total score are in the first position (Fig. 3 and Supplementary Figure 1), the median lead-lag coefficient of the B-ADL (LEAD) is both significant and higher than that of the B-ADL total score when compared to the respective analyses of the remaining variables. The WMS-R delayed logical memory, Word list (delayed recall, intrusions), Semantic fluency (animals), and Figure constructional praxia (copy) were among the lagging variables in all lead-lag analyses, while the Figure constructional praxia (delayed recall) (p < 0.05; Supplementary Figure 2), Word list (immediate recall), Word list (recognition task, correct inclusions), and CDT consistently demonstrated a lagging position.
DISCUSSION
To the best of our knowledge, the present study reports the first lead-lag analysis examining change over time in instrumental ADL and standard cognitive measures in mild AD. A cascade of changes in items belonging to the B-ADL (LEAD) composite score occurs earlier in moderate AD progressors than changes in the B-ADL high cognitive demand factor score, the B-ADL total score, and the cognitive test scores examined. Therefore, we propose this subset of B-ADL items as a highly targeted tool to detect impending clinical deterioration in mild AD patients. Moreover, after corroboration in an independent data set, the B-ADL (LEAD) subscale could be implemented as an outcome measure in intervention studies instead of the overall B-ADL scale.
The indicative value for subsequent marked clinical deterioration showed by the high cognitive demand factor proposed by Reppermund and colleagues [15, 16] was found to be limited. Accordingly, items such as ‘direction’, ‘continuation’, or ‘reading’ were observed to be lagging in the analysis of single B-ADL item measures. This result may be due to two reasons. First, the analysis by Reppermund and was conducted on samples comprising cognitively normal participants and MCI patients. In contrast, the present study included individuals at an early stage of AD that demonstrated far more functional deficits at the baseline evaluation. Second, Reppermund and colleagues based their analyses on predictions concerning deficit severity at baseline rather than exploring the temporal sequence of change in the high cognitive demand factor score over time. Despite this finding and the clear leading position exhibited by the B-ADL (LEAD) composite score, all other B-ADL measures, especially the B-ADL total score, showed positive median lead-lag coefficients. Collectively, these results support the importance of analyzing longitudinal changes in functional abilities over a short period as a reliable measure preceding short-term, marked clinical deterioration in mild AD.
Investigation of the temporal sequence of change over time in single B-ADL items measures revealed changes in instrumental activities with high executive functioning, processing speed, and memory demand preceding subsequent short-term, marked clinical deterioration. In contrast, a change in several activities based on automatism or procedural memory processes with low executive functioning demand showed lagging positions (Fig. 2). Similarly, for cognitive measures, short-term, marked clinical deterioration in mild AD was found to be preceded by a change in tests, such as the TMT-A, which mainly requires executive functioning and cognitive processing speed [21, 37]. In fact, these cognitive domains are involved in many higher-order processes, which reflect general cognitive integrity [21], and could explain their early vulnerability to change before short-term marked clinical deterioration. Previous stepwise logistic models with mild AD patients showed that the TMT-A was able to best discriminate faster from slower progressors, with an overall accuracy of 68% [21]. Furthermore, multivariate analyses with cognitively healthy, MCI, and AD individuals revealed the TMT-A to be a significant predictor of daily functioning [38]. In the present study, the MMSE score was observed to change early in short-term, marked disease progression. Considering its cost-effectiveness and sensitivity, this global cognitive functioning measure serves as one of the most effective instruments for monitoring patients with AD over time [1, 9, 10]. Our results also support previous reports that changes in the WMS-R delayed logical memory [31], visuospatial construction [39] and semantic fluency [40] scores are suggestive of disease progression in mild AD.
The similar dynamic of change reflected in both lead-lag subanalyses (Supplementary Figures 1 and 2), in conjunction with the statistical significance of the entire analyses robustly supported by bootstrapping with 1000 replicates, added internal validity to the study and suggested the lack of randomness of the results. Moreover, in further analyses, lead-lag analysis was performed using both slow and moderate progressors (Supplementary Figure 3). Although the B-ADL (LEAD) was preceded by the MMSE, TMT-A, and WMS-R delayed logical memory, this composite score showed a leading position and a high and positive median lead-lag coefficient, supporting its vulnerability to disease progression in mild AD.
In addition to these findings, we present a new approach capable of analyzing disease progression in AD from another perspective, which could complement classical methods primarily based on predictions. Furthermore, since slight changes in functional and cognitive measures occur within the Alzheimer’s continuum before values considered severe or very severe are attained, our temporal analysis of change may help detect individuals at risk of marked clinical deterioration in the short-term at an even earlier stage. Of note, none of the study participants demonstrated an improvement in any variable over time. Therefore, in the current study, change refers to decline or clinical deterioration. Despite exhibiting several similarities with moderate AD progressors, slow AD progressors showed a different pattern of change in cognitive and functional variables, as revealed by supplementary lead-lag analyses (Supplementary Figure 4).
Several limitations must be considered when interpreting the findings of this study. First, transforming the change within variables and participants over time into a rank-order classification of change was necessary. Accordingly, we performed cross-correlation analyses on an ordinal scale. Therefore, information related to questions on the differential effects of the raw score magnitude of change or the severity of the deficits is lacking. Conversely, this transformation reduced the information within the data to only the most necessary. Despite this limitation, bootstrap estimates with 1000 replications added internal validity to our lead-lag analyses. Second, the retrospective selection of moderate decliners was most likely biased. The demographic and neuropsychological differences between slow and moderate progressors at baseline (Table 1 and Supplementary Table 1) support this assumption. Moreover, we subdivided the AD collective by change in CDR-SOB, concurrently applying this variable in lead-lag analyses. This enable exploration of whether the identified variables preceding short-term marked clinical deterioration in mild AD could be implemented after corroboration in an independent data set as potential predictors of pronounced disease progression in further analyses. Third, we compared different lead-lag analyses and indirectly rank-ordered changes in functional and cognitive variables in a general classification. Since a collective comparison in a general lead-lag analysis was not possible due to methodological issues, the conclusions of the inferred ranking are hypothetical. Fourth, although such measures fall far short of the objective of our preliminary analysis and can be verified in further studies, the 10 B-ADL (LEAD) items were not utilized in an independent data set. Furthermore, confirmatory factor analysis was not performed reliably to examine whether the two-domain structure by Reppermund and colleagues [15, 16] was present in the current study. Fifth, as the TMT-B was not included in further analyses due to methodological issues, we could not analyze the TMT B-A time or TMT B/A ratio, which provides a relatively pure indicator of executive control [41]. However, we have used several cognitive variables involving executive functions to a greater or lesser extent. Sixth, only data from baseline and follow-ups were collected. Although a higher number of longitudinal evaluations would have improved the temporal order analysis of our variables, the present study reflects the clinical setting. Seventh, regarding functionality, informants vary in their actual contact with the participants and in their capability to provide valid information. Therefore, we could not establish the validity of the informants’ reports [15]. However, as all intra-individual analyses were performed with the same informants at all visits, the possible effect of individual variability is minimized. Eighth, three baseline scores were found to significantly differ between our study sample and the DAP study population (Supplementary Table 1). However, these were only of minor relevance for the lead-lag analyses, which was conducted on within subject data. Furthermore, these differences were presumably due to our exclusion criteria concerning missing data and/or follow-up assessments. We hypothesize that the AD patients from the DAP study who did not meet our inclusion criteria demonstrated a lower performance at baseline. The exclusion of these patients likely resulted in a slight improvement of the three baseline scores.
In conclusion, short-term clinical deterioration in mild AD is initially preceded by changes (i.e., decline) in a well-defined set of activities of daily living (ADL) and not in classical cognitive measures. As ADL are sustained by multiple cognitive domains, we hypothesize that these activities are more vulnerable to imminent marked clinical deterioration than classical cognitive measures. The results of this study add evidence to the importance of analyzing longitudinal changes in functional abilities as a reliable measure to detect short-term clinical deterioration in mild AD. Changes in the TMT-A and MMSE should also be interpreted as a marker of short-term, pronounced clinical deterioration. Implementation of the identified items and tests might enable a delay in the progression of the dependence stage by enforcing clinical and psychosocial interventions far in advance. Further research employing the outlined methodology and longer longitudinal designs with cognitively intact individuals is required to assess the temporal order of functional and cognitive change before MCI and dementia stages.
ACKNOWLEDGMENTS
The German Federal Ministry of Education and Research (BMBF) is gratefully acknowledged for its financial support (01GI0420). This study was also supported by the German Centre for Neurodegenerative Diseases (DZNE). We thank all patients and their caregivers, as well as all co-workers of the German Dementia Competence Network centers who participated in the DAP study. We also wish to thank our colleagues of the Charité-Universitätsmedizin Berlin Memory Clinic for discussions and comments concerning the manuscript.
Authors’ disclosures available online (https://www.j-alz.com/manuscript-disclosures/20-0230r2).
SUPPLEMENTARY MATERIAL
[1] The supplementary material is available in the electronic version of this article: https://dx.doi.org/10.3233/JAD-200230.
REFERENCES
[1] | Barocco F , Spallazzi M , Concari L , Gardini S , Pelosi A , Caffarra P ((2017) ) The progression of Alzheimer’s disease: Are fast decliners really fast? a four-year follow-up. J Alzheimers Dis 57: , 775–786. |
[2] | Cornelis E , Gorus E , Beyer I , Bautmans I , De Vriendt P ((2017) ) Early diagnosis of mild cognitive impairment and mild dementia through basic and instrumental activities of daily living: Development of a new evaluation tool. PLoS Med 14: , e1002250. |
[3] | Harrison JE , Rentz DM , Brashear HR , Arrighi HM , Ropacki MT , Liu E ((2018) ) Psychometric evaluation of the neuropsychological test battery in individuals with normal cognition, mild cognitive impairment, or mild to moderate Alzheimer’s disease: Results from a longitudinal study. J Prev Alzheimers Dis 5: , 236–244. |
[4] | Brodaty H , Green A , Koschera A ((2003) ) Meta-analysis of psychosocial interventions for caregivers of people with dementia. J Am Geriatr Soc 51: , 657–664. |
[5] | Charras K , Dramé M ((2020) ) Treatment indications in clinical practice and applied research on psychosocial interventions for people with dementia. Am J Alzheimers Dis Other Demen 35: , 1533317519859213. |
[6] | Volpe U , Amin H , Ayinde OO , Burns A , Chan WC , David R , Dejanovic SD , Djokic G , Eraslan D , Fischer GAL , Gracia-García P , Hamdani SU , Han C , Jafri H , Kallivayalil RA , Kriekaart RL , Kua EH , Lam LCW , Lecic-Tosevski D , Leroi I , Lobo A , Mihai A , Minhas FA , Mistry H , Ogundele AT , OldeRikkert MGM , Olivera J , Palumbo C , Parker A , Pejuskovic B , Riese F , Robert P , Semrau M , Stoppe G , Sudhakar S , Tirintica AR , Tofique S , Tsoi C , Wolski L , Yalug I , Wang H , Yu X , Sartorius N ((2020) ) Pathways to care for people with dementia: An international multicentre study. Int J Geriatr Psychiatry 35: , 163–173. |
[7] | Malek-Ahmadi M , Chen K , Davis K , Belden CM , Powell J , Jacobson SA , Sabbagh MN ((2015) ) Sensitivity to change and prediction of global change for the Alzheimer’s Questionnaire. Alzheimers Res Ther 7: , 1. |
[8] | Wattmo C , Minthon L , Wallin ÅK ((2016) ) Mild versus moderate stages of Alzheimer’s disease: Three-year outcomes in a routine clinical setting of cholinesterase inhibitor therapy. Alzheimers Res Therapy 8: , 7. |
[9] | Kim J , Na HK , Byun J , Shin J , Kim S , Lee BH , Na DL ((2017) ) Tracking cognitive decline in amnestic mild cognitive impairment and early-stage Alzheimer dementia: Mini-mental state examination versus neuropsychological battery. Dement Geriatr Cogn Disord 44: , 105–117. |
[10] | Li F , Takechi H , Kokuryu A , Takahashi R ((2017) ) Longitudinal changes in performance on cognitive screening tests in patients with mild cognitive impairment and Alzheimer disease. Dement Geriatr Cogn Disord Extra 7: , 366–373. |
[11] | Veitch DP , Weiner MW , Aisen PS , Beckett LA , Cairns NJ , Green RC , Harvey D , Jack CR , Jagust W , Morris JC , Petersen RC , Saykin AJ , Shaw LM , Toga AW , Trojanowski JQ ((2019) ) Understanding disease progression and improving Alzheimer’s disease clinical trials: Recent highlights from the Alzheimer’s Disease Neuroimaging Initiative. Alzheimers Dement 15: , 106–152. |
[12] | McDade E , Wang G , Gordon BA , Hassenstab J , Benzinger TLS , Buckles V , Fagan AM , Holtzman DM , Cairns NJ , Goate AM , Marcus DS , Morris JC , Paumier K , Xiong C , Allegri R , Berman SB , Klunk W , Noble J , Ringman J , Ghetti B , Farlow M , Sperling RA , Chhatwal J , Salloway S , Graff-Radford NR , Schofield PR , Masters C , Rossor MN , Fox NC , Levin J , Jucker M , Bateman RJ , for the Dominantly Inherited Alzheimer Network ((2018) ) Longitudinal cognitive and biomarker changes in dominantly inherited Alzheimer disease. Neurology 91: , e1295–e1306. |
[13] | Dowling NM , Bolt DM , Deng S ((2016) ) An approach for estimating item sensitivity to within-person change over time: An illustration using the Alzheimer’s disease assessment scale-cognitive subscale (ADAS-Cog). Psychol Assess 28: , 1576–1585. |
[14] | van Loenhoud AC , van der Flier WM , Wink AM , Dicks E , Groot C , Twisk J , Barkhof F , Scheltens P , Ossenkoppele R , for the Alzheimer’s Disease Neuroimaging Initiative ((2019) ) Cognitive reserve and clinical progression in Alzheimer disease: A paradoxical relationship. Neurology 93: , e334–e346. |
[15] | Reppermund S , Sachdev PS , Crawford J , Kochan NA , Slavin MJ , Kang K , Trollor JN , Draper B , Brodaty H ((2011) ) The relationship of neuropsychological function to instrumental activities of daily living in mild cognitive impairment. Int J Geriatr Psychiatry 26: , 843–852. |
[16] | Reppermund S , Brodaty H , Crawford JD , Kochan NA , Draper B , Slavin MJ , Trollor JN , Sachdev PS ((2013) ) Impairment in instrumental activities of daily living with high cognitive demand is an early marker of mild cognitive impairment: The Sydney Memory and Ageing Study. Psychol Med 43: , 2437–2445. |
[17] | Hindmarch I , Lehfeld H , de Jongh P , Erzigkeit H ((1998) ) The Bayer activities of daily living scale (B-ADL). Dement Geriatr Cogn Disord 9: Suppl 2, 20–26. |
[18] | Galasko D , Bennett D , Sano M , Ernesto C , Thomas R , Grundman M , Ferris S ((1997) ) An inventory to assess activities of daily living for clinical trials in Alzheimer’s disease. The Alzheimer’s Disease Cooperative Study. Alzheimer Dis Assoc Disord 11: Suppl 2, S33–S39. |
[19] | Kornhuber J , Schmidtke K , Frolich L , Perneczky R , Wolf S , Hampel H , Jessen F , Heuser I , Peters O , Weih M , Jahn H , Luckhaus C , Hüll M , Gertz HJ , Schröder J , Pantel J , Rienhoff O , Seuchter SA , Rüther E , Henn F , Maier W , Wiltfang J ((2009) ) Early and differential diagnosis of dementia and mild cognitive impairment. Dement Geriatr Cogn Disord 27: , 404–417. |
[20] | Morris JC ((1993) ) The Clinical Dementia Rating (CDR): Current version and scoring rules. Neurology 43: , 2412–2412. |
[21] | Parikh M , Hynan LS , Weiner MF , Lacritz L , Ringe W , Cullum CM ((2014) ) Single neuropsychological test scores associated with rate of cognitive decline in early Alzheimer disease. Clin Neuropsychol 28: , 926–940. |
[22] | Manning CA , Ducharme JK ((2010) ) Dementia syndromes in the older adult. In Handbook of Assessment in Clinical Gerontology (Second Edition), LichtenbergPA, ed. Academic Press, San Diego, pp. 155–178. |
[23] | Kikuchi M , Adachi N , Matsumaru N , Tsukamoto K ((2019) ) Current landscape of late-phase clinical trials for Alzheimer’s disease: Comparing regional variation between subjects in Japan and North America. Pharm Med 33: , 511–518. |
[24] | Thalmann B , Monsch AU , Bernasconi F , Berres M , Schneitter M , Ermini-Fünfschilling D , Spiegel R , Stähelin HB ((1997) ) CERAD - Consortium to Establish a Registry for Alzheimer’s Disease Assessment Battery [German Version]. Geriatrische Universitätsklinik, Basel. |
[25] | Härting C , Markowitsch HJ , Neufeld H , Calabrese P , Deisinger K , Kessler J ((2000) ) Wechsler Memory Scale - Revised. (WMS-R; Wechsler, D., 1987). [German Version]. |
[26] | Kessler J , Markowitsch HJ , Denzler PE ((2000) ) Mini-Mental-Status-Test (MMST) [German Version]. Beltz Test GMBH, Göttingen. |
[27] | Shulman KI , Pushkar Gold D , Cohen CA , Zucchero CA ((1993) ) Clock-drawing and dementia in the community: A longitudinal study. Int J Geriatr Psychiatry 8: , 487–496. |
[28] | Burgos-Robles A , Kimchi EY , Izadmehr EM , Porzenheim MJ , Ramos-Guasp WA , Nieh EH , Felix-Ortiz AC , Namburi P , Leppla CA , Presbrey KN , Anandalingam KK , Pagan-Rivera PA , Anahtar M , Beyeler A , Tye KM ((2017) ) Amygdala inputs to prefrontal cortex guide behavior amid conflicting cues of reward and punishment. Nat Neurosci 20: , 824–835. |
[29] | Dao TM , McGroarty F , Urquhart A ((2018) ) Ultra-high-frequency lead-lag relationship and information arrival. Quant Finance 18: , 725–735. |
[30] | Williams MM , Storandt M , Roe CM , Morris JC ((2013) ) Progression of Alzheimer’s disease as measured by clinical dementia rating sum of boxes scores. Alzheimers Dement 9: , S39–S44. |
[31] | Samtani M , Raghavan N , Novak G , Nandy P , Narayan VA ((2014) ) Disease progression model for Clinical Dementia Rating-sum of boxes in mild cognitive impairment and Alzheimer’s subjects from the Alzheimer’s Disease Neuroimaging Initiative. Neuropsychiatr Dis Treat 24: , 929–52. |
[32] | Hongisto K , Väätäinen S , Martikainen J , Hallikainen I , Välimäki T , Hartikainen S , Suhonen J , Koivisto AM ((2015) ) Self-rated and caregiver-rated quality of life in Alzheimer disease with a focus on evolving patient ability to respond to questionnaires: 5-year prospective ALSOVA cohort study. Am J Geriatr Psychiatry 23: , 1280–1289. |
[33] | Langkamp DL , Lehman A , Lemeshow S ((2010) ) Techniques for handling missing data in secondary analyses of large surveys. Acad Pediatr 10: , 205–210. |
[34] | Roberts MB , Sullivan MC , Winchester SB ((2017) ) Examining solutions to missing data in longitudinal nursing research. J Spec Pediatr Nurs 22: , e12179. |
[35] | van Buuren S , Groothuis-Oudshoorn K ((2011) ) Mice: Multivariate imputation by chained equations in R. J Stat Softw 45: , 1–67. |
[36] | Shi X , Nallapati R , Lescovec J , McFarland D , Jurafsky D ((2011) ) Who Leads Whom: Topical Lead-Lag Analysis across corpora, Stanford University, https://web.stanford.edu/ jurafsky/grants_v_papers.pdf, Accessed 15 February, 2020. |
[37] | Storandt M , Grant EA , Miller JP , Morris JC ((2002) ) Rates of progression in mild cognitive impairment and early Alzheimer’s disease. Neurology 59: , 1034–1041. |
[38] | Cornelis E , Gorus E , Schelvergem NV , Vriendt PD ((2019) ) The relationship between basic, instrumental, and advanced activities of daily living and executive functioning in geriatric patients with neurocognitive disorders. Int J Geriatr Psychiatry 34: , 889–899. |
[39] | Seidl JNT , Massman PJ ((2016) ) Rapidly versus slowly progressing patients with Alzheimer’s disease: Differences in baseline cognition. Am J Alzheimers Dis Other Demen 31: , 318–325. |
[40] | Reijs BLR , Ramakers IHGB , Köhler S , Teunissen CE , Koel-Simmelink M , Nathan PJ , Tsolaki M , Wahlund L-O , Waldemar G , Hausner L , Vandenberghe R , Johannsen P , Blackwell A , Vanderstichele H , Verhey F , Visser PJ ((2017) ) Memory correlates of Alzheimer’s disease cerebrospinal fluid markers: A longitudinal cohort study. J Alzheimers Dis 60: , 1119–1128. |
[41] | Terada S , Sato S , Nagao S , Ikeda C , Shindo A , Hayashi S , Oshima E , Yokota O , Uchitomi Y ((2013) ) Trail making test B and brain perfusion imaging in mild cognitive impairment and mild Alzheimer’s disease. Psychiatry Res 213: , 249–255. |


