
Dickkopf-1 Overexpression in vitro Nominates Candidate Blood Biomarkers Relating to Alzheimer’s Disease Pathology
Abstract
Background:
Previous studies suggest that Dickkopf-1 (DKK1), an inhibitor of Wnt signaling, plays a role in amyloid-induced toxicity and hence Alzheimer’s disease (AD). However, the effect of DKK1 expression on protein expression, and whether such proteins are altered in disease, is unknown.
Objective:
We aim to test whether DKK1 induced protein signature obtained in vitro were associated with markers of AD pathology as used in the amyloid/tau/neurodegeneration (ATN) framework as well as with clinical outcomes.
Methods:
We first overexpressed DKK1 in HEK293A cells and quantified 1,128 proteins in cell lysates using aptamer capture arrays (SomaScan) to obtain a protein signature induced by DKK1. We then used the same assay to measure the DKK1-signature proteins in human plasma in two large cohorts, EMIF (n = 785) and ANM (n = 677).
Results:
We identified a 100-protein signature induced by DKK1 in vitro. Subsets of proteins, along with age and apolipoprotein E ɛ4 genotype distinguished amyloid pathology (A + T–N–, A+T+N–, A+T–N+, and A+T+N+) from no AD pathology (A–T–N–) with an area under the curve of 0.72, 0.81, 0.88, and 0.85, respectively. Furthermore, we found that some signature proteins (e.g., Complement C3 and albumin) were associated with cognitive score and AD diagnosis in both cohorts.
Conclusions:
Our results add further evidence for a role of DKK regulation of Wnt signaling in AD and suggest that DKK1 induced signature proteins obtained in vitro could reflect theATNframework as well as predict disease severity and progression in vivo.
INTRODUCTION
Alzheimer’s disease (AD) is characterized by the presence of amyloid-β (Aβ) containing plaques and neurofibrillary tangles composed of modified tau protein together with the progressive loss of synapses and eventually neurons [1]. Recently, the National Institute on Aging-Alzheimer’s Association (NIA-AA) proposed a classification system for disease—the ATN framework [2]—based on three biomarker types where “A” represents amyloid pathology, measured by cortical amyloid positron emission tomography (PET) ligand binding or low cerebrospinal fluid (CSF) Aβ42; “T” represents tau pathology, measured by elevated CSF phosphorylated tau (P-tau) or cortical tau PET ligand binding; and “N” represents neurodegeneration or neuronal injury, measured by elevated CSF total tau (T-tau), 18F-fluoro-deoxyglucose (FDG) PET, or brain atrophy on magnetic resonance imaging (MRI). Dichotomizing these biomarkers as normal or abnormal results in eight ATN profiles; absence of AD related pathology (A-T-N-); the Alzheimer’s continuum including indications of amyloid pathology (A + T–N–, A + T + N–, A + T–N+, and A + T + N+); and Suspected Non-Alzheimer Pathology (SNAP), or non-amyloid dementia (A–T–N+, A–T + N–, and A–T + N+) [2].
The ATN framework has considerable face validity and has rapidly found wide acceptance in the research field. As clinical trials are increasingly targeting a range of pathologies, the ATN framework helps to inform participant inclusion and potentially also trial outcomes [3]. Moreover, the framework has predictive validity with, for example, people with A + T + N+ showing faster decline than other categories [4, 5]. The ATN framework is limited by biomarkers that are either not yet fully qualified or are relatively invasive and where access can be difficult. A blood-based version of the ATN framework would be of considerable value and recent progress suggests such an objective is realizable.
While considerable progress has been made in understanding the formation, and to some extent the effects of, the three pathological processes that define the ATN classification, much less progress has been made in determining the mechanistic relationship between amyloid and tau pathologies and their effects in inducing neuronal dysfunction and death. One potential mechanism that has been proposed to link all three processes is Wnt signaling. Activation of Wnt signaling is neuroprotective against the toxicity of Aβ both in vitro and in vivo [6, 7] and reverses cognitive deficits in rodent models [8, 9]. Inhibition of Wnt signaling could therefore be a factor triggering the onset and progression of AD (reviewed in [10]). In line with this, Dickkopf-1 (DKK1), an inhibitor of Wnt signaling, has been reported to be elevated in human AD brain, as well as in mouse models with Aβ generation and plaque formation [11–13]. In model systems, DKK1 is induced by Aβ, which in turn drives synaptic loss, tau phosphorylation, and neuronal death [14–16] and blockade of DKK1 protects synapses from Aβ-mediated neurotoxicity [16, 17].
Collectively, DKK1 mediated inhibition of Wnt signaling might be a critical factor in the Aβ-mediated pathway driving tau pathology and hence neuronal dysfunction and loss. Previously we demonstrated that knockdown of genes on a shared Aβ/DKK1 pathway also protected neurons from Aβ-induced toxicity and that in mice, overexpression of DKK1 induced tau pathology and cognitive impairment [18]. Given this, we propose that the DKK1 induced pathway might reflect the ATN framework in man. However, the molecular signature we previously identified was based on neuronal gene expression and included many master regulators or transcription factors and hence was not readily translatable to human studies. Therefore, in order to explore whether a DKK1 induced signature was recognizable in peripheral fluids in human in vivo studies, we first determined a protein signature induced by DKK1 in human cells in vitro and then tested whether this empirically defined protein signature was associated with the ATN framework and clinical outcomes in human plasma from two large independent cohorts including people clinically defined with AD, with mild cognitive impairment (MCI) and apparently healthy controls (Fig. 1).
Fig. 1
Flowchart of study design. 1) Measurement and quantification of 1,128 proteins in total cell lysates of HEK293A cells overexpressing DKK1; 2) The top 100 proteins that constitute the DKK1-induced signature were identified using partial least squares (PLS) regression; 3) Measuring the association of 100 DKK1-induced proteins with ATN framework in vivo and obtaining 23 proteins that were significantly associated with any single ATN abnormal; 4) Measuring the association of AD related proteins with other AD clinical outcomes; 5) Mendelian randomization to explore the causal relationship between two proteins (complement component 3 [C3] and fibrinogen gamma chain [FGG]) and AD risk, amyloid and tau (both T-tau and P-tau) pathology. AD, Alzheimer’s disease; SNAP, Suspected Non-Alzheimer Pathology; T-tau, total tau; P-tau, phosphorylated tau.
![Flowchart of study design. 1) Measurement and quantification of 1,128 proteins in total cell lysates of HEK293A cells overexpressing DKK1; 2) The top 100 proteins that constitute the DKK1-induced signature were identified using partial least squares (PLS) regression; 3) Measuring the association of 100 DKK1-induced proteins with ATN framework in vivo and obtaining 23 proteins that were significantly associated with any single ATN abnormal; 4) Measuring the association of AD related proteins with other AD clinical outcomes; 5) Mendelian randomization to explore the causal relationship between two proteins (complement component 3 [C3] and fibrinogen gamma chain [FGG]) and AD risk, amyloid and tau (both T-tau and P-tau) pathology. AD, Alzheimer’s disease; SNAP, Suspected Non-Alzheimer Pathology; T-tau, total tau; P-tau, phosphorylated tau.](https://content.iospress.com:443/media/jad/2020/77-3/jad-77-3-jad200208/jad-77-jad200208-g001.jpg)
MATERIALS AND METHODS
HEK293A cells with overexpression of DKK1
In order to establish a DKK1-induced protein signature, a HIS-tagged DKK1 cDNA was synthesized (GENEWIZ, UK) and cloned into the mammalian expression construct pcDNA3.1+ (Invitrogen, UK) and validated by sequencing. HEK293A cells (an adherent strain of HEK293) were cultured in DMEM + 10% FCS in 12-well plates until 80% confluent and transfected with the DKK1 construct or the empty vector control using FuGene 6 according to the manufacturer instructions (Promega, UK). The next day, the FCS content of the media was adjusted to 2% and the cells maintained for a further 6 h. Media was then removed and total cell lysates collected in M-PER (ThermoFisher, UK) for proteomic array studies using the SOMAScan platform (SomaLogic, Boulder, CO), allowing for the simultaneous measurement and quantification of 1,128 proteins (n = 5 per condition). All protein data were log-transformed prior to analysis.
Study participants
We used plasma samples recruited from two previously reported cross European studies: AddNeuroMed (ANM) [19] and the European Medical Information Framework for Alzheimer’s disease multi-modal biomarker discovery (EMIF-AD MBD) study [20].
ANM sample collection was performed at six different centers across Europe: University of Kuopio, Finland; Aristotle University of Thessaloniki, Greece; King’s College London, United Kingdom; University of Lodz, Poland; University of Perugia, Italy; and University of Toulouse, France [19]. We used 677 subjects from the ANM cohort including 319 AD patients, 149 MCI individuals, and 209 elderly unaffected controls (CTL). General clinical and demographic information were available for all subjects (including APOE ɛ4 genotype data) (Supplementary Table 1). Furthermore, the majority participants (84%) had Mini-Mental State Examination (MMSE) measurement and around 60% of the AD patients had Alzheimer’s Disease Assessment Scale - Cognitive subscale (ADAS-Cog) measurement (Supplementary Table 1) [21].
The EMIF-AD MBD is part of the European Medical Information Framework for Alzheimer’s disease (EMIF-AD; http://www.emif.eu/), a European wide collaboration to facilitate the re-use of existing healthcare data and the sharing of cohort samples for the benefit of AD research. Overall, the EMIF-AD MBD study collected samples from 11 European cohorts DESCRIPA, EDAR, PharmaCog, Amsterdam, Antwerp, San Sebastian GAP, Gothenburg, Barcelona IDIBAPS, Lausanne, Leuven, and Barcelona St Pau [20]. We used 785 subjects from the EMIF study comprising 183 AD patients, 382 MCI, and 220 CTL. In addition to general clinical and demographic information, each subject had a measure of both Aβ and tau (including total tau [T-tau] and phosphorylated tau [P-tau]) pathology. The classification of the status (abnormal/normal) of amyloid, T-tau, and P-tau has been described previously [20]. Briefly, amyloid pathology was determined using CSF Aβ42 in the majority and PET amyloid in a minority, based on which the individuals were classified into abnormal and normal status [20]. The levels of T-tau and P-tau in CSF were analyzed locally and the local cut-off point was used to determine their status (abnormal/normal) [20]. For these subjects, “A” is defined by amyloid status, “T” is by P-tau status, and “N” is by T-tau status. Dichotomizing these biomarkers as normal or abnormal results in eight ATN profiles (Table 1). In addition, each subject had MMSE measurement and the majority (over 72%) had other neuropsychological tests for memory, language, and executive functioning as previously reported (Supplementary Table 1) [20]. Furthermore, each individual had genome-wide single nucleotide polymorphism (SNP) genotyping. The details of SNP assays and raw data processing were described in [22].
Table 1
Characteristics of 785 participants split by ATN framework. Standard deviation is shown in brackets for age and MMSE in each category. Percentage of cases is shown in brackets for male sex as well as APOE ɛ4 carriers. p-values compare each demographic across 8 categories. NPC, No Pathology Control; SNAP, Suspected Non-Alzheimer Pathology; SD, standard deviation; MMSE, Mini-Mental State Examination
| Variable | NPC | AD | SNAP | p | |||||
| A–T–N– | A + T–N– | A + T + N– | A + T–N+ | A + T + N+ | A–T–N+ | A–T + N– | A–T + N+ | ||
| N (total = 785) | 229 | 105 | 19 | 54 | 298 | 26 | 18 | 36 | NA |
| Age (y) (SD) | 64 (8.5) | 68 (9.7) | 72 (6.8) | 72 (7.3) | 70 (8.0) | 72 (7.1) | 64 (6.3) | 71 (8.2) | <0.001 |
| Male sex N (%) | 123 (54) | 57 (54) | 9 (47) | 30 (56) | 170 (57) | 14 (54) | 10 (56) | 23 (64) | 0.95 |
| APOE ɛ4 carriers N (%) | 52 (23) | 58 (55) | 13 (68) | 36 (67) | 193 (65) | 5 (19) | 5 (28) | 9 (25) | <0.001 |
| MMSE (SD) | 27.7 (2.5) | 26.5 (3.9) | 25.4 (3.9) | 24.4 (4.3) | 24.0 (4.4) | 26.7 (3.6) | 27.8 (1.7) | 26.9 (2.8) | <0.001 |
Protein quantification of human plasma in two cohorts
The SOMAScan assay, an aptamer-based assay (SomaLogic, Boulder, CO) [23], was used to measure plasma proteins in subjects collected from both ANM and EMIF cohorts. Because of an evolving platform, different versions of the SOMAScan assay were used in samples from the two cohorts, with 1,016 and 4,001 proteins measured in ANM and EMIF cohorts, respectively. The in vitro experiments were conducted with a version of the assay having 1,128 proteins. The three versions of the assay used here were generated such as to ensure data interoperability. The abundance of each protein was log-transformed for all subsequent analyses.
Statistical analysis
All statistical analyses were completed using R (version 3.3.2). We used Student’s t-test to assess the relative levels of DKK family proteins (DKK1, DKK3, DKK4, and DKK-Like 1 [DKKL1]) as measured on the SomaLogic platform, in DKK1 overexpressing and control cells. Partial least squares (PLS) regression was used to obtain a signature consisting of the 100 top, or most altered, proteins as a consequence of DKK1 expression in HEK293A cell lysates. A PLS regression model was fitted to the data using all 1,128 proteins as the predictors (X) and the DKK1 or control status as the response variable (Y). We ranked proteins based on the calculated coefficients using two components from the resulting PLS regression model. The coefficients corresponding to each protein in the model are a proxy for how much each protein contributes to the signal.
The top 100 proteins that contributed to this multivariate signature most constitute the ‘DKK1-induced signature’ for subsequent analysis. The biological significance of the DKK1-induced signature was evaluated using the DAVID Bioinformatics Resource, version 6.8 Functional Annotation tool. Briefly, the 100 proteins were selected as our ‘gene list’ while all 1,128 proteins quantified in the study were selected as our ‘background gene list’. The enrichment analysis was performed on the KEGG database.
To compare the association of proteins with the ATN framework, we used logistic regression to compare proteins in different ATN profiles to ‘no pathology controls’ (A–T–N–), adjusting for age, APOE ɛ4 genotype, and gender. Logistic regression was also used to compare proteins in different AD diagnostic groups as well as between MCI participants who subsequently converted to dementia (MCIc) within 3 years relative to those whose MCI remained stable (MCIs). To analyze the association of proteins with continuous AD phenotypes (i.e., MMSE), we used partial correlation and adjusted for age, APOE ɛ4 genotype, and gender. p values obtained from both logistic regression and partial correlation were corrected using false discovery rate (FDR) and corrected p values were presented in heat map. Furthermore, for visual presentation, we presented the absolute protein expression value in different ATN and AD diagnostic groups in box plots. Student’s t-test was used to assess pairwise difference and uncorrected p values were presented in the box plots.
Forward stepwise logistic regression was used to find the analyte set that optimally discriminated amyloid pathology (A + T–N–, A + T + N–, A + T–N+, and A + T + N+) from no AD pathology (A–T–N–) in all subjects as well as in only cognitively normal individuals. In both cases, demographic covariates age and APOE ɛ4 genotype were included in models as potential predictors. For each comparison, the data set was randomly split into training (90%) and validation (10%) sets. The training set was used to select variables and fit the model which was then tested on the validation set using receiver operating curve (ROC) analysis. The 95% confidence Intervals of AUC was calculated using the ci.auc function.
Mendelian randomization
Mendelian randomization (MR) was used to investigate the causal relationship between two most promising (see Results section) proteins (C3 and FGG) and AD risk, Aβ and tau (T-tau and P-tau) pathology. As genetic variants are passed from parents to child at conception and remain largely unaltered by environment throughout an individual’s lifetime, reverse causation and confounding can be limited, making MR a powerful tool to examine causality between the exposure and outcome [24, 25]. The MR approach was based on three assumptions: 1) the genetic variants used as instrumental variables are associated with exposures; 2) the genetic variants are not associated with any confounders of the exposure-outcome relation; 3) the genetic variants are associated with outcome only through the exposure, namely a lack of pleiotropy [24].
For C3, we selected three SNPs as instrumental variables; rs1065489 [CFH], rs429608 [SKIV2L], and rs448260 [C3]. The association of these SNPs with plasma C3 levels have been validated in 95,442 individuals (p < 10–67) [26]. For FGG, we selected 24 SNPs as instrumental variables. These have been shown to be significantly associated with plasma FGG levels in a large genome wide association studies (GWAS) study including more than 100,000 subjects [27] (assumption 1). Then we checked whether the SNPs were either in linkage disequilibrium with one another, or were associated with known risk factors for AD (e.g., APOE ɛ4 genotype) (assumption 2). After verifying no direct association with AD, we acquired the summary statistics of each SNP with C3 and FGG from both studies separately as exposure estimates [26, 27]. For AD risk as outcome, we acquired the summary statistics for the association of each SNP with AD risk from a previously published GWAS study; International Genomics of Alzheimer’s Project (IGAP) by Lambert et al. [28]. One C3 SNP (rs429608 [SKIV2L]) was not found in IGAP; we therefore acquired summary statistics of rs429608 in another GWAS study - UK Biobank (UKBB) [29]. For Aβ and tau (T-tau and P-tau) as outcome, we analyzed the association of each SNP with Aβ and tau status in EMIF cohort using PLINK (v1.7). Using a two-sample MR approach, the exposure SNP (SNP-C3 and SNP-FGG) and outcome SNP (SNP - AD risk, SNP - Aβ, SNP - T-tau, and SNP - P-tau) associations were used to compute estimates of each exposure-outcome association. We then used two MR methods to test the robust causal inference including an inverse-variance weighted (IVW) method [30] the weighted median method [31].
To test the third assumption, we used the MR-Egger method to calculate values of intercepts and their p values. If the intercepts do not deviate markedly from zero, it indicates that substantial horizontal pleiotropy of the SNPs is less likely [32]. Furthermore, to determine if there was any single SNP driving the relationship, we performed a leave-one-out analysis where the MR is performed removing a different SNP in each iteration [33].
RESULTS
DKK1 and DKK4 were differentially expressed in DKK1-overexpressing cells compared to controls
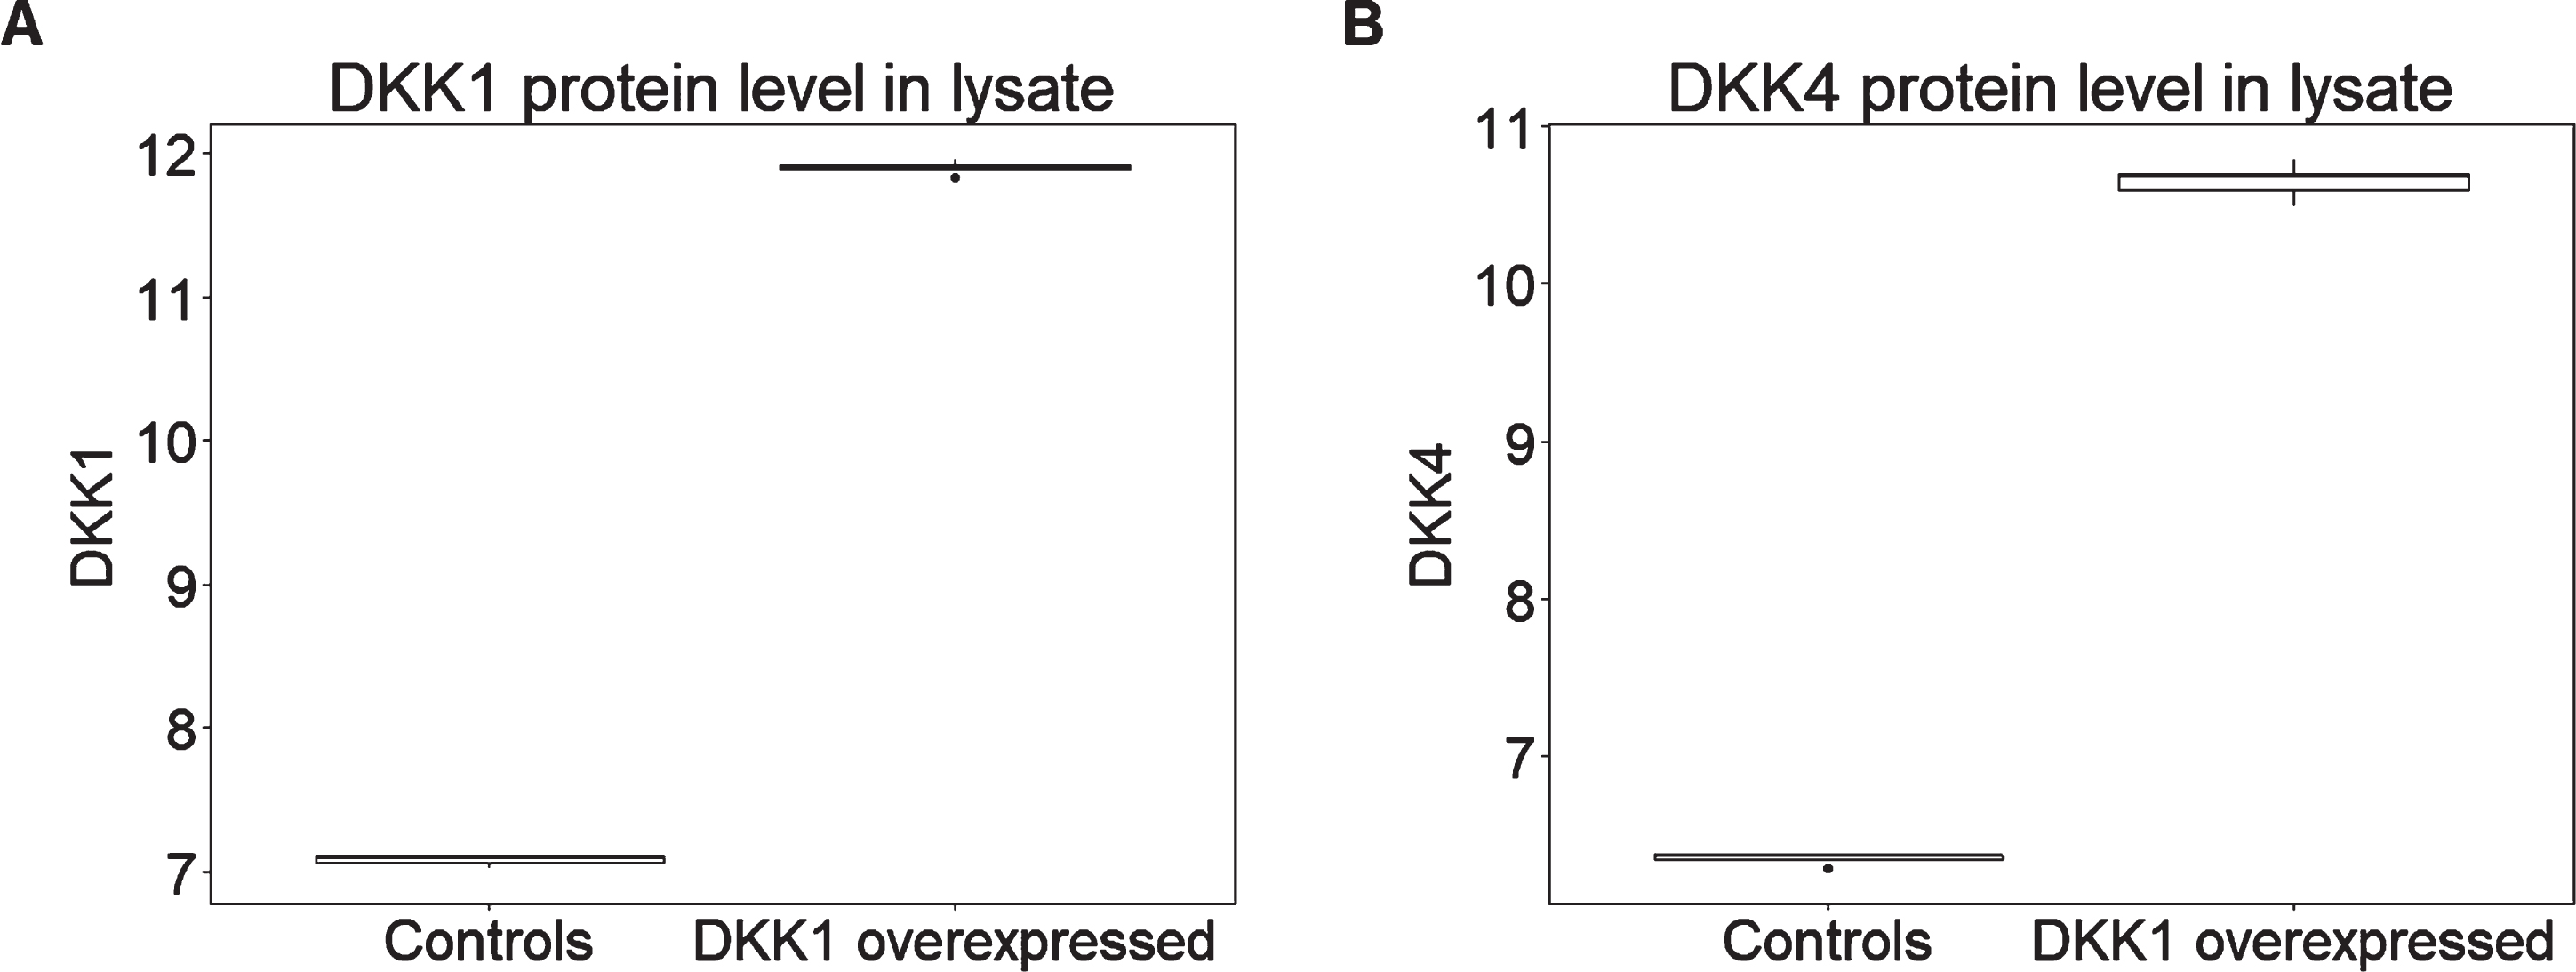
In addition to a large number of other proteins representing a wide range of biological processes, both versions of the SOMAScan assay used here include aptamers selected to bind and hence measure relative abundance of DKK proteins including DKK1, DKK3, and DKK4 and the related protein DKK-Like 1 (DKKL1). In order to determine the protein signature induced by DKK1, we used the SOMAScan assay to compare lysates from HEK293A cells engineered to over-express human DKK1 with control cells transfected with empty vector (n = 5 in each case). We first determined the ability of the SOMAScan assay to detect DKK1 and to differentiate this protein from other structurally similar DKK isoforms. We found that among the DKK family proteins, both DKK1 and DKK4 registered an increase in DKK1-overexpressing cells compared both to the other DKK isoforms and to all other protein measures (for DKK1 p = 0.008, corrected p = 0.7; for DKK4 p = 0.008, corrected p = 0.7) (Fig. 2). The most likely explanation for this observation is that the DKK4 read-out on the SomaLogic panel is in fact at least in part a read-out of DKK1 due to cross reactivity and hence we refer subsequently to this as DKK1/4.
Fig. 2
DKK1 overexpression leads to higher levels of (A) DKK1 and (B) DKK4 expression in HEK293A cell lysate (n = 5 per condition). Y axis represents the log transformed of proteins expression abundance measured by Somascan assay.
DKK1-induced proteomic signature was enriched in AD pathways
Having shown that the SOMAScan assay identifies the overexpression of DKK1 (with concomitant signal in the aptamer raised against DKK4), we used PLS to identify a multivariate proteomic signature that distinguished DKK1 overexpression cell lysates from controls. We ranked the proteins based on PLS coefficients (absolute value), and then selected the 100 proteins with the largest contribution to the DKK1-induced multivariate signature (Supplementary Table 2). As an exploratory study only we then assessed the biological significance of this signature using the DAVID Bioinformatics Resource. Overall, eight pathways were enriched though not passing multiple correction (Supplementary Table 3). Interestingly, AD was nominated as the second highest-ranked pathway (p = 0.014, corrected p = 0.075) in relation to disease.
Association of DKK1-induced signature with the ATN framework in vivo
We then investigated whether the top 100 proteins induced by DKK1, referred to here as the DKK1-induced signature, was associated with the ATN framework in the EMIF cohort (n = 785). Table 1 shows the characteristics of the participants split by ATN framework. No significant difference in sex was found among 8 profiles. Participants within the AD and SNAP groups were older than those in the ‘No Pathology Control’ (NPC) group except those with an A–T + N–profile. The prevalence of APOE ɛ4 carriers was higher in AD group than those in NPC or SNAP. Furthermore, MMSE was lower in AD group than individuals in NPC or SNAP except those in A + T–N–profile.
We used logistic regression to compare proteins in different ATN framework groups to the NPC group (A–T–N–), adjusting for age, APOE ɛ4 genotype, and gender. Of the 100 proteins, the levels of 23 proteins significantly altered in participants with at least one abnormal ATN biomarker, i.e., either A+, T+ or N+ after FDR correction (Fig. 3A). Furthermore, the majority of proteins were associated with amyloid-related pathology rather than with non-amyloid pathology (SNAP). In subsequent analyses we therefore focused on comparisons within the AD (A+) group to the NPC (A–T–N–) group, omitting the SNAP group (A–but T+ or N+). Based on their expression, these proteins could be divided into three groups: 1) those influenced only by amyloid pathology (A+) and independent of P-tau or T-tau status. For example, FGG increased in all individuals with abnormal amyloid pathology although it did not achieve significance in A + T + N–subjects (Fig. 3B), perhaps due to a low number of only 19 subjects with this profile. Other proteins belonging to this group were BRF-1, Coagulation Factor VII, CKAP2, HMG-1, CAMK2D, AURKB, BFL1, C3, and albumin; 2) those influenced by both amyloid and T-tau (A + N+). For example, DKK1/4 increased in individuals with A + T–N+ and A + T + N+ profiles (Fig. 3C). Three other proteins also belonged to this group: eotaxin, coactosin-like protein, and annexin I; 3) those influenced by amyloid, P-tau, and T-tau (A + T + N+), resulting changed levels in only A + T + N+ individuals, e.g., DKK1 (Fig. 3D), CHST2, MK01, CONA1, DLRB1, FN1.4, Cytochrome c, and SHP-2.
Fig. 3
A) Association of 23 DKK1-induced signature with 7 ATN profiles compared to A–T–N–. B–D) Comparison of proteins between A–T–N–(n = 229) and amyloid-positive individuals including A + T–N–(n = 105), A + T + N–(n = 19), A + T–N+ (n = 54), and A + T + N+ (n = 289). E, F) AUC of using proteins along with age and APOE ɛ4 genotype to differentiate A–T–N–from amyloid-positive individuals in all individuals and healthy controls respectively. High and low beta indicate positive and negative coefficients respectively. SNAP, Suspected Non-Alzheimer Pathology; FGG, fibrinogen gamma chain. In B, C, and D, Y axis represents the log transformed of proteins expression abundance measured by Somascan assay. *p < 0.05; ***p < 0.001; NS., not significant; AUC, area under the curve; CTL, controls.
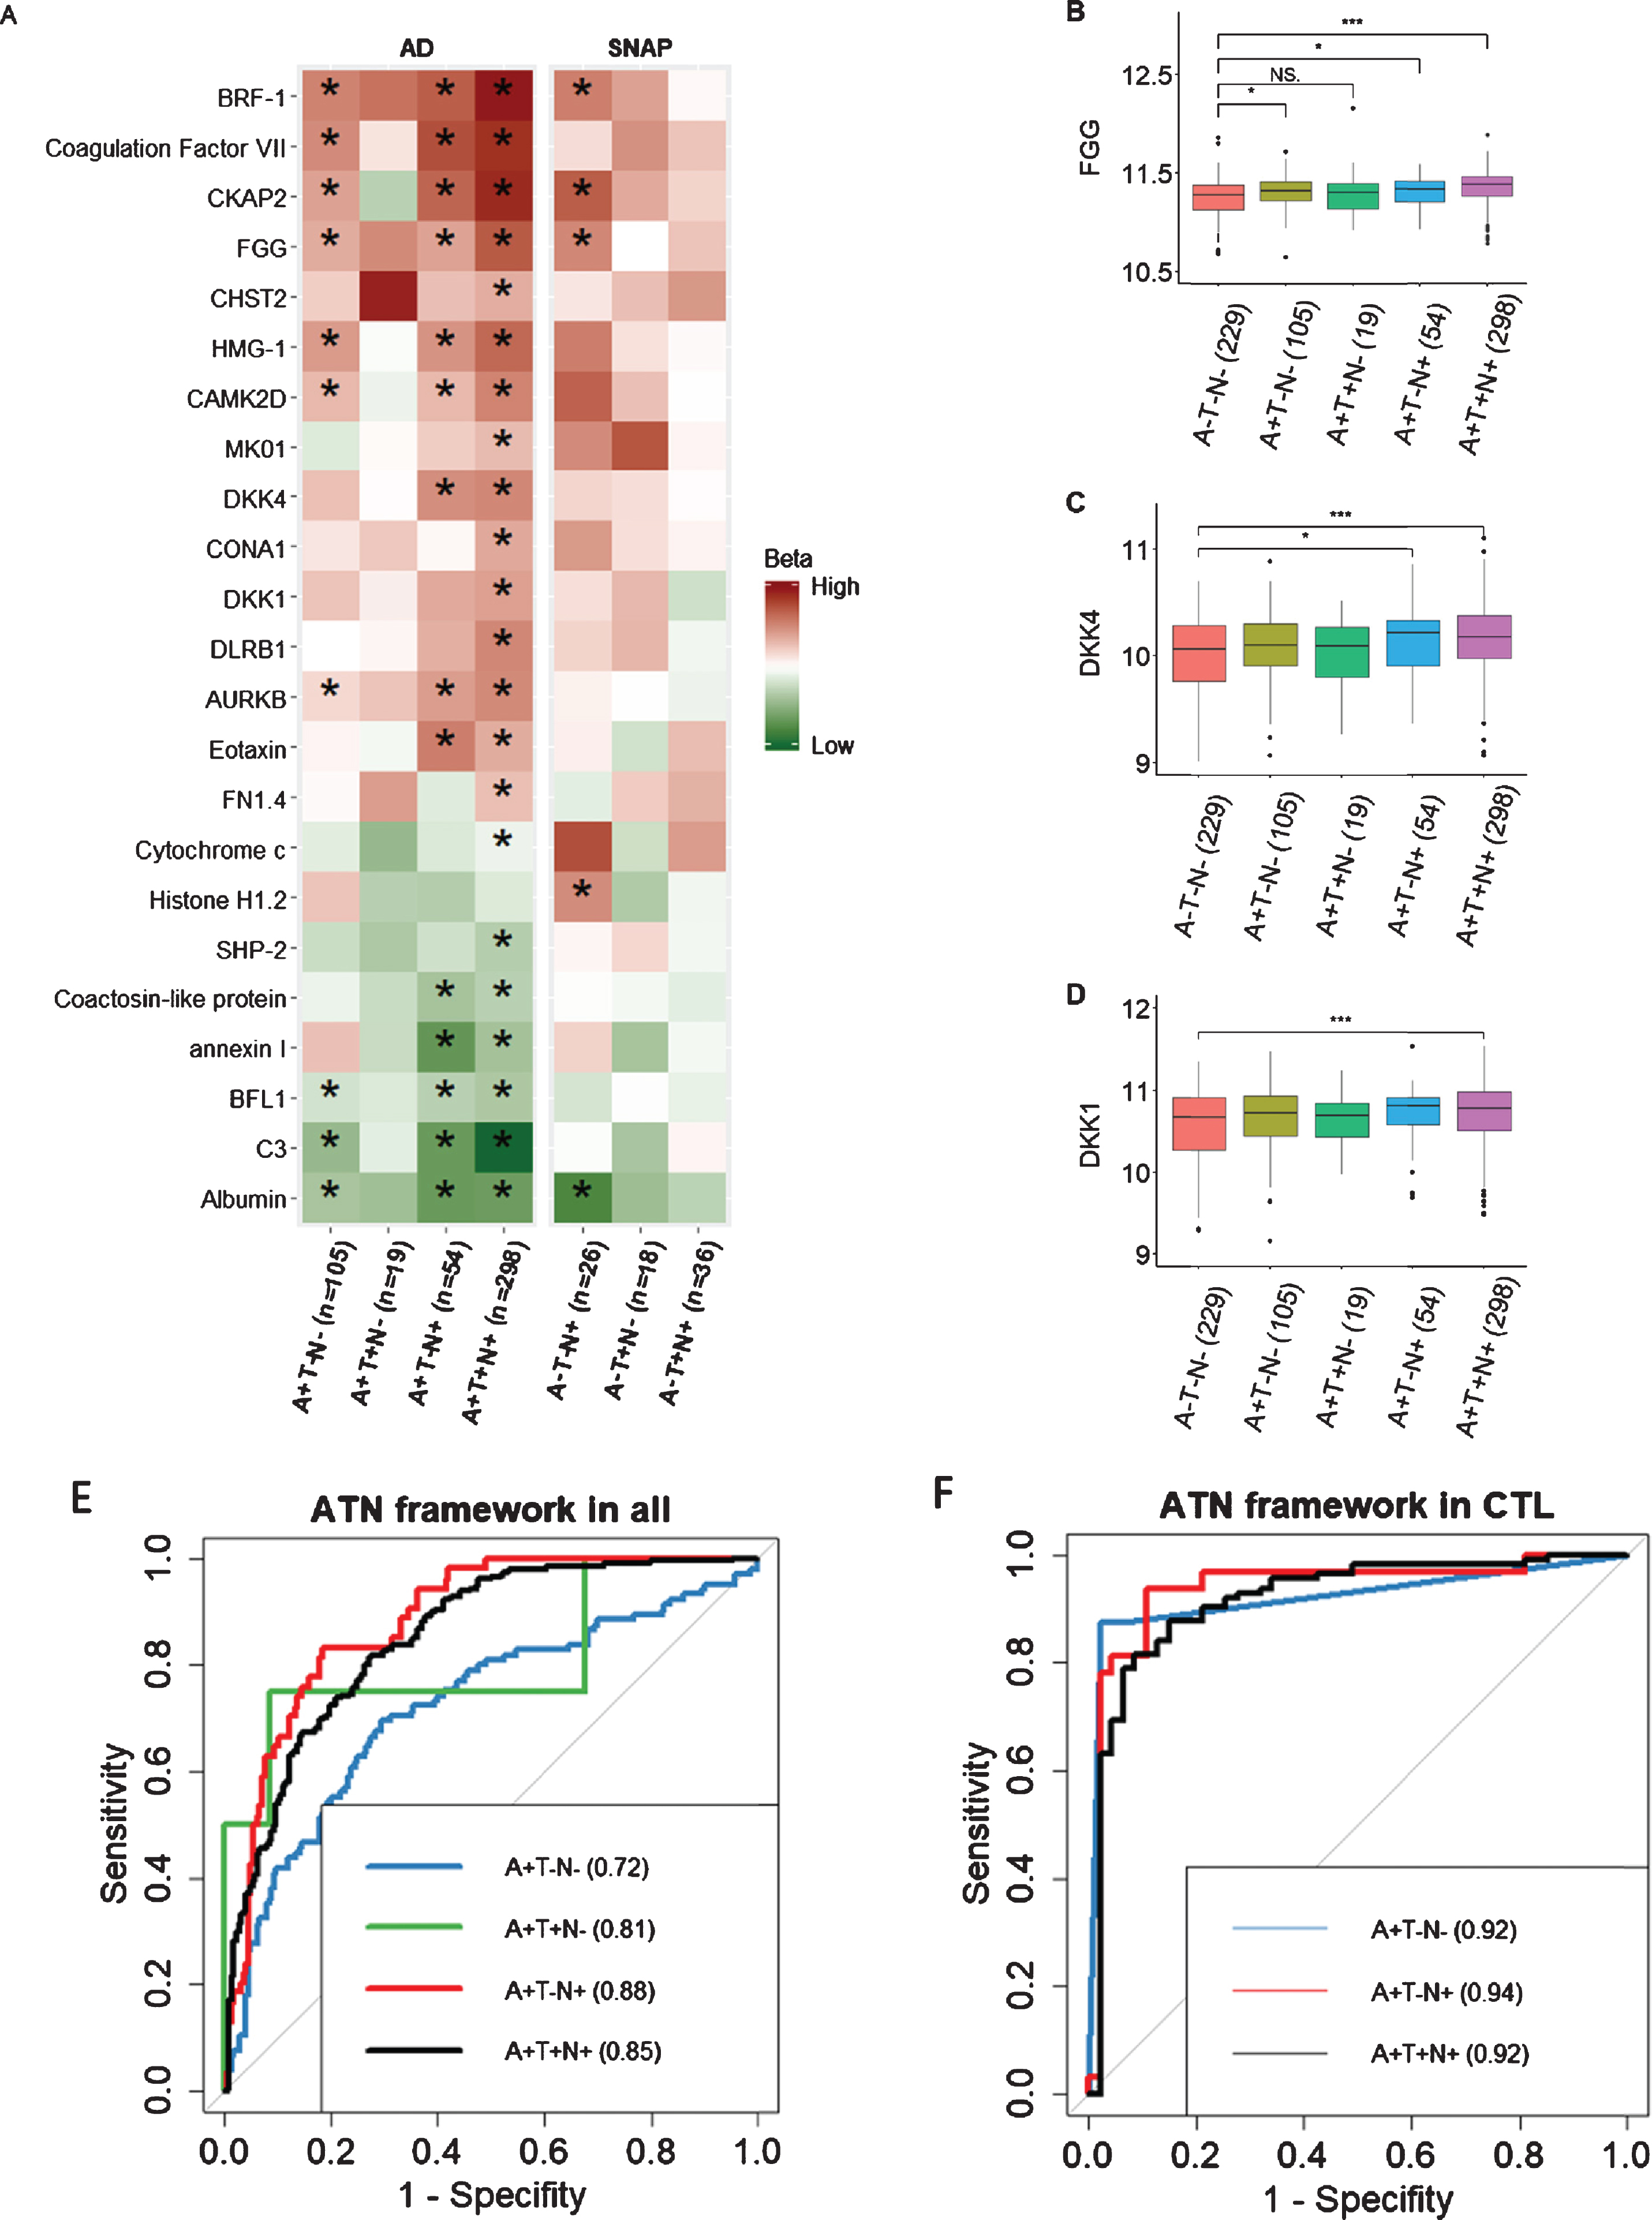
We then used forward stepwise logistic regression to identify optimal analyte sets to distinguish the NPC group from different ATN profiles within the AD (A+) group. We used AD related proteins as well as age and APOE ɛ4 genotype as input features. Results showed that a model containing HMG-1 as well as age and APOE ɛ4 genotype best discriminate A + T-N- from NPC group with an area under the curve (AUC) of 0.72 (Fig. 3E). The optimal model to differentiate A + T + N–from NPC group contained 6 features including SHP-2, FN1.4, CKAP2, and CHST2 as well as age and APOE ɛ4 genotype. For differentiating A + T–N+ from NPC group, a model containing 7 proteins (annexin I, Albumin, Cytochrome c, Eotaxin, DKK1, CONA1, and AURKB) with age and APOE ɛ4 genotype was selected. The optimal model to differentiate A + T + N+ from NPC group included 7 features including C3, AURKB, Eotaxin, BRF-1, and albumin as well as age and APOE ɛ4 genotype (Fig. 3E). The comparison between each optimal model and the combination of age and APOE ɛ4 genotype were shown in Supplementary Table 4.
We also set out to determine the optimal analyte sets to differentiate the NPC group from the amyloid positive ATN profiles (A+) groups in only cognitively normal individuals (Fig. 3F). The optimal model that separated the A + T + N+ from the NPC group included four features including CKAP2, C3, age, and APOE ɛ4 genotype. A model consisting of four proteins (Coagulation Factor VII, SHP-2, FN1.4, and DKK4) best discriminated the A + T–N–group from the NPC group with an AUC of 0.92 and a model consisting of three proteins (CKAP2, FN1.4, and Cytochrome c) together with age and APOE differentiated the A + T–N+ group from the NPC with an AUC of 0.94 (Fig. 3F) and (Supplementary Table 4). The A + T + N–group, with only three members, was too small to test for differentiation from the NPC group.
Association between ATN related proteins and AD clinical outcomes
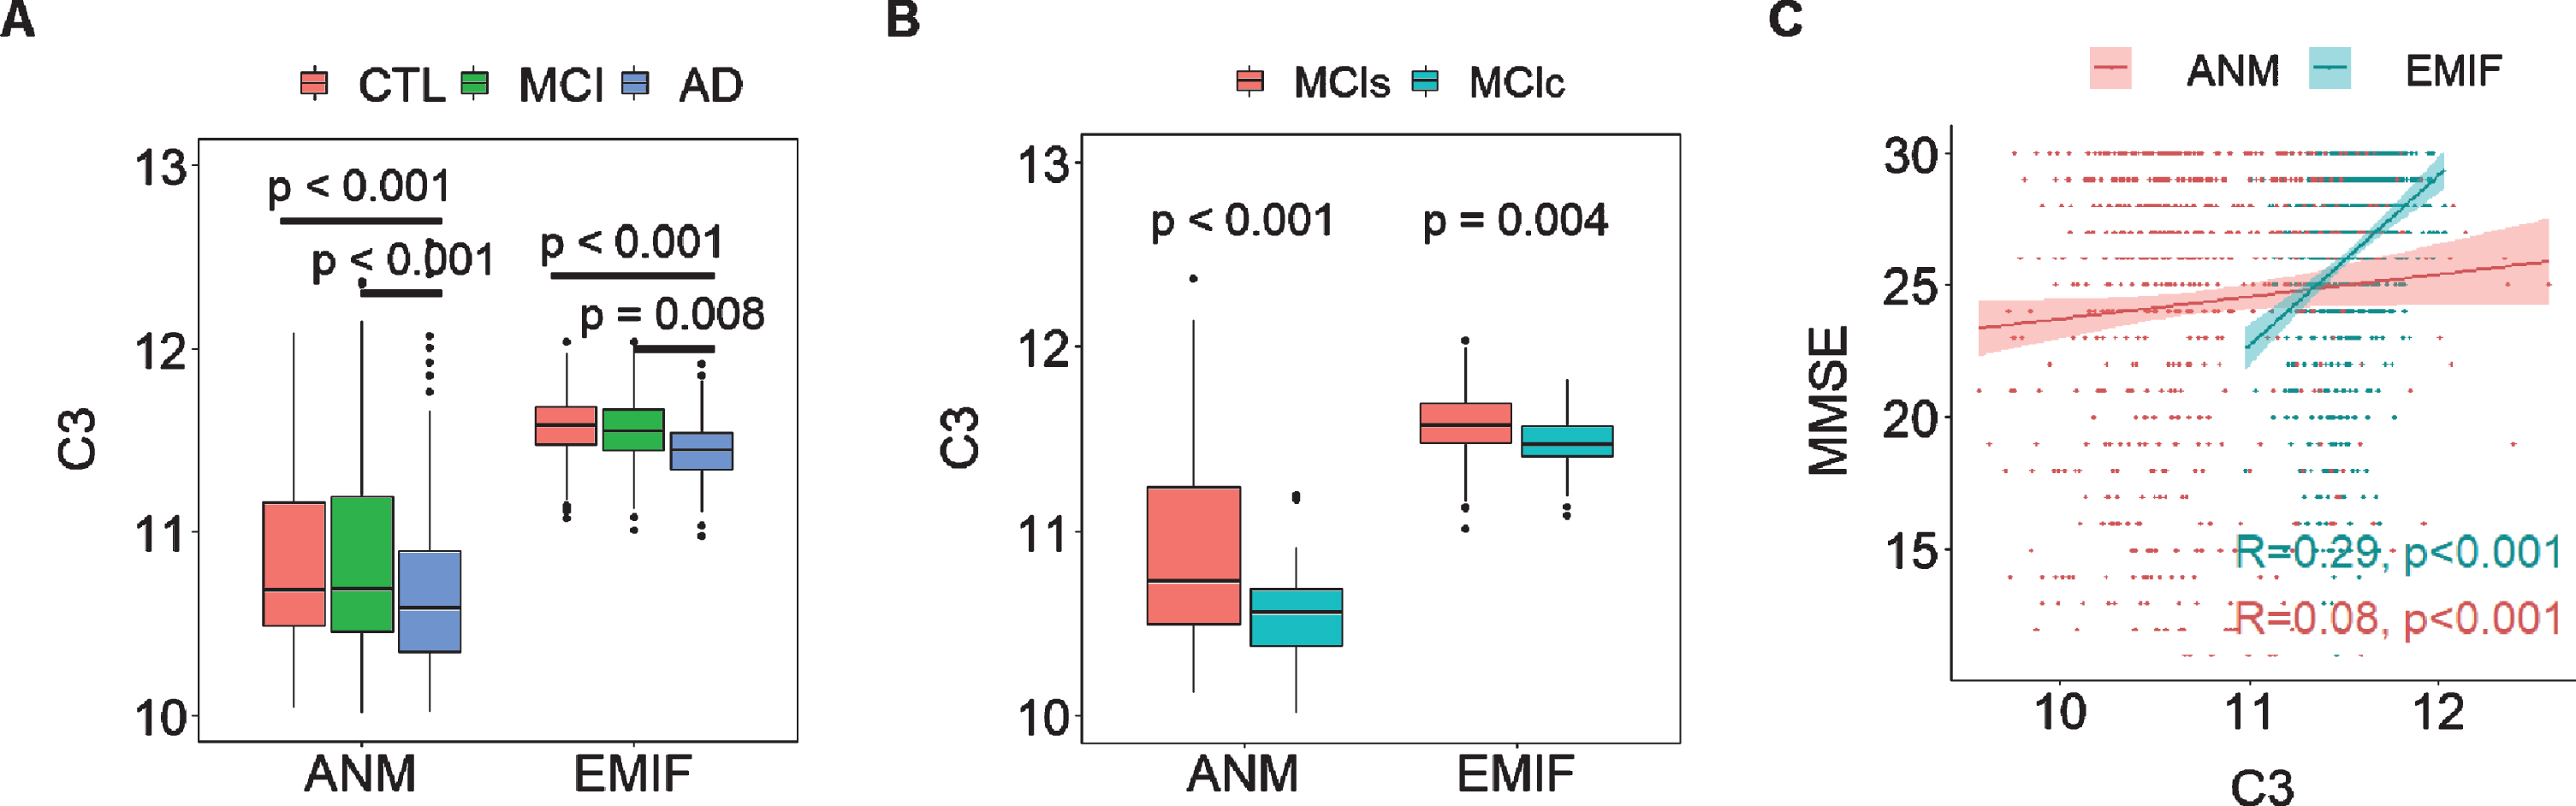
We then determined the relationship between ATN framework-related proteins and AD clinical outcomes in two large independent cohorts: EMIF (183 AD, 382 MCI, and 220 CTL) and ANM (319 AD, 149 MCI and 209 CTL). While we found many proteins to be associated with AD clinical outcomes in the EMIF cohort, few of these replicated in the ANM cohort (Supplementary Figure 1). However, we did find robust replication for two protein associations with clinical features; C3 and albumin. In the EMIF cohort, C3 was significantly decreased in AD compared to CTL and MCI individuals, a change also observed in the ANM cohort (Fig. 4A). Furthermore, C3 was significantly decreased in MCIc (EMIF n = 100; ANM n = 43) relative to MCIs (EMIF n = 219; ANM n = 106) in both two cohorts (Fig. 4B). C3 had consistent protective effects on cognition as it was positively associated with MMSE score in both EMIF (R2 = 0.29, p < 0.001) and ANM cohorts (R2 = 0.08, p < 0.001) although the association was weak in the ANM cohort (Fig. 4C). Albumin was also significantly decreased in AD compared to CTL in both cohorts (Supplementary Figure 2A). Furthermore, it was positively associated with baseline MMSE score in both EMIF (R2 = 0.25, p < 0.001) and ANM cohorts (R2 = 0.17, p < 0.001) (Supplementary Figure 2B).
Fig. 4
A) Comparison of C3 in different AD diagnostic groups in both EMIF and ANM cohorts. B) comparison of C3 in MCI who subsequently converted to dementia (MCIc) to those whose MCI remained stable (MCIs) in both cohorts. C) Correlation of MMSE with C3 in both cohorts. Y axis in A & B and X axis of C represent the log transformed of proteins expression abundance measured by Somascan assay. C3, complement component 3; ANM, AddNeuroMed; EMIF, European Medical Information Framework.
Causal relationship between C3 and AD risk, amyloid and tau pathology
We then sought to investigate the causal relationship between two proteins (C3 and FGG) with AD risk and Aβ and tau pathology (T-tau and P-tau) using two sample MR. A prerequisite for MR is evidence of genetic variations associated with the exposure variable, in this case levels of the proteins in plasma. To identify such variants, we interrogated the GWAS catalogue for all genes encoding the proteins in the panel and found that four proteins with at least two SNPs in their encoding gene significantly associated with their levels in blood (p < 10–8). These proteins were C3, FGG, CONA1, and coagulation factor VII. Given that C3 and FGG were associated with AD from previous biomarker studies from our group and others [26, 34–36], we selected these two proteins to further explore their causal relationship with AD. For exposure estimates, we selected three C3 SNPs [26] and 24 FGG SNPs [27] as instruments for MR analysis. For AD risk as outcome, we acquired the summary statistics for the association of each SNP with AD risk from IGAP and UK Biobank [28, 29]. For Aβ and tau pathologies as outcomes, we obtained the association of each SNP with biomarker-based Aβ and tau status from the EMIF cohort.
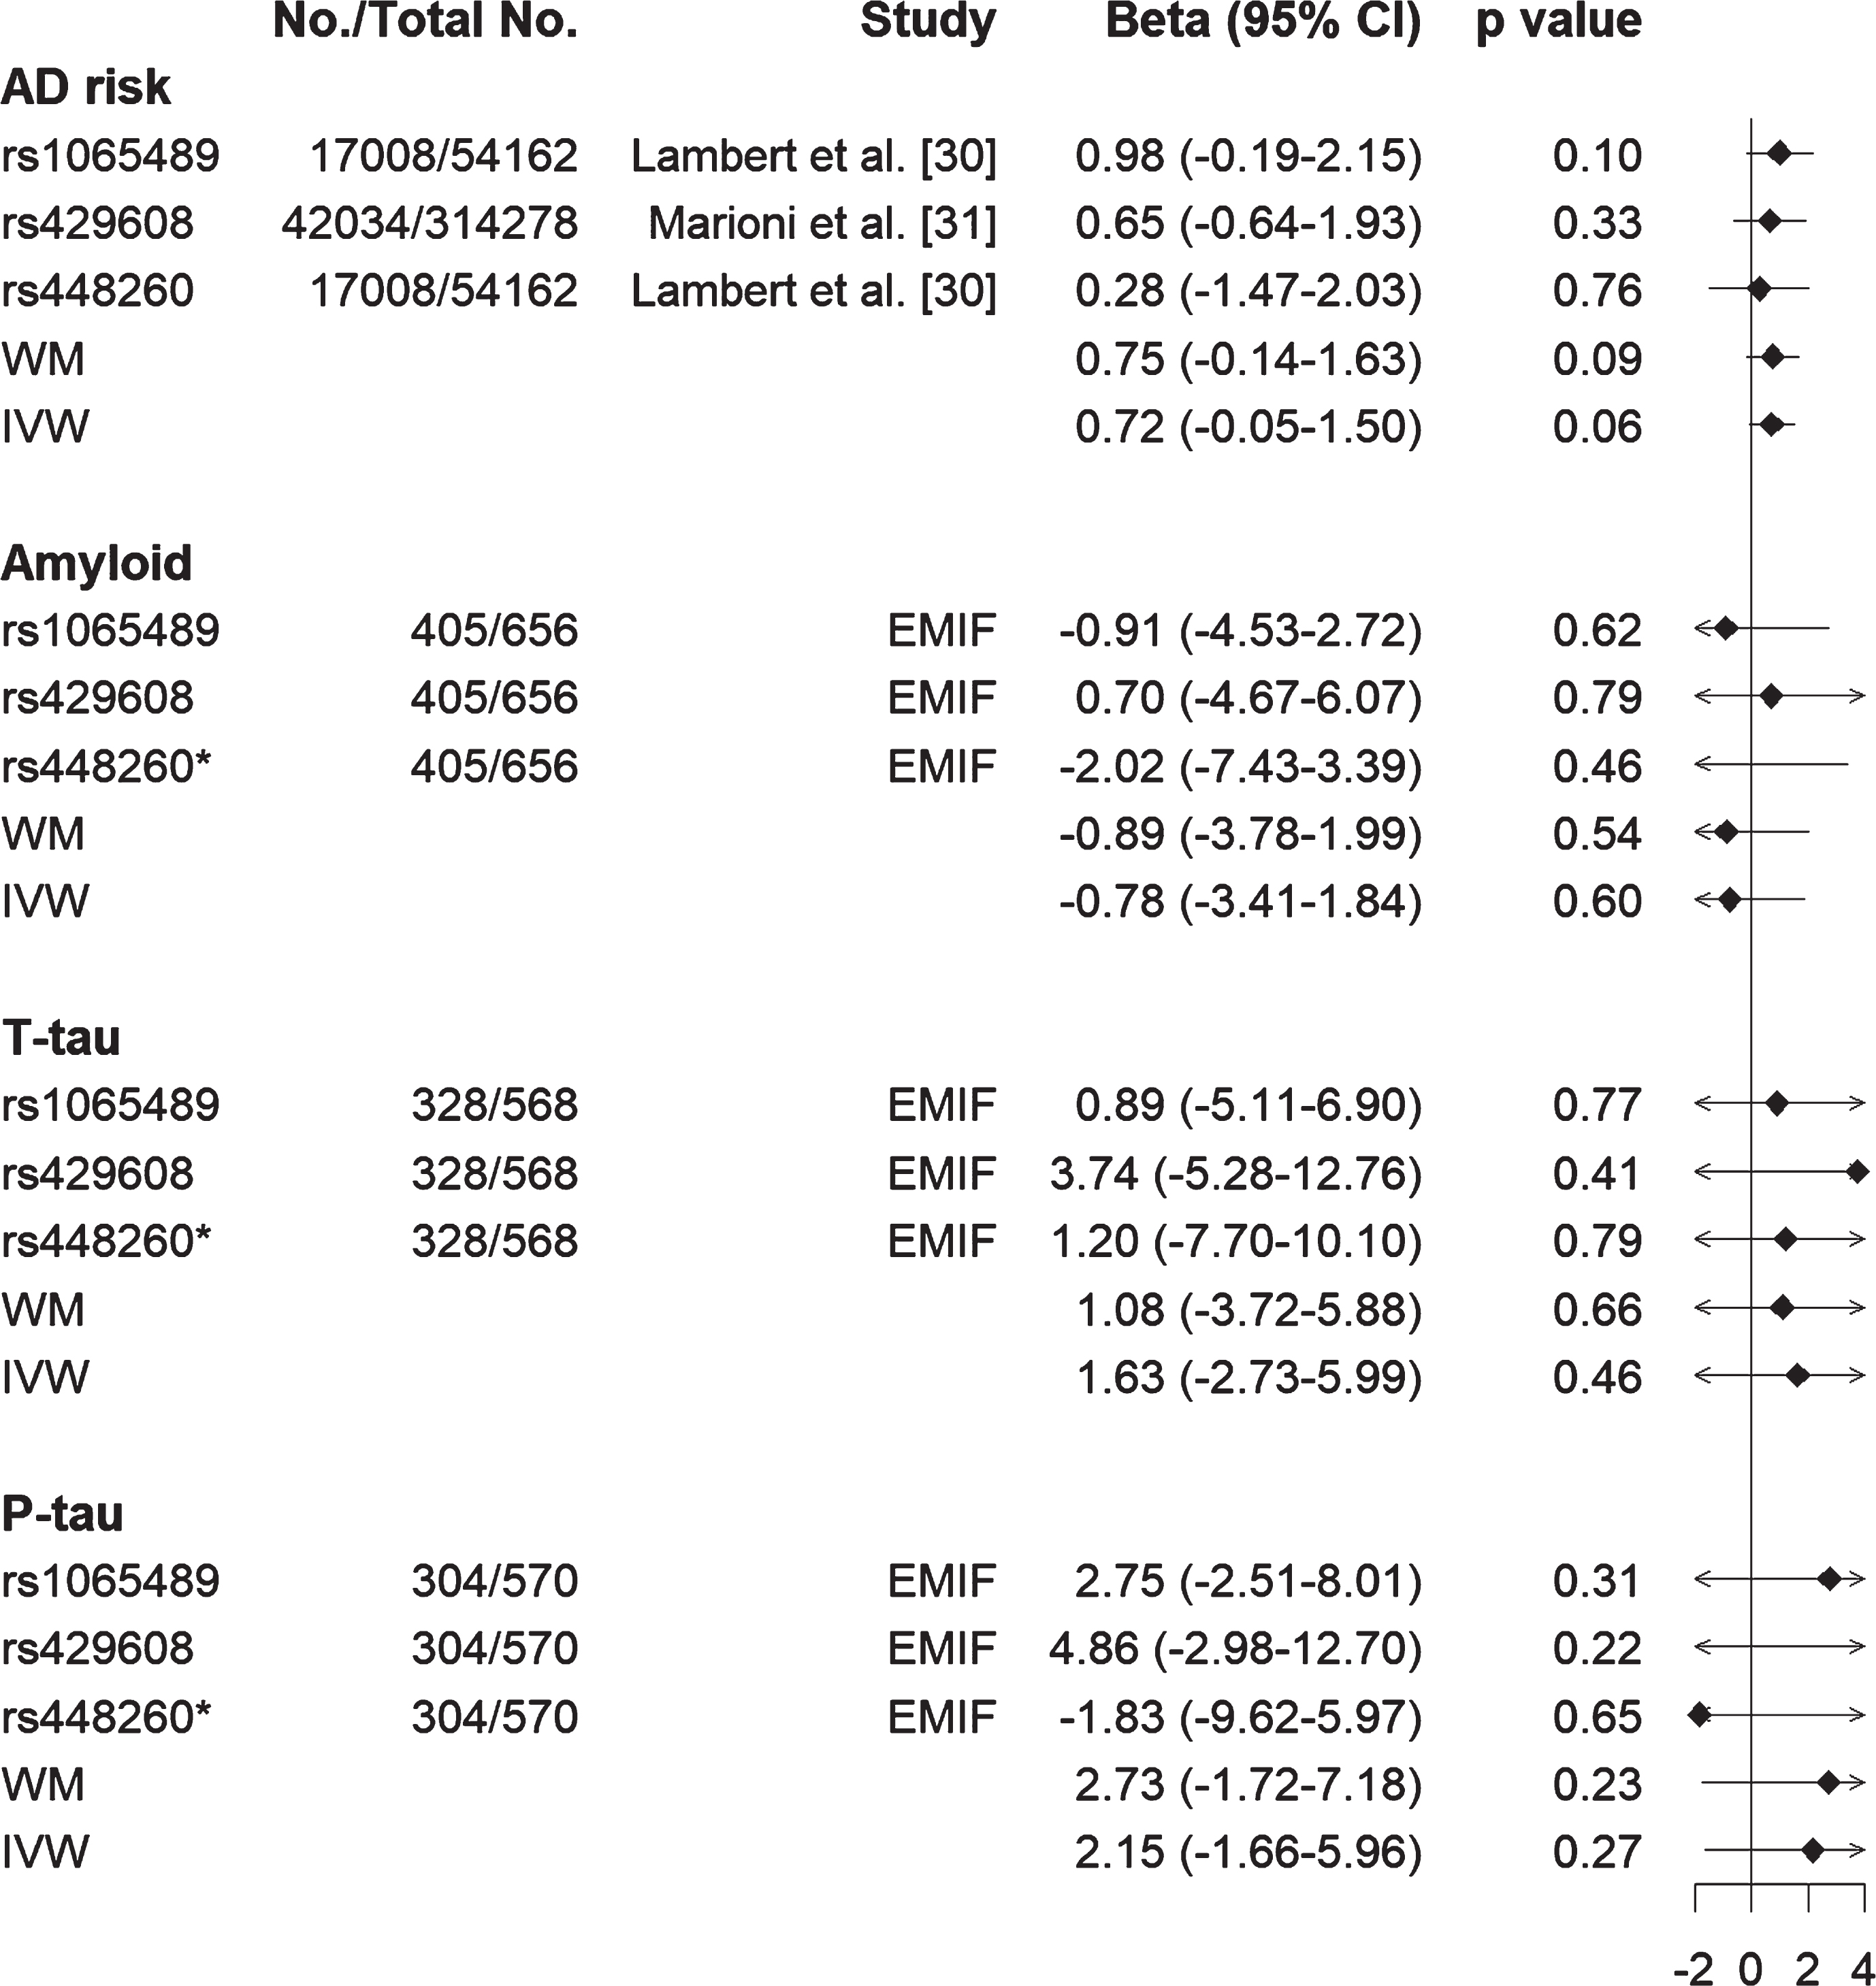
We first confirmed no pleiotropic effects for these genes given that intercept of genetic variants from MR-Egger regression was close to zero. We then performed MR analysis using both weighted median (WM) and inverse-variance weighted (IVW) approaches. Results showed that lower C3 was likely to be causally related to high AD risk using both WM (effect size [β] = 0.75, standard error of the effect size [se] = 0.44, 95% CI [–0.14, 1.63], p = 0.09) and IVW (β= 0.72, se = 0.40, 95% CI [–0.05, 1.50], p = 0.06) methods (Fig. 5). In contrast, such a relationship was not found between C3 with either Aβ or tau (both T-tau and P-tau) status (Fig. 5). Furthermore, results from the leave-one-out analysis demonstrated that no single SNP was driving the majority of the association signal between C3 and AD risk (Supplementary Figure 3). For FGG, no causal relationship was found between FGG and AD risk, or FGG and Aβ or FGG and tau (Supplementary Figure 4 and Supplementary Table 5).
Fig. 5
Forest plot of Mendelian randomization estimates the effects of C3 on AD risk, Aβ and tau status (T-tau and P-tau). Lower C3 is likely to be causally related to high AD risk from both inverse-variance weighted (IVW) and weighted median (WM) methods, but such relationship was not found between C3 and amyloid or C3 and tau (T-tau and P-tau). *rs448260 was not found in EMIF data, therefore its proxy rs2287848 (r2 = 0.93) was used to obtain its association with amyloid and tau. EMIF, European Medical Information Framework; T-tau, total tau; P-tau, phosphorylated tau.
DISCUSSION
Identification of biomarkers tends to fall into two different designs: either hypothesis-driven targeted measures of features known to be associated with the disease in question or data-driven high dimensionality agnostic platform approaches (“omics”). Here we utilize a novel approach with a hybrid design where first we used agnostic high dimensionality proteomics in an in vitro model of a hypothesized driver of disease mechanism and then used the derived signature in a targeted study in human samples. As Wnt signaling has been proposed to be protective and an increase in the Wnt inhibitor DKK1 has been found to be increased in AD [10, 37–39], and hence a possible driver of disease mechanisms, we first empirically identified a DKK1-induced signature from in vitro human cell models of DKK1 overexpression and then determined the association of this signature with AD pathology in two large independent cohorts; EMIF (n = 785) and ANM (n = 677). From analysis of high dimensionality proteomics of over 1,000 proteins, we determined a 100-protein signature induced by DKK1 and found that this protein set was enriched in molecular pathways known to be associated with AD, adding further evidence to the relevance and possible importance of this mechanism or pathway in disease.
We then explored the relationship of the identified signature to the biomarker based AD classification, i.e., ATN framework. The role of DKK1 and Wnt signaling in AD is suggested, from multiple lines of evidence mentioned above, to somehow transmit a signal from amyloid to tau pathology and hence neurotoxicity [14–16]. The mechanism of such a transmission is unknown although might be through the canonical Wnt pathway regulation of the tau kinase glycogen synthase kinase-3 (GSK3) or through the non-canonical Wnt pathways that include Rho/Roc and their effects on synaptic resilience [10, 40, 41]. If DKK1 is either a direct or indirect link between amyloid and tau pathology with subsequent effects on neurotoxicity, one would expect that a DKK1 induced signature might be associated with these different components of the AD pathway. We indeed found this to be the case with a strong association of many of the DKK1-signature proteins being associated with ATN classifications including amyloid (i.e., AD group, A+) but less association with the non-amyloid group (SNAP, A–). These results offer confirmation of DKK inhibition of Wnt signaling as a factor in Alzheimer’s pathology and specifically add weight to data from in vitro and in vivo models and from human brain studies that DKK1 is increased in response to amyloid and as a consequence increases risk of tau pathology and neurodegeneration.
Based on this, we further investigated the predictive value of DKK1-induced proteins in discriminating amyloid pathology (A + T–N–, A + T + N–, A + T–N+, and A + T + N+) from no AD pathology in all subjects as well as in cognitively normal individuals. We found the combination of different subsets of proteins along with age and APOE ɛ4 genotype was able to differentiate the different ATN profiles with a high AUC, especially in normal individuals (AUC > 0.9). It should be noted that forward stepwise regression makes an arbitrary decision as to select highly correlated proteins. Therefore, other proteins that were highly correlated to those selected proteins could equally function as biomarkers for ATN classification. For example, HMG-1 was selected in the model to discriminate A + T–N–from NPC in all subjects. As shown in Supplementary Figure 5, it was highly related to BRF.1, indicating that BRF.1 could also be a useful marker to discriminate A + T–N–from NPC.
Our study is the largest we are aware of to report a plasma biomarker indicative of the ATN framework both in terms of the number of proteins assayed and in sample size. As the data was derived from a biomarker platform with claims to have value in other clinical settings (see for example Somalogic.com/somasignals), then the identification of a signature indicative of AD pathological processes might have value in screening from existing data for possible suitability for clinical trials or, when therapies become available, possibly for early intervention, including those related to this particular target. As an approach to precision medicine, this model of biomarker discovery might have wider applicability.
In addition to the ATN framework, we also found the DKK1-derived protein signature associated with AD clinical outcomes (i.e., MMSE score and MCI conversion). We observed a robust replication especially for the association of C3 with clinical features, in line with some recent genetic and biomarkers studies [34, 36, 42]. For example, genetic studies strongly implicate complement signaling with AD pathogenesis with increasing attention being paid especially to the complement pathway node of C3 and C5 metabolism, regulated by CR1, one of the common variants most strongly associated with AD [42]. Biomarker studies too suggest that complement signaling is critically altered in AD with a large range of complement proteins, including C3 being repeatedly nominated in agnostic proteomic studies [34, 36]. However, neither genetic nor biomarker studies can alone demonstrate directional causality—in other words, although the genetics strongly implicate complement as a causative biological process neither they nor the biomarker studies are able to say whether any given complement protein is exacerbating or protecting against disease.
Empirical studies have attempted to address this question, critically important in drug development, using model systems. However, the results of such studies are less than clear. In some preclinical in vivo studies, C3 knock out offers synaptic protection and reduces amyloid burden in a range of models [43, 44], although in other studies increased amyloid accumulation and neurodegeneration has been reported [45, 46]. Therefore, to further explore causality, we employed a Mendelian randomization approach with this protein data combined with knowledge of C3 quantitative trait locus (QTL) SNPs associated with protein levels in this data set. We were able to substantiate the association between low levels of C3 and high risk of AD, suggesting a causal influence of C3 on risk of AD, further supporting findings from Rasmussen et al. [26] who studied more than 95,000 individuals from the general population.
We acknowledge that the sample distribution within the ATN framework is a limitation of this study. As shown in Table 1, A + T + N–profile only included 19 subjects. The small sample size might explain why proteins did not reach significance in A + T + N–profile when comparing to A–T–N–profile. It might also lead to the fact that we have not obtained a subset of proteins which could reflect A + T+ profile. Further research in large, well-characterized cohorts to replicate, validate, and extend these findings is needed.
In conclusion, our results add to the evidence base indicating a role for DKK1 and the Wnt pathway in AD pathogenesis. It suggests that a protein signature derived from a human cell model of DKK1 overexpression, when measured in human plasma, is significantly associated with the staging according to the ATN framework and could discriminate different amyloid-positive classes from No Pathology Controls. Furthermore, a subset of the DKK1-signature proteins are strongly associated with disease severity and progression and these association can be replicated in two large independent cohorts. Taken together, our results indicate that this novel, empirically generated approach can help identify biomarkers of utility for the selection of participants for clinical trials as well as for monitoring trial outcomes.
Data availability
The data sets generated and analyzed during the present study are available online. Briefly, access to EMIF Somascan data could be obtained via the EMIF-AD Catalogue (http://www.emif.eu/emif-catalogue/). Access to ANM Somascan data could be via AData (Viewer) (https://adata.scai.fraunhofer.de/). Research questions need to be submitted when applying for the access. In vitro Somascan data are available upon request.
ACKNOWLEDGMENTS
This research was conducted as part of the EMIF-AD project which has received support from the Innovative Medicines Initiative Joint Undertaking under EMIF grant agreement n° 115372, resources of which are composed of financial contribution from the European Union’s Seventh Framework Programme (FP7/2007-2013) and EFPIA companies’ in-kind contribution. The DESCRIPA study was funded by the European Commission within the 5th framework program (QLRT-2001-2455). The EDAR study was funded by the European Commission within the 5th framework program (contract # 37670). The Leuven cohort was funded by the Stichting voor Alzheimer Onderzoek (grant numbers #11020, #13007 and #15005). The Lausanne cohort study was supported by a grant from the Swiss National Research Foundation to JP (SNF 320030_141179). RV is a senior clinical investigator of the Flemish Research Foundation (FWO). JS is currently an employee of UCB, Braine-l’Alleud, Belgium. The San Sebastian GAP study is partially funded by the Department of Health of the Basque Government (allocation 17.0.1.08.12.0000.2.454.01.41142.001.H). We acknowledge the contribution of the personnel of the Genomic Service Facility at the VIB-U Antwerp Center for Molecular Neurology. The research at VIB-CMN is funded in part by the University of Antwerp Research Fund. FB is supported by the NIHR biomedical research centre at UCLH. RD is supported by Health Data Research UK, the National Institute for Health Research (NIHR) Biomedical Research Centre at South London, Maudsley NHS Foundation Trust, King’s College London and the NIHR University College London Hospitals Biomedical Research Centre. LS is funded by DPUK through MRC (grant no. MR/L023784/2) and the UK Medical Research Council Award to the University of Oxford (grant no. MC_PC_17215). Also support was received from the NIHR Biomedical Research Centre at Oxford Health NHS Foundation Trust.
Authors’ disclosures available online (https://www.j-alz.com/manuscript-disclosures/20-0208r3).
SUPPLEMENTARY MATERIAL
[1] The supplementary material is available in the electronic version of this article: https://dx.doi.org/10.3233/JAD-200208.
REFERENCES
[1] | Lane CA , Hardy J , Schott JM ((2018) ) Alzheimer’s disease. Eur J Neurol 25: , 59–70. |
[2] | Jack CR Jr , Bennett DA , Blennow K , Carrillo MC , Dunn B , Haeberlein SB , Holtzman DM , Jagust W , Jessen F , Karlawish J , Liu E , Molinuevo JL , Montine T , Phelps C , Rankin KP , Rowe CC , Scheltens P , Siemers E , Snyder HM , Sperling R ((2018) ) NIA-AA Research Framework: Toward a biological definition of Alzheimer’s disease. Alzheimers Dement 14: , 535–562. |
[3] | Cummings J ((2019) ) The National Institute on Aging-Alzheimer’s Association Framework on Alzheimer’s disease: Application to clinical trials. Alzheimers Dement 15: , 172–178. |
[4] | Yu JT , Li JQ , Suckling J , Feng L , Pan A , Wang YJ , Song B , Zhu SL , Li DH , Wang HF , Tan CC , Dong Q , Tan L , Mok V , Aisen PS , Weiner MM ((2019) ) Frequency and longitudinal clinical outcomes of Alzheimer’s AT(N) biomarker profiles: A longitudinal study. Alzheimers Dement 15: , 1208–1217. |
[5] | Soldan A , Pettigrew C , Fagan AM , Schindler SE , Moghekar A , Fowler C , Li QX , Collins SJ , Carlsson C , Asthana S , Masters CL , Johnson S , Morris JC , Albert M , Gross AL ((2019) ) ATN profiles among cognitively normal individuals and longitudinal cognitive outcomes. Neurology 92: , e1567–e1579. |
[6] | De Ferrari GV , Chacon MA , Barria MI , Garrido JL , Godoy JA , Olivares G , Reyes AE , Alvarez A , Bronfman M , Inestrosa NC ((2003) ) Activation of Wnt signaling rescues neurodegeneration and behavioral impairments induced by beta-amyloid fibrils. Mol Psychiatry 8: , 195–208. |
[7] | Alvarez AR , Godoy JA , Mullendorff K , Olivares GH , Bronfman M , Inestrosa NC ((2004) ) Wnt-3a overcomes beta-amyloid toxicity in rat hippocampal neurons. Exp Cell Res 297: , 186–196. |
[8] | Vargas JY , Fuenzalida M , Inestrosa NC ((2014) ) In vivo activation of Wnt signaling pathway enhances cognitive function of adult mice and reverses cognitive deficits in an Alzheimer’s disease model. J Neurosci 34: , 2191–2202. |
[9] | Toledo EM , Inestrosa NC ((2010) ) Activation of Wnt signaling by lithium and rosiglitazone reduced spatial memory impairment and neurodegeneration in brains of an APPswe/PSEN1DeltaE9 mouse model of Alzheimer’s disease. Mol Psychiatry 15: , 272–285, 228. |
[10] | Tapia-Rojas C , Inestrosa NC ((2018) ) Loss of canonical Wnt signaling is involved in the pathogenesis of Alzheimer’s disease. Neural Regen Res 13: , 1705–1710. |
[11] | Caricasole A , Copani A , Caraci F , Aronica E , Rozemuller AJ , Caruso A , Storto M , Gaviraghi G , Terstappen GC , Nicoletti F ((2004) ) Induction of Dickkopf-1, a negative modulator of the Wnt pathway, is associated with neuronal degeneration in Alzheimer’s brain. J Neurosci 24: , 6021–6027. |
[12] | Rosi MC , Luccarini I , Grossi C , Fiorentini A , Spillantini MG , Prisco A , Scali C , Gianfriddo M , Caricasole A , Terstappen GC , Casamenti F ((2010) ) Increased Dickkopf-1 expression in transgenic mouse models of neurodegenerative disease. J Neurochem 112: , 1539–1551. |
[13] | Bayod S , Felice P , Andres P , Rosa P , Camins A , Pallas M , Canudas AM ((2015) ) Downregulation of canonical Wnt signaling in hippocampus of SAMP8 mice. Neurobiol Aging 36: , 720–729. |
[14] | Galli S , Lopes DM , Ammari R , Kopra J , Millar SE , Gibb A , Salinas PC ((2014) ) Deficient Wnt signalling triggers striatal synaptic degeneration and impaired motor behaviour in adult mice. Nat Commun 5: , 4992. |
[15] | Sellers KJ , Elliott C , Jackson J , Ghosh A , Ribe E , Rojo AI , Jarosz-Griffiths HH , Watson IA , Xia W , Semenov M , Morin P , Hooper NM , Porter R , Preston J , Al-Shawi R , Baillie G , Lovestone S , Cuadrado A , Harte M , Simons P , Srivastava DP , Killick R ((2018) ) Amyloid beta synaptotoxicity is Wnt-PCP dependent and blocked by fasudil. Alzheimers Dement 14: , 306–317. |
[16] | Purro SA , Dickins EM , Salinas PC ((2012) ) The secreted Wnt antagonist Dickkopf-1 is required for amyloid beta-mediated synaptic loss. J Neurosci 32: , 3492–3498. |
[17] | Marzo A , Galli S , Lopes D , McLeod F , Podpolny M , Segovia-Roldan M , Ciani L , Purro S , Cacucci F , Gibb A , Salinas PC ((2016) ) Reversal of synapse degeneration by restoring Wnt signaling in the adult hippocampus. Curr Biol 26: , 2551–2561. |
[18] | Killick R , Ribe EM , Al-Shawi R , Malik B , Hooper C , Fernandes C , Dobson R , Nolan PM , Lourdusamy A , Furney S , Lin K , Breen G , Wroe R , To AW , Leroy K , Causevic M , Usardi A , Robinson M , Noble W , Williamson R , Lunnon K , Kellie S , Reynolds CH , Bazenet C , Hodges A , Brion JP , Stephenson J , Simons JP , Lovestone S ((2014) ) Clusterin regulates beta-amyloid toxicity via Dickkopf-1-driven induction of the wnt-PCP-JNK pathway. Mol Psychiatry 19: , 88–98. |
[19] | Lovestone S , Francis P , Kloszewska I , Mecocci P , Simmons A , Soininen H , Spenger C , Tsolaki M , Vellas B , Wahlund LO , Ward M , AddNeuroMed Consortium ((2009) ) AddNeuroMed–the European collaboration for the discovery of novel biomarkers for Alzheimer’s disease. Ann N Y Acad Sci 1180: , 36–46. |
[20] | Bos I , Vos S , Vandenberghe R , Scheltens P , Engelborghs S , Frisoni G , Molinuevo JL , Wallin A , Lleo A , Popp J , Martinez-Lage P , Baird A , Dobson R , Legido-Quigley C , Sleegers K , Van Broeckhoven C , Bertram L , Ten Kate M , Barkhof F , Zetterberg H , Lovestone S , Streffer J , Visser PJ ((2018) ) The EMIF-AD Multimodal Biomarker Discovery study: Design, methods and cohort characteristics. Alzheimers Res Ther 10: , 64. |
[21] | Westman E , Simmons A , Muehlboeck JS , Mecocci P , Vellas B , Tsolaki M , Kloszewska I , Soininen H , Weiner MW , Lovestone S , Spenger C , Wahlund LO ((2011) ) AddNeuroMed and ADNI: Similar patterns of Alzheimer’s atrophy and automated MRI classification accuracy in Europe and North America. Neuroimage 58: , 818–828. |
[22] | Hong S , Prokopenko D , Dobricic V , Kilpert F , Bos I , Vos SJ , Tijms BM , Andreasson U , Blennow K , Vandenberghe R ((2019) ) Genome-wide association study of Alzheimer’s disease CSF biomarkers in the EMIF-AD Multimodal Biomarker Discovery dataset. bioRxiv, 774554. |
[23] | Gold L , Ayers D , Bertino J , Bock C , Bock A , Brody EN , Carter J , Dalby AB , Eaton BE , Fitzwater T , Flather D , Forbes A , Foreman T , Fowler C , Gawande B , Goss M , Gunn M , Gupta S , Halladay D , Heil J , Heilig J , Hicke B , Husar G , Janjic N , Jarvis T , Jennings S , Katilius E , Keeney TR , Kim N , Koch TH , Kraemer S , Kroiss L , Le N , Levine D , Lindsey W , Lollo B , Mayfield W , Mehan M , Mehler R , Nelson SK , Nelson M , Nieuwlandt D , Nikrad M , Ochsner U , Ostroff RM , Otis M , Parker T , Pietrasiewicz S , Resnicow DI , Rohloff J , Sanders G , Sattin S , Schneider D , Singer B , Stanton M , Sterkel A , Stewart A , Stratford S , Vaught JD , Vrkljan M , Walker JJ , Watrobka M , Waugh S , Weiss A , Wilcox SK , Wolfson A , Wolk SK , Zhang C , Zichi D ((2010) ) Aptamer-based multiplexed proteomic technology for biomarker discovery. PLoS One 5: , e15004. |
[24] | Grover S , Del Greco MF , Stein CM , Ziegler A ((2017) ) Mendelian randomization. Methods Mol Biol 1666: , 581–628. |
[25] | Davey Smith G , Hemani G ((2014) ) Mendelian randomization: Genetic anchors for causal inference in epidemiological studies.R. Hum Mol Genet 23: , 89–98. |
[26] | Rasmussen KL , Nordestgaard BG , Frikke-Schmidt R , Nielsen SF ((2018) ) An updated Alzheimer hypothesis: Complement C3 and risk of Alzheimer’s disease-A cohort study of 95,442 individuals. Alzheimers Dement 14: , 1589–1601. |
[27] | Sabater-Lleal M , Huang J , Chasman D , Naitza S , Dehghan A , Johnson AD , Teumer A , Reiner AP , Folkersen L , Basu S , Rudnicka AR , Trompet S , Malarstig A , Baumert J , Bis JC , Guo X , Hottenga JJ , Shin SY , Lopez LM , Lahti J , Tanaka T , Yanek LR , Oudot-Mellakh T , Wilson JF , Navarro P , Huffman JE , Zemunik T , Redline S , Mehra R , Pulanic D , Rudan I , Wright AF , Kolcic I , Polasek O , Wild SH , Campbell H , Curb JD , Wallace R , Liu S , Eaton CB , Becker DM , Becker LC , Bandinelli S , Raikkonen K , Widen E , Palotie A , Fornage M , Green D , Gross M , Davies G , Harris SE , Liewald DC , Starr JM , Williams FM , Grant PJ , Spector TD , Strawbridge RJ , Silveira A , Sennblad B , Rivadeneira F , Uitterlinden AG , Franco OH , Hofman A , van Dongen J , Willemsen G , Boomsma DI , Yao J , Swords Jenny N , Haritunians T , McKnight B , Lumley T , Taylor KD , Rotter JI , Psaty BM , Peters A , Gieger C , Illig T , Grotevendt A , Homuth G , Volzke H , Kocher T , Goel A , Franzosi MG , Seedorf U , Clarke R , Steri M , Tarasov KV , Sanna S , Schlessinger D , Stott DJ , Sattar N , Buckley BM , Rumley A , Lowe GD , McArdle WL , Chen MH , Tofler GH , Song J , Boerwinkle E , Folsom AR , Rose LM , Franco-Cereceda A , Teichert M , Ikram MA , Mosley TH , Bevan S , Dichgans M , Rothwell PM , Sudlow CL , Hopewell JC , Chambers JC , Saleheen D , Kooner JS , Danesh J , Nelson CP , Erdmann J , Reilly MP , Kathiresan S , Schunkert H , Morange PE , Ferrucci L , Eriksson JG , Jacobs D , Deary IJ , Soranzo N , Witteman JC , de Geus EJ , Tracy RP , Hayward C , Koenig W , Cucca F , Jukema JW , Eriksson P , Seshadri S , Markus HS , Watkins H , Samani NJ , Wallaschofski H , Smith NL , Tregouet D , Ridker PM , Tang W , Strachan DP , Hamsten A , O’Donnell CJ ((2013) ) Multiethnic meta-analysis of genome-wide association studies in>100 000 subjects identifies 23 fibrinogen-associated Loci but no strong evidence of a causal association between circulating fibrinogen and cardiovascular disease. Circulation 128: , 1310–1324. |
[28] | Lambert JC , Ibrahim-Verbaas CA , Harold D , Naj AC , Sims R , Bellenguez C , DeStafano AL , Bis JC , Beecham GW , Grenier-Boley B , Russo G , Thorton-Wells TA , Jones N , Smith AV , Chouraki V , Thomas C , Ikram MA , Zelenika D , Vardarajan BN , Kamatani Y , Lin CF , Gerrish A , Schmidt H , Kunkle B , Dunstan ML , Ruiz A , Bihoreau MT , Choi SH , Reitz C , Pasquier F , Cruchaga C , Craig D , Amin N , Berr C , Lopez OL , De Jager PL , Deramecourt V , Johnston JA , Evans D , Lovestone S , Letenneur L , Moron FJ , Rubinsztein DC , Eiriksdottir G , Sleegers K , Goate AM , Fievet N , Huentelman MW , Gill M , Brown K , Kamboh MI , Keller L , Barberger-Gateau P , McGuiness B , Larson EB , Green R , Myers AJ , Dufouil C , Todd S , Wallon D , Love S , Rogaeva E , Gallacher J , St George-Hyslop P , Clarimon J , Lleo A , Bayer A , Tsuang DW , Yu L , Tsolaki M , Bossu P , Spalletta G , Proitsi P , Collinge J , Sorbi S , Sanchez-Garcia F , Fox NC , Hardy J , Deniz Naranjo MC , Bosco P , Clarke R , Brayne C , Galimberti D , Mancuso M , Matthews F , Moebus S , Mecocci P , Del Zompo M , Maier W , Hampel H , Pilotto A , Bullido M , Panza F , Caffarra P , Nacmias B , Gilbert JR , Mayhaus M , Lannefelt L , Hakonarson H , Pichler S , Carrasquillo MM , Ingelsson M , Beekly D , Alvarez V , Zou F , Valladares O , Younkin SG , Coto E , Hamilton-Nelson KL , Gu W , Razquin C , Pastor P , Mateo I , Owen MJ , Faber KM , Jonsson PV , Combarros O , O’Donovan MC , Cantwell LB , Soininen H , Blacker D , Mead S , Mosley TH Jr. , Bennett DA , Harris TB , Fratiglioni L , Holmes C , de Bruijn RF , Passmore P , Montine TJ , Bettens K , Rotter JI , Brice A , Morgan K , Foroud TM , Kukull WA , Hannequin D , Powell JF , Nalls MA , Ritchie K , Lunetta KL , Kauwe JS , Boerwinkle E , Riemenschneider M , Boada M , Hiltuenen M , Martin ER , Schmidt R , Rujescu D , Wang LS , Dartigues JF , Mayeux R , Tzourio C , Hofman A , Nothen MM , Graff C , Psaty BM , Jones L , Haines JL , Holmans PA , Lathrop M , Pericak-Vance MA , Launer LJ , Farrer LA , van Duijn CM , Van Broeckhoven C , Moskvina V , Seshadri S , Williams J , Schellenberg GD , Amouyel P ((2013) ) Meta-analysis of 74,046 individuals identifies 11 new susceptibility loci for Alzheimer’s disease. Nat Genet 45: , 1452–1458. |
[29] | Marioni RE , Harris SE , Zhang Q , McRae AF , Hagenaars SP , Hill WD , Davies G , Ritchie CW , Gale CR , Starr JM , Goate AM , Porteous DJ , Yang J , Evans KL , Deary IJ , Wray NR , Visscher PM ((2018) ) GWAS on family history of Alzheimer’s disease. Transl Psychiatry 8: , 99. |
[30] | Borenstein M , Hedges LV , Higgins JP , Rothstein HR ((2010) ) A basic introduction to fixed-effect and random-effects models for meta-analysis. Res Synth Methods 1: , 97–111. |
[31] | Bowden J , Davey Smith G , Haycock PC , Burgess S ((2016) ) Consistent estimation in Mendelian randomization with some invalid instruments using a weighted median estimator. Genet Epidemiol 40: , 304–314. |
[32] | Bowden J , Davey Smith G , Burgess S ((2015) ) Mendelian randomization with invalid instruments: Effect estimation and bias detection through Egger regression. Int J Epidemiol 44: , 512–525. |
[33] | Hemani G , Zheng J , Wade KH , Laurin C , Elsworth B , Burgess S , Bowden J , Langdon R , Tan V , Yarmolinsky J ((2016) ) MR-Base: A platform for systematic causal inference across the phenome using billions of genetic associations. BioRxiv, 078972. |
[34] | Shi L , Baird AL , Westwood S , Hye A , Dobson R , Thambisetty M , Lovestone S ((2018) ) A decade of blood biomarkers for Alzheimer’s disease research: An evolving field, improving study designs, and the challenge of replication. J Alzheimers Dis 62: , 1181–1198. |
[35] | Baird AL , Westwood S , Lovestone S ((2015) ) Blood-based proteomic biomarkers of Alzheimer’s disease pathology. Front Neurol 6: , 236. |
[36] | Ashton NJ , Kiddle SJ , Graf J , Ward M , Baird AL , Hye A , Westwood S , Wong KV , Dobson RJ , Rabinovici GD , Miller BL , Rosen HJ , Torres A , Zhang Z , Thurfjell L , Covin A , Hehir CT , Baker D , Bazenet C , Lovestone S ((2015) ) Blood protein predictors of brain amyloid for enrichment in clinical trials?. Alzheimers Dement (Amst) 1: , 48–60. |
[37] | Palomer E , Buechler J , Salinas PC ((2019) ) Wnt Signaling deregulation in the aging and Alzheimer’s brain. Front Cell Neurosci 13: , 227. |
[38] | Ren C , Gu X , Li H , Lei S , Wang Z , Wang J , Yin P , Zhang C , Wang F , Liu C ((2019) ) The role of DKK1 in Alzheimer’s disease: A potential intervention point of brain damage prevention?. Pharmacol Res 144: , 331–335. |
[39] | Anderton BH , Dayanandan R , Killick R , Lovestone S ((2000) ) Does dysregulation of the Notch and wingless/Wnt pathways underlie the pathogenesis of Alzheimer’s disease?. Mol Med Today 6: , 54–59. |
[40] | Libro R , Bramanti P , Mazzon E ((2016) ) The role of the Wnt canonical signaling in neurodegenerative diseases. Life Sci 158: , 78–88. |
[41] | Inestrosa NC , Varela-Nallar L ((2014) ) Wnt signaling in the nervous system and in Alzheimer’s disease. J Mol Cell Biol 6: , 64–74. |
[42] | Kucukkilic E , Brookes K , Barber I , Guetta-Baranes T , Morgan K , Hollox EJ ((2018) ) Complement receptor 1 gene (CR1) intragenic duplication and risk of Alzheimer’s disease. Hum Genet 137: , 305–314. |
[43] | Counts SE , Ikonomovic MD , Mercado N , Vega IE , Mufson EJ ((2017) ) Biomarkers for the early detection and progression of Alzheimer’s disease. Neurotherapeutics 14: , 35–53. |
[44] | Keshavan A , Heslegrave A , Zetterberg H , Schott JM ((2017) ) Blood biomarkers for Alzheimer’s disease: Much promise, cautious progress. Mol Diagn Ther 21: , 13–22. |
[45] | Wyss-Coray T , Yan F , Lin AH , Lambris JD , Alexander JJ , Quigg RJ , Masliah E ((2002) ) Prominent neurodegeneration and increased plaque formation in complement-inhibited Alzheimer’s mice. Proc Natl Acad Sci U S A 99: , 10837–10842. |
[46] | Maier M , Peng Y , Jiang L , Seabrook TJ , Carroll MC , Lemere CA ((2008) ) Complement C3 deficiency leads to accelerated amyloid beta plaque deposition and neurodegeneration and modulation of the microglia/macrophage phenotype in amyloid precursor protein transgenic mice. J Neurosci 28: , 6333–6341. |

