
Proteomics Time-Course Study of App Knock-In Mice Reveals Novel Presymptomatic Aβ42-Induced Pathways to Alzheimer’s Disease Pathology
Abstract
Background:
The 42 amino acids long amyloid-β peptide, Aβ42, may initiate a cascade of events leading to the severe neurodegeneration observed in Alzheimer’s disease (AD) brain. However, the underlying molecular mechanisms remain to be established.
Objective:
To find early Aβ42-induced AD related mechanisms, we performed a brain proteomics time-course study on a novel App knock-in AD mouse model, AppNL-F, expressing high levels of Aβ42 without AβPP overexpression artifacts.
Methods:
Hippocampus and cortex were analyzed separately by using 18O-labelling mass spectrometry to reveal alterations in protein levels. Pathway analysis of proteomics data was used to identify altered biological functions. Immunohistochemistry was used to further investigate a significant key regulatory protein.
Results:
Around 100 proteins were differently expressed in AppNL-F mice at each time point (3, 6, 9, and 18 months of age) as compared to wild type mice. Strikingly, already at 3 months of age—long before Aβ plaque development and memory impairment—several pathways, including long-term potentiation and synaptic plasticity, were downregulated, and neuritogenesis was increased. Huntingtin (HTT) was identified as an upstream regulator, i.e., a key protein affecting the levels of several proteins. Increased levels of HTT in hippocampus of AppNL-F mice was supported by immunofluorescence microscopy.
Conclusion:
Notably, the proteome was significantly altered already at 3 months of age, 6 months before the development of plaques. Differentially expressed proteins varied over time, indicating that increased Aβ42 levels initiate a cascade of events that eventually manifests in amyloid depositions, inflammation, and decline in memory.
INTRODUCTION
Alzheimer’s disease (AD) affects more than 30 million people worldwide, and the number is growing as life expectancy increases [1]. The pathological hallmarks of the disease are synapse and neuronal loss, activated astrocytes and microglia, intraneuronal tangles composed of the microtubule associated protein tau, and amyloid plaques. The plaques are composed of fibrils formed by the amyloid-β peptide (Aβ) [2], which is generated physiologically by proteolytic cleavage of the amyloid-β protein precursor (AβPP) by β- and γ-secretase [3]. Several lines of evidence suggest that the polymerization of a 42-residues long variant of this peptide, Aβ42, is critically involved in AD pathogenesis. Indeed, mutations in AβPP or the enzymatic component of γ-secretase, presenilin 1 or 2, lead to increased Aβ42 levels or increased Aβ42/Aβ40 ratio and early onset of AD [4, 5]. The disease pathology, including increased Aβ levels, starts already over 20 years before clinical diagnosis [6]. So, if Aβ triggers the disease, an important question to answer is: what pathways are affected and at which stage of the disease? To find out, a relevant in vivo system is required.
A large number of mouse models of AD exist today, and they have played important roles for elucidating the disease mechanisms [7]. However, a majority of these previously generated models are transgenic mice, which overexpress AβPP to induce the Aβ pathology. The high non-physiological level of AβPP potentially causes several artifacts: 1) Since AβPP and fragments thereof have neurobiological properties, the pathologies developed in these models may not be caused entirely by Aβ amyloidosis [7, 8]; 2) Insertion of the transgene can distort endogenous gene expression; 3) Some App transgenic mouse models are additionally based on mutations in Aβ-generating enzymes, which might affect processing of other substrates [7]. Here, we used a mouse model for AD based on knock-in technology. This model was constructed by humanizing the Aβ sequence within the endogenous mouse App gene and introducing the Swedish and the Beyreuther mutations to increase specifically the generation of the toxic and aggregation-prone Aβ42, and to increase the Aβ42/Aβ40 ratio [9]. This mouse model, AppNL-F, therefore enables us to study in vivo the effects of Aβ amyloidosis, without artifacts such as endoplasmic reticulum stress caused by non-physiologically high levels of AβPP [10]. Increased Aβ42 levels and increased Aβ42/Aβ40 ratio have been experimentally confirmed to occur already at 2 months of age in these mice. Aβ plaque formation becomes prominent from 9 months of age along with a strong neuroinflammatory response including astrocytosis and gliosis [9, 11]. The Aβ amyloidosis leads to mushroom spine loss through Aβ binding to mGluR5 and altered calcium signaling and CamKII activity [12]. The AppNL-F mice show impaired memory at 18 months of age in the Y-maze; however, earlier signs of altered memory have been detected using IntelliCage [13] and Morris water maze [14]. Thus, pathologies developed in this mouse model are closely related to AD pathologies in the human brain and may therefore offer invaluable information about disease progression in the human brain.
To get an unbiased view of alterations in protein levels, tandem mass spectrometry (MS/MS) offers several advantages. It can with high sensitivity unambiguously identify thousands of proteins in a sample and, by using 18O labeling, the relative ratio of protein levels in, for instance, samples from AD compared to healthy controls can be determined [15]. The labeling efficiency is high and reproducible [16] and suitable for quantitative analysis [15]. Here we have used nano-HPLC MS/MS to study alterations in protein levels caused by the increased Aβ42 levels in hippocampus and cortex over time in homozygous AppNL-F mice compared to wild type mice and identified novel potential AD associated proteins and pathways.
MATERIALS AND METHODS
Animals
AppNL-F mice, which are on C57BL/6 background, have been previously described [9]. Wild type mice were bred out from the AppNL-F strain. Both females and males were used for the analysis. They mice were kept on 12:12 day and night cycle and with access to food and water ad libitum. The animal experiments were conducted according to the guidelines of the RIKEN Center for Brain Science.
Sample preparation
Three-, 6-, 9-, and 18-month-old AppNL-F/NL-F and Appwt/wt mice (three from each age and strain) were anesthetized with pentobarbital, perfused by cardiac perfusion with PBS, brains isolated, hippocampal and cortical regions were dissected, snap frozen, and homogenized using Multi-Beads Shocker (Yasui Kikai) at 2500 rpm for 20 s in 8 M urea, 400 mM ammonium bicarbonate. The protein concentration was determined by BCA Protein assay (Pierce). 50 μg protein was digested by trypsin (1:50 trypsin:protein ratio) in 100 mM ammonium bicarbonate, 2 mM CaCl2, 0.2% RapiGest (Waters Corporation, WI, USA) for 12 h at 37°C. The reaction was acidified by addition of 1.5 μl 37% HCl, in order to hydrolyze RapiGest, and centrifuged for 10 min at 15,000 rpm at 4°C to separate hydrophobic debris from hydrolyzed RapiGest and lipids. An internal standard was made for each time point and brain region by pooling 25 μg of homogenate from the six individual samples, drying them by speedvac and digesting them with trypsin in the presence of 97% 18O-labeled H2O (by reconstituting ammonium bicarbonate, CaCl2, RapiGest, and trypsin in H218O). A total amount of 10 μg of labeled internal standard was mixed with 10 μg of tryptic peptides of each sample and purified by ZipTipC18 chromatography (Millipore, MA, USA) according to the manufacturer’s instructions, dried and dissolved in 0.1% formic acid by sonication two times for 5 min. For further fractionation, the peptides were subjected to SCX ion exchange chromatography using handmade stage SCX pipette tips [17, 18] containing four 3M Empore AnionExchange SCX discs (Varian, 1214–5012) placed on top of each other and inserted into a 200 μL micropipette tip. Peptides in a quantity of 20 μg were bound to the matrix, washed with 0.1% formic acid in 45% acetonitrile. Four fractions were sequentially eluted by centrifugation of the tips inserted to Eppendorf microcentrifuge tubes at 2500 rpm for 60 s with 1) 60 mM ammonium formate, 2) 100 mM ammonium formate, 3) 150 mM ammonium formate, and 4) 5% NH3, 20% MeOH, all containing 0.1% formic acid and 15% acetonitrile. The elution conditions were chosen so that approximately equal amounts of peptides (5 μg) were eluted in each fraction as determined from the respective chromatogram. The eluted fractions were dried in a speedvac, dissolved in 0.2% formic acid and purified by ZipTipC18 as described above.
LC-MS/MS analyses
The samples, dissolved in 2% acetonitrile/0.2% TFA, were injected to the LC-MS/MS in a volume of 9 μl (Q Exactive, ThermoScientific). Mobile phase A was 0.1% formic acid in water, and mobile phase B was acetonitrile with 0.1% formic acid. The peptides were eluted by a 120 min long gradient; 0–30% B from 0–100 min and 30–65% B from 100–120 min at a flow rate of 300 nl/min. The analytical column was a NANO-HPLC capillary C18 column, 0.075×150 mm (Nikkyo Technos) and the trap column was an Acclaim® PepMap100 pre-column, 100 μm×2 cm (Thermo Fisher Scientific). Peptide selection was set at m/z 350–1800. The combined resulting mass spectra data from the four fractions were subjected to Proteome Discoverer (Ver.1.4) with the MASCOT search engine (Ver. 2.5.1) against SwissProt database 2015_04 with search criteria; 18O incomplete labeling (Heavy+Medium)/Light. The median ratio was set to 1 for each analysis.
Statistical analyses of proteins identified by LS-MS/MS
Proteins identified by LC/MS analyses were uploaded to Qlucore Omics Explorer version 3.3. Principal component analysis (PCA) was performed after filtering with a threshold of 1.05-fold change upon performing a two-group comparison between the AppNL-F/NL-F mice and the Appwt/wt mice. Heat maps were generated for each time point for the cortical and hippocampal proteomes after performing a two-group comparison of the AppNL-F/NL-F mice and the Appwt/wt mice and filtering with threshold values of both a 1.5-fold change and a p-value < 0.05. UniProtKB was used to explore the functions of the proteins with altered levels.
Ingenuity pathway analyses (IPA)
T-test was performed with two-tailed two sample unequal variance and the resulting file containing protein identification number, fold change in protein levels, and p-values were uploaded to IPA. The following settings were used for analysis: Reference set: in ingenuity knowledge base. Consider only molecules and/or relationships where (species = Rat OR Mouse OR Human) AND (confidence = Experimentally Observed) AND (tissues/cell lines = Cerebral Cortex OR Melanocytes OR Vascular smooth muscle cells OR Striatum OR SF-295 OR Nervous System not otherwise specified OR Caudate Nucleus OR SNB-75 OR Pituitary Gland OR SF-539 OR Purkinje cells OR Brainstem OR Other Epithelial cells OR Microvascular endothelial cells OR Amygdala OR Ventricular Zone OR Subventricular Zone OR Spinal Cord OR Blood platelets OR Olfactory Bulb OR Sertoli cells OR Astrocytes OR Cerebral Ventricles OR Cortical neurons OR Corpus Callosum OR Dorsal Root Ganglion OR White Matter OR Sciatic Nerve OR Neurons not otherwise specified OR Putamen OR Thalamus OR SF-268 OR Trigeminal Ganglion OR Other Nervous System OR Keratinocytes OR Hepatocytes OR Endothelial cells not otherwise specified OR Nucleus Accumbens OR CNS Cell Lines not otherwise specified OR Other CNS Cell Lines OR Other Endothelial cells OR Brain OR Granule cells OR Choroid Plexus OR Granule Cell Layer OR Medulla Oblongata OR Epithelial cells not otherwise specified OR Microglia OR Hypothalamus OR Hippocampus OR U87MG OR Cerebellum OR Pyramidal neurons OR Parietal Lobe OR HUVEC cells OR Substantia Nigra OR Gray Matter OR Other Neurons OR U251 OR Other Tissues and Primary Cells) AND (data sources = An Open Access Database of Genome-wide Association Results OR BIND OR BioGRID OR Catalogue Of Somatic Mutations In Cancer (COSMIC) OR Chemical Carcinogenesis Research Information System (CCRIS) OR ClinicalTrials.gov OR ClinVar OR Cognia OR DIP OR DrugBank OR Gene Ontology (GO) OR GVK Biosciences OR Hazardous Substances Data Bank (HSDB) OR HumanCyc OR Ingenuity Expert Findings OR Ingenuity ExpertAssist Findings OR IntAct OR Interactome studies OR MIPS OR miRBase OR miRecords OR Mouse Genome Database (MGD) OR Obesity Gene Map Database OR Online Mendelian Inheritance in Man (OMIM) OR TarBase OR TargetScan Human). Set cutoffs: Experimental p-value of p < 0.1 and experimental fold change 1.1 times up- or downregulated.
Immunostaining
Four μm thick sections were cut from paraffin-embedded brain tissue derived from 6-, 12-, and 25-month-old AppNL-F/NL-F and Appwt/wt mice (four individuals per age group and genotype). The sections were deparaffinized and hydrated. Antigen retrieval was performed in citrate buffer, at 110°C for 20 min. Immunostaining was performed using NEL701001KT TSA amplification kit (Perkin Elmer, MA, USA) following the protocol from the manufacturer. Sections were incubated overnight with huntingtin (HTT) antibody EPR5526 (Abcam, CAM, UK), 1:500 in TNB blocking buffer and then incubated with secondary biotinylated anti-rabbit antibody, 1:200 in TNB blocking buffer, for 2 h in room temperature and SA-HRP, 1:100 in TNB blocking buffer, for 30 min at room temperature and finally incubated with Tyramide, 1:50 in Amplification buffer, for 10 min at room temperature. Samples were mounted using water soluble mounting medium (Thermo Fisher, MA, USA), covered with cover glass and observed using fluorescence microscopy within 48 h of mounting. Samples were stored dry and dark when not in use.
Immunofluorescence microscopy
Images of mouse hippocampus were captured using a 20X objective and a Nikon Camera DS-Qi2 (Nikon, TKY, JPN) with capture software NIS-elementsD (Nikon, TKY, JPN). Same settings were used for the capture of each image with 2-s exposure time and 1.6 digital gain. Exposure was kept to a minimum to limit photobleaching. Quantification of signal intensity from the whole hippocampal region was performed using ImageJ imaging software (NIH, UK). Signal strength is presented as an average value of signal intensity in an interval 0–100 with 0 representing no signal and 100 representing maximum signal detectable by the camera. Statistical analysis of signal intensity data obtained via ImageJ was performed using Graphpad Prism software (Graphpad Software, CA, USA). Unpaired t-tests were used to determine significance between signal intensity, p-value < 0.05. Pyramidal neurons in the cornu ammonis1 area of the hippocampus were imaged in a Zeiss 700 inverted confocal microscope with 20X objective.
RESULTS
The relative protein abundance in AppNL-F/NL-F mice compared to age-matched Appwt/wt mice was analyzed using 18O labeling and nano-HPLC MS/MS. We choose to analyze brain tissue from mice of 3, 6, 9, and 18 months of age in order to follow the pathologies over time. At 3 months of age, the mice have no Aβ plaque pathology; at 6 months the very first signs of Aβ deposits start to appear; at 9 months the mice have significant amount of Aβ plaques in brain parenchyma; and at 18 months they have heavy Aβ plaque burden as well as cognitive impairment [9, 19]. Hippocampus and cortex were analyzed at each time point. The samples were homogenized and trypsinized and the resulting peptides were purified by using C18 solid phase extraction. To increase the number of identified proteins, we applied strong cation exchange (SCX) fractionation of the extracted peptides [20]. This resulted in the quantification of the relative protein levels of around 3000 proteins.
Neuritogenesis and synaptic function were altered at 3 months of age
All of the quantified proteins were subjected to multivariate analysis (principal component analysis, PCA). The results showed that the proteome of both the hippocampus and cortex of AppNL-F/NL-F mice were clearly altered as compared to those of Appwt/wt mice already at 3 months of age (Fig. 1A). Similarly, PCA analysis of the brain proteome from 6-, 9-, and 18-month-old mice showed that the protein level profiles of cortex and hippocampus from AppNL-F/NL-F mice were different from wild type mice, clearly separating the two groups (Supplementary Figure 1). To visualize individual proteins with significantly altered levels in hippocampus and cortex from AppNL-F/NL-F compared to Appwt/wt mice, paired t-test was used to generate heat maps in Qlucore omics explorer. Interestingly, already at the age of 3 months we found 35 proteins from hippocampus and 33 from cortex to have significantly (p < 0.05) altered levels and more than 50% up- or downregulation (Fig. 1B). By manual examination of these proteins using UniProtKB, we concluded that many of the proteins with altered levels are involved in synaptic function, including glutamate signaling, as well as neuron/brain development and regulation of protein degradation.
Fig.1
PCA plots and heat maps showing altered protein levels in hippocampus and cortex from AppNL-F/NL-F mice compared to Appwt/wt mice at 3 months of age. a) PCA plots of protein levels in hippocampus (left) and cortex (right). Individual AppNL-F/NL-F and Appwt/wt mice are shown in magenta and green, respectively. b) The same set of data were subjected to two-group comparison using Qlucore Omics Explorer version 3.3 to generate heat maps to display differentially expressed proteins in hippocampus (left) and cortex (right) using significance threshold of p < 0.05 and at least 1.5-fold up-or downregulation. Red, upregulated, blue, downregulated. The UniProt code and abbreviated protein names are shown for each protein hit.
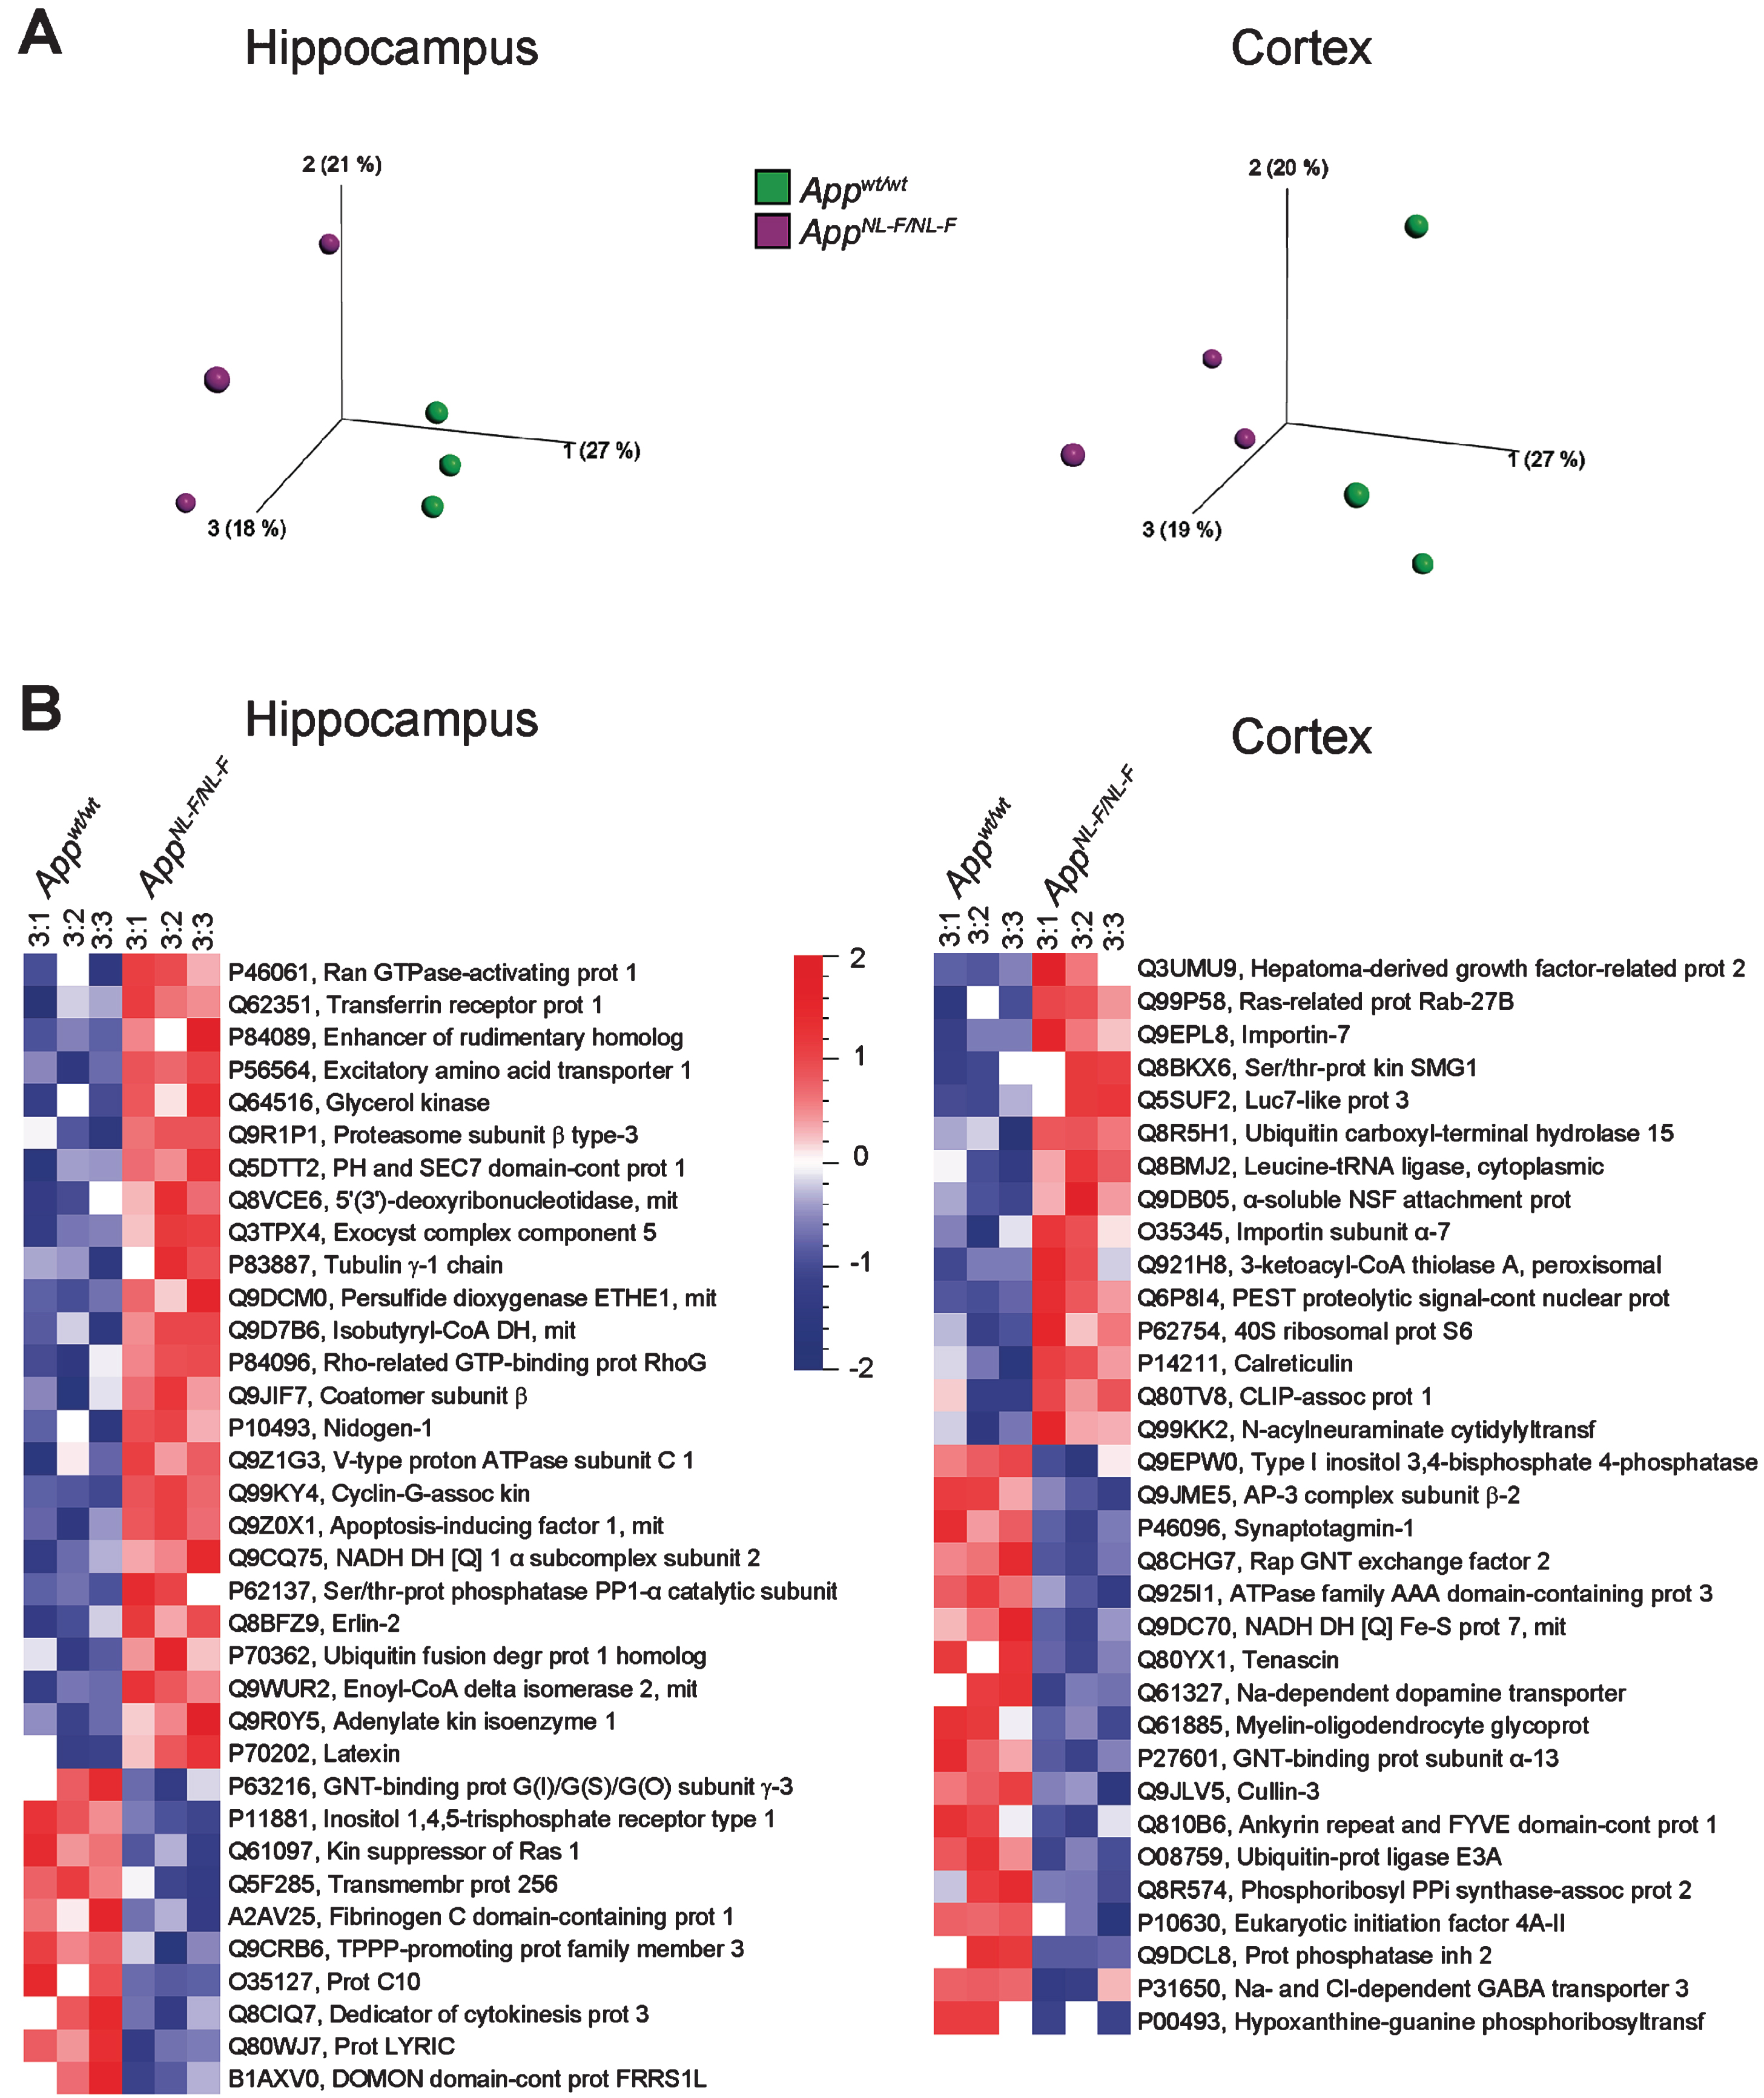
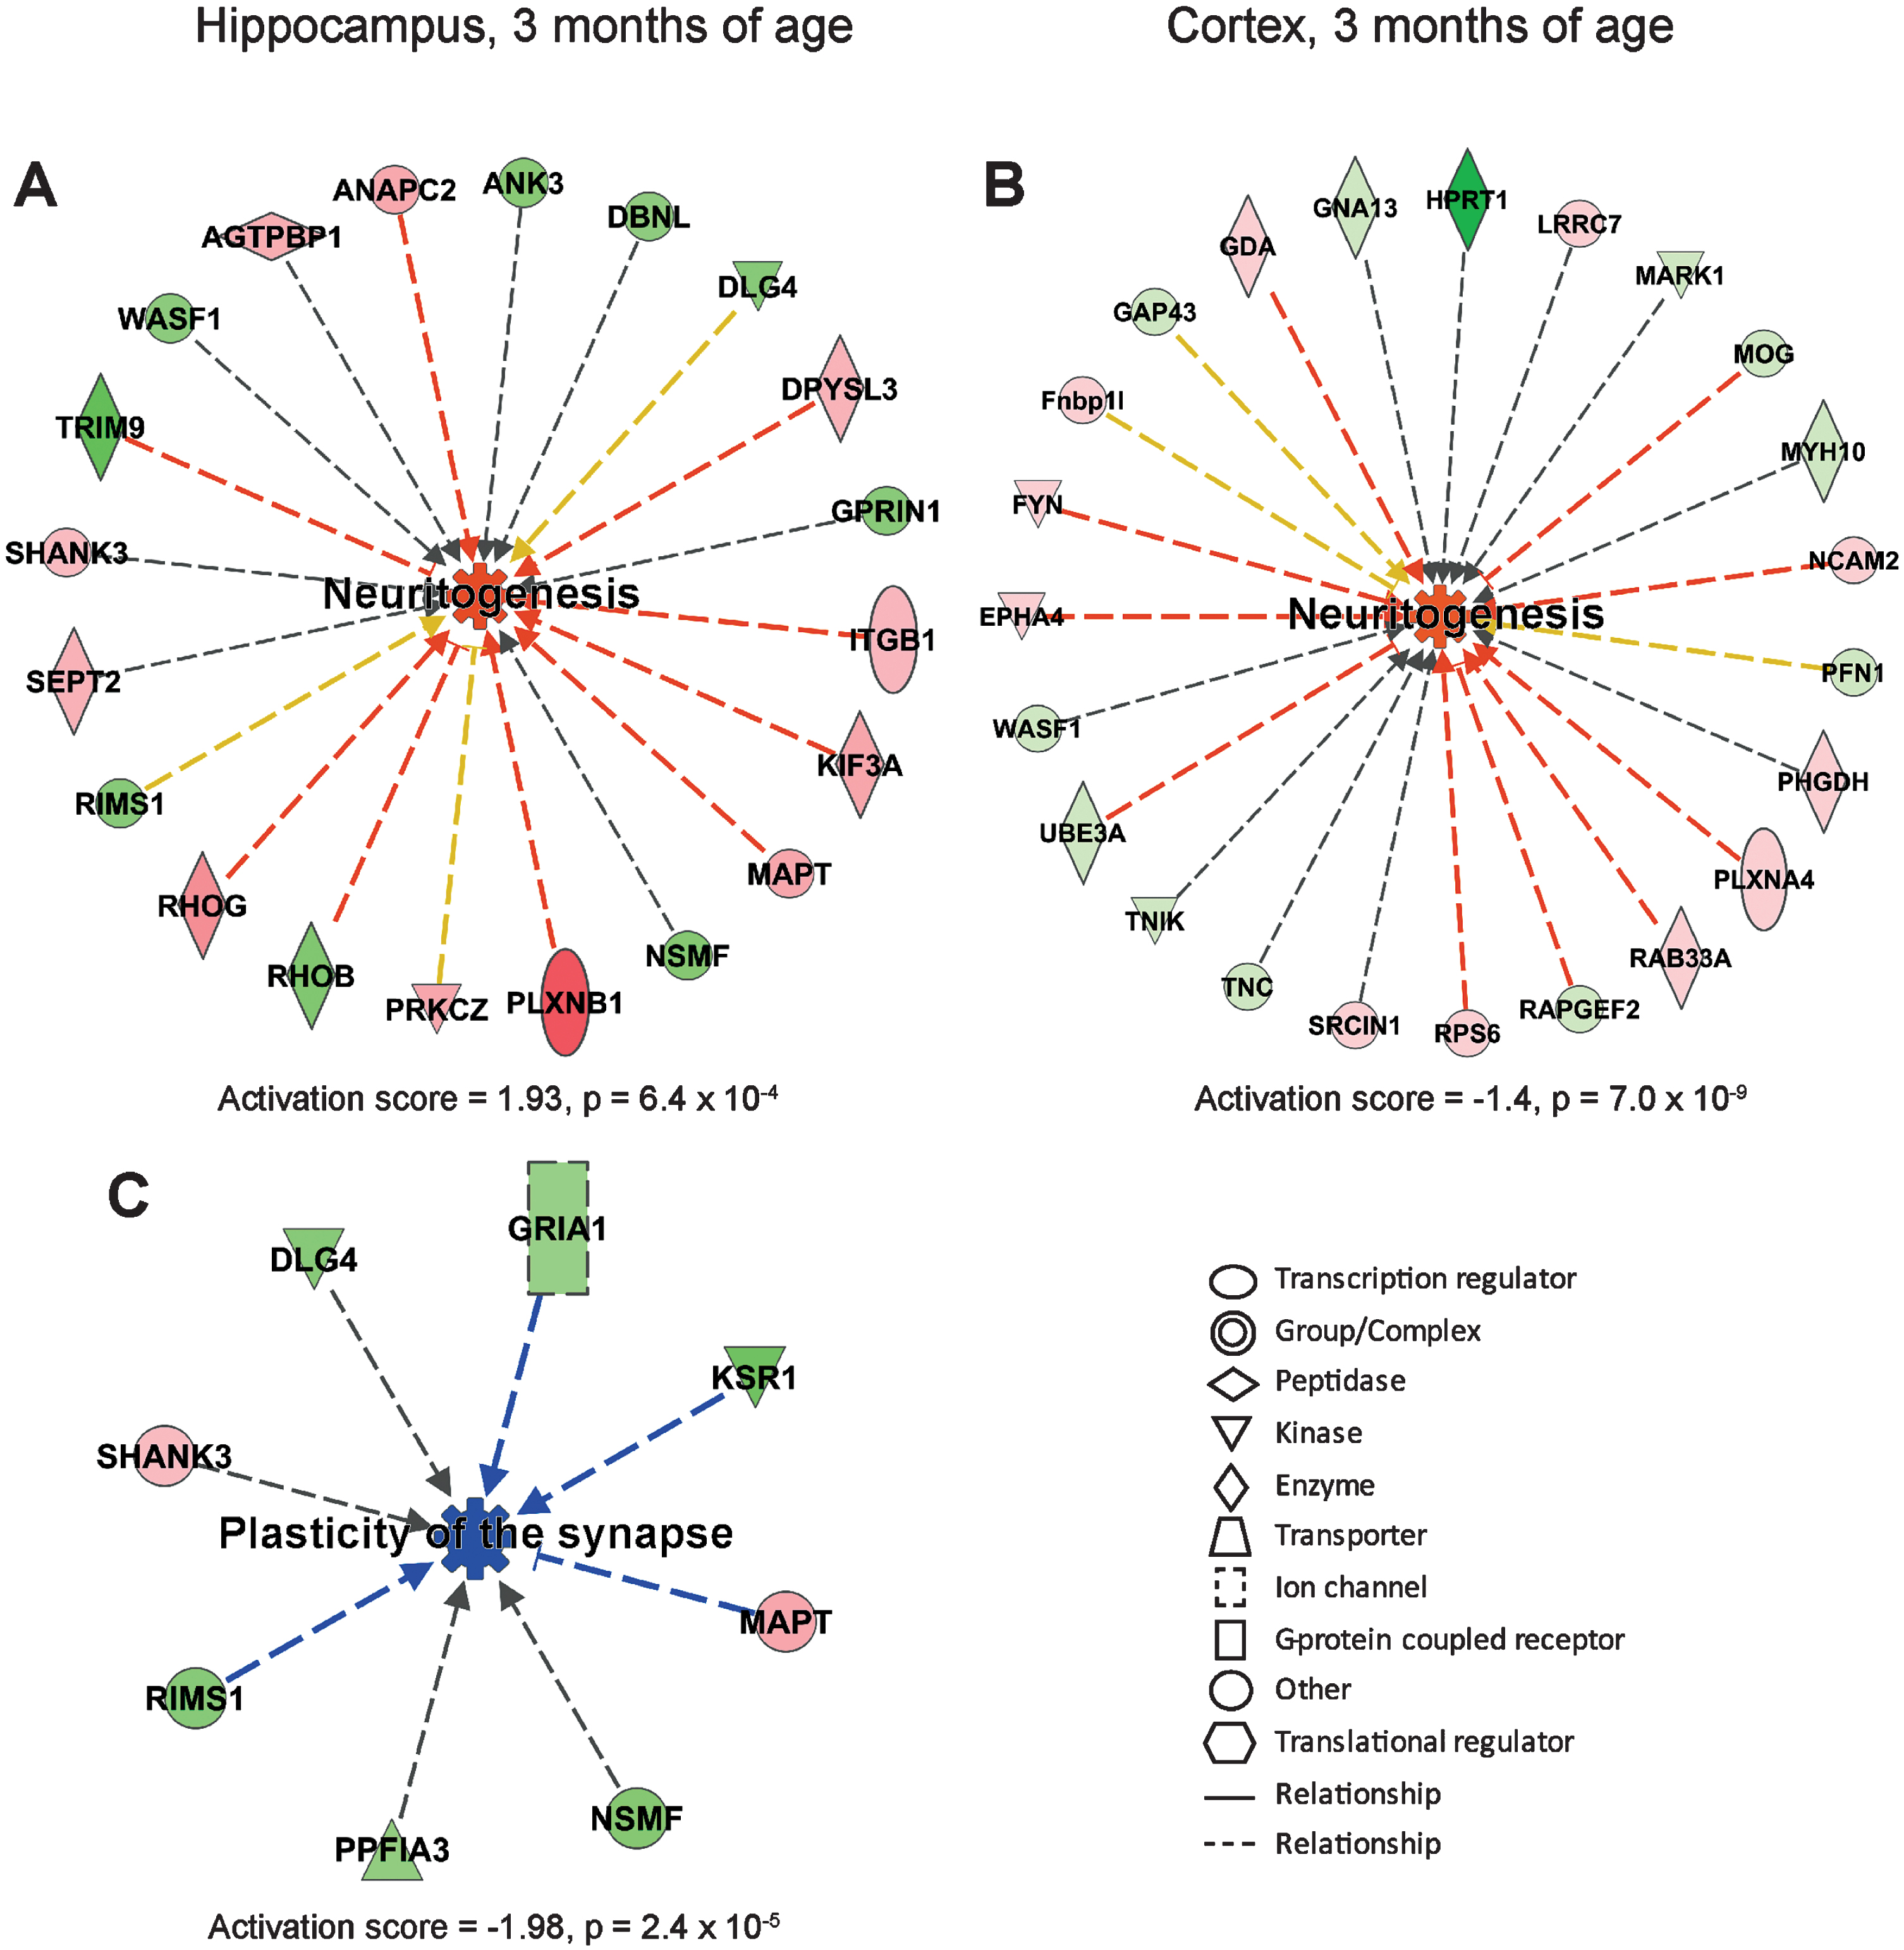
The proteins that were differently expressed (over 1.1-fold change and p < 0.1, Supplementary Tables 1–8) in AppNL-F/NL-F mice as compared to Appwt/wt mice were further subjected to IPA, a web-based bioinformatics tool that allows interpretation of large datasets in relation to biological systems. Notably, IPA suggested that several biological processes are altered already at 3 months of age. Neuritogenesis was among the most upregulated processes both in hippocampus and cortex (Fig. 2A, B). In analogy, microtubule dynamics, which shares many regulatory proteins with neuritogenesis, was upregulated in hippocampus (Supplementary Figure 2A). Plasticity of the synapse was suggested to be the most downregulated process in hippocampus (Fig. 2C) followed by long term synaptic depression of neurons (Supplementary Figure 2B).
Fig.2
Affected processes in hippocampus and cortex of AppNL-F/NL-F mice at 3 months of age. Proteins found to have an altered level in AppNL-F/NL-F compared to Appwt/wt mice (1.1-fold alteration, p < 0.1) were subjected to IPA analysis. Red and green color, up- and downregulation, respectively. a) Upregulated process in hippocampus. b) Upregulated process in cortex. c) Downregulated process in hippocampus. Orange and blue color, predicted up- and downregulation, respectively. Blue and orange arrows, consistent with literature data, yellow arrows, inconsistent with literature data.
Fundamental processes for proper neuronal functioning were affected at 6 months of age
At 6 months of age, the abundance of 43 proteins in hippocampus and 52 in cortex were altered in the AppNL-F/NL-F mice using the same selection criteria as for 3-month-old mice (Supplementary Figure 3). Although only a few proteins overlapped between the time points, many of the differently expressed proteins at 3 and 6 months of age are involved in similar biological pathways, for instance neuron/brain development, cytoskeletal dynamics/remodeling, synaptic function, and vesicular transport.
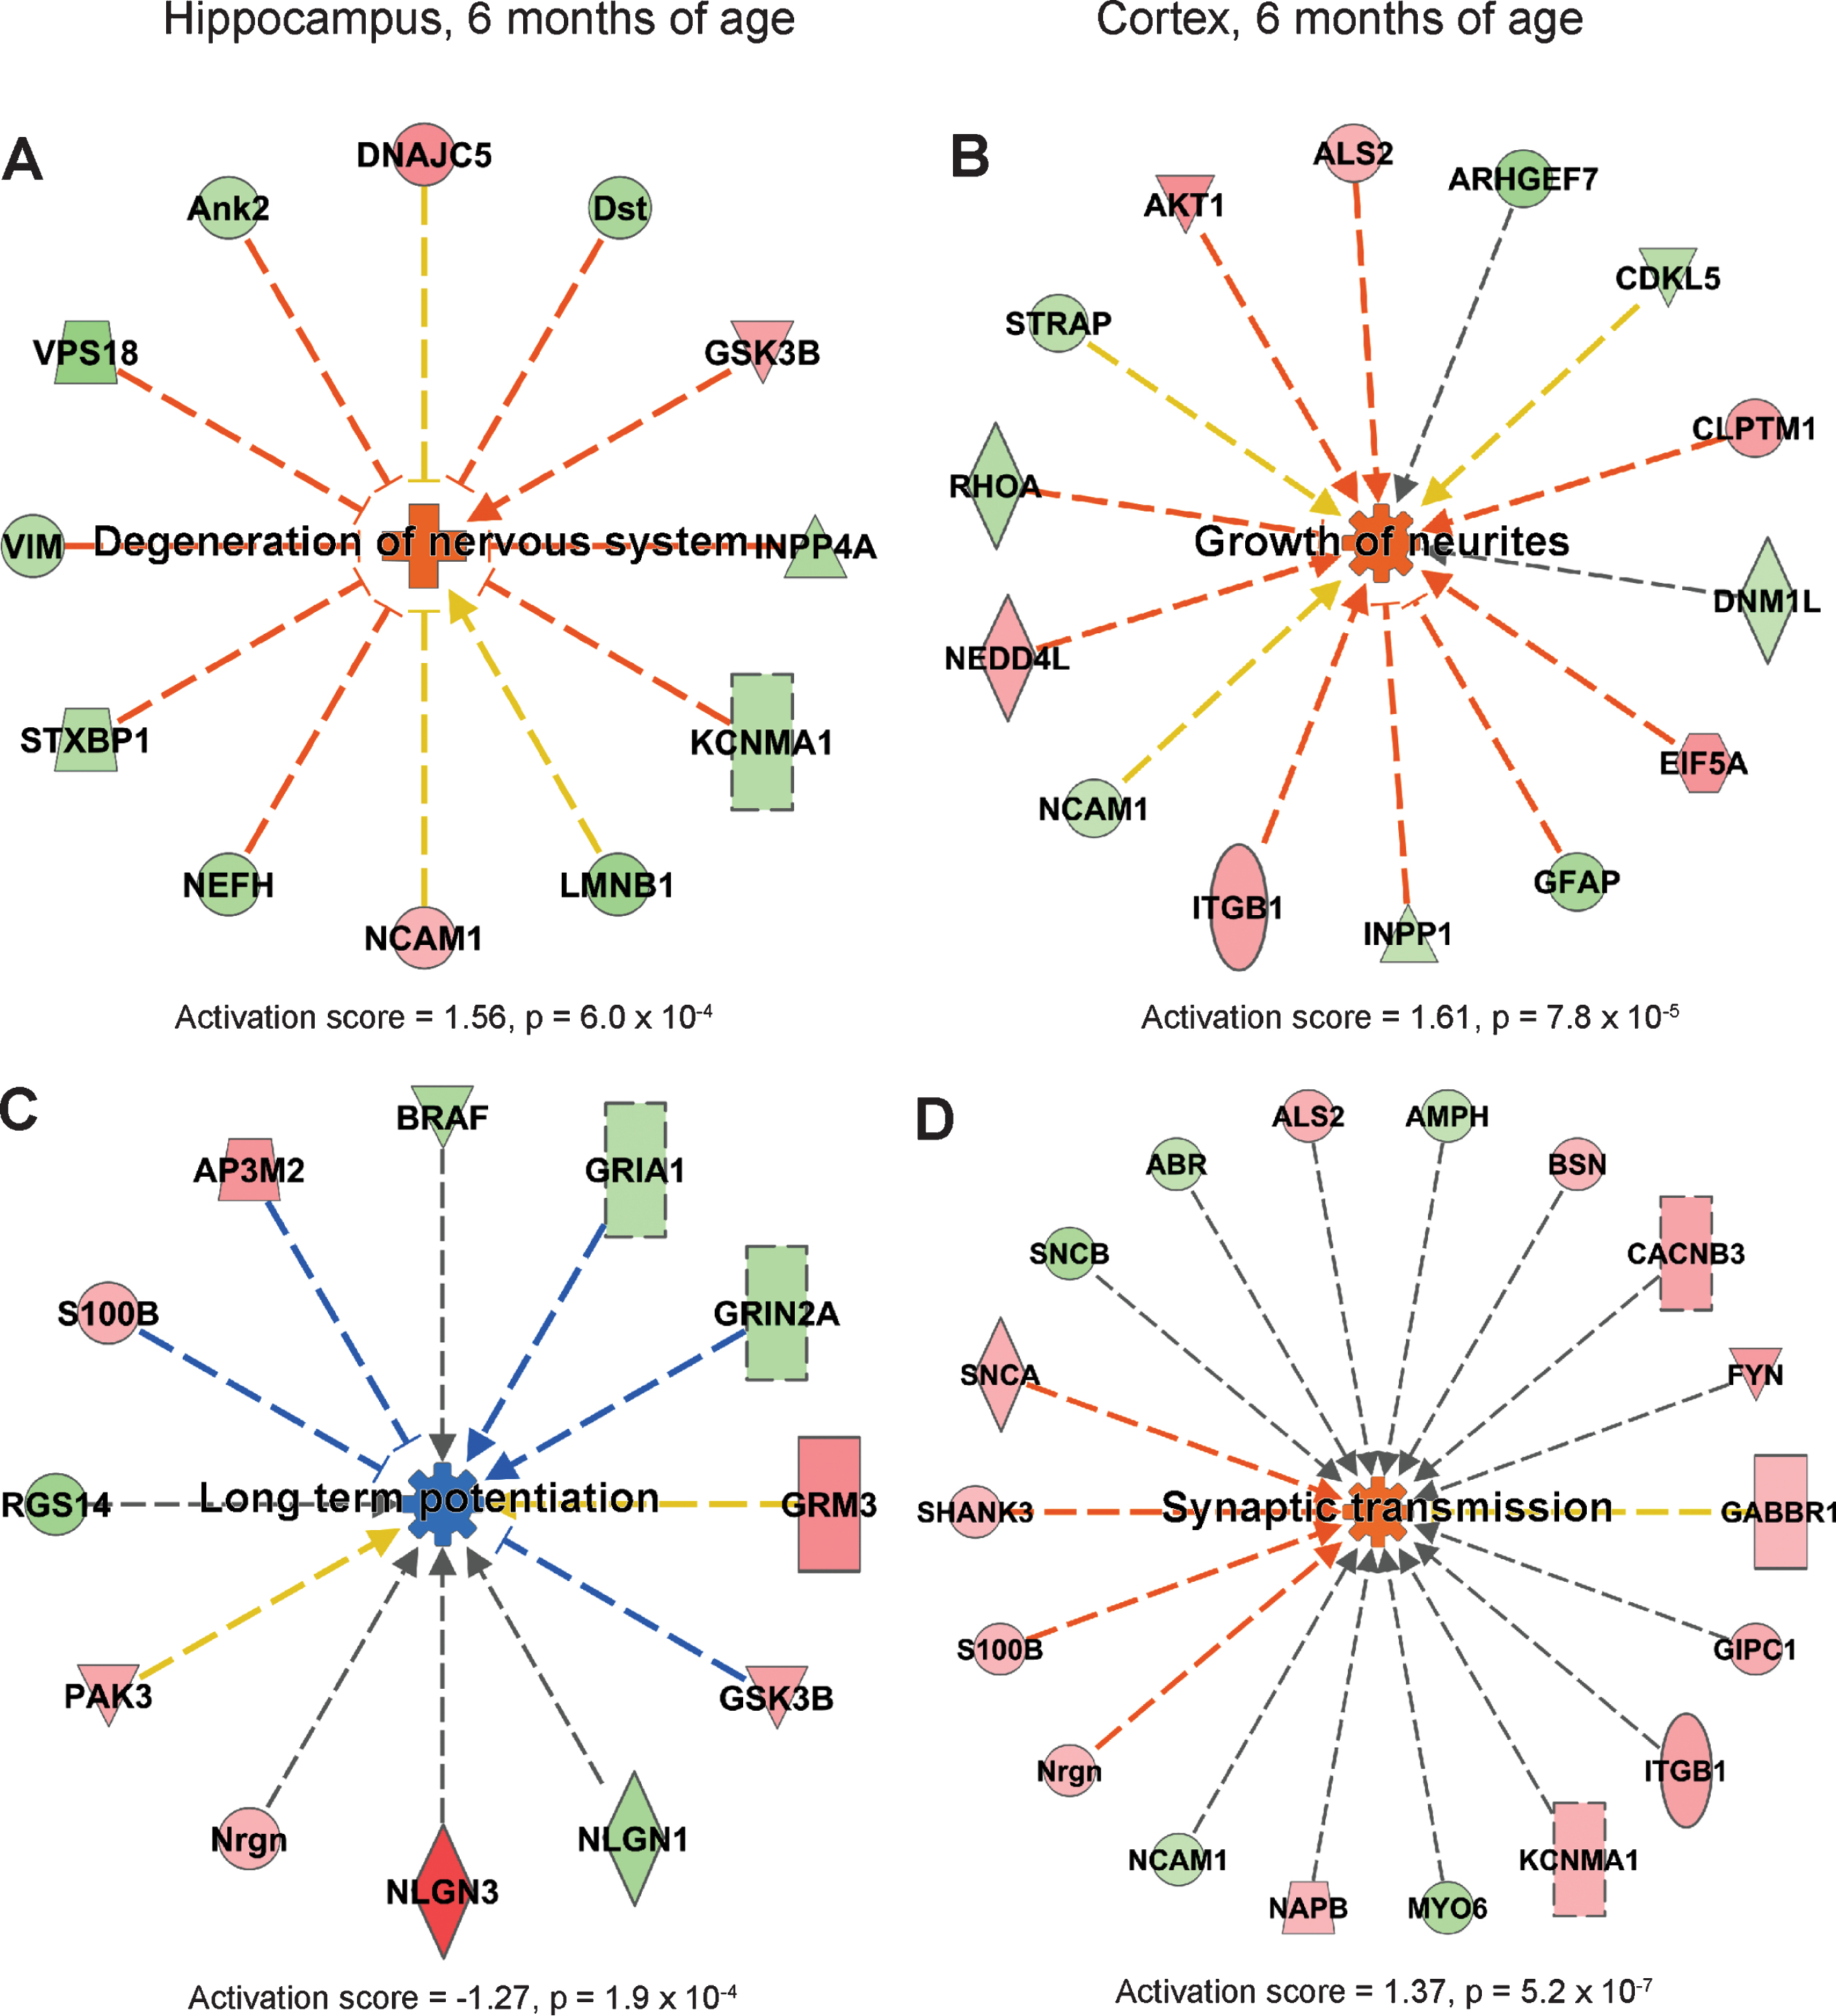
IPA showed that processes leading to degeneration of nervous system was upregulated in hippocampus of AppNL-F/NL-F mice at 6 months of age (Fig. 3A), while long-term potentiation was downregulated (Fig. 3C). In cortex, processes involving growth of neurites and branching of neurons were upregulated (Fig. 3B, Supplementary Figure 4A). In addition, synaptic transmission and gliosis were upregulated in cortex at 6 months of age (Fig. 3D, Supplementary Figure 4B).
Fig.3
Affected processes in hippocampus and cortex of 6 months old AppNL-F/NL-F mice. Proteins found to have an altered level in hippocampus and cortex in AppNL-F/NL-F compared to Appwt/wt mice (1.1-fold alteration, p < 0.1) were subjected to IPA analysis. a) Upregulated process in hippocampus. b, d) Upregulated processes in cortex. c) Downregulated process in hippocampus. Red and green color, up- and downregulation, respectively. Orange and blue color, predicted up- and downregulation, respectively. Blue and orange arrows, consistent with literature data, yellow arrows, inconsistent with literature data.
Proteins involved in mechanisms involving cell death are activated at 9 months of age
In 9-month-old AppNL-F/NL-F mice, the abundance of 35 proteins from hippocampus and 37 from cortex were found to be significantly altered by using Qlucore omics explorer with the same selection criteria as for the other time points (Supplementary Figure 5). Many of these proteins are involved in regulation of various signaling pathways, cytoskeletal dynamics/regulation, and neuron/brain development. Interestingly, some of these proteins are involved in regulation of heat shock response and cell death, which was not observed in the earlier ages.
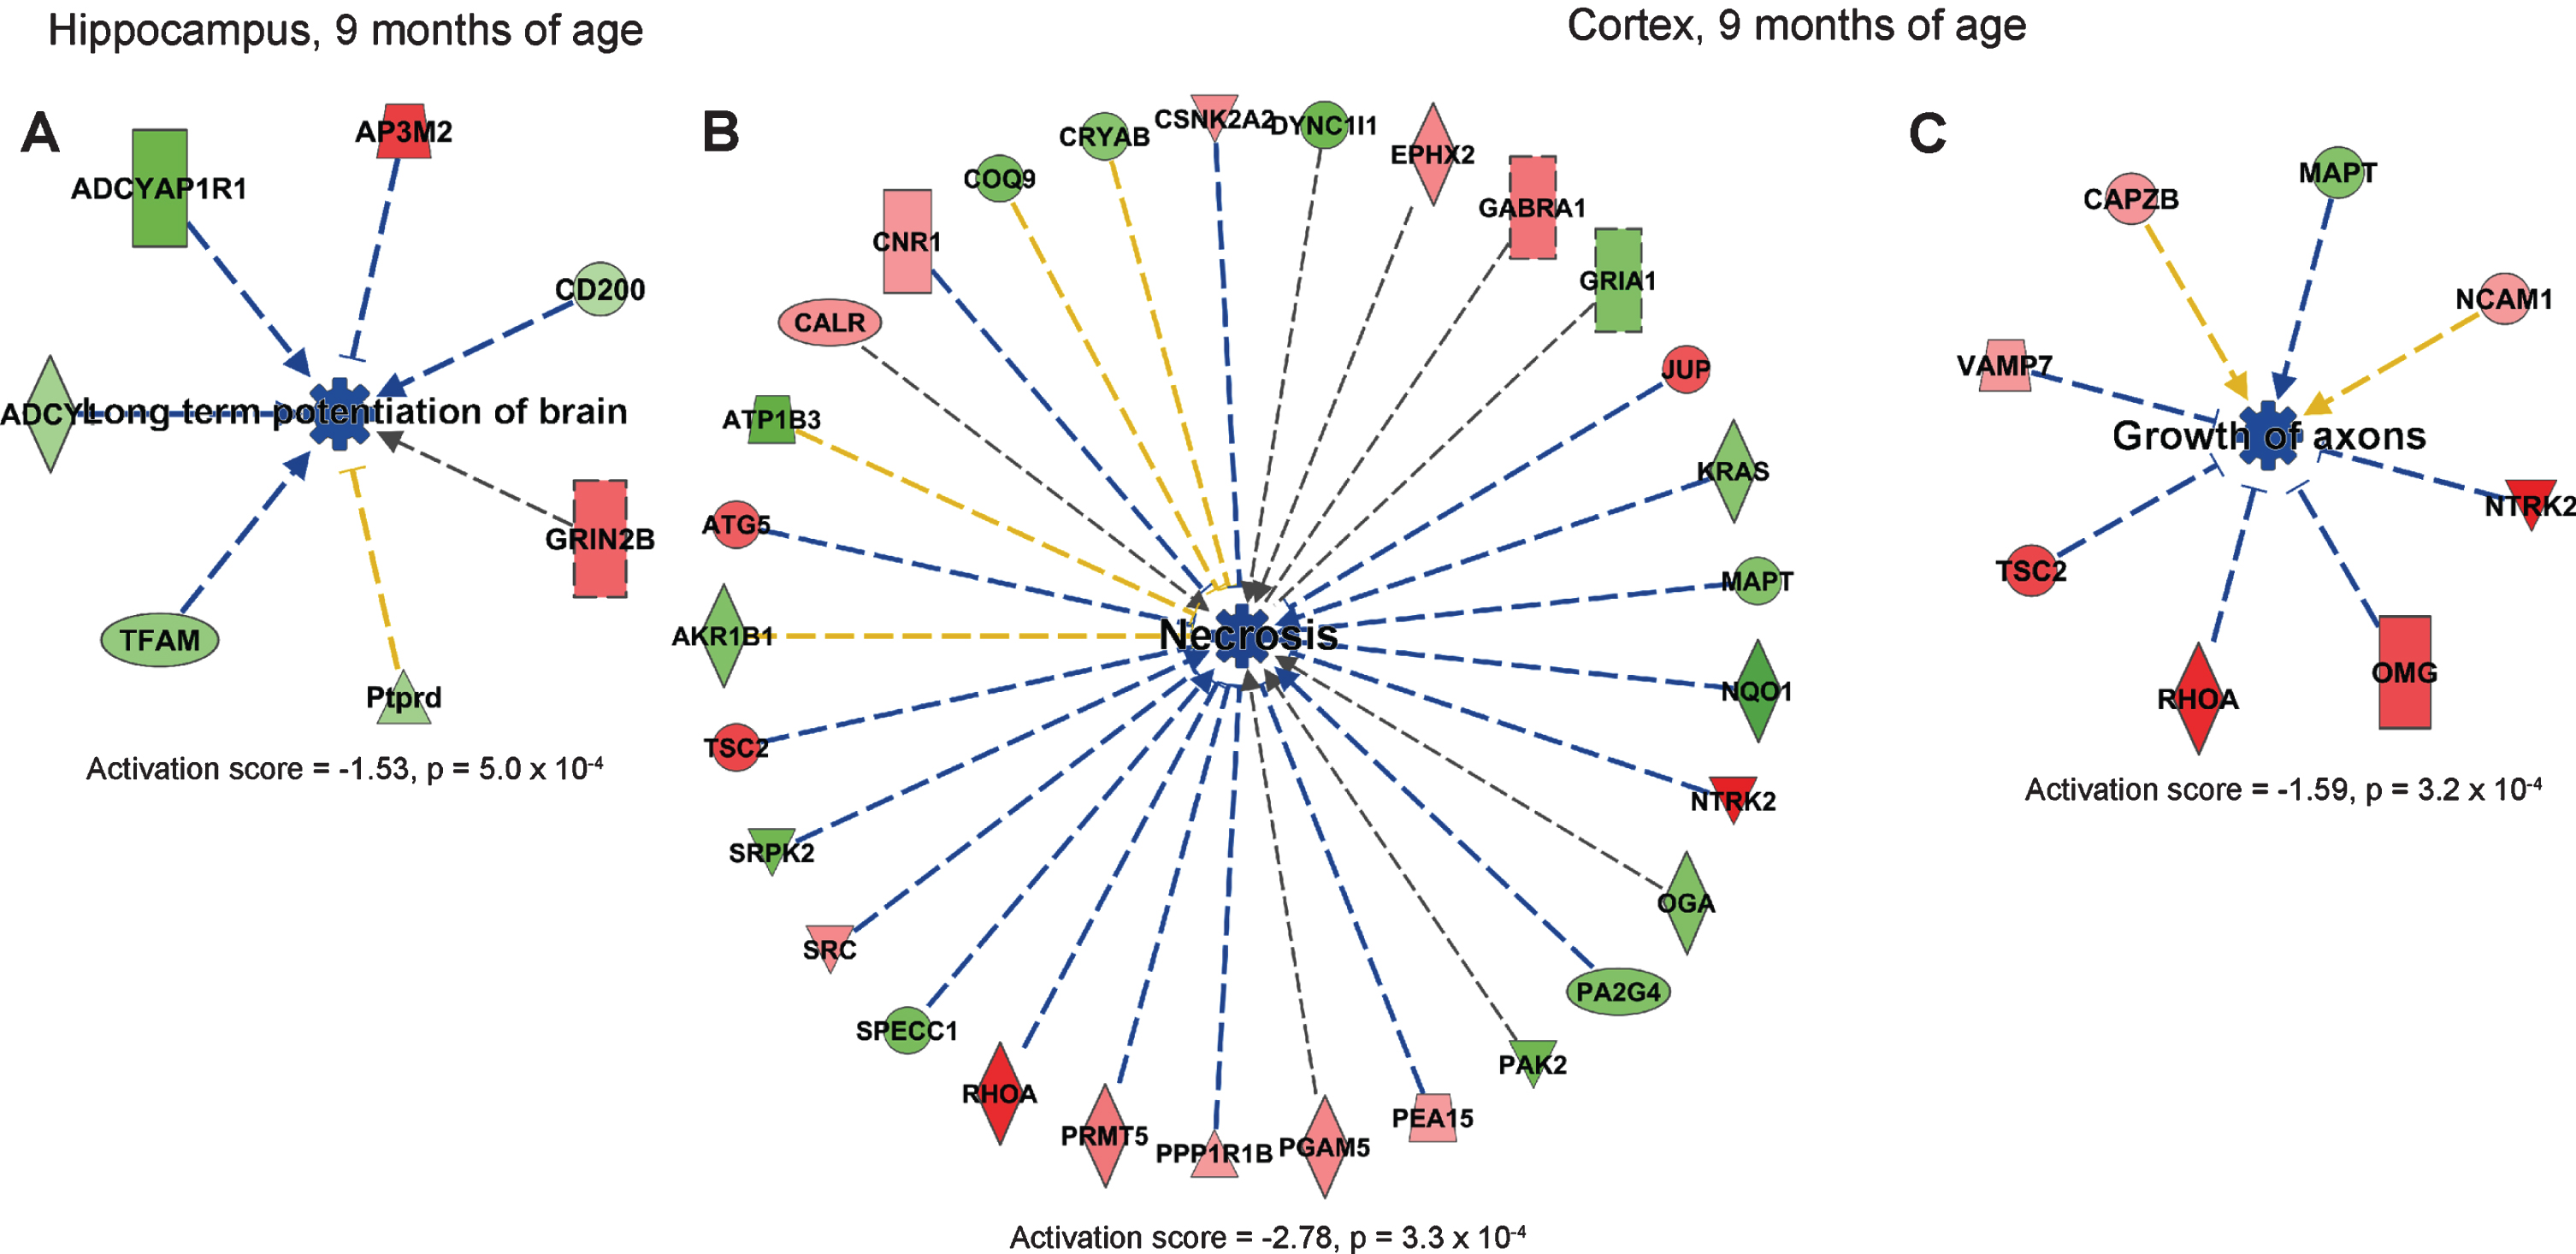
IPA analysis suggested that long-term potentiation of brain was downregulated in hippocampus in AppNL-F/NL-F mice at 9 months of age (Fig. 4A). Notably, downregulated processes dominated at this time-point, and the most significantly downregulated processes in cortex were necrosis and growth of axons (Fig. 4B, C).
Fig.4
Affected processes in hippocampus and cortex at 9-month-old AppNL-F/NL-F mice. Proteins found to have an altered level in cortex in AppNL-F/NL-F compared to Appwt/wt mice (1.1-fold alteration, p < 0.1) were subjected to IPA analysis. a) Downregulated process in hippocampus. b, c) Downregulated processes in cortex. Red and green, up- and downregulation, respectively. Blue color, predicted downregulation. Blue and yellow arrows, consistent and inconsistent with literature data, respectively.
Cellular pathways related to oxidative stress and cell death were altered at 18 months
In 18-month-old AppNL-F/NL-F mice, 40 proteins from hippocampus and 49 from cortex were significantly altered compared to wild type mice (Supplementary Figure 6). The affected proteins are to a large extent involved in neuron/brain development, vesicular transport, cell growth/cell cycle regulation, cytoskeletal dynamics/remodeling, signaling, lipid metabolism, and respiratory chain. At 18 months of age, levels of proteins involved in cell death and cellular response to oxidative stress were also found to be altered.
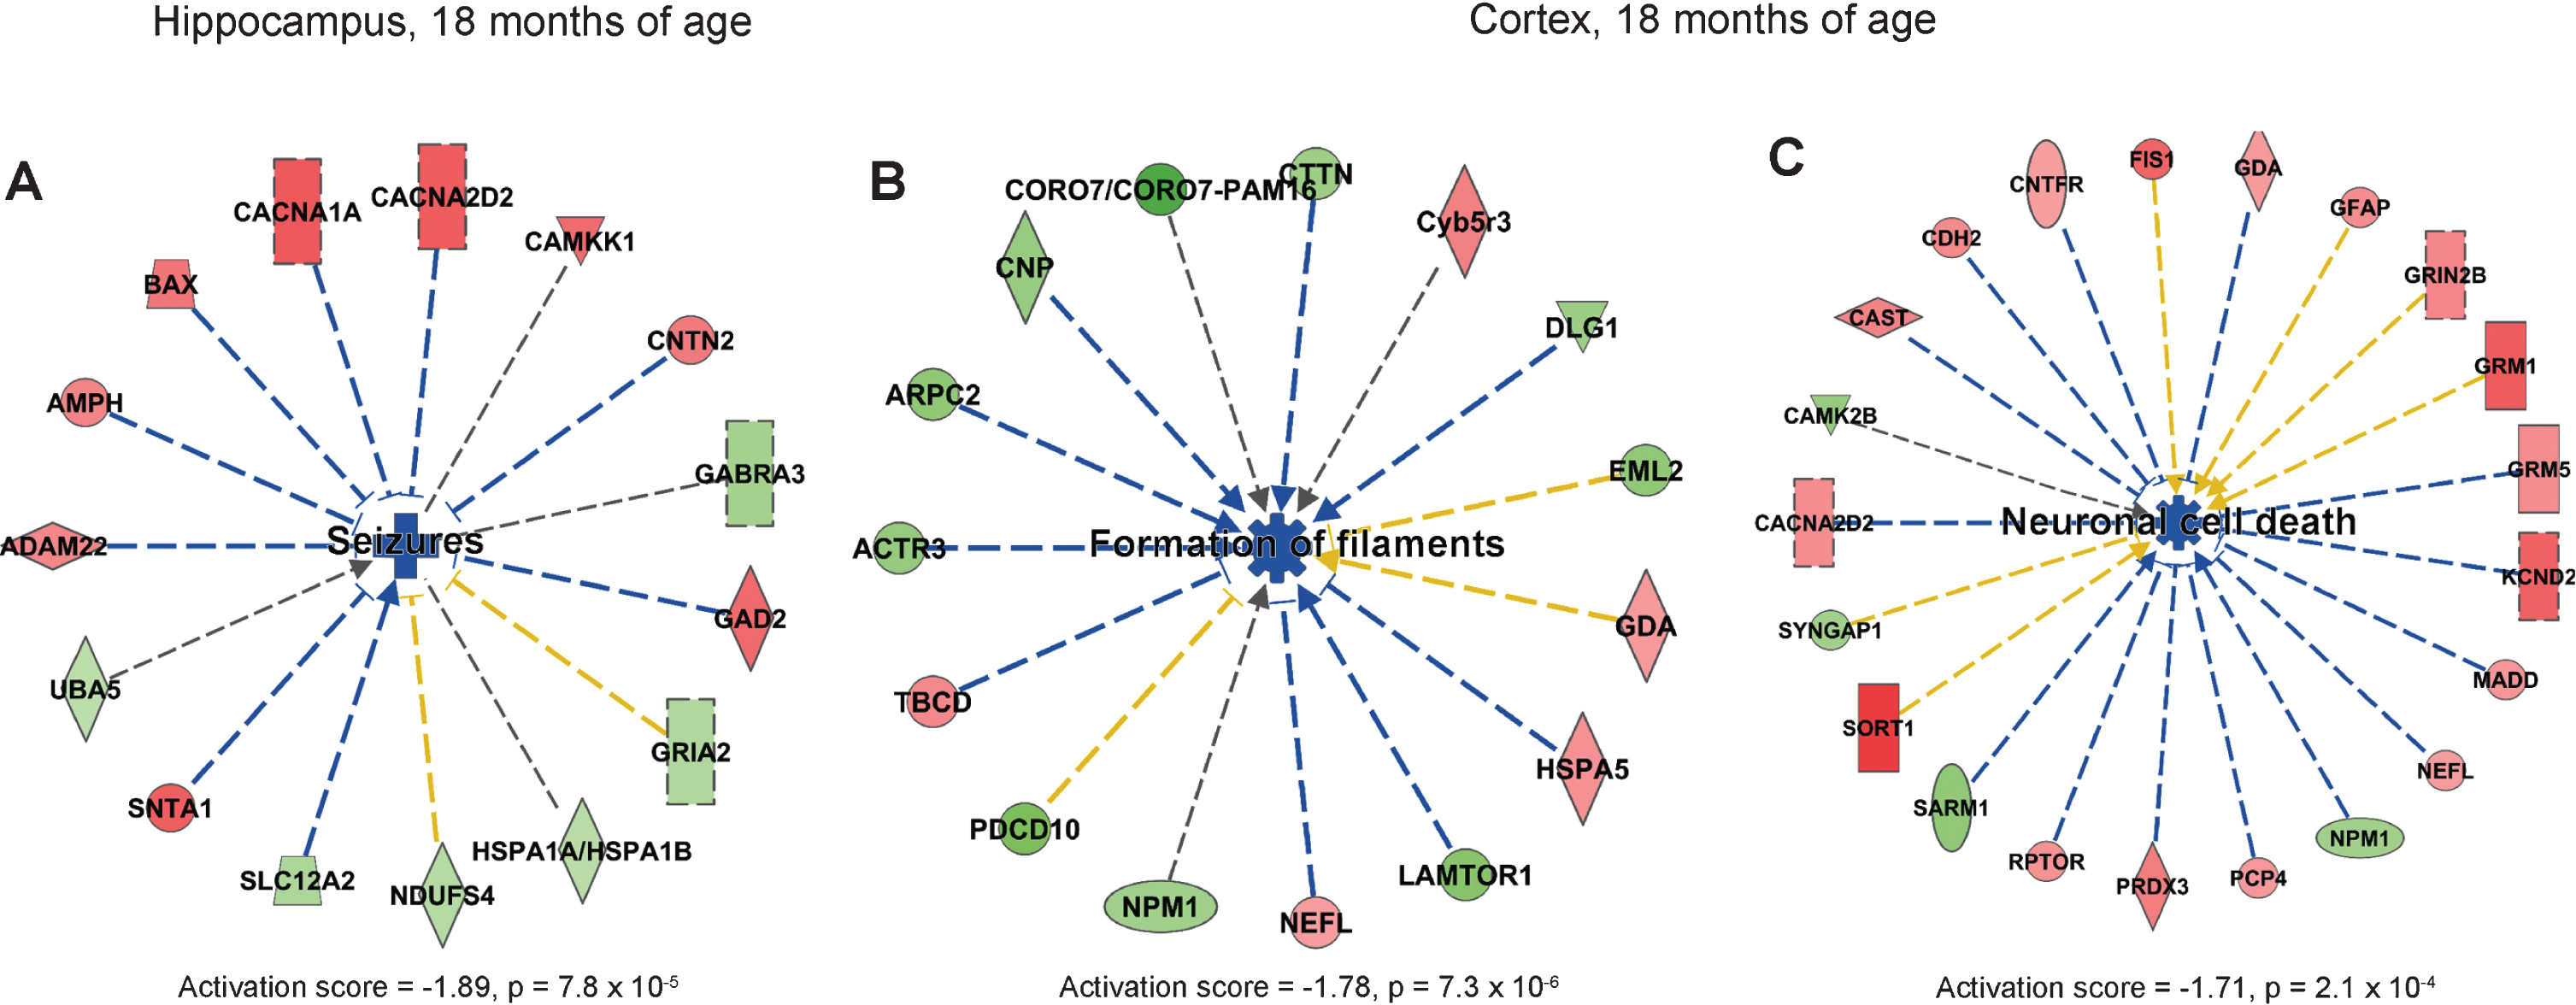
IPA analysis showed that the process “seizures” was predicted to be downregulated in hippocampus in AppNL-F/NL-F compared to wild type mice (Fig. 5A). In cortex, formation of filaments and neuronal cell death were predicted to be downregulated (Fig. 5B, C). In addition, righting reflex was downregulated in cortex in AppNL-F/NL-F mice at 18 months of age (Supplementary Figure 7). Similar to the 9-month-old AppNL-F/NL-F mice, downregulated processes dominated in 18-month-old mice.
Fig.5
Affected processes in hippocampus and cortex of 18-month old AppNL-F/NL-F mice. Proteins found to have an altered level in hippocampus and cortex in AppNL-F/NL-F compared to Appwt/wt mice (1.1-fold alteration, p < 0.1) were subjected to IPA analysis. a) Downregulated process in hippocampus. b, c) Downregulated processes in cortex. Red and green color, up- and downregulation, respectively. Blue color, predicted downregulation. Blue arrows, consistent with literature data; yellow lines, inconsistent with literature data.
Changes in neuritogenesis and neuronal cell death over time
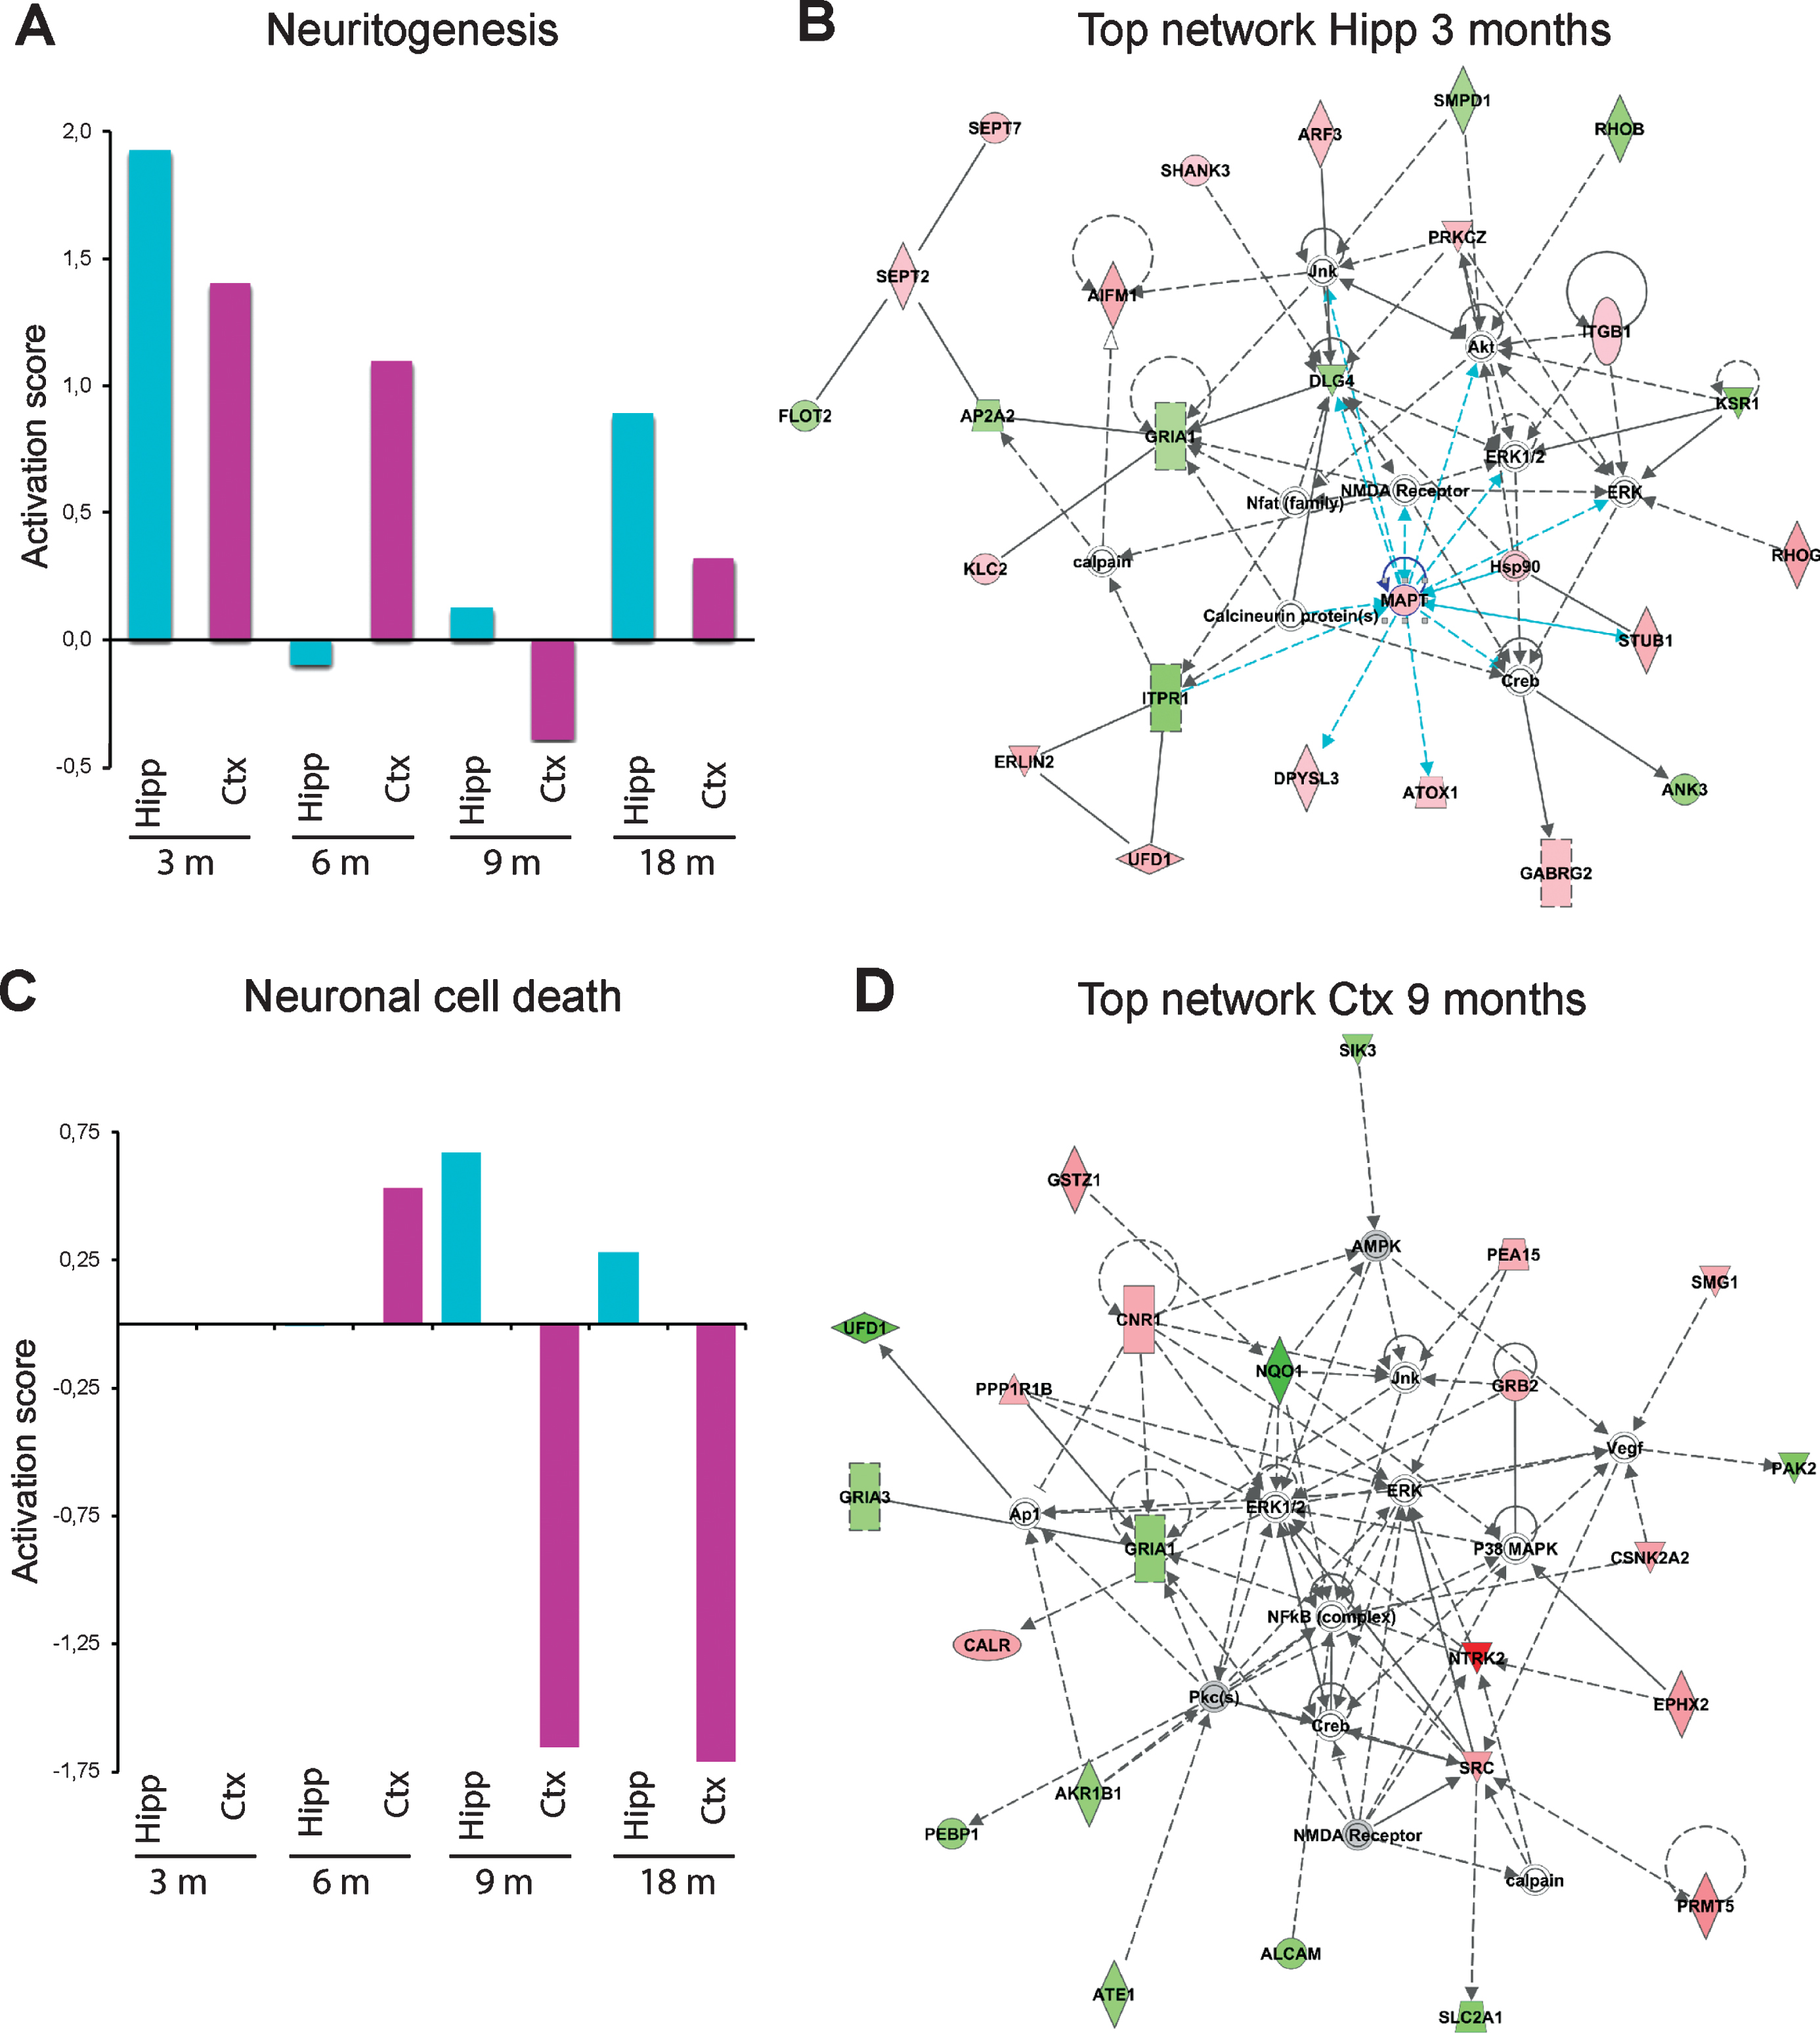
Interestingly, IPA analysis revealed that different regulators, processes, and networks were affected in the different ages of the mice (3, 6, 9, and 18 months). We focused on changes in two biological processes, neuritogenesis and neuronal cell death, which showed dramatic changes over time (Fig. 6). It was apparent that the activation score for neuritogenesis, which was remarkably upregulated in both hippocampus and cortex at 3 months of age, reached the lowest score at 6 months of age in hippocampus, and at 9 months of age in cortex (Fig. 6A). Besides identifying altered processes, IPA can also provide information on networks, i.e., proteins that interact directly or indirectly with each other. In analogy with the upregulated neuritogenesis in hippocampus at 3 months of age, the top-ranked IPA network involved cell-to-cell signaling and interaction, cellular development, nervous system development and function (Fig. 6B). This network includes microtubule associated protein tau (MAPT) as a central player in hippocampus (Fig. 2A). It also contains several synaptic proteins such as postsynaptic density protein 95 (PSD95, in IPA referred to as DLG4 from the gene name), the ion channels glutamate ionotropic receptor AMPA type subunit 1 (GRIA1) and GABA type A receptor γ 2 subunit (GABRG2).
In contrast to neuritogenesis, processes leading to neuronal cell death were not altered in hippocampus or cortex at 3 or 6 months of age, but were dramatically downregulated in cortex at 9 and 18 months of age (Fig. 6C). Interestingly, the top-ranked network in cortex at 9 months of age involved cell death and survival, cell-to-cell signaling and interaction, nervous system development and function (Fig. 6D). Top-ranked networks at other time-points are shown in Supplementary Figures 8 and 9. Notably, receptors and other proteins involved in synaptic function were altered at all time points.
Fig.6
Effects on neuritogenesis and neuronal cell death and top-ranked networks in AppNL-F/NL-F mice over time. Proteins found to have an altered level in hippocampus and cortex in AppNL-F/NL-F compared to Appwt/wt mice (1.1-fold alteration, p < 0.1) were subjected to IPA analysis. a) Activation scores for neuritogenesis over time. b) Top-ranked IPA network in hippocampus at 3 months of age. c) Activation scores for neuronal cell death over time. d) Top-ranked network in cortex at 9 months of age.
Upstream regulators
Next, we investigated upstream regulators at the different ages of the mice (Table 1). At 3 months of age in hippocampus, the DNA/chromatin-binding protein nuclear factor of activated T cells (Nfat1) was top ranked. Other upstream regulators at 3 months in hippocampus include proteins that are present at the synapse: septin 5 (SEPT 5), α-synuclein (SNCA), and ADAM10. In addition, MTOR was identified as an upstream regulator, which may affect regulation of autophagy. Epidermal growth factor receptor (EGFR) was found to be the upstream regulator in hippocampus with the highest activation score (2.44) at 3 months age (Supplementary Figure 10A). In hippocampus at 3 months of age, the synaptic protein SNCA was a top upstream regulator. Another protein interestingly found to be an upstream regulator in cortex at 3 months of age was O-linked N-acetylglucosamine (O-GlcNAc) transferase (OGT), which catalyzes the addition of a GlcNAc to Ser or Thr in intracellular proteins.
Table 1
Top upstream regulators identified by IPA analyses
| Top upstream protein regulators | ||||||||
| 3 months | 6 months | 9 months | 18 months | |||||
| Hipp | Ctx | Hipp | Ctx | Hipp | Ctx | Hipp | Ctx | |
| 1 | Nfat (2.9×10⁻⁵) | SNCA (2.9×10⁻³) | PSEN1 (1.2×10⁻⁶) | MAPT (2.3×10⁻¹⁴) | MAPT (1.4×10⁻⁴) | MTOR (1.5×10⁻⁵) | MAPT (6.6×10⁻⁷) | MAPT (6.7×10⁻⁸) |
| 2 | SEPT5 (6.6×10⁻⁵) | OGT (3.1×10⁻³) | MAPT (2.7×10⁻⁵) | PSEN1 (1.7×10⁻⁸) | SOD1 (3.4×10⁻⁴) | HTT (8.1×10⁻⁵) | AβPP (5.0×10⁻⁵) | HTT (2.3×10⁻⁶) |
| 3 | MTOR (1.4×10⁻⁴) | MTORC1 (4.7×10⁻³) | PPARGC1A (2.7×10⁻⁵) | AβPP (2.5×10⁻⁸) | PDYN (2.3×10⁻³) | LGI1 (2.0×10⁻⁴) | PFDN6 (5.8×10⁻⁴) | TOR1A (1.4×10⁻⁵) |
| 4 | SNCA (2.6×10⁻⁴) | MMP14 (5.4×10⁻³) | AβPP (3.0×10⁻⁵) | EGFR (8.9×10⁻⁵) | SNCA (3.0×10⁻³) | PDPK1 (9.9×10⁻⁴) | VBP1 (5.8×10⁻⁴) | ALX3 (1.1×10⁻⁴) |
| 5 | ADAM10 (3.6×10⁻⁴) | SGSM1 (6.9×10⁻³) | MC4R (1.5×10⁻⁴) | ITGB4 (1.1×10⁻⁴) | HTT (3.2×10⁻³) | NR1D1 (2.9×10⁻³) | DIO2 (6.1×10⁻⁴) | VPS6B (1.1×10⁻⁴) |
| x | 11:HTT (4.1×10⁻³) | 10:HTT (1.1×10⁻³) | 8:HTT (2.1×10⁻³) | |||||
The relative protein levels in hippocampus and cortex of 3-, 6-, 9-, and 18-month-old AppNL-F/NL-F mice compared with Appwt/wt mice were analyzed by Ingenuity Pathway analysis (IPA) analysis. Gene symbols are shown for the five most significant upstream protein regulators at each brain region and time point (p-values in brackets).
IPA analysis of the proteome of the brains from AppNL-F/NL-F mice of different ages of mice also identified several upstream regulators including previously known AD associated proteins such as MAPT, PSEN1, and AβPP (Table 1, Supplementary Figure 10B-E).
Altered levels of HTT in hippocampus of APPNL-F mice
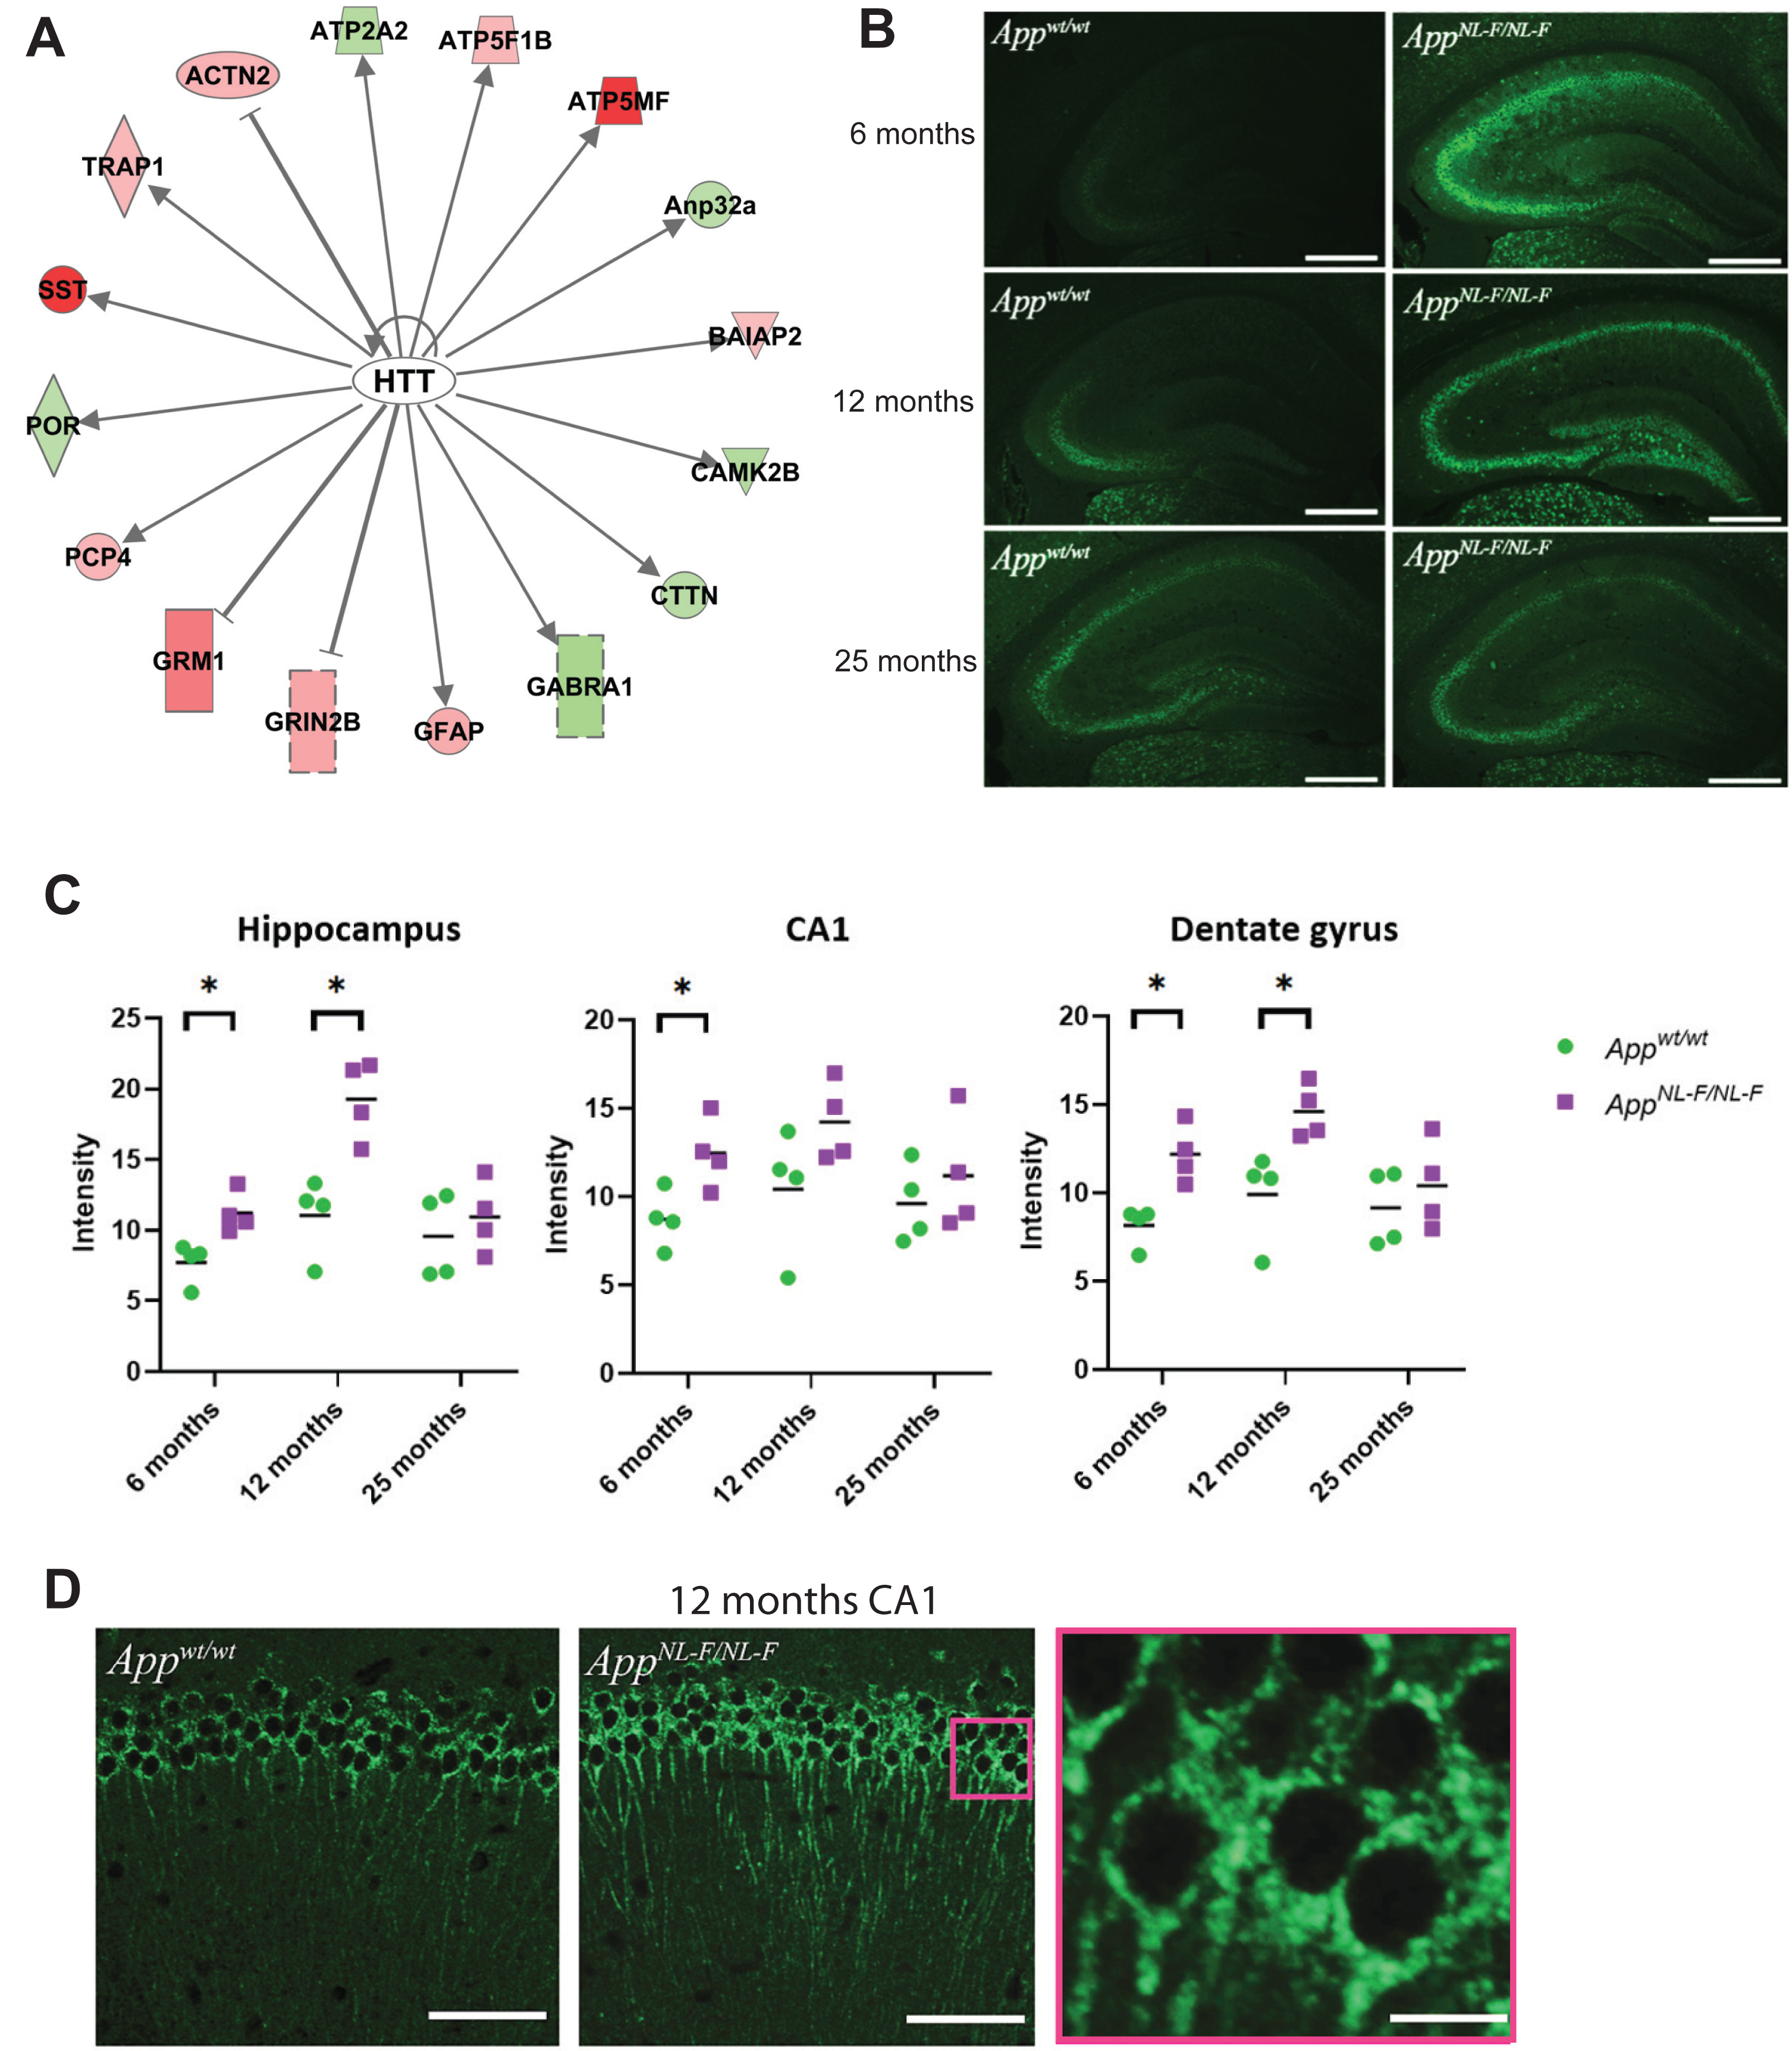
Notably, one of the top upstream regulators, HTT, was identified in both 9- and 18-month-old AppNL-F/NL mice (Table 1, Fig. 7A). This protein is involved in neurodegeneration in Huntington’s disease and has previously been found in neuronal tangles in AD brains using immunohistochemistry (IHC) [21]. Still, HTT has not been described as a key regulator in relevant AD models, nor has it been studied by IHC in such models. Immunofluorescence microscopy studies of the hippocampus and the hippocampal subregions of 6-, 12-, and 25-month-old AppNL-F/NL-F and Appwt/wt mice was performed to determine relative HTT levels and cellular distribution and any age-related progression of signal intensity throughout the hippocampus. Interestingly, quantification of signal intensity from immunofluorescence data of the hippocampus at 6, 12, and 25 months of age showed a significantly (p < 0.05) higher signal of HTT in the entire hippocampus in the AppNL-F/NL-F mice compared to Appwt/wt mice at 6 and 12 months of age (Fig. 7B). The intensity increased from 6 to 12 months and then decreased at 25 months of age (Fig. 7C). The signal intensity in the entire hippocampus reached a peak at 12 months of age. A significant difference in signal intensity in CA1 was detected comparing 6 and 12 months old AppNL-F/NL-F and Appwt/wt mice (Fig. 7C). No difference in hippocampal or hippocampal subregion signal intensity was detected between AppNL-F/NL-F and Appwt/wt at 25 months of age. Subcellular analysis of the HTT-positive staining of neurons in CA1 revealed granular staining in the soma region and axons (Fig. 7D). Unlike the HTT pathology characteristic of Huntington’s disease, no aggregation was observed in the nuclei.
Fig.7
HTT is an upstream regulator in AppNL-F/NL-F mice. a) Results from IPA analysis showing that HTT is an upstream regulator in AppNL-F/NL-F mice. b) Representative images of HTT staining in hippocampus brain sections from AppNL-F/NL-F and Appwt/wt mice at 6, 12, and 25 months of age. Scale bars, 500 μm. c) Quantification of the signal intensity as measured in the dentate gyrus, hippocampus and CA1 of AppNL-F/NL-F and Appwt/wt mice of 6, 12, and 25 months of age. *p < 0.05. d) Confocal images of HTT staining in CA1 region in Appwt/wt (left panel) and AppNL-F/NL-F (middle and right panel) at 12 months of age. Scale bars, 100 μm (left and middle panel) and 30 μm (right panel).
DISCUSSION
We have performed a proteomics time-course study of brains from a novel AD mouse model, the App knock-in mouse AppNL-F, expressing high levels of Aβ42 whereas the AβPP levels are physiological. This enabled us to analyze the effects of enhanced Aβ42 levels in the brain over time without the artifacts caused by overexpressing AβPP.
Whereas proteomics of human AD brain samples can only be performed at the end stage of the disease and is accompanied by postmortem degradation of proteins [22], the AppNL-F mice enabled us to follow disease mechanisms induced by increased Aβ42 levels at different ages. We choose to analyze the hippocampus and cortex at four different ages: 3, 6, 9, and 18 months, allowing us to follow the changes in the proteome at different stages of pathology.
Analyses of the protein abundance using both Qlucore omics explorer (heat maps) and IPA revealed that many cellular functions are affected already at 3 months of age. These findings suggest that the presymptomatic stages of AD start before Aβ amyloidosis. The altered protein levels were more pronounced in hippocampus than in cortex at this age. Over time, the changes were increasingly significant also in cortex. Comparing proteomics results at different ages showed that the majority of the proteins with altered levels differed. Similarly, a recently published proteomics study of hippocampus of 8-month-old AppNL-F/NL-F mice identified a set of proteins with altered levels [23] that differed from those identified at 6 months and 9 months in this study.
At 3 months of age, the AppNL-F/NL-F mice have around ten times higher levels of Tris-soluble Aβ42 in cortex compared with wild type mice and a high Aβ42/Aβ40 ratio [9], suggesting that monomeric—and potential low-molecular weight oligomeric—Aβ42 induces effects on several pathways including synaptic function, signaling, cell growth, vesicular transport, and protein degradation. Both glutamatergic and GABAergic signaling were affected at this age. The downregulated long-term depression and plasticity of the synapse at this time point may be related to the reduced mushroom spine density (while stubby and thin spine densities were increased) in hippocampal neurons and brain sections from AppNL-F/NL-F mice [12]. It is worth noting that the Tris-insoluble (guanidine-soluble) pool containing membrane-bound Aβ42 and potential protofibrils/fibrils is increased over 20 times in AppNL-F/NL-F mice compared with wild type mice [9]. Thus, it cannot be excluded that such species could affect the pathways found to be altered at 3 months.
Our study revealed that proteins on both the pre- and postsynaptic side are involved in the processes and pathways affected at 3 months, which may explain the altered functional connectivity of brain networks identified in 3 months old AppNL-F/NL-F mice [14]. Interestingly, these effects remained, since both glutamatergic and GABAergic signaling were affected at all time points throughout this study. Among upstream regulators, presynaptic proteins were predominant at the 3-month time point. This is in line with our recent study using super-resolution microscopy showing that Aβ42 in hippocampal neurons is abundant in small vesicles in the presynapse but not in the postsynapse [24].
The finding that MAPT was implicated in dysregulation of pathways in AppNL-F/NL-F mice is interesting, and previous studies have shown that hyperphosphorylation of MAPT occurs in this mouse model but without formation of neurofibrillary tangles (NFTs). Here, IPA identified MAPT as a central player in the most significant network in hippocampus at 3 months of age. Furthermore, MAPT was suggested to be an upstream regulator at all older ages studied here. Thus, MAPT regulation is altered without leading to the formation of NFTs in the AppNL-F mouse model. The lack of NFT pathology in the AppNL-F/NL-F mice may be related to one or several factors that differ between mouse and human MAPT. Such differences could be for example the different splicing pattern of mouse tau as compared to human tau or posttranslational modifications such as glycosylation, which is considerably more complex in humans than in mice. In addition, AβPP and PSEN1 were found to be among the top upstream regulators at 6 months of age, both in hippocampus and cortex, and AβPP and MAPT were among the upstream regulators at 9 and 18 months. These findings are expected in an Aβ amyloid AD mouse model, confirming the validity of using MS combined with IPA.
Critical ingredients for the successful analyses presumably include the use of 18O-labeled internal standard and SCX fractionation to increase the number of protein hits. In addition, our data support the notion that it is important to analyze isolated brain regions, since the time-dependent spectrum of changes follow different pattern in cortex as compared to hippocampus. In particular, neuritogenesis was upregulated in younger mice while neuronal cell death was downregulated in older mice. Thus, these findings suggest that future treatment strategies should carefully consider the stage of the disease since the pathway to target varies over time. Our study suggested that processes leading to cell death, such as necrosis, were downregulated in cortex at 9 months of age and that the process leading to neuronal cell death was downregulated in cortex at 18 months of age. These findings are intriguing, since previous examinations of the brains from AppNL-F/NL-F failed to reveal any major effects on neurodegeneration and atrophy. Thus, perhaps compensatory mechanisms have been initiated to overcome neurodegeneration in AppNL-F/NL-F mice.
Inflammation occurs in the AD brain as a consequence of Aβ amyloidosis [11, 25]. Our present data suggested that gliosis was upregulated in cortex at 6 months of age, 2 months before inflammation can be observed by IHC [23]. Thus, proteomics can detect alterations earlier compared with IHC, possibly due to the fact that MS analysis is very sensitive, and thousands of proteins are quantified at the same time.
We detected HTT as a significant upstream regulator by using IPA. Moreover, by using immunolabelling and fluorescence microscopy elevated levels of HTT in AppNL-F/NL-F mice could be visualized. The increased abundance of HTT already at 6 months of age in hippocampus, including CA1 and dentate gyrus subregions, shows that HTT accumulation preludes neuropathological changes, including the increased Aβ plaque load, neuroinflammation, and memory impairment. HTT levels have not previously been shown to be increased in the AppNL-F/NL-F model. In contrast to the nuclear localization of HTT in Huntington’s disease, the HTT staining showed a perinuclear distribution in the mouse neurons. These findings warrant further study regarding the role of HTT in AD pathology.
A recent study suggested that subjective cognitive decline (SCD), which precedes mild cognitive impairment in humans, appears to be independent of neurodegeneration and tau pathology but closely associated with Aβ amyloidosis [26]. Comparing with the App knock-in mouse model, SCD could be accounted for by the proteomics changes that are observed in the App knock-in mice when there is no apparent tau pathology or neurodegeneration. In support of this idea, pathway analyses detected MAPT, AβPP, and PSEN1 as upstream regulators in hippocampus and cortex already at 6 months of age. In other words, the highly sensitive proteomics analysis can detect important changes that cannot be observed by histological analysis. These findings are valuable for understanding the early phases of AD pathology and support the use of the App knock-in mice for evaluating the effect of pre-symptomatic treatments.
In conclusion, this first thorough proteomics analyses of different ages of the AD mouse model, AppNL-F/NL-F, reveals a time-dependent spectrum of Aβ42-induced pathways of potential relevance to AD pathogenesis. These disease-inducing pathways occur already at 3 months of age, i.e., around 6 months before the presence of amyloid plaques and 15 months prior to memory impairment in the mice. At this early age, alterations in several important pathways, including upregulation of neuritogenesis and downregulation of long-term potentiation and synaptic plasticity was observed. Intriguingly, HTT was identified as an upstream regulator at 6 months of age, 3 months before the presence of amyloid plaques and 12 months prior to memory impairment. The affected pathways vary over time, suggesting that targets for effective AD treatment strategies change with disease progression.
ACKNOWLEDGMENTS
We are very grateful to the mass spectrometry service at the Support Unit for Bio-material analysis, Research Resource Division at RIKEN CBS especially Aya Abe, Kaori Otsuki, Masaya Usui, and Nobuko Mataga for technical assistance and expertise, fruitful discussions of experimental design and analysis of MS data. This work was funded by Alzheimerfonden, the foundation for Gamla Tjänarinnor, Stohnes foundation, Hjärnfonden, the Swedish Research Council, Hållstens forskningsstiftelse and Margareta af Ugglas stiftelse.
Authors’ disclosures available online (https://www.j-alz.com/manuscript-disclosures/20-0028r1).
SUPPLEMENTARY MATERIAL
[1] The supplementary material is available in the electronic version of this article: https://dx.doi.org/10.3233/JAD-200028.
REFERENCES
[1] | Winblad B , Amouyel P , Andrieu S , Ballard C , Brayne C , Brodaty H , Cedazo-Minguez A , Dubois B , Edvardsson D , Feldman H , Fratiglioni L , Frisoni GB , Gauthier S , Georges J , Graff C , Iqbal K , Jessen F , Johansson G , Jonsson L , Kivipelto M , Knapp M , Mangialasche F , Melis R , Nordberg A , Rikkert MO , Qiu C , Sakmar TP , Scheltens P , Schneider LS , Sperling R , Tjernberg LO , Waldemar G , Wimo A , Zetterberg H ((2016) ) Defeating Alzheimer’s disease and other dementias: A priority for European science and society. Lancet Neurol 15: , 455–532. |
[2] | Söderberg L , Bogdanovic N , Axelsson B , Winblad B , Naslund J , Tjernberg LO ((2006) ) Analysis of single Alzheimer solid plaque cores by laser capture microscopy and nanoelectrospray/tandem mass spectrometry. Biochemistry 45: , 9849–9856. |
[3] | De Strooper B , Vassar R , Golde T ((2010) ) The secretases: Enzymes with therapeutic potential in Alzheimer disease. Nat Rev Neurol 6: , 99–107. |
[4] | Hunter S , Brayne C ((2018) ) Understanding the roles of mutations in the amyloid precursor protein in Alzheimer disease. Mol Psychiatry 23: , 81–93. |
[5] | Cacace R , Sleegers K , Van Broeckhoven C ((2016) ) Molecular genetics of early-onset Alzheimer’s disease revisited. Alzheimers Dement 12: , 733–748. |
[6] | Jack CR Jr , Holtzman DM ((2013) ) Biomarker modeling of Alzheimer’s disease. Neuron 80: , 1347–1358. |
[7] | Sasaguri H , Nilsson P , Hashimoto S , Nagata K , Saito T , De Strooper B , Hardy J , Vassar R , Winblad B , Saido TC ((2017) ) APP mouse models for Alzheimer’s disease preclinical studies. EMBO J 36: , 2473–2487. |
[8] | Saito T , Matsuba Y , Yamazaki N , Hashimoto S , Saido TC ((2016) ) Calpain activation in Alzheimer’s model mice is an artifact of APP and presenilin overexpression. J Neurosci 36: , 9933–9936. |
[9] | Saito T , Matsuba Y , Mihira N , Takano J , Nilsson P , Itohara S , Iwata N , Saido TC ((2014) ) Single App knock-in mouse models of Alzheimer’s disease. Nat Neurosci 17: , 661–663. |
[10] | Hashimoto S , Ishii A , Kamano N , Watamura N , Saito T , Ohshima T , Yokosuka M , Saido TC ((2018) ) Endoplasmic reticulum stress responses in mouse models of Alzheimer’s disease: Overexpression paradigm versus knockin paradigm. J Biol Chem 293: , 3118–3125. |
[11] | Saito T , Saido TC ((2018) ) Neuroinflammation in mouse models of Alzheimer’s disease. Clin Exp Neuroimmunol 9: , 211–218. |
[12] | Zhang H , Wu L , Pchitskaya E , Zakharova O , Saito T , Saido T , Bezprozvanny I ((2015) ) Neuronal store-operated calcium entry and mushroom spine loss in amyloid precursor protein knock-in mouse model of Alzheimer’s disease. J Neurosci 35: , 13275. |
[13] | Masuda A , Kobayashi Y , Kogo N , Saito T , Saido TC , Itohara S ((2016) ) Cognitive deficits in single App knock-in mouse models. Neurobiol Learn Mem 135: , 73–82. |
[14] | Shah D , Latif-Hernandez A , De Strooper B , Saito T , Saido T , Verhoye M , D’Hooge R , Van der Linden A ((2018) ) Spatial reversal learning defect coincides with hypersynchronous telencephalic BOLD functional connectivity in APPNL-F/NL-F knock-in mice. Sci Rep 8: , 6264. |
[15] | Nilsson P , Loganathan K , Sekiguchi M , Winblad B , Iwata N , Saido TC , Tjernberg LO ((2015) ) Loss of neprilysin alters protein expression in the brain of Alzheimer’s disease model mice. Proteomics 15: , 3349–3355. |
[16] | Hashimoto M , Bogdanovic N , Nakagawa H , Volkmann I , Aoki M , Winblad B , Sakai J , Tjernberg LO ((2012) ) Analysis of microdissected neurons by 18O mass spectrometry reveals altered protein expression in Alzheimer’s disease. J Cell Mol Med 16: , 1686–1700. |
[17] | Rappsilber J , Mann M , Ishihama Y ((2007) ) Protocol for micro-purification, enrichment, pre-fractionation and storage of peptides for proteomics using StageTips. Nat Protoc 2: , 1896–1906. |
[18] | Wisniewski JR , Zougman A , Mann M ((2009) ) Combination of FASP and StageTip-based fractionation allows in-depth analysis of the hippocampal membrane proteome. J Proteome Res 8: , 5674–5678. |
[19] | Hama H , Hioki H , Namiki K , Hoshida T , Kurokawa H , Ishidate F , Kaneko T , Akagi T , Saito T , Saido T , Miyawaki A ((2015) ) ScaleS: An optical clearing palette for biological imaging. Nat Neurosci 18: , 1518–1529. |
[20] | Teranishi Y , Hur JY , Welander H , Franberg J , Mea Aoki and Tjernberg LO ((2010) ) Affinity pulldown of gamma-secretase and associated proteins from human and rat brain. J Cell Mol Med 14: , 2675–2686. |
[21] | Singhrao SK , Thomas P , Wood JD , MacMillan JC , Neal JW , Harper PS , Jones AL ((1998) ) Huntingtin protein colocalizes with lesions of neurodegenerative diseases: An investigation in Huntington’s, Alzheimer’s, and Pick’s diseases. Exp Neurol 150: , 213–222. |
[22] | Taniguchi S , Fujita Y , Hayashi S , Kakita A , Takahashi H , Murayama S , Saido TC , Hisanaga S , Iwatsubo T , Hasegawa M ((2001) ) Calpain-mediated degradation of p35 to p25 in postmortem human and rat brains. FEBS Lett 489: , 46–50. |
[23] | Aladeokin AC , Akiyama T , Kimura A , Kimura Y , Takahashi-Jitsuki A , Nakamura H , Makihara H , Masukawa D , Nakabayashi J , Hirano H , Nakamura F , Saito T , Saido T , Goshima Y ((2019) ) Network-guided analysis of hippocampal proteome identifies novel proteins that colocalize with Abeta in a mice model of early-stage Alzheimer’s disease. Neurobiol Dis 132: , 104603. |
[24] | Yu Y , Jans DC , Winblad B , Tjernberg LO , Schedin-Weiss S ((2018) ) Neuronal Abeta42 is enriched in small vesicles at the presynaptic side of synapses. Life Sci Alliance 1: , e201800028. |
[25] | Holtzman DM , Morris JC , Goate AM ((2011) ) Alzheimer’s disease: The challenge of the second century. Sci Transl Med 3: , 77sr71. |
[26] | Verfaillie SCJ , Timmers T , Slot RER , van der Weijden CWJ , Wesselman LMP , Prins ND , Sikkes SAM , Yaqub M , Dols A , Lammertsma AA , Scheltens P , Ossenkoppele R , van Berckel BNM , van der Flier WM ((2019) ) Amyloid-beta load is related to worries, but not to severity of cognitive complaints in individuals with subjective cognitive decline: The SCIENCe Project. Front Aging Neurosci 11: , 7. |


