
Dysregulation of CO2-Driven Heart-Rate Chemoreflex Is Related Closely to Impaired CO2 Dynamic Vasomotor Reactivity in Mild Cognitive Impairment Patients
Abstract
Background:
Significant reduction of dynamic vasomotor reactivity (DVR) was recently reported in patients with amnestic mild cognitive impairment (MCI) relative to age-matched controls. These results were obtained via a novel approach that utilizes data-based predictive dynamic models to quantify DVR.
Objective:
Using the same methodological approach, we seek to quantify the dynamic effects of the CO2-driven chemoreflex and baroreflex upon heart-rate in order to examine their possible correlation with the observed DVR impairment in each MCI patient.
Methods:
The employed approach utilizes time-series data to obtain subject-specific predictive input-output models of the dynamic effects of changes in arterial blood pressure and end-tidal CO2 (putative “inputs”) upon cerebral blood flow velocity in large cerebral arteries, cortical tissue oxygenation, and heart-rate (putative “outputs”).
Results:
There was significant dysregulation of CO2-driven heart-rate chemoreflex (p = 0.0031), but not of baroreflex (p = 0.5061), in MCI patients relative to age-matched controls. The model-based index of CO2-driven heart-rate chemoreflex gain (CRG) correlated significantly with the DVR index in large cerebral arteries (p = 0.0146), but not with the DVR index in small/micro-cortical vessels (p = 0.1066). This suggests that DVR impairment in small/micro-cortical vessels is not mainly due to CO2-driven heart-rate chemoreflex dysregulation, but to other factors (possibly dysfunction of neurovascular coupling).
Conclusion:
Improved delineation between MCI patients and controls is achieved by combining the DVR index for small/micro-cortical vessels with the CRG index (p = 2×10⁻⁵). There is significant correlation (p < 0.01) between neuropsychological test scores and model-based DVR indices. Combining neuropsychological scores with DVR indices reduces the composite diagnostic index p-value (p∼10–10).
INTRODUCTION
Previous studies have established a correlation between cognitive impairment and cerebrovascular dysfunction [1–16], causing rising interest in exploring possible causative relations between the two conditions. In this context, our work has sought to provide quantitative measures of cerebrovas-cular dysfunction in the form of data-based predictive dynamic models of cerebral flow regulation, which can be correlated with clinical measures of cognitive impairment. Using this approach, we have recently reported a significant reduction of dynamic vasomotor reactivity (DVR) in the cerebral circulation of patients with amnestic mild cognitive impairment (MCI) relative to age-matched controls [1], which confirmed similar findings in an earlier study of a small cohort of patients with early-stage Alzheimer’s disease [2]. The employed modeling approach derives subject-specific predictive models of cerebral circulation to quantify the dynamic effects of resting-state changes in arterial blood pressure and end-tidal CO2 (the putative “inputs”) upon cerebral blood flow velocity measured at the middle cerebral arteries via transcranial Doppler (TCD), and cerebral tissue oxygenation measured at a localized microvascular bed in the lateral prefrontal cortex via near-infrared spectroscopy (NIR) (the putative “outputs”). The obtained data-based models are subsequently used to compute “physio-markers” of cerebral flow regulation, such as the aforementioned DVR index, either in large cerebral arteries (based on TCD data) or small cerebral vessels (based on NIR data).
In this paper, we follow the same methodological approach to examine the correlation between the previously obtained model-based DVR physio-markers (TCD-based or NIR-based) with model-based physio-markers of the CO2-driven heart-rate chemoreflex dynamics in amnestic MCI patients and age-matched controls, because of the potential impact of CO2-driven heart-rate chemoreflex dynamics upon cerebral circulation [17–21]. This study is motivated by the view that dysregulation of cerebral perfusion may be associated with the process of neurodegeneration through long-term mechanisms that alter the cerebral perivascular microenvironment and induce chronic acidosis, hypoxia and/or oxidative stress in cerebral tissue. The posited dysregulation of cerebral perfusion may occur at various levels (local, regional, or central) and through numerous possible biological/physiological mechanisms. Among the latter, a critical role is likely played by mechanisms that pertain to the complex regulatory actions of the chemoreflexes that seek to maintain homeostasis of cerebral perfusion and/or tissue/blood electrolytes against changes in the biochemical environment of cerebral tissue, caused by intermittent actions of systemic cardiovascular, respiratory, renal, endocrine, and metabolic mechanisms.
This study is focused only on the effects of CO2-driven heart-rate chemoreflex (heretofore referred to as simply “chemoreflex” in the interest of presentation simplicity) and of the heart-rate baroreflex driven by changes in arterial blood pressure (ABP), because they are both known to influence blood circulation through their impact on heart rate (cardiac output) and vascular impedance. These two reflexes of heart-rate are closed-loop homeostatic regulatory mechanisms that involve “sensors” (chemoreceptors and baroreceptors, respectively) and “effectors” (neural and neuroendoctine actions driven by specialized regions of the brainstem) to modulate the heart rate (HR) via the autonomic nervous system (sympathetic and parasympathetic nerves). Specifically, the baroreflex reduces HR to counter a rise in ABP (and vice versa) and the CO2-driven heart-rate chemoreflex increases HR to counter a rise in CO2 in arterial blood and/or cerebrospinal fluid (and vice versa). We note that hypoxia is also known to have significant effects on chemoreflex mechanisms (both cardiac and respiratory), but these effects cannot be analyzed in this study because we lack systemic time-series data on fluctuating oxygen concentrations (see Discussion). Likewise, we cannot analyze in this study the effects of the respiratory-related chemoreflex because we lack time-series data on ventilation. Both of these extensions of our approach (to incorporate the modeling/analysis of time-series data of contemporaneous changes in oxygen concentrations and ventilation) are very important and constitute high priorities for our future work as they impact the cerebral tissue oxygenation.
The CO2-driven heart-rate chemoreflex gain (CRG) physio-markers are computed from data-based predictive models of the dynamic effects of changes in end-tidal CO2 (a proxy signal for blood CO2 tension) upon heart rate, after accounting for the contemporaneous effects of changes in arterial blood pressure upon heart rate (baroreflex dynamics). Proper interpretation of the obtained physio-markers and their possible correlations may provide valuable insight into the physiological mechanisms that affect cerebral flow regulation in healthy subjects and MCI patients. The availability of such quantitative data-based measures of cerebral flow regulation (e.g., DVR and CRG) may have diagnostic and/or prognostic utility and may facilitate the clinical management of major public health problems pertaining to MCI and Alzheimer’s disease, as well as other neurodegenerative or cerebrovascular diseases.
In previous clinical studies of cerebrovascular CO2 vasoreactivity [22–24], concerning the vasodilatory effect of an increase in blood CO2 tension upon cerebral vessels (causing a decrease of cerebrovascular impedance), a substantial change of CO2 tension was imposed on the patient, typically via CO2 inhalation or breath-holding, and the resulting steady-state change of cerebral blood flow was observed. This widely used approach is vulnerable to experimental ambiguities (e.g., caused by respiratory and blood pressure effects) in addition to causing considerable discomfort for the patient. For this reason, it is attractive to use spontaneous hemodynamic and end-tidal CO2 data under resting conditions to estimate predictive dynamic models that account for the combined effects of arterial blood pressure and end-tidal CO2 changes upon cerebral blood flow velocity or cerebral tissue oxygenation. We suggest that such “resting-state” models (obtained from spontaneous activity time-series data) are able to capture and quantify the dynamics of CO2-driven heart-rate chemoreflex and of the ABP-driven baroreflex. These models allow the computation of reliable physio-markers that quantify the DVR. To obtain these resting-state models, we employ the kernel-based modeling methodology [25, 26] that is outlined in the following section. The obtained results from amnestic MCI patients and age-matched controls are presented in the next section and the key findings are discussed in the last section.
METHODS
This study relies on the quantification of certain physiological functions of interest that are defined by input-output models of the dynamic relationships between the relevant time-series data, i.e., beat-to-beat measurements of cerebral blood flow velocity, cerebral tissue oxygenation or heart rate (the putative “outputs”), and arterial blood pressure or end-tidal CO2 (the putative “inputs”) under resting conditions. These input-output predictive dynamic models are estimated using the novel methodology of Principal Dynamic Modes [25, 26] that has been pioneered by our laboratory and yields accurate model estimates from noisy and relatively short datasets. The obtained subject-specific predictive models are used to construct indices that quantify the physiological function of interest (e.g., CO2 dynamic vasomotor reactivity or chemoreflex/baroreflex gains) in each MCI patient or control subject.
Data collection
The analyzed time-series data were collected over 5 min in patients with amnestic MCI and age-matched cognitively normal control subjects, who participated voluntarily in this study and signed the Informed Consent Form that has been approved by the Institutional Review Board of the UT Southwestern Medical Center and Texas Health Presbyterian Hospital Dallas. The diagnosis of amnestic MCI was based on modified Petersen criteria [27]. The scores of the Mini-Mental State Exam (MMSE) and the Delayed Logical Memory Recall (DLMR) test were used to assess memory function. The subjects were screened to exclude clinical histories of stroke, major medical and psychiatric disorders, unstable heart diseases, uncontrolled hypertension, and diabetes mellitus. The gender composition, the age (mean and standard deviation (SD)), and the neuropsychological scores (MMSE and DLMR) of the patients and controls are given in Table 1A for the two cohorts used in this study: 1) 45 patients and 18 controls with TCD output data, and 2) 43 patients and 17 controls with NIR output data. The reason for different numbers of MCI patients and controls with TCD or NIR data is the presence of occasional gaps in some data-recordings due to technical issues (in similar proportions for patients and controls) that made them unusable for analysis.
Table 1A
Gender, age, and neuropsychological scores of controls and MCI patients with TCD or NIR data
| Subjects | Gender Composition | Age Mean (SD) | MMSE score† | Delayed Logical Memory Recall score†† |
| 18 Controls with TCD data | 9 male, 9 female | 66.26 (6.11) | 29.13 (0.89) | 14.19 (2.59) |
| 45 Patients with TCD data | 16 male, 29 female | 66.62 (6.60) | 29.09 (1.27) | 8.63 (2.4) |
| p-value | 0.2897 | 0.8349 | 0.9079 | 7.4×10⁻⁸ |
| 17 Controls with NIR data | 8 male, 9 female | 69.38 (5.99) | 29.06 (1.03) | 14.53 (2.35) |
| 43 Patients with NIR data | 13 male, 30 female | 66.79 (6.34) | 29.31 (0.90) | 8.74 (2.22) |
| p-value | 0.2181 | 0.1468 | 0.3875 | 1.71×10⁻⁹ |
†Mini-Mental State Exam (MMSE) scores were not available for two controls and two MCI patients. ††Delayed Logical Memory Recall scores were not available for two controls and three MCI patients.
The time-series data were collected in a quiet, environmentally controlled laboratory under resting seated conditions. All measurements were non-invasive, safe, and comfortable for the subjects. After 20 min of rest, 5-6 min recordings were made at an initial sampling rate of 1 KHz for 1) arterial blood pressure (ABP) measured continuously with finger photo-plethysmography (Finapres); 2) end-tidal CO2 (CO2) measured via a nasal cannula using capnography (Criticare Systems); 3) cerebral blood flow velocity (CFV) measured in the middle cerebral arteries using a 2 MHz transcranial Doppler (TCD) probe (Multiflow, DWL) placed over the temporal window and fixed at constant angle with a custom-made holder; 4) tissue oxygenation index (TOI), defined as the ratio of oxyhemoglobin to total hemoglobin multiplied by 100, measured via near infrared spectroscopy (NIR) (Hamamatsu). HR data were extracted from ECG recordings or from highly-sampled ABP recordings when there was a recording problem (artifact or gap) in the ECG. Table 1B reports the time-average (baseline) values and the variabilities (computed as the SD of the beat-to-beat or breath-to-breath changes) of the analyzed TOI, CFV, CO2, ABP, and HR time-series data (for patients and controls separately) for the same cohorts of patients and controls (dependent on TCD or NIR output) as in Table 1A. We note that the only significant baseline difference between patients and controls is for TOI (p = 0.036).
Table 1B
Baseline values and variabilities of analyzed time-series data of TOI, CFV, CO2, ABP, and HR for controls and MCI patients with either TCD or NIR output
| Subjects | TOI baseline (variability) | CFV baseline (variability) | CO2 baseline (variability) | ABP baseline (variability) | HR baseline (variability) |
| 18 Controls with TCD data | NA | 49.96 (11.96) | 36.13 (3.69) | 91.03 (12.13) | 66.26 (7.29) |
| 45 Patients with TCD data | NA | 46.22 (10.71) | 36.28 (2.84) | 91.03 (12.13) | 68.69 (11.24) |
| p-value | NA | 0.2588 | 0.8774 | 0.2632 | 0.3159 |
| 17 Controls with NIR data | 67.14 (6.76) | NA | 35.67 (3.60) | 88.17 (14.71) | 67.22 (7.55) |
| 43 Patients with NIR data | 62.78 (7.45) | NA | 36.01 (2.57) | 91.53 (14.84) | 68.32 (11.74) |
| p-value | 0.0360 | NA | 0.7251 | 0.4328 | 0.6709 |
Data preprocessing
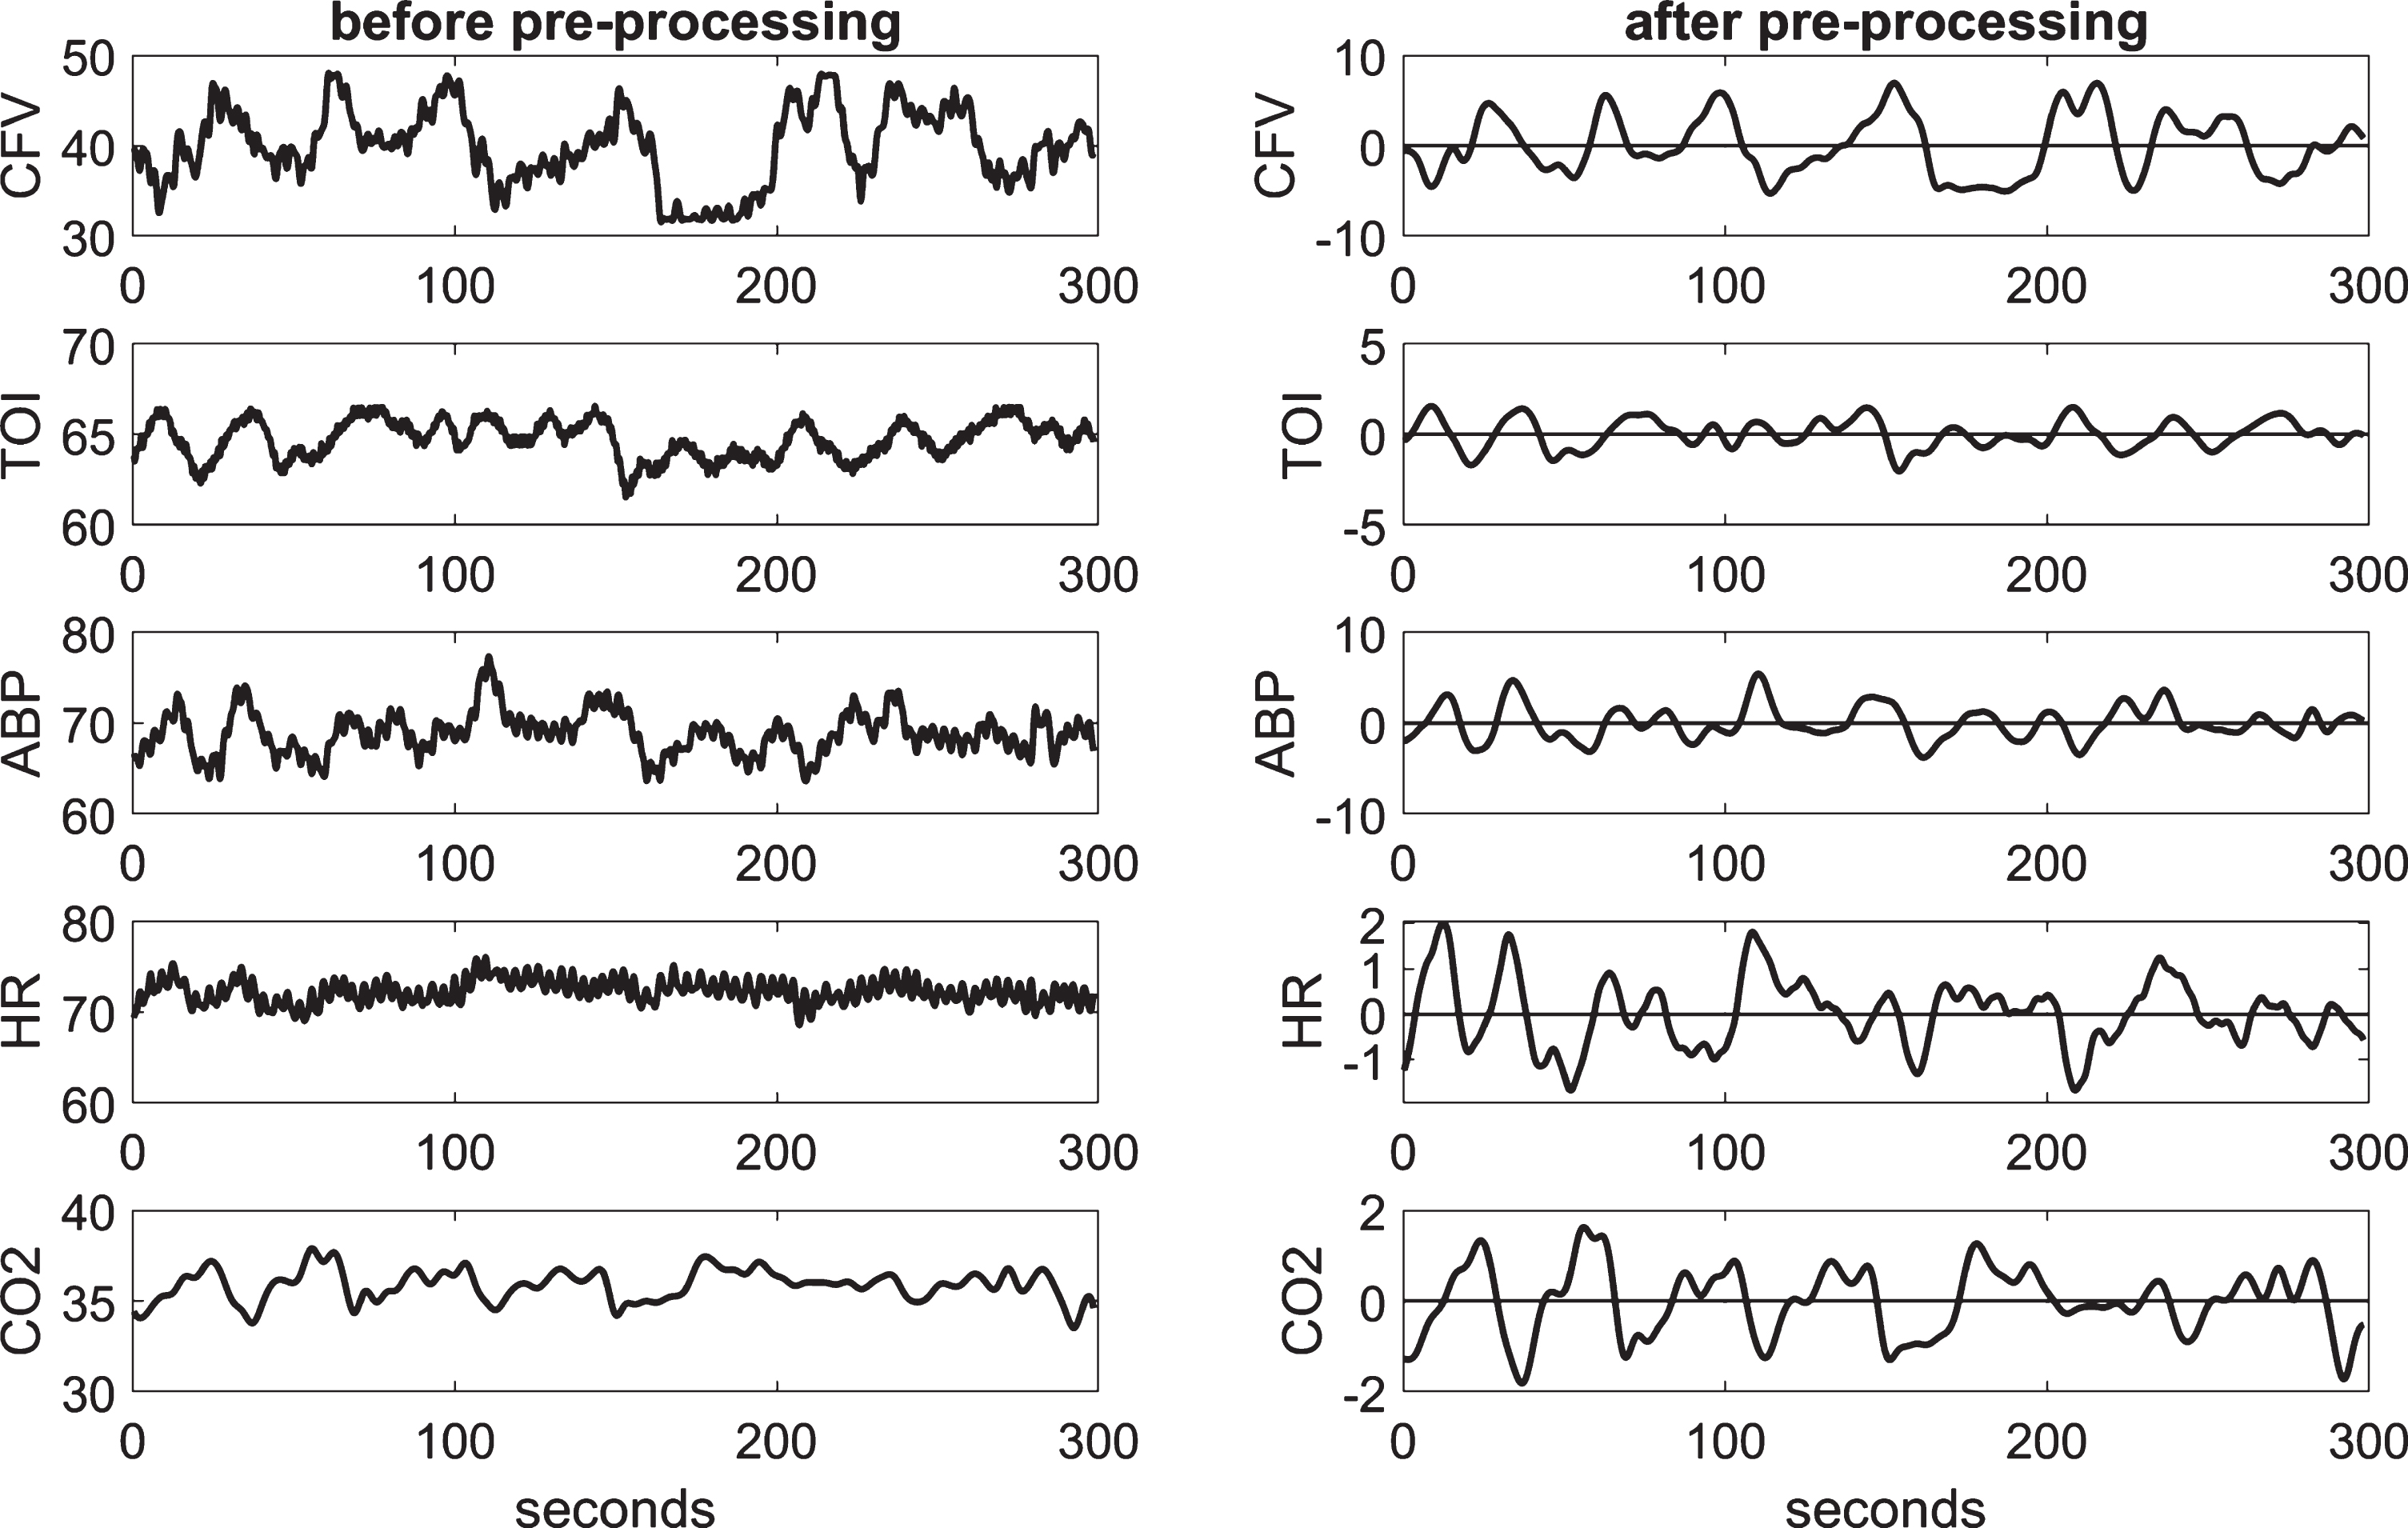
The collected highly-sampled data of ABP, CFV, and TOI were reduced to beat-to-beat time-series data using averages over the respective R-R intervals extracted from the ECG, after removal of occasional measurement artifacts through application of hard-clipping at±20% of average values. The beat-to-beat averages of ABP, CFV, and TOI, as well as the HR values (i.e., the inverse of the respective R-R interval) were placed at the mid-point of each R-R interval (unevenly spaced). To make even the sampling of the beat-to-beat values (necessary for processing), the data were re-sampled every 0.25 s via cubic-spline interpolation and were high-pass filtered (via subtraction of a 2-min moving-average using a Hanning window) to remove the constant baseline and very low frequency trends below 0.01 Hz. The end-tidal CO2 values were placed at the mid-point of each breath (unevenly sampled) and were re-sampled every 0.25 s via cubic-spline interpolation (to make the data-samples of all variables contemporaneous) and high-pass filtered as indicated for the other data. We also low-pass filtered all our time-series data by use of an 8-s Hanning window in order to alleviate the effects of respiratory sinus arrhythmia and focus our analysis on the frequencies below 0.2 Hz where hemodynamic regulation is deemed to be taking place. Figure 1 shows illustrative time-series data (both raw and pre-processed) for one of the control subjects over 5 min.
Fig. 1
Illustrative time-series data over 5 min for one control subject, representing beat-to-beat spontaneous variations of CFV (top panel), TOI (2nd panel), ABP (3rd panel), HR (4th panel), and CO2 (bottom panel), before (left column) and after (right column) pre-processing. The units are: cm/s for CFV, % for TOI, beats/min for HR, and mmHg for ABP and CO2.
Modeling methodology
To obtain reliable input-output models of the dynamic relationships between the putative inputs and outputs of this study, we employ the method of Laguerre expansion of kernels that yields compact predictive models (linear or nonlinear) even for noisy and relatively short datasets [25, 26]. A brief outline of this methodology for linear modeling of two-input/one-output systems (employed in this study) is presented in the Supplementary Material. The input-output linear model has the convolutional form:
(1)
RESULTS
Following the methodological procedures outlined above, we estimate first the input-output predictive models from which the two types of DVR indices are computed: the DVR-CFV index using the CFV output data from the large middle-cerebral arteries, or the DVR-TOI index using the TOI output data from small/micro cerebral vessels in the prefrontal cortex—employing for this purpose the kernel estimates for the CO2 input and the respective output. The obtained average kernel estimates (and SD bounds) are shown in Fig. 2 for the 45 MCI patients (MP) (red line) and 18 age-matched cognitively normal control subjects (CS) (blue line) when the output is CFV (left panel), or 43 MP (red line) and 17 CS (blue line) when the output is TOI (right panel). The average kernel waveforms appear distinctly different between MP versus CS for either large or small cerebral vessels, i.e., CFV or TOI output, respectively, especially for short lags (<4 s) corresponding to the fast component of CO2 vasomotor reactivity mechanism (see Discussion). The statistical significance of this kernel difference between MP and CS is examined below via the kernel-based computation of the respective DVR indices.
Fig. 2
Average kernel estimates for the CO2 input (±1 SD bounds marked with dotted lines) over 18 or 17 CS (blue line) and 45 or 43 MP (red line), for CFV (left) or TOI (right) output, respectively.
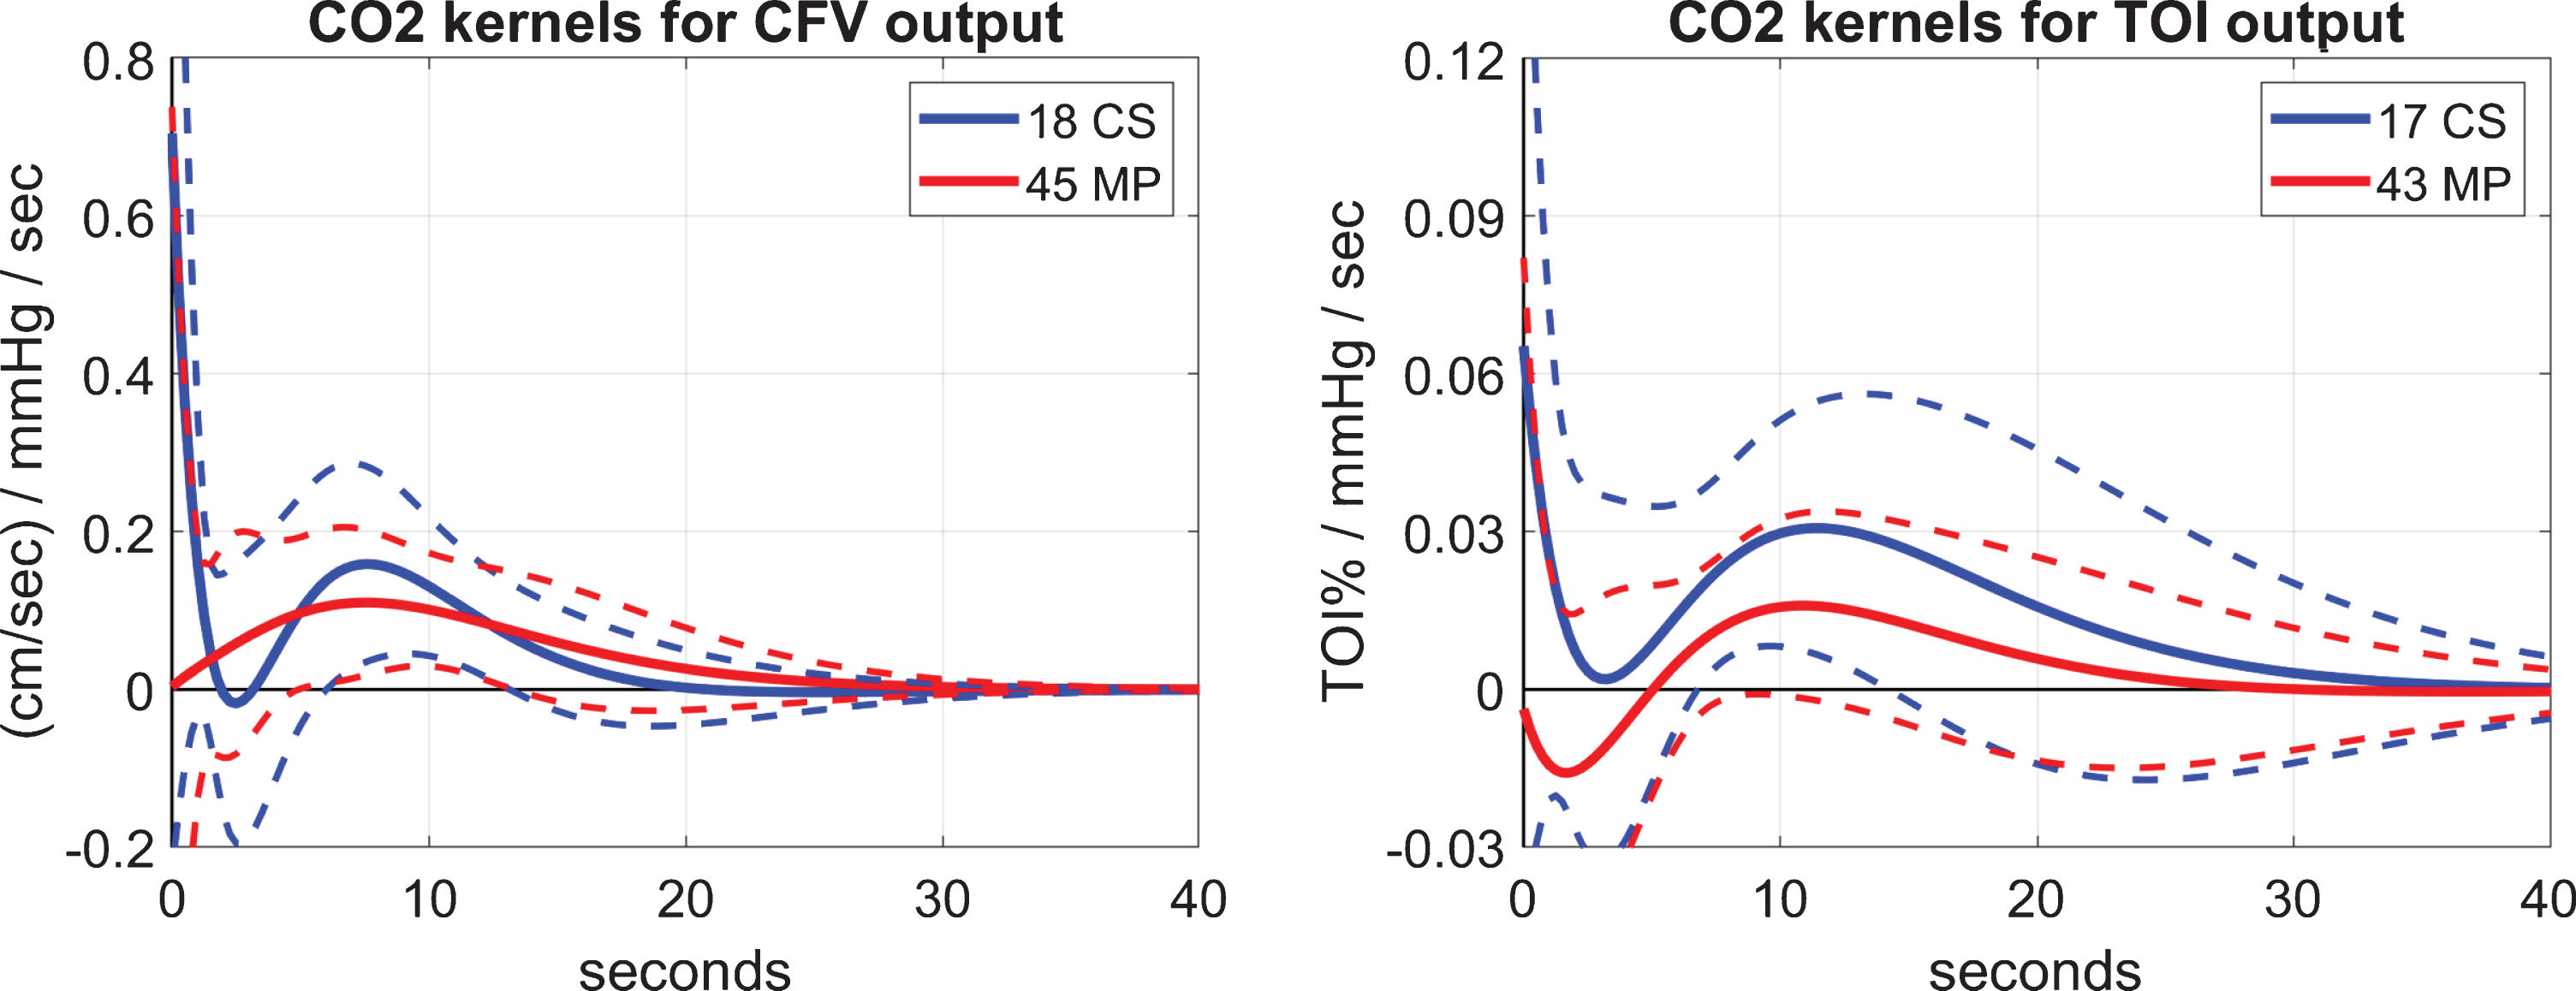
The obtained models (defined by the respective kernels) are then simulated for a unit-step CO2 input (while the ABP input is set at baseline), and the DVR index for CFV or TOI is computed as the time-average of the respective model-predicted CFV or TOI response over the first 5 or 10 s, respectively. This is illustrated in Fig. 3 that shows the average model-predicted responses for the 45 MP (red line) and 18 CS (blue line) when the output is CFV (left panel), or for the 43 MP (red line) and 17 CS (blue line) when the output is TOI (right panel). It is evident that the model-predicted output rises higher for CS than MP for both types of output (CFV and TOI), suggesting possible impairment of CO2 vasomotor reactivity in MCI patients at both large and small cerebral vessels. The difference in the resulting two types of DVR indices for MP and CS is statistically significant (p < 0.05) as shown in Table 2, where the mean (SD) values for MP and CS are reported for each DVR index, along with the corresponding p-values of a t-test (under the assumption of Gaussian distribution of these indices). A smaller p-value is achieved through the NIR measurements of TOI in small cortical vessels (p = 0.0030) relative to the TCD measurements of CFV in the middle cerebral arteries (p = 0.0057).
Fig. 3
Average model-predicted response to a unit-step CO2 input over 18 CS (blue line) and 45 MP (red line) for the CFV output (left panel), and over 17 CS (blue line) and 43 MP (red line) for the TOI output (right panel). The SD bounds are also shown with dashed lines.
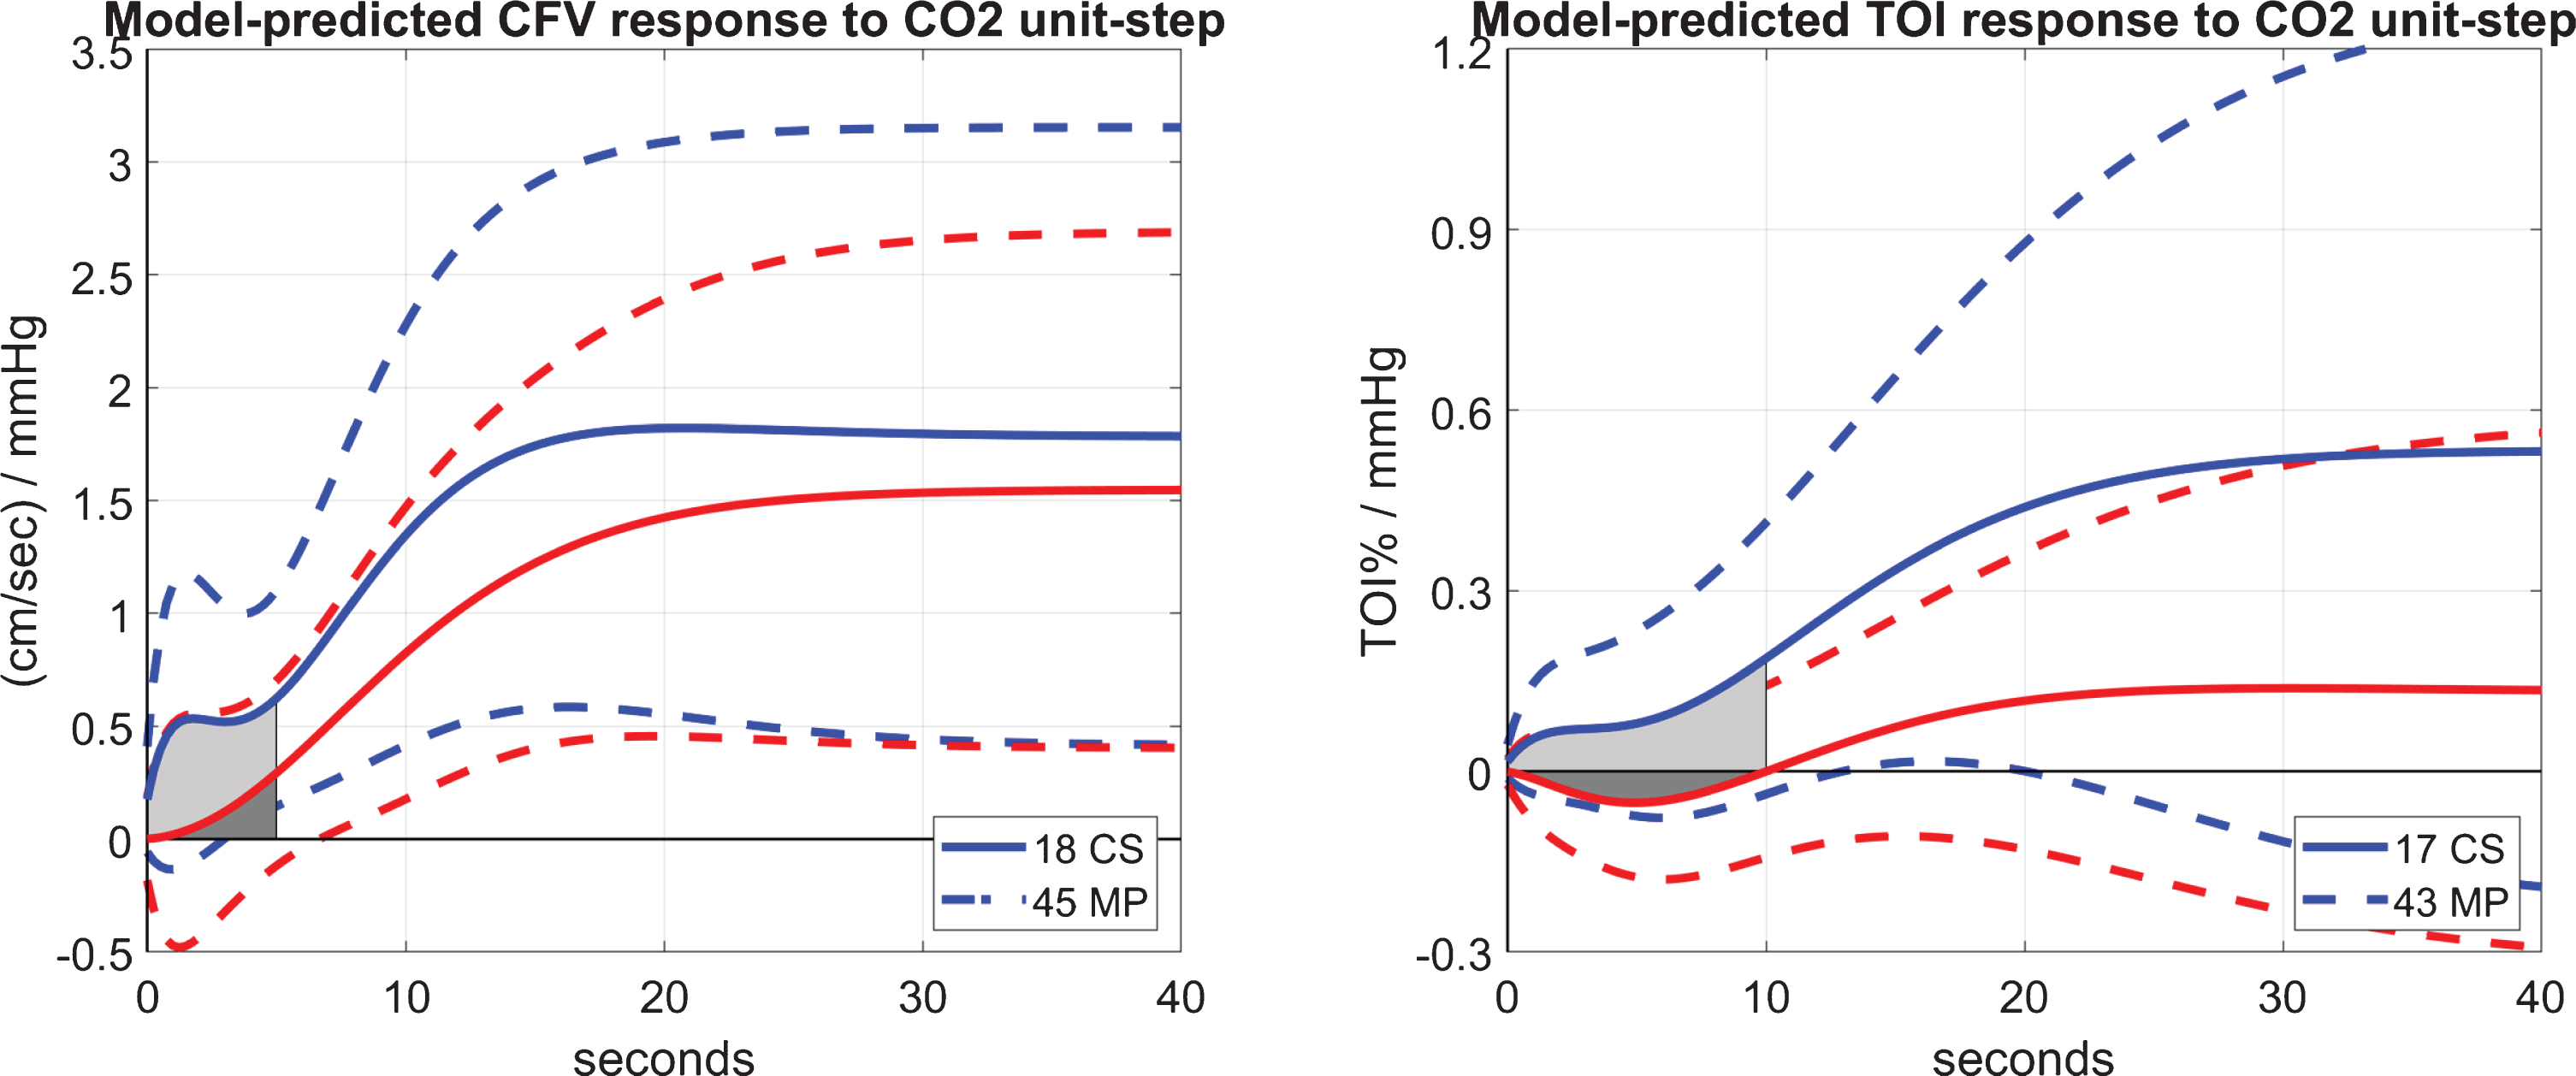
Table 2
Mean (SD) of DVR-CFV & DVR-TOI indices for MP and CS, and respective p-values
| DVR-CFV index (5-s average) | DVR-TOI index (10-s average) | |||
| 18 CS | 45 MP | 17 CS | 43 MP | |
| μ (σ) | 0.5006 (0.4883) | 0.1097 (0.4074) | 0.0944 (0.1423) | –0.0314 (0.1046) |
| p | 0.0057 | 0.0030 | ||
For the computation of a model-based index of the effect of an ABP change upon cerebral flow in large or small cerebral vessels, we can use the estimated kernel of each patient/subject for the ABP input and simulate the respective model (defined by the kernel) to predict the cerebral flow output (CFV or TOI) for a unit-step ABP input (while the ETCO2 input is set at zero/baseline). An index of Dynamic Cerebral Autoregulation (DCA) can be computed as the ratio: (A-B)/A, where A is the maximum and B the minimum value of the model-predicted CFV or TOI response over the first 10 or 20 s, respectively [1]. Such DCA indices were not significantly different between MP and CS; thus, they are not reported (or the respective ABP-input kernels) in the interest of space. We note, however, that there exist alternate definitions of DCA [28–34] but none was found significantly different between MP and CS.
Finally, we note that the mean (SD) values of the NMSE of the model prediction over all MP and CS for both types of outputs (CFV or TOI) are reported in Table 3 and indicate that model prediction error is comparable for MP and CS for the CFV output prediction, but significantly smaller in CS for the TOI output prediction (see Discussion).
Table 3
Mean (SD) of model prediction NMSE for MP and CS, and corresponding p-values
| NMSE of CFV model prediction | NMSE of TOI model prediction | |||
| 18 CS | 45 MP | 17 CS | 43 MP | |
| μ (σ) | 35.74 (12.06) | 37.39 (15.25) | 43.11 (11.36) | 52.88 (16.46) |
| p | 0.6537 | 0.0121 | ||
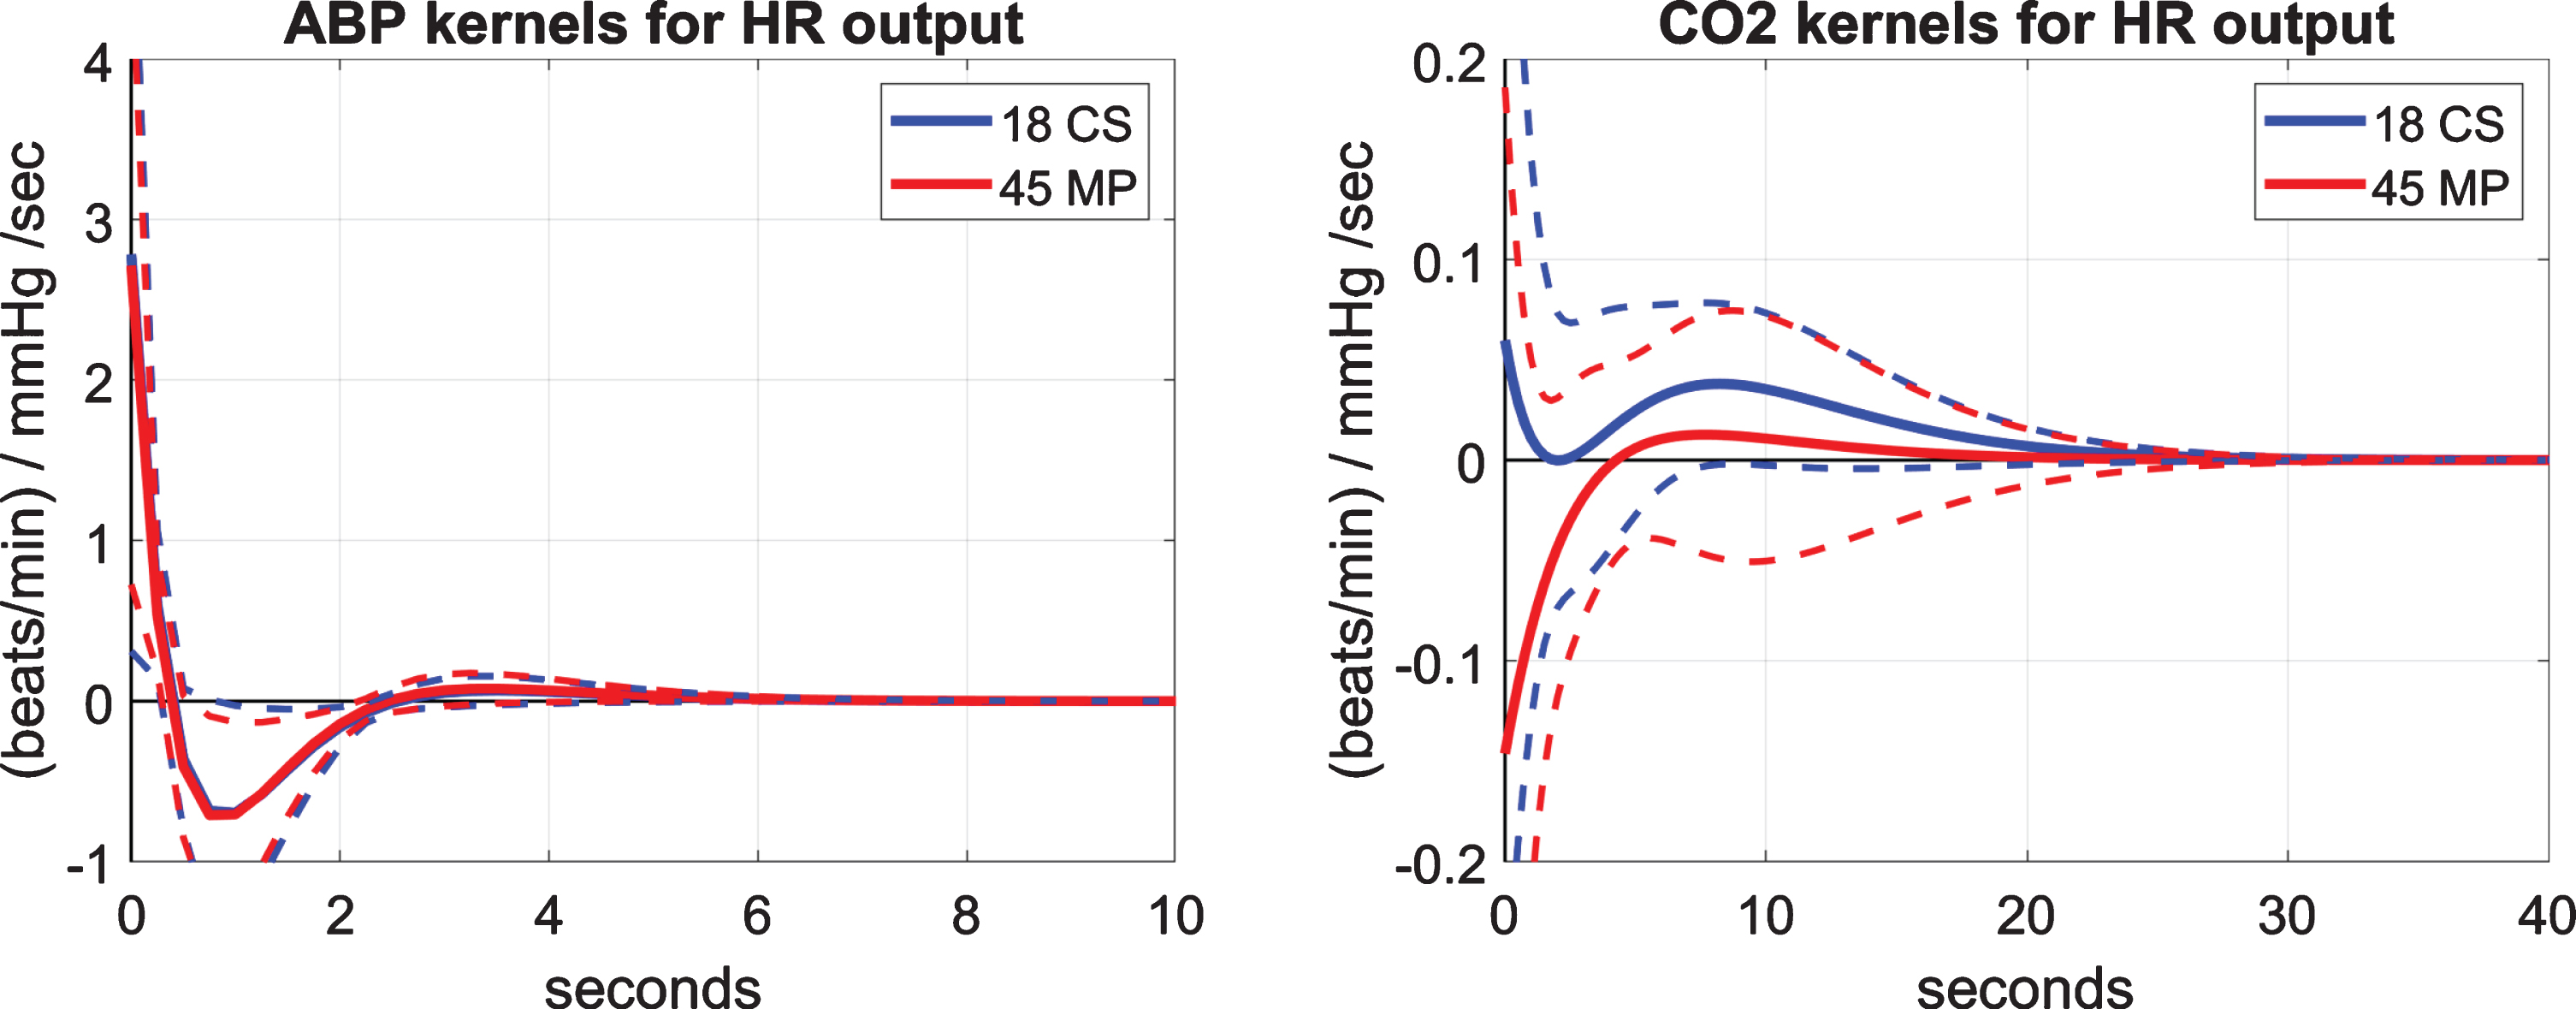
For the computation of the model-based indices of the HR reflex, we estimate first the models (i.e., kernels) of the dynamic relationship between HR (the putative output) and ABP and CO2 (the two putative inputs). The obtained average kernels (and SD bounds) using the data of 18 CS (blue line) and 45 MP (red line), who have both CFV and TOI output data, are shown in Fig. 4 for the ABP input (left) and the CO2 input (right). The ABP-input kernel describes the dynamics of the baroreflex and exhibits on the average a negative trough between 0.5 and 2.5 s lags (consistent with the known reduction of HR for rising ABP). The average baroreflex kernels are similar for CS and MP. The CO2-input kernel describes the dynamics of the CO2-driven heart-rate chemoreflex and exhibits on the average positive values for the CS (consistent with the known increase of HR for rising CO2), but negative values over early lags (up to 4 s) for the MP and smaller positive values for lags >4 s relative to the CS. This distinct difference in the chemoreflex kernels of the CS versus the MP may contribute to the observed difference in the DVR indices (see Table 2). This possible correlation and the statistical significance of the chemoreflex kernel difference are examined below.
Fig. 4
Average kernel estimates (±1 SD bounds marked with dotted lines) over 18 CS (blue line) and 45 MP (red line) of the predictive dynamic model for the HR output and the ABP input (left panel) or the CO2 input (right panel). These two sets of kernels describe the baroreflex and chemoreflex dynamics, respectively. The baroreflex kernels are similar for CS versus MP, but the chemoreflex kernels are distinct.
In order to examine the statistical significance of the observed kernel differences between MP and CS for the baroreflex and the chemoreflex, we can use the respective kernel estimates for each CS and MP to compute model-based indices regarding the Baroreflex Gain (BRG) and the Chemoreflex Gain (CRG) for each individual as follows:
(1) We may compute the CRG index as the time-average of the model-predicted HR response to a unit-step CO2 input over the first 10 s (in a manner akin to the previous definition of the DVR indices) as illustrated on the right panel of Fig. 5 for the average CO2-to-HR kernels.
(2) We may compute the BRG index as the difference between the peak value and the trough value of the model-predicted HR response to a unit-step ABP input (depicted on the left panel of Fig. 5 for the average ABP-to-HR kernels). This definition of BRG relies on the widely accepted notion that the baroreflex reduces the short-time HR response to an increase of ABP.
Fig. 5
The average model-predicted HR responses (in beats/min) to a unit-step ABP input (left panel) and CO2 input (right panel) over 18 CS (blue line) and 45 MP (red line) that illustrate the average time-course of the baroreflex and CO2-driven heart-rate chemoreflex effects, respectively. The CRG index for each CS or MP is defined as the time-average of the shaded area of the HR unit-response (indicated on the right panel). The BRG index for each CS or MP is defined as the difference between the peak and the trough of the HR unit-response (shown on the left panel for the average kernels).
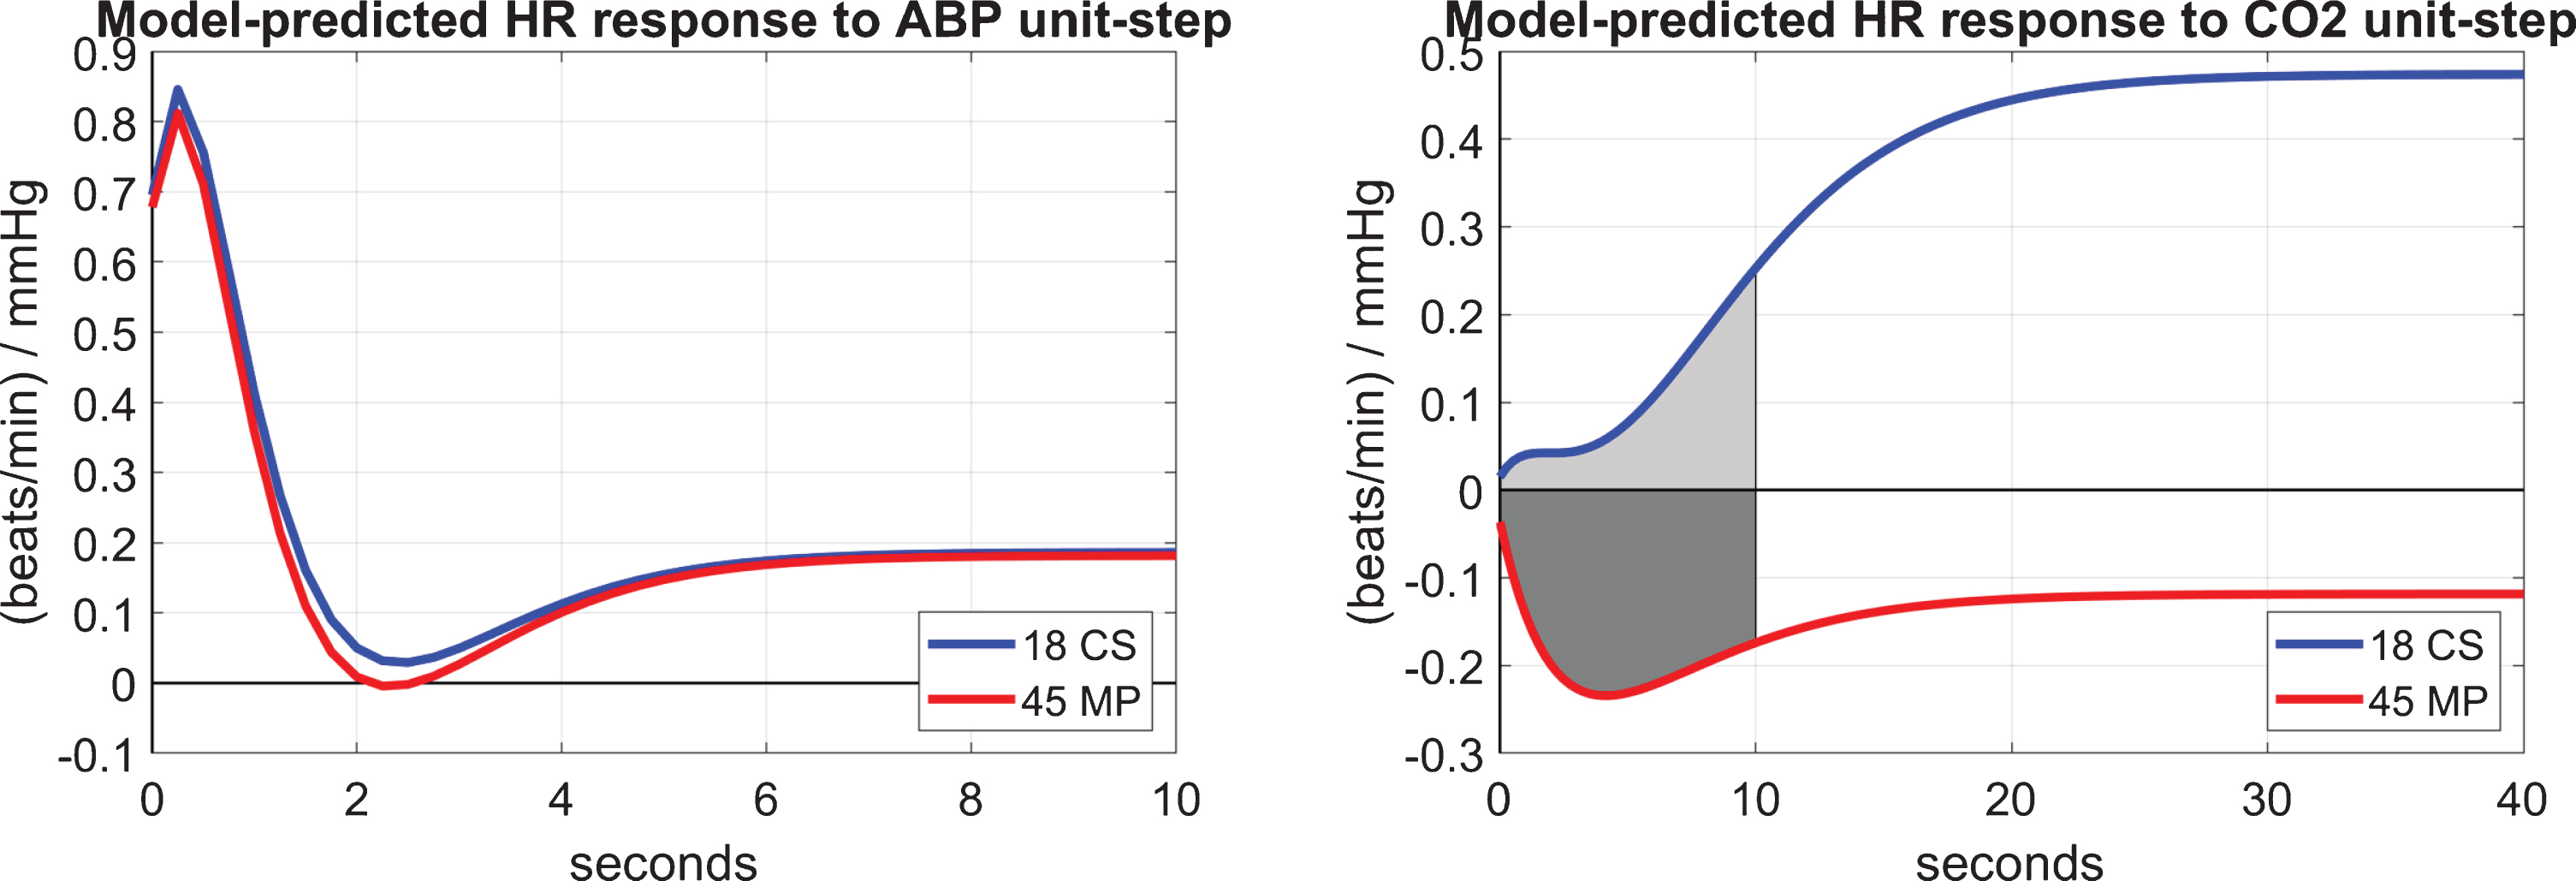
Table 4 shows the mean (SD) values of the model-based BRG and CRG indices over 45 MP and 18 CS, who have both CFV and TOI output data. The resulting p-values indicate statistically significant difference in the CRG index between MP and CS (p = 0.0031), but not in the BRG index (p = 0.5061). These results are consistent with our previous findings that the DVR-CFV index (which is likely affected by the CRG) is significantly different between MP and CS, but cerebral autoregulation (which is likely related to BRG) is not significantly different between MP and CS.
Table 4
Mean (SD) of BRG and CRG indices for MP and CS, and corresponding p-values
| BRG index: A minus B | CRG index | |||
| 18 CS | 45 MP | 18 CS | 45 MP | |
| μ (σ) | 0.9706 (0.5574) | 0.8636 (0.6026) | 0.1044 (0.3211) | –0.1943 (0.3775) |
| p | 0.5061 | 0.0031 | ||
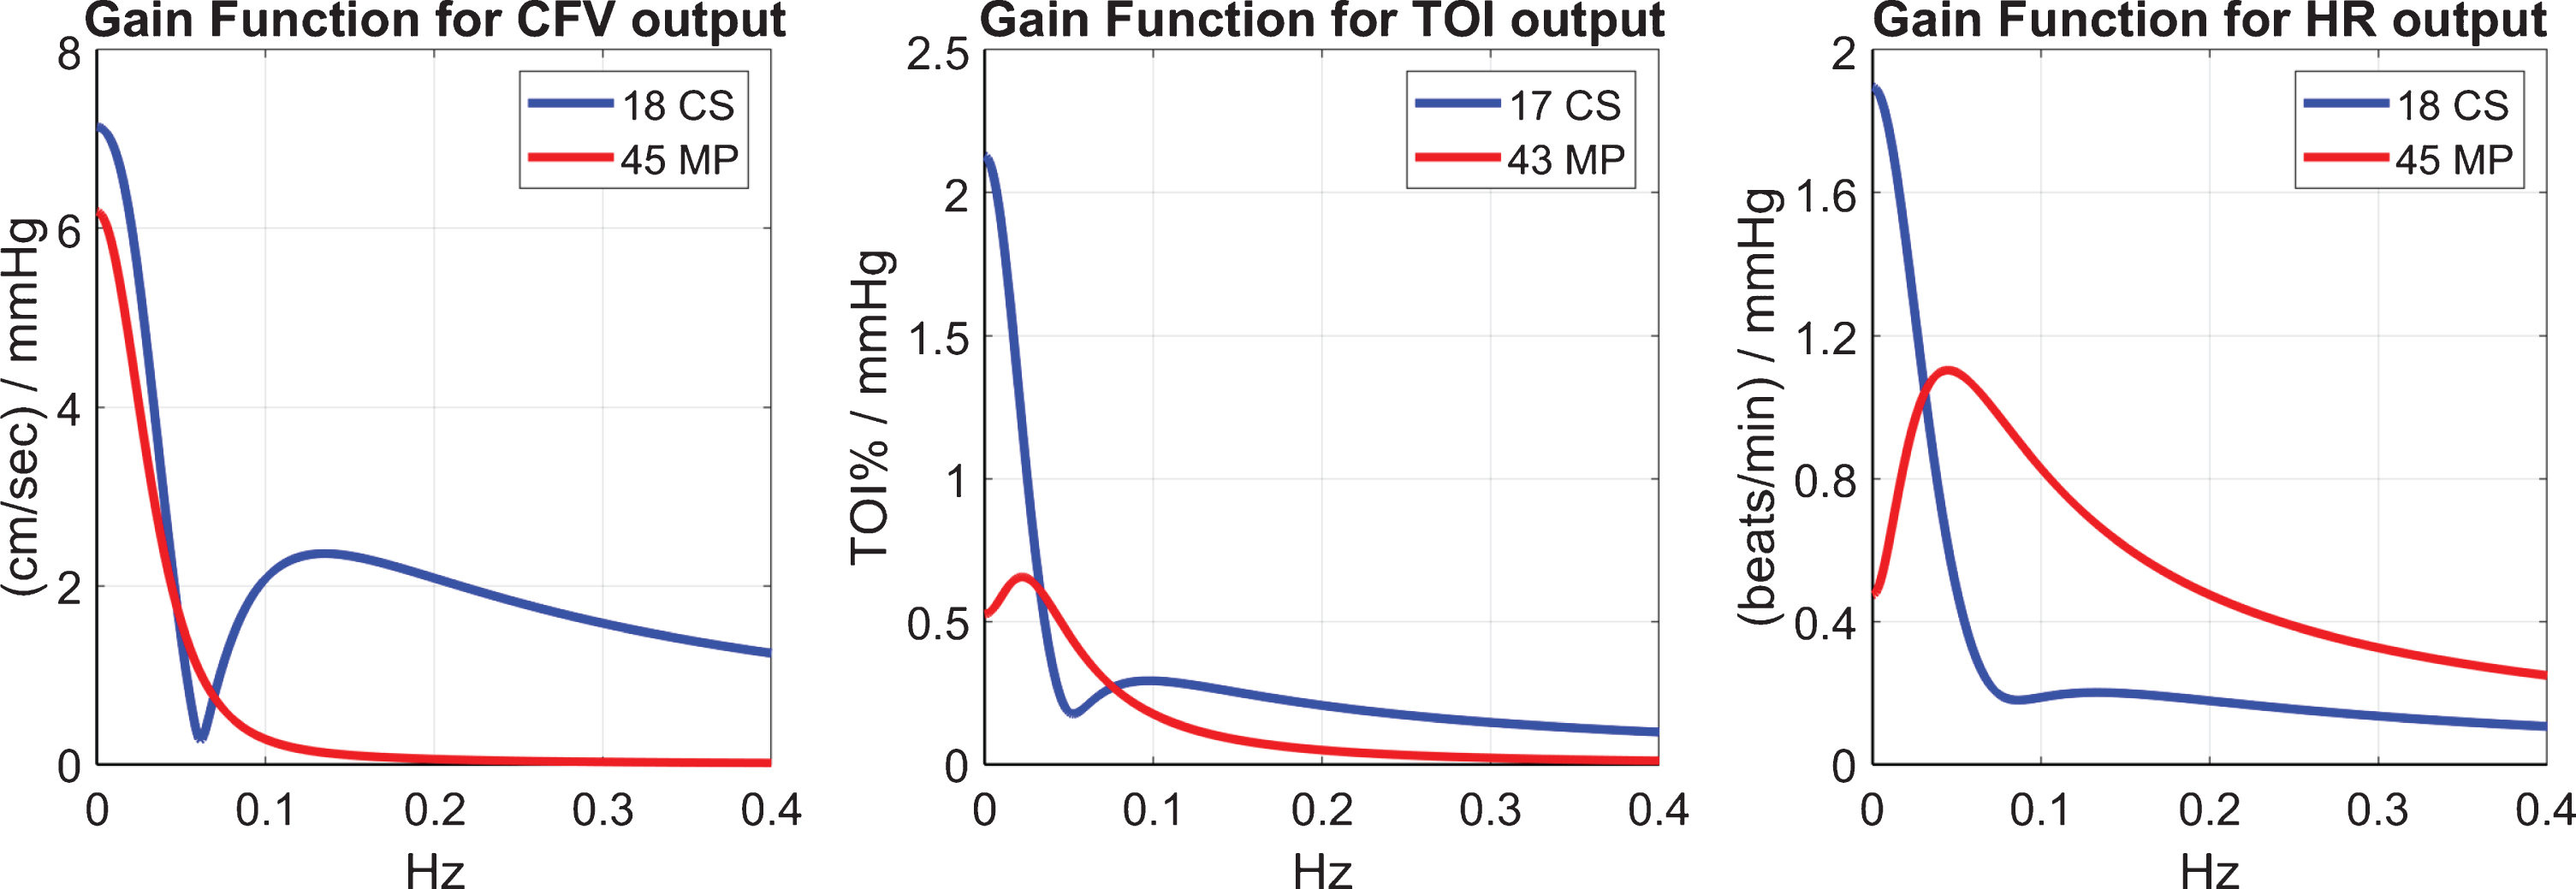
The differences between MP and CS in their dynamic responses to CO2 changes can be also examined via the magnitude (gain) of their respective Transfer Functions for the three outputs CFV, TOI and HR that are shown in Fig. 6. Notable differences are seen in the low-frequencies between MP and CS, with the CS exhibiting larger values, especially for the TOI and HR outputs. Some differences are also evident in terms of distinct resonant peaks (see Discussion).
Fig. 6
The gain of the Transfer Functions (Fourier Transform magnitudes) of the kernels for CO2 input and CFV output (left), TOI output (middle) and HR output (right). Notable differences are seen in the low-frequencies between MP and CS, as well as in the location of resonant peaks.
Correlations between model-based indices and potential use of composite indices
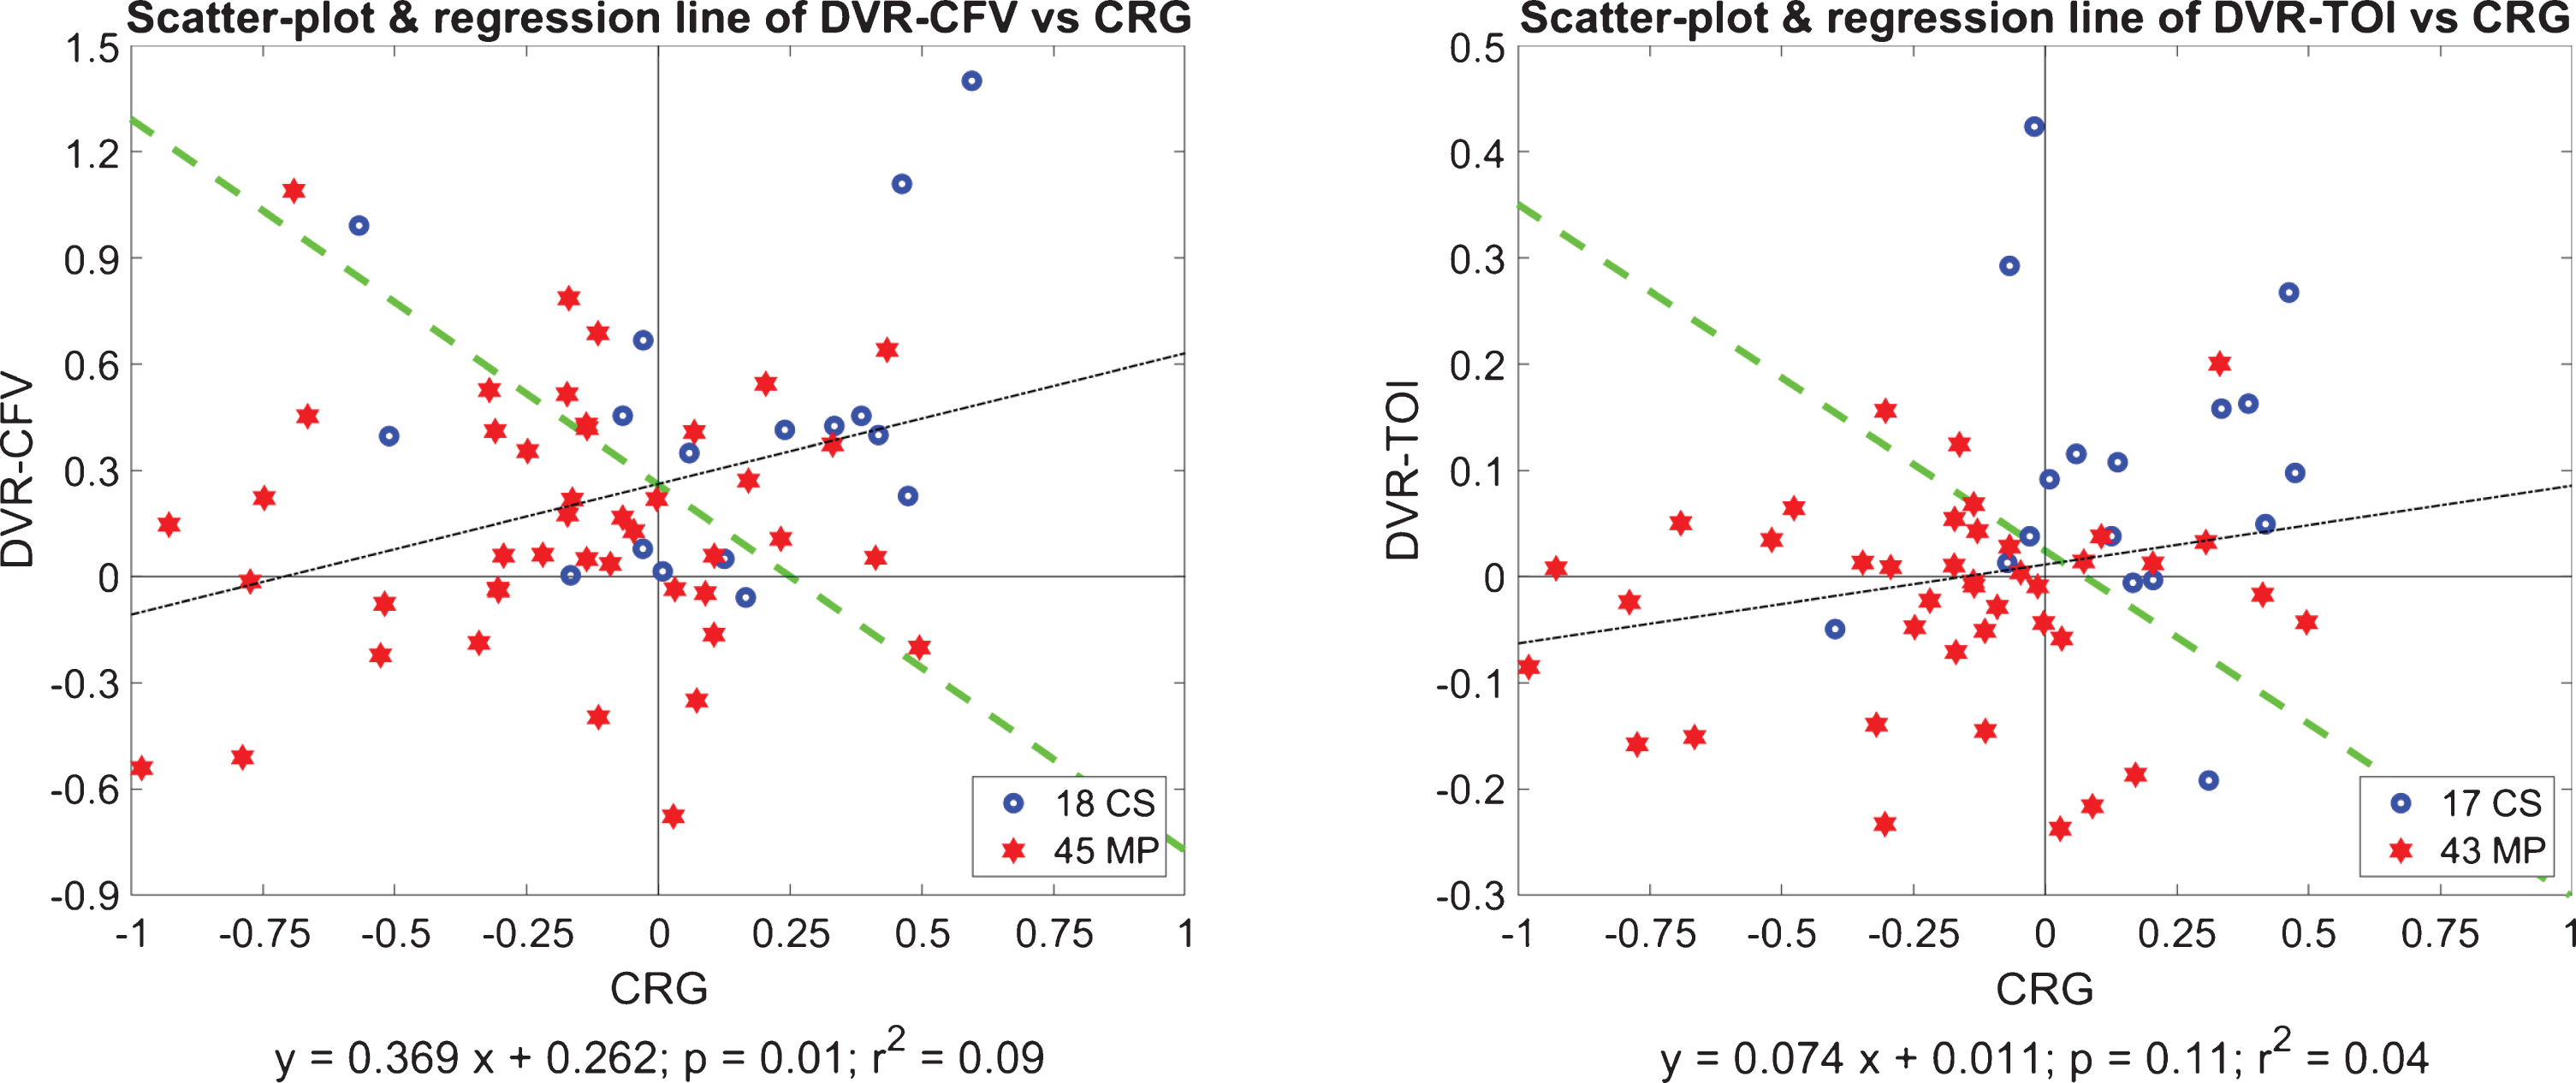
Next we examine possible correlations between the obtained CRG indices and the two types of DVR indices (DVR-CFV and DVR-TOI) by computing the regression lines in the respective scatter-plots. The results are shown in Fig. 7 for DVR-CFV versus CRG (left panel) and for DVR-TOI versus CRG (right panel), for all MP and CS. We see that there is significant correlation between DVR-CFV and CRG (p = 0.0147), but not between DVR-TOI and CRG (p = 0.1067), indicating that the CRG influences primarily the flow regulation in large cerebral vessels (DVR-CFV) but not in small/micro cortical vessels (DVR-TOI). This invites the question of the primary causes of DVR-TOI impairment in MCI. One plausible hypothesis could implicate the dysregulation of neurovascular coupling, which is localized in its effects to meet metabolic needs (see Discussion). The Fisher Discriminants [37] are also plotted in Fig. 7 (as green lines) and suggest the potential utility of composite indices combining the DVR indices with the CRG index to improve delineation between CS and MP—and be used potentially as “diagnostic boundaries”. We found that the Composite Index: [CRG + 3.07×DVR-TOI], which is defined by the Fisher Discriminant for the respective scatter-plot (right panel of Fig. 7), yields a very small p-value of 2×10⁻⁵ that represents considerable improvement over the previous p-values by two orders of magnitude. This also indicates that the DVR-TOI and the CRG indices contain largely uncorrelated information. On the other hand, as another indication that the DVR-CFV and the CRG contain partly correlated information, the Fisher Discriminant for the respective scatter-plot (left panel of Fig. 7) yields a p-value of 0.0003 that is one order of magnitude smaller than the one achieved by CRG alone (p = 0.0031).
Fig. 7
Regression lines of the scatter-plots of DVR-CFV versus CRG (left panel) and DVR-TOI versus CRG (right panel), for all MP (red stars) and CS (blue circles). The indices DVR-CFV and CRG have significant correlation (p = 0.0146), but the indices DVR-TOI and CRG do not (p = 0.1066). The Fisher Discriminants are also plotted as green lines (see text).
Average cerebral tissue-oxygenation values versus CRG and DVR-TOI indices
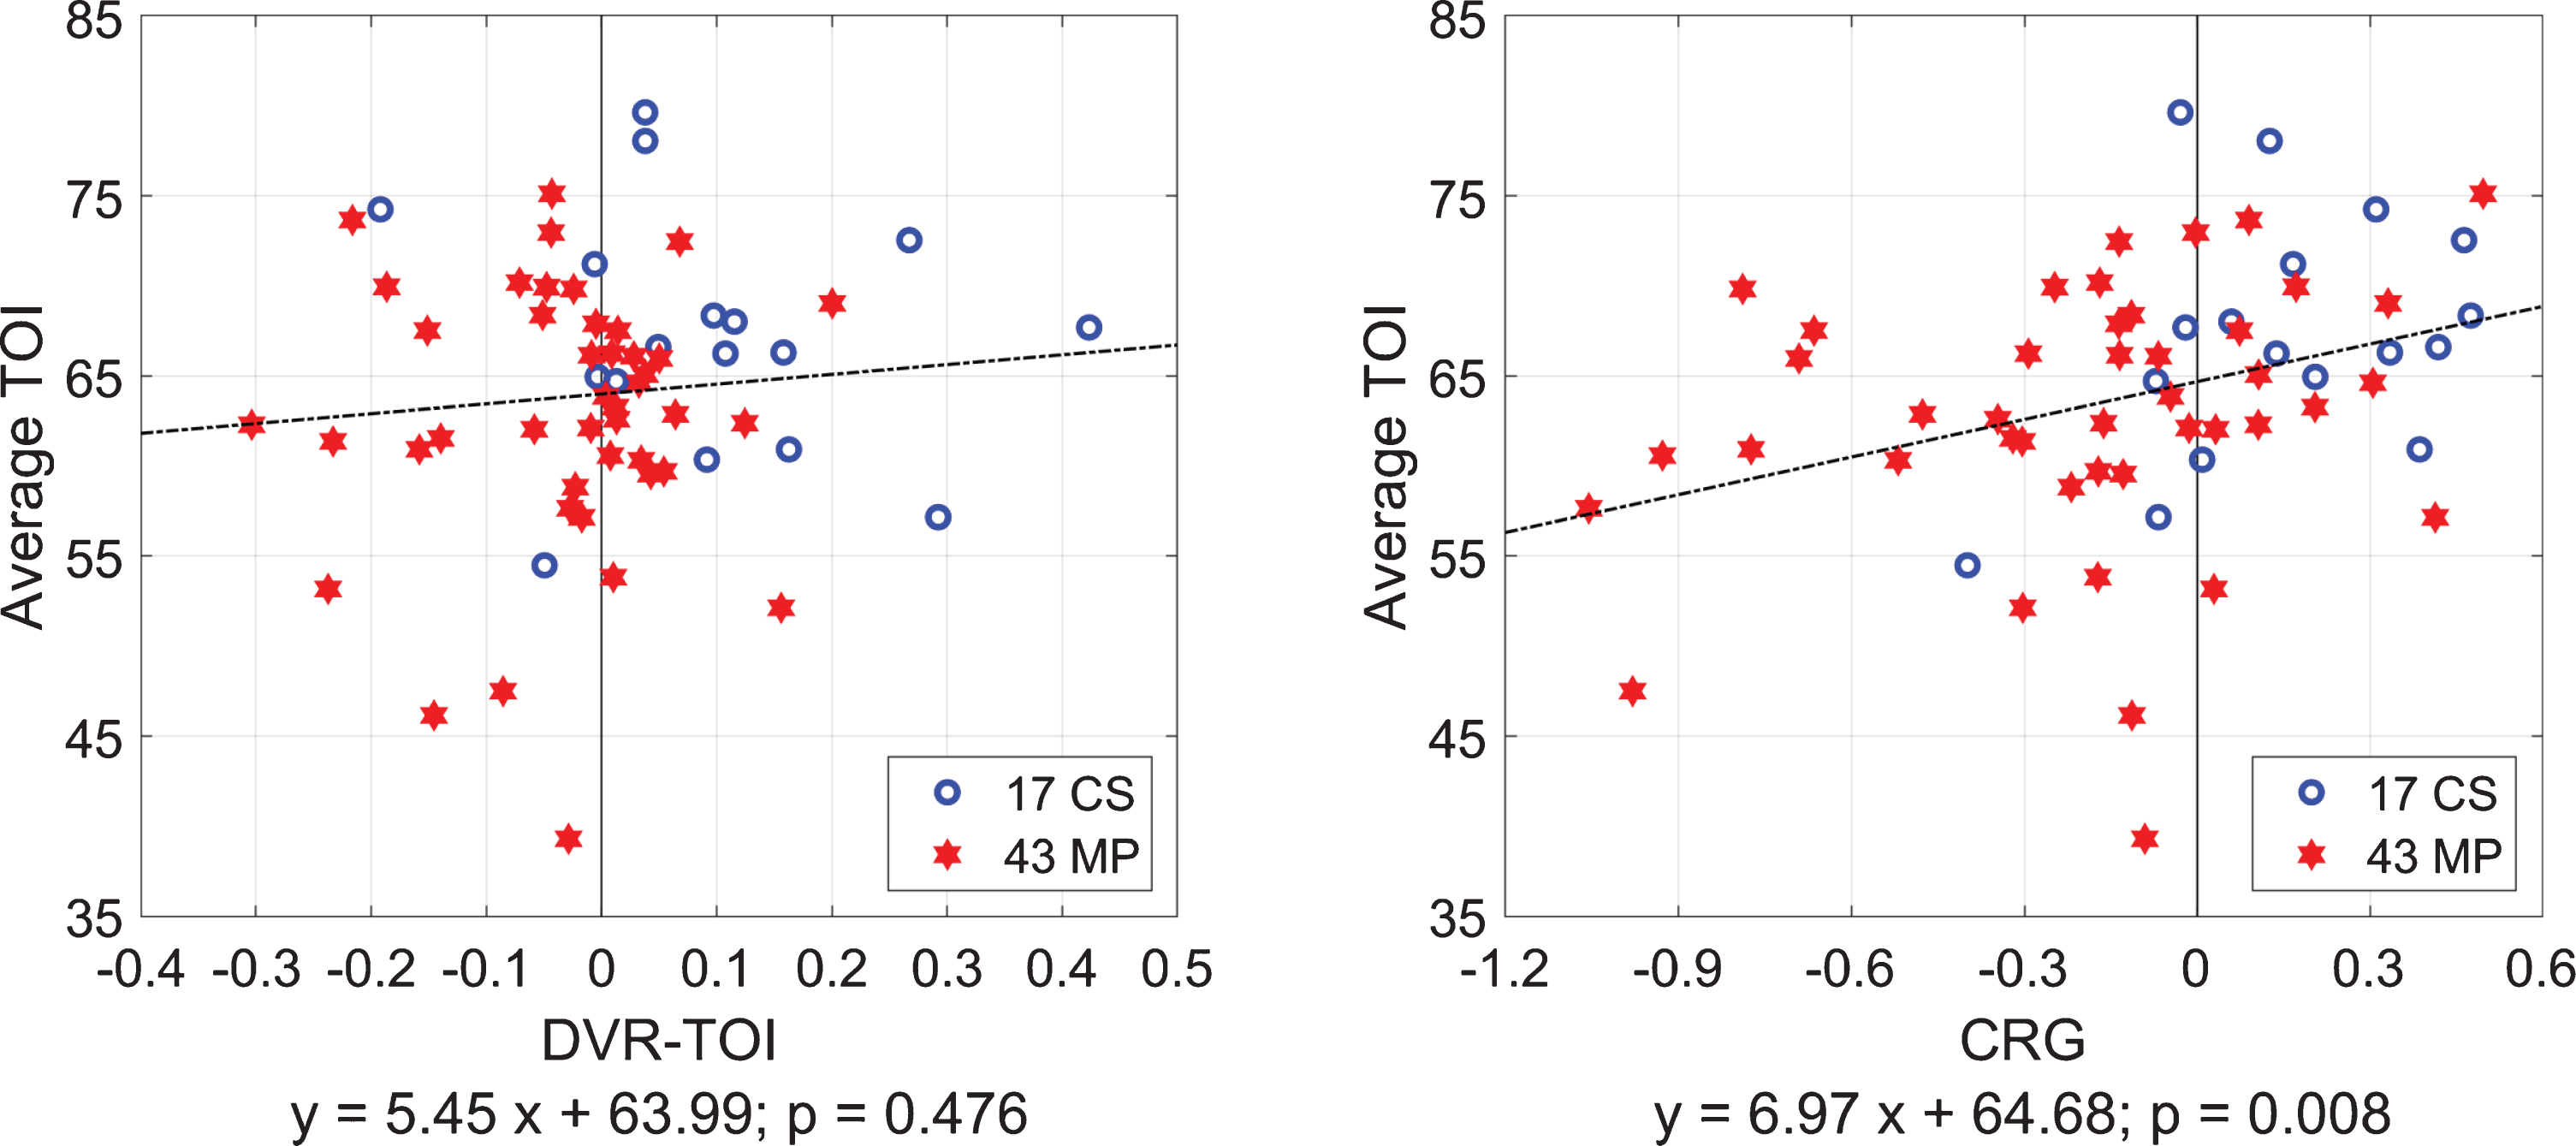
We also examined whether there is significant correlation between the Average-TOI values (i.e., the time-average of each TOI time-series) and the CRG or DVR-TOI indices for 17 CS and 43 MP together. The regression lines in the two scatter-plots of Fig. 8 show that only the CRG indices have significant correlation with the Average-TOI values (p = 0.008), indicating that the CO2-driven heart-rate chemoreflex gain has significant influence on the average tissue-oxygenation level –but the DVR at the level of cortical small/micro vessels is not correlated significantly with the average cortical tissue-oxygenation (p = 0.476). This suggests that the CO2-driven heart-rate chemoreflex must function properly in order to maintain adequate average cortical tissue-oxygenation or, conversely, a malfunction of this chemoreflex mechanism is expected to cause significantly lower average tissue-oxygenation levels in the prefrontal cortex.
Fig. 8
Scatter-plots and regression lines for Average-TOI values versus CRG indices (right) or DVR-TOI indices (left) for 17 CS (blue circles) and 43 MP (red stars) taken together. The Average-TOI values correlate strongly with the CRG indices but not with the DVR-TOI indices.
Correlation of model-based DVR and CRG indices with clinical measures of cognitive impairment
Finally, we examined possible correlations between the obtained model-based DVR-CFV and DVR-TOI indices of cerebral perfusion and clinical measures of cognitive impairment in our amnestic MCI cohort provided by the scores of the Delayed Logical Memory Recall (DLMR) neuropsychological test. Figure 9 shows the scatter-plots for DLMR versus DVR-CFV and DVR-TOI with the regression lines (dotted black) indicating significant correlation between DLMR and both DVR indices (p = 0.0011 for DVR-CFV and p = 0.0088 for DVR-TOI). The Fisher Discriminants are also shown as dashed green lines and suggest the potential use of the Composite Indices: [DLMR + 0.51×DVR-CFV] and [DLMR + 8.33×DVR-TOI] to achieve improved delineation between MP and CS (p∼10–10).
Fig. 9
Scatter-plots for Delayed Logical Memory Recall (DLMR) scores versus DVR-CFV index (left) and DVR-TOI index (right) with the regression lines (dotted black) indicating significant correlation between DLMR and both DVR indices (p = 0.0011 for DVR-CFV and p = 0.0088 for DVR-TOI). The Fisher Discriminants are also shown as dashed green lines and suggest the potential use of the Composite Indices: [DLMR + 0.51×DVR-CFV] and [DLMR + 8.33×DVR-TOI] to achieve improved delineation between MP and CS (p∼10–10).
![Scatter-plots for Delayed Logical Memory Recall (DLMR) scores versus DVR-CFV index (left) and DVR-TOI index (right) with the regression lines (dotted black) indicating significant correlation between DLMR and both DVR indices (p = 0.0011 for DVR-CFV and p = 0.0088 for DVR-TOI). The Fisher Discriminants are also shown as dashed green lines and suggest the potential use of the Composite Indices: [DLMR + 0.51×DVR-CFV] and [DLMR + 8.33×DVR-TOI] to achieve improved delineation between MP and CS (p∼10–10).](https://content.iospress.com:443/media/jad/2020/75-3/jad-75-3-jad191238/jad-75-jad191238-g009.jpg)
We note that we have also previously shown an association between our model-based DVR-CFV index and the scores of a neuropsychological test of executive function (Trail-Making Test B-A) in mixed MCI patients [41]. The demonstrated association was stronger than the one achieved by conventional measures of CO2 vasoreactivity using the CO2-inhalation testing protocol.
DISCUSSION
This paper presents a model-based methodology for the quantification of the heart-rate reflex (i.e., the baroreflex and CO2-driven chemoreflex function, separately) that is conceptually similar to the methodology that was recently proposed for the quantification of Dynamic Vasomotor Reactivity (DVR) and Dynamic Cerebral Autoregulation in MCI patients (MP) and cognitively normal control subjects (CS) [1]. This paper further examines the relation between model-based indices of the baroreflex or chemoreflex function—termed “Baroreflex Gain” (BRG) and “CO2-driven Chemoreflex Gain” (CRG), respectively—and model-based indices of DVR in large and small/micro cerebral vessels that were found recently to be significantly different between MP and CS [1]. The main findings of this study are:
(1) The DVR and CRG indices, as quantified by the respective kernels of the predictive dynamic models with CO2 input and each of the three outputs considered in this study (CFV, TOI, and HR), are significantly different between MP and CS (p < 0.01). See Tables 2 and 4, and Fig. 2 and 4. This suggests significant impairment of these key physiological mechanisms of cerebral flow regulation in amnestic MCI.
(2) The CRG and BRG indices were computed from the model-predicted HR responses to a CO2 unit-step stimulus and indicated that the CO2-driven heart-rate chemoreflex was significantly affected in MCI (p = 0.0031), but not the baroreflex (p = 0.5061), as shown in Table 4. There was no significant correlation between the obtained model-based CRG and BRG indices for either MP or CS, indicating distinct regulatory pathways for the CO2-driven heart-rate chemoreflex and baroreflex mechanisms. Based on this finding, we hypothesize that the pathogenesis of MCI/AD may be influenced more by biochemical factors captured by CRG (rather than biomechanical factors captured by BRG), which alter the perivascular biochemical microenvironment of cerebral tissue (leading to elevation of perivascular extracellular potassium) through endothelial, mitochondrial or neurovascular dysfunction caused by chronic acidosis, hypoxia oxidative stress or inflammation.
(3) Statistically significant correlation was found between the model-based CRG indices and the DVR-CFV indices (p = 0.0146) obtained in large cerebral vessels from analysis of blood flow velocity measurements at the middle cerebral arteries via transcranial Doppler, but no significant correlation was found between the model-based CRG indices and DVR-TOI indices (p = 0.1066) obtained in small/micro cortical vessels from analysis of tissue oxygenation measurements at the lateral prefrontal cortex via near infrared spectroscopy (see Fig. 7). Nonetheless, both DVR indices (DVR-CFV and DVR-TOI) were found to be significantly different between MP and CS (see Table 2), a finding that confirms the results of a previous study [1]. These findings suggest that the impairment of the CO2-driven heart-rate chemoreflex is related closely to the observed impairment of DVR-CFV in large cerebral vessels of MCI patients, but it is not significantly correlated with the DVR-TOI impairment in small/micro cortical vessels. This invites the use of a composite index combining CRG with DVR-TOI (defined by the Fisher Discriminant of the respective scatter-plot), which was found to yield a smaller p-value (p = 2×10⁻⁵) and also raises the important question of the primary causes of the observed impairment of DVR-TOI in small/micro cortical vessels of MCI patients that are distinct from the CO2-driven heart-rate chemoreflex dysfunction. A plausible hypothesis may implicate the possible dysfunction of localized neurovascular coupling mechanisms and/or changes in the cerebral perivascular biochemical microenvironment.
(4) There is significant correlation (p < 0.01) between scores of the Delayed Logical Memory Recall (DLMR) neuropsychological test and both model-based DVR indices of cerebral perfusion for patients and controls (see Fig. 9). Combining the DLMR scores with the DVR indices reduces the p-value of the composite diagnostic index by an order of magnitude (p∼10–10).
(5) The waveforms of the CO2-input kernels for all three outputs (CFV, TOI, and HR) bear a notable resemblance (see blue lines on the panels of Fig. 2 and the right panel of Fig. 4) as they exhibit an early fast component (for lags <4 s) followed by a slow component peaking around 10 sec and diminishing after 30 s lag (see below).
Some other notable specific findings:
Fast and slow components of DVR and CO2-driven heart-rate chemoreflex affected by MCI
In Fig. 2, there is an apparent difference in the average kernels for the CO2 input and CFV output (left panel) or TOI output (right panel) between MP (red line) and CS (blue line)—especially for short time-lags (<4 s), although some differences are seen for longer time-lags as well. These differences were found to be statistically significant (p < 0.01) when examined through the corresponding DVR indices (see Table 2). As noted above, the waveform of the average kernels for CS when the input is CO2 (see blue lines in Fig. 2 and in right panel of Fig. 4), exhibit an early positive component over the first 3-4-s lag, followed by a later positive component that peaks around 10-s lag and diminishes after 30-s lag. These two components define fast and slow dynamics of the CO2-driven heart-rate chemoreflex and may be due, respectively, to its peripheral (fast) branch mediated neurally via the peripheral chemoreceptors (at the carotid bodies and the aortic arch) and its central (slow) branch mediated via diffusion from the cerebrospinal fluid [35]. Our results suggest that both components of the CO2-driven heart-rate chemoreflex are affected by MCI, but the fast component is affected more severely by reversing polarity when the output is TOI or HR. The observed changes in the CO2-to-HR kernel may be caused by a shift in the set-point on the peripheral chemoreceptors sensitivity curve that is influenced by the pH in blood and tissue [35, 36]. There is also experimental evidence in the neurovascular coupling literature to support a physiological hypothesis centered on excessive perivascular potassium for explaining the counter-intuitive finding of polarity reversal in cerebral CO2 dynamic vasomotor reactivity in MCI patients that is discussed in the following subsection. Our analysis of the CO2-driven heart-rate chemoreflex (quantified by the CRG index) pertains only to this particular branch of chemoreflex and does not include the broader complex mechanisms of chemoreflexes that regulate respiration and influence the cardio-respiratory control centers in the brainstem.
The separation into fast and slow components of the CS kernels can also be illustrated in the frequency-domain via the Fourier Transform magnitudes of the respective kernels (i.e., the gain of the Transfer Function) as shown in Fig. 6 for the three distinct outputs. The fast component is most evident for the CFV output (see blue line in left panel) and exhibits a resonant peak around 0.1 Hz, while it is less pronounced for the TOI and HR outputs (see blue lines in middle and right panels). The resonant peak around 0.1 Hz is nonexistent in MP, who exhibit instead resonant peaks in the lower frequency range of 0.02–0.04 Hz for TOI and HR outputs, but none for CFV output. The physiological interpretation of these changes in the resonant peaks for MP is a high priority task for future research, as it may enable the identification of the physiological mechanisms of cerebral perfusion that are affected by MCI and may suggest possible treatments. Another notable difference of potential clinical importance is seen in the magnitude of the Transfer Functions at very low frequencies (<0.02 Hz), where the MP show much smaller values for the TOI and HR outputs. This quantitative finding may explain the critical effect of intermittent hypercapnia during episodes of sleep apnea (which take place at these very low frequencies) upon cerebral tissue oxygenation. This intriguing hypothesis also applies to the effect of natural slow variations of blood CO2 (<0.02 Hz) upon cerebral tissue oxygenation during normal sleep, suggesting the possibility of inadequate cerebral tissue oxygenation in MCI patients. Furthermore, this difference in the very low frequencies may plausibly cause inadequate glymphatic flow in MCI patients (due to the indicated reduction of cerebrovascular tone at very low frequencies). These hypotheses can be examined in future studies by collecting the requisite TOI, CO2, and ABP time-series data during sleep.
Physiological hypothesis to explain the observed negative DVR indices in MCI patients
Most intriguing remains the negative early portion of the CO2-to-TOI average kernel of the patients, especially since the average CO2-to-CFV kernel for the patients does not exhibit such negative values. This results in a negative average DVR-TOI index for the patients, which appears paradoxical but may be explained by experimental evidence in the neurovascular coupling literature [38] that a large rise in extracellular K+ in the perivascular space adjacent to astrocytic endfeet causes a reversal from vasodilation to vasoconstriction in response to astrocytic calcium waves, when this K+ rise exceeds a critical level (about 20 mM in mice). This critical level corresponds to the K+ concentration at which the K+ equilibrium potential equals the perivascular smooth-muscle membrane potential. Since the transition from vasodilation to vasoconstriction is governed by the astrocytic endfeet calcium and extracellular potassium (which are, in turn, dependent upon the proper function of the large-conductance K-channels in the astrocytic membrane and the inward-rectifying K-channels of the perivascular smooth muscle membrane), we posit that a plausible hypothesis for explaining this counter-intuitive finding could be that some long-lasting alteration in the perivascular biochemical microenvironment, possibly caused by a “sub-clinical” chronic condition (e.g., chronic acidosis, hypoxia, oxidative stress, or inflammation), may induce a long-term rise in extracellular K+ in the perivascular space and, consequently, a reversal of polarity in CO2 dynamic vasomotor reactivity. It has also been found in mice that such reversal of polarity may be caused by significant increase of free radical species in the perivascular space that impede the vasodilatory action of nitric oxide [8, 39].
Relation between DVR indices and conventional measures of CO2 vasoreactivity
The conventional measures of CO2 vasoreactivity (e.g., the slope of cerebral flow change over many breaths of CO2 inhalation) are related but different from the model-based DVR indices that are computed via predictive dynamic models of how CFV/TOI changes in response to breath-to-breath changes of CO2, while beat-to-beat changes of ABP are kept at baseline in the model simulation. Thus the estimated CO2-to-CFV kernel (which defines the DVR index) describes the dynamic (causal) effect of CO2 changes upon CFV after the contemporaneous effect of ABP changes upon CFV has been accounted by the two-input model. This implies that, if CO2 inhalation causes an increase of ABP (which is likely to occur due to a CO2-induced increase of heart rate), then the cascaded effect of a CFV increase due to an ABP increase (secondary to CO2 inhalation) will be included in the CO2 vasoreactivity measurement. Therefore, the latter will tend to be positively biased relative to the DVR index, which does not include the secondary effects of ABP changes that are “separated out” by the two-input predictive dynamic model.
TOI model prediction is more accurate for CS than MP
The accuracy of model prediction is measured via the Normalized Mean-Square Error (NMSE), which is the sum of the squared prediction errors divided by the sum of the squared (demeaned) output values. The mean (SD) of the resulting NMSE values are shown in Table 3 and indicate that the model prediction accuracy is comparable in CS and MP for the CFV output, but significantly different (p = 0.0121) between CS and MP for the TOI output, with the patients having higher NMSE values. This finding suggests that there are more unaccounted (probably localized) factors influencing the dynamic relationship between the TOI output and the two systemic inputs of ABP and CO2 in the presence of MCI. Plausible hypotheses to explain this finding include the possibility of altered perivascular molecular environment around the micro/small vessels in the prefrontal cortex of MCI patients (due to chronic acidosis, hypoxia, oxidative stress, or inflammation) or altered dynamics of neurovascular coupling [3–6, 35, 36, 38–40].
In summary, since many previous studies have shown that the progression of cognitive impairment in patients with MCI or Alzheimer’s disease (or other forms of dementia and neurodegenerative disease) is associated with impairment of cerebral vasomotor reactivity to hypercapnia, we advocate the potential utility of the kernel-based modeling methodology to obtain reliable diagnostic “physio-markers” of DVR and CRG, using non-invasive data recorded safely and comfortably for the patient. In addition to the potential diagnostic utility, the obtained kernel-based models can advance our quantitative understanding of the mechanisms involved in the relevant physiological processes, when the physiological interpretation of the kernel waveforms is achieved in the future.
Limitations of this study
Although the presented results are promising, data from a larger cohort of MCI patients and control subjects must be analyzed before any conclusions are drawn regarding the potential clinical utility of these model-based physio-markers. Another lingering question regards the specificity of these physio-markers in terms of their ability to differentiate among various pathologies and cerebrovascular diseases that affect the cerebral vasomotor reactivity. The utilization of Principal Dynamic Modes [1, 25] to dissect further the altered physiological dynamics offers some promise for achieving satisfactory specificity. In this regard, the intrinsic interactions among multiple nested physiological mechanisms and the innate variability of physiological measurements are bound to present formidable challenges in assessing quantitatively the consistency and specificity of these model-based physio-markers. Nonetheless, this approach offers reliable quantitative tools to examine the dynamic relationships among these key variables (possibly augmented in the future with the inclusion of respiratory and oximeter time-series data) in a multi-variate context.
Conclusions
The main conclusions of this study are:
(1) Model-based indices of CO2-driven heart-rate chemoreflex gain (CRG) differentiate MCI patients from controls (p = 0.0031), indicating CO2-driven chemoreflex dysregulation in MCI.
(2) The CRG indices correlate significantly with the observed impairment in DVR-CFV of cerebral arteries in MCI patients (p = 0.0147), but do not correlate significantly with the impairment of DVR-TOI in cortical small/micro vessels in the prefrontal cortex of MCI patients (p = 0.1067).
(3) The lack of significant correlation between the CRG indices and the observed impairment of DVR-TOI in cortical small/micro vessels of MCI patients suggests that there are factors other than chemoreflex dysregulation that influence strongly this impairment (possibly cerebral chronic hypoxia/acidosis or dysregulation of neurovascular coupling).
(4) The dynamic effects of blood CO2 changes upon blood flow in cerebral arteries and cortical tissue oxygenation in control subjects bear notable similarities and resemble the dynamic effects upon heart-rate, while these dynamic effects are dissimilar in MCI patients.
(5) The combined use of model-based DVR-TOI and CRG indices allows improved differentiation of MCI patients from controls by two orders of magnitude (p = 2×10⁻⁵).
(6) There is significant correlation (p < 0.01) between the scores of the DLMR neuropsychological test and both model-based DVR indices of cerebral perfusion. Combining the DLMR scores with the DVR indices reduces the p-value of the composite diagnostic index (p∼10–10).
ACKNOWLEDGMENTS
This work was supported in part by the NIH/NIBIB grant P41-EB001978 awarded to the University of Southern California and by the NIA grant R01-AG033106 awarded to the University of Texas, Southwestern Medical Center, as well as by the NIH/NIA grant R01-AG058162 awarded to both University of Southern California and the University of Texas, Southwestern Medical Center.
Authors’ disclosures available online (https://www.j-alz.com/manuscript-disclosures/19-1238r2).
SUPPLEMENTARY MATERIAL
[1] The supplementary material is available in the electronic version of this article: https://dx.doi.org/10.3233/JAD-191238.
REFERENCES
[1] | Marmarelis VZ , Shin DC , Tarumi T , Zhang R ((2017) ) Comparison of model-based indices of cerebral autoregulation and vasomotor reactivity using transcranial doppler versus near-infrared spectroscopy in patients with amnestic mild cognitive impairment. J Alzheimers Dis 56: , 89–105. |
[2] | Marmarelis VZ , Shin DC , Orme ME , Zhang R ((2013) ) Model-based quantification of cerebral hemodynamics as a physiomarker for Alzheimer’s disease? Ann Biomed Eng 41: , 2296–2317. |
[3] | de la Torre JC ((2002) ) Alzheimer disease as a vascular disorder. Nosological evidence. Stroke 33: , 1152–1162. |
[4] | Kalaria RN ((2002) ) Small vessel disease and Alzheimer’s dementia: Pathological considerations. Cerebrovasc Dis 13: , 48–52. |
[5] | Iadecola C ((2003) ) Cerebrovascular effects of amyloid-beta peptides: Mechanisms and implications for Alzheimer’s dementia. Cell Mol Neurobiol 23: , 681–689. |
[6] | Iadecola C , Gorelick PB ((2003) ) Converging pathogenic mechanisms in vascular and neurodegenerative dementia. Stroke 34: , 335–337. |
[7] | Hachinski V , Iadecola C ((2004) ) Vascular cognitive impairment: Introduction. Stroke 35: , 2615. |
[8] | Tong XK , Nicolakakis N , Kocharyan A , Hamel E ((2005) ) Vascular remodeling versus amyloid beta-induced oxidative stress in the cerebrovascular dysfunction associated with Alzheimer’s disease. J Neurosci 25: , 11165–11174. |
[9] | Silvestrini M , Pasqualetti P , Baruffaldi R , Bartolini M , Handouk Y , Matteis M , Moffa F , Provinciali L , Vernieri F ((2006) ) Cerebrovascular reactivity and cognitive decline in patients with Alzheimer’s disease. Stroke 37: , 1010–1015. |
[10] | Bell RD , Zlokovic BV ((2009) ) Neurovascular mechanisms and blood-brain barrier disorder in Alzheimer’s disease. Acta Neuropathol 118: , 103–113. |
[11] | Smith EE , Greenberg SM ((2009) ) Amyloid-beta, blood vessels and brain function. Stroke 40: , 2601–2606. |
[12] | Claassen JA , Diaz-Arrastia R , Martin-Cook K , Levine BD , Zhang R ((2009) ) Altered cerebral hemodynamics in early Alzheimer disease: A pilot study using transcranial Doppler. J Alzheimers Dis 17: , 621–629. |
[13] | Claassen JA , Zhang R ((2011) ) Cerebral autoregulation in Alzheimer’s disease. J Cereb Blood Flow Metab 31: , 1572–1577. |
[14] | Murray IVJ , Proza JF , Sohrabji F , Lawler JM ((2011) ) Vascular and metabolic dysfunction in Alzheimer’s disease: A review. Exp Biol Med 236: , 772–782. |
[15] | Nicolakakis N , Hamel E ((2011) ) Neurovascular function in Alzheimer’s disease patients and experimental models. J Cereb Blood Flow Metab 31: , 1354–1370. |
[16] | Sellke FW , Seshadri S , Chui HC , Higashida RT , Lindquist R , Nilsson PM , Roman GC , Petersen RC , Schneider JA , Tzourio C , Arnett DK , Bennett D , Iadecola C , Launer LJ , Laurent S , Lopez OL , Nyenhuis D , Gorelick PB , Scuteri A , Black SE , DeCarli C , Greenberg SM ((2011) ) Vascular contributions to cognitive impairment and dementia: A statement for healthcare professionals from the AHA/ASA. Stroke 42: , 2672–2713. |
[17] | Lopez de Pablo AL , Gonzalez MC , Dieguez G , Gomez B , Lluch S ((1982) ) Cerebrovascular responses to CO2 after inhibition of sympathetic activity. J Appl Physiol 53: , 873–878. |
[18] | Ainslie PN , James Duffin J ((2009) ) Integration of cerebrovascular CO2 reactivity and chemoreflex control of breathing: Mechanisms of regulation, measurement, and interpretation. Am J Physiol Regul Integr Comp Physiol 296: , R1473–R1495. |
[19] | Duffin J ((2010) ) The role of the central chemoreceptors: A modeling perspective. Respiratory Physiol Neurobiol 173: , 230–243. |
[20] | Ding YF , Li YL , Harold D , Schultz HD ((2011) ) Role of blood flow in carotid body chemoreflex function in heart failure. J Physiol 589: , 245–258. |
[21] | Hazlett C , Edgell H ((2018) ) Chemoreflex function and brain blood flow during upright posture in men and women. Physiol Rep 6: , e13571. |
[22] | Maeda H , Matsumoto M , Handa N , Hougaku H , Ogawa S , Itoh T , Tsukamoto Y , Kamada T ((1993) ) Reactivity of cerebral blood flow to carbon dioxide in various types of ischemic cerebrovascular disease: Evaluation by the transcranial Doppler method. Stroke 24: , 670–675. |
[23] | Tantucci C , Bottini P , Fiorani C , Dottorini ML , Santeusanio F , Provinciali L , Sorbini CA , Casucci G ((2001) ) Cerebrovascular reactivity and hypercapnic respiratory drive in diabetic autonomic neuropathy. J Appl Physiol 90: , 889–896. |
[24] | Cupini LM , Diomedi M , Placidi F , Silvestrini M , Giacomini P ((2001) ) Cerebrovascular reactivity and subcortical infarctions. Arch Neurol 58: , 577–581. |
[25] | Marmarelis VZ ((2004) ) Nonlinear Dynamic Modeling of Physiological Systems. Wiley-Interscience & IEEE Press. |
[26] | Marmarelis VZ , Shin DC , Zhang R ((2012) ) Linear and nonlinear modeling of cerebral flow autoregulation using principal dynamic modes. Open Biomedical Eng J 6: , 42–55. |
[27] | Petersen RC , Doody R , Kurz A , Mohs RC , Morris JC , Rabins PV , Ritchie K , Rossor M , Thal L , Winblad B ((2001) ) Current concepts in mild cognitive impairment. Arch Neurol 58: , 1985–1992. |
[28] | Tiecks FP , Lam AM , Aaslid R , Newell DW ((1995) ) Comparison of static and dynamic cerebral autoregulation measurements. Stroke 26: , 1014–1019. |
[29] | Zhang R , Zuckerman JH , Giller CA , Levine BD ((1998) ) , Transfer function analysis of dynamic cerebral autoregulation in humans. Am J Physiol 274: , 233–241. |
[30] | Panerai RB , Dawson SL , Potter JF ((1999) ) Linear and nonlinear analysis of human dynamic cerebral autoregulation. Am J Physiol 277: , H1089–H1099. |
[31] | Panerai RB , Simpson DM , Deverson ST , Mahony P , Hayes P , Evans DH ((2000) ) Multivariate dynamic analysis of cerebral blood flow regulation in humans. IEEE Trans Biomed Eng 47: , 419–423. |
[32] | Novak V , Yang AC , Lepicovsky L , Goldberger AL , Lipsitz LA , Peng CK ((2004) ) Multimodal pressure-flow method to assess dynamics of cerebral autoregulation in stroke and hypertension. Biomed Eng Online 3: , 39. |
[33] | Panerai RB ((2008) ) Cerebral autoregulation: From models to clinical applications. Cardiovasc Eng 8: , 42–59. |
[34] | van Beek AH , Claassen JA , Rikkert MG , Jansen RW ((2008) ) Cerebral autoregulation: Overview of current concepts and methodology with special focus on the elderly. J Cereb Blood Flow Metab 28: , 1071–1085. |
[35] | Ainslie P , Duffin J ((2009) ) Integration of cerebrovascular CO2 reactivity and chemoreflex control of breathing: Mechanisms of regulation, measurement, and interpretation. Am J Physiol Regul Integr Comp Physiol 296: , R1473–R1495. |
[36] | Semenza GL , Prabhakar NR ((2018) ) The role of hypoxia-inducible factors in carotid body (patho) physiology. J Physiol 596: , 2977–2983. |
[37] | Fisher RA ((1936) ) The use of multiple measurements in taxonomic problems. Ann Eugenics 7: , 179–188. |
[38] | Girouard H , Bonev AD , Hannah RM , Meredith A , Aldrich RW , Nelson MT ((2010) ) Astrocytic endfoot Ca2+ and BK channels determine both arteriolar dilation and constriction. Proc Natl Acad Sci U S A 107: , 3811–3616. |
[39] | Tong XK , Trigiani LJ , Hamel E ((2019) ) High cholesterol triggers white matter alterations and cognitive deficits in a mouse model of cerebrovascular disease: Benefits of simvastatin. Cell Death Dis 10: , 89. |
[40] | Lassen NA ((1959) ) Cerebral blood flow and oxygen consumption in man. Physiol Rev 39: , 183–238. |
[41] | Hajjar I. , Marmarelis VZ , Shin DC , Chui H ((2014) ) Assessment of cerebrovascular reactivity during resting state breathing and its correlation with cognitive function in hypertension. Vasc Dis 38: , 10–16. |


