
Contributions of Cerebro-Cerebellar Default Mode Connectivity Patterns to Memory Performance in Mild Cognitive Impairment
Abstract
Background:
The cerebral default mode network (DMN) can be mapped onto specific regions in the cerebellum, which are specifically vulnerable to atrophy in Alzheimer’s disease (AD) patients.
Objective:
We set out to determine whether there are specific differences in the interaction between the cerebral and cerebellar DMN in amnestic mild cognitive impairment (aMCI) patients compared to healthy controls using resting-state functional MRI and whether these differences are relevant for memory performance.
Methods:
Eighteen patients with aMCI were age and education-matched to eighteen older adults and underwent 3T MR-imaging. We performed seed-based functional connectivity analysis between the cerebellar DMN seeds and the cerebral DMN.
Results:
Our results showed that compared to healthy older adults, aMCI patients showed lower anti-correlation between the cerebellar DMN and several cerebral DMN regions. Additionally, we showed that degradation of the anti-correlation between the cerebellar DMN and the medial frontal cortex is correlated with worse memory performance in aMCI patients.
Conclusion:
These findings provide evidence that the cerebellar DMN and cerebral DMN are negatively correlated during rest in older individuals, and suggest that the reduced anti-correlated impacts the modulatory role of the cerebellum on cognitive functioning, in particular on the executive component of memory functions in neurodegenerative diseases.
INTRODUCTION
Cerebellar functioning has long been associated with motor control and motor learning rather than higher order cognitive performance [1, 2]. The rise of modern imaging techniques and supporting clinical data has led to new insights into the role of the cerebellum in cognitive and emotional functioning [3, 4]. The cerebellar cognitive affective syndrome and the dysmetria of thought hypothesis provided evidence that the cerebellum plays a modulatory role in many cognitive operations. Interestingly, this hypothesis did not directly involve memory operations, but suggested that the cerebellum modulates memory performance via the executive components of memory. While this idea fits within the concept of the modulatory role of the cerebellum in a wide range of complex cognitive functions, and is supported by the substantial connections between the cerebellum and both the frontal and medial temporal regions, the role of the cerebellum in memory disorders has received little attention [5–9].
The cerebellum is an integral part of large-scale distributed neural networks, including memory related networks such as the resting-state default mode network (DMN) [10–16]. Neuroimaging work in more than 1,000 healthy individuals has made it clear that cerebellar areas show an orderly and proportional topography with distinct cerebral functional networks, demonstrating that areas within Crus I and Crus II of the cerebellum are functionally coupled with the cerebral DMN network [11, 17, 18].
In addition, the cerebellum has shown to play a role in the key cognitive functions of healthy individuals and various neuropsychiatric disorders [1, 13, 19, 20]. But the majority of the resting-state studies in Alzheimer’s disease (AD), a neurodegenerative disorder with prominent memory deficits, so far have excluded or disregarded the interaction between cerebellar networks and cerebral networks. Nevertheless, AD neuropathology has been observed in the cerebellum of AD cases but not in non-demented brains indicating that cerebellar pathology might be relevant in AD and may affect the integrity of cerebro-cerebellar networks [21–23]. As of yet, three previous studies have focused on cerebellar functional alterations in AD [24–26]. By taking a whole brain approach, these studies have shown that the integrity of cerebro-cerebellar networks are affected in AD patients. Structural neuroimaging work showed that atrophy patterns in AD mirror the DMN topology both in the cerebrum [27] and cerebellum [28], providing further evidence that neurodegenerative pathology occurs in a network-specific manner, spanning over both cerebral and cerebellar pathways.
To further investigate whether the interaction between the cerebellum and cerebrum DMN has a functional relevance to memory impairment, we aimed to investigate differences in functional connectivity between DMN cerebral and cerebellar networks between healthy older individuals and amnestic mild cognitive impairment (aMCI) patients, since aMCIs are a group at high risk for developing AD. Guided by the dysmetria-of-thought hypothesis, we hypothesized that differences in cerebro-cerebellar DMN connectivity are associated with memory performance, particularly through cerebellar-frontal, rather than cerebellar-hippocampal connections, thereby reflecting the cerebellar influences on the executive component on memory functioning. Because the anatomical boundaries of the cerebellar subregions do not seem to demarcate the functional nodes of DMN and other resting-state networks, we defined the DMN using previously validated functional maps of the cerebral and cerebellar intrinsic networks [18]. The findings of this study will provide important insight into the role of the cerebellum in intrinsic connectivity differences in the DMN in aMCI patients compared to healthy older adults and its relevance to memory dysfunction.
METHODS
Participants
Eighteen aMCI patients (single and multiple domain) were recruited from the memory clinic of the Maastricht University Medical Center. These participants were matched on age and education with eighteen cognitively healthy older control participants.
For the patient group, the following inclusion criteria were met: diagnosis of aMCI established by a clinical expert (FRJV) according to the Petersen 2014 criteria: an impairment in the memory domain of minimally – 1.5 SD [29], and in addition, presence of cognitive complaints and a clinical dementia rating score of 0.5 [30]. Advertisements in local newspapers were used to recruit all the control participants. The inclusion criteria for the control group consisted of a clinical dementia rating of 0, no cognitive complaints should be reported, and no objective cognitive deficits should be revealed on the neuropsychological assessment.
In both patients and control groups, only right-handed male individuals were included, as handedness is related to cerebro-cerebellar asymmetry [31]. Participants with a history of psychoactive medication use, abuse of alcohol or drugs, past or present psychiatric or neurologic disorders (i.e., epilepsy, stroke, Parkinson’s disease, multiple sclerosis, brain surgery, brain trauma, electroshock therapy, or brain infections), heart disease, current uncontrolled hypertension (scored as yes or no), presence of depressive symptoms as indicated by the Hamilton Depression Rating Scale (HDRS; score ≥17; [32]) or contraindications for scanning were excluded from the study. A neuroradiologist ensured absence of clinically relevant neuropathology based on the magnetic resonance (MR) images. The study was approved by the local Medical Ethics Committee and written informed consent was obtained from all participants in accordance to the Declaration of Helsinki (World Medical Association, 2013).
Downstream topographical markers
A qualitative visual rating scale was used to assess medial temporal lobe (MTL) atrophy while blinded to group adherence [33]. Coronal T1-weighted images were rated using a 5-point scale (medial temporal lobe atrophy scores), ranging from 0 (indicative of no atrophy) to 4 (severe atrophy) based on the height of the hippocampal formation and surrounding cerebrospinal spaces. Earlier work from our group showed that patients with a score of 3 or higher on the atrophy of the medial temporal lobe scale (left and right scores summed) were at increased risk for AD development [34]. One person in the control group had a score of 3, while none of the control participants scored above 3. In the aMCI group, 16 out of 18 patients (89%) obtained a score equal to or higher than 3, while the other 2 aMCI patients had a score of 2. Additionally, to examine MTL-independent contributions of the cerebro-cerebellar DMN connectivity on cognition, we also performed a manual segmentation of left and right hippocampal volumes using the protocol described in Clerx et al. [35]. Hippocampal volumes were adjusted for intracranial volume by calculating the hippocampal volume/intracranial volume ratio. Both MTA scores and hippocampal volumes provide topographic information about underlying neuronal damage specific characteristic for AD, damage which could increase the likelihood of developing AD [29, 36].
Procedures
Testing was conducted across two days. During the first session, a neuropsychological assessment and the HDRS were administered to ensure adherence to the inclusion criteria. The neuropsychological assessment consisted of the following tests: Mini-Mental State Examination (MMSE) [37], verbal fluency task [38], letter digit substitution test (LDST) [39], Stroop color word task [40], Verbal word learning task (WLT) (5 learning trials, delayed recall and recognition) [41], and concept shifting task (CST) [42]. Each participant received the tests in the same order. Finally, they were familiarized with magnetic resonance imaging (MRI) via a dummy scan session. During their second visit the actual MRI scanning session took place, which was at most 3 days after their first visit.
MRI acquisition
The MRI examination was performed using a 3.0 T whole body MR system (Philips Medical Systems, Best, the Netherlands). Anatomical images were acquired with a T1-weighted sequence: repetition time (TR) = 8 ms, echo time (TE) = 3.7 ms, Flip Angle (FA) = 8°, field of view (FOV) = 240×240 mm2, voxel size = 1 mm isotropic, matrix size = 240×240, and number of slices = 180.
The resting state scans were performed using a T2* echo planar imaging sequence: TR = 2000 ms, TE = 35 ms, FA = 90°, FOV = 224×224 mm2, voxel size = 3.5 mm isotropic, matrix size = 64×64, and number of slices = 36 (scan time 7 min). A high-resolution T2* echo planar imaging sequence was collected to improve registration: TR = 2200 ms, TE = 30 ms, FA = 80°, FOV = 224×224 mm2, voxel size = 2 mm isotropic, matrix size = 112×110, and number of slices = 70. Participants were instructed to stay relaxed, keep eyes open, and to fixate on a white cross that was projected on a mirror mounted on the head coil.
MRI data analysis
BrainVoyager QX version 2.6.1.2318 [43], FMRIB software library (FSL) version 5.0.4 (http://fsl.fmrib.ox.ac.uk/fsl/fswiki), in-house written matlab scripts (MathWorks, Natick, MA, USA) using NeuroElf (http://neuroelf.net/) and the in-house developed software package GIANT (EHBMG) [44] were used to perform preprocessing and MRI analysis.
Data preprocessing
Anatomic and functional preprocessing. The high-resolution T1-weighted images of each participant were normalized to Talairach space [45]. These anatomic images were co-registered to the functional data using the BrainVoyager 3D Volume Tool. Standard preprocessing procedures were performed [43]. These included slice scan time correction using cubic spline interpolation and removal of scanner related linear and nonlinear drifts using a temporal high-pass filter with cutoff set to 2 cycles per time course. In addition, motion correction was applied using a 3-dimensional rigid-body transformation of each volume to the first volume. Motion was first detected using trilinear interpolation and in a next step corrected using sinc interpolation. Talairach space was used to normalize the functional images resulting in voxel size of 3 mm isotropic. Furthermore, brain extraction and intensity inhomogeneity correction were performed. Finally, data were spatially smoothed with a Gaussian kernel of 4 mm full width at half maximum and temporally with a Gaussian kernel of 3 seconds full width at half maximum.
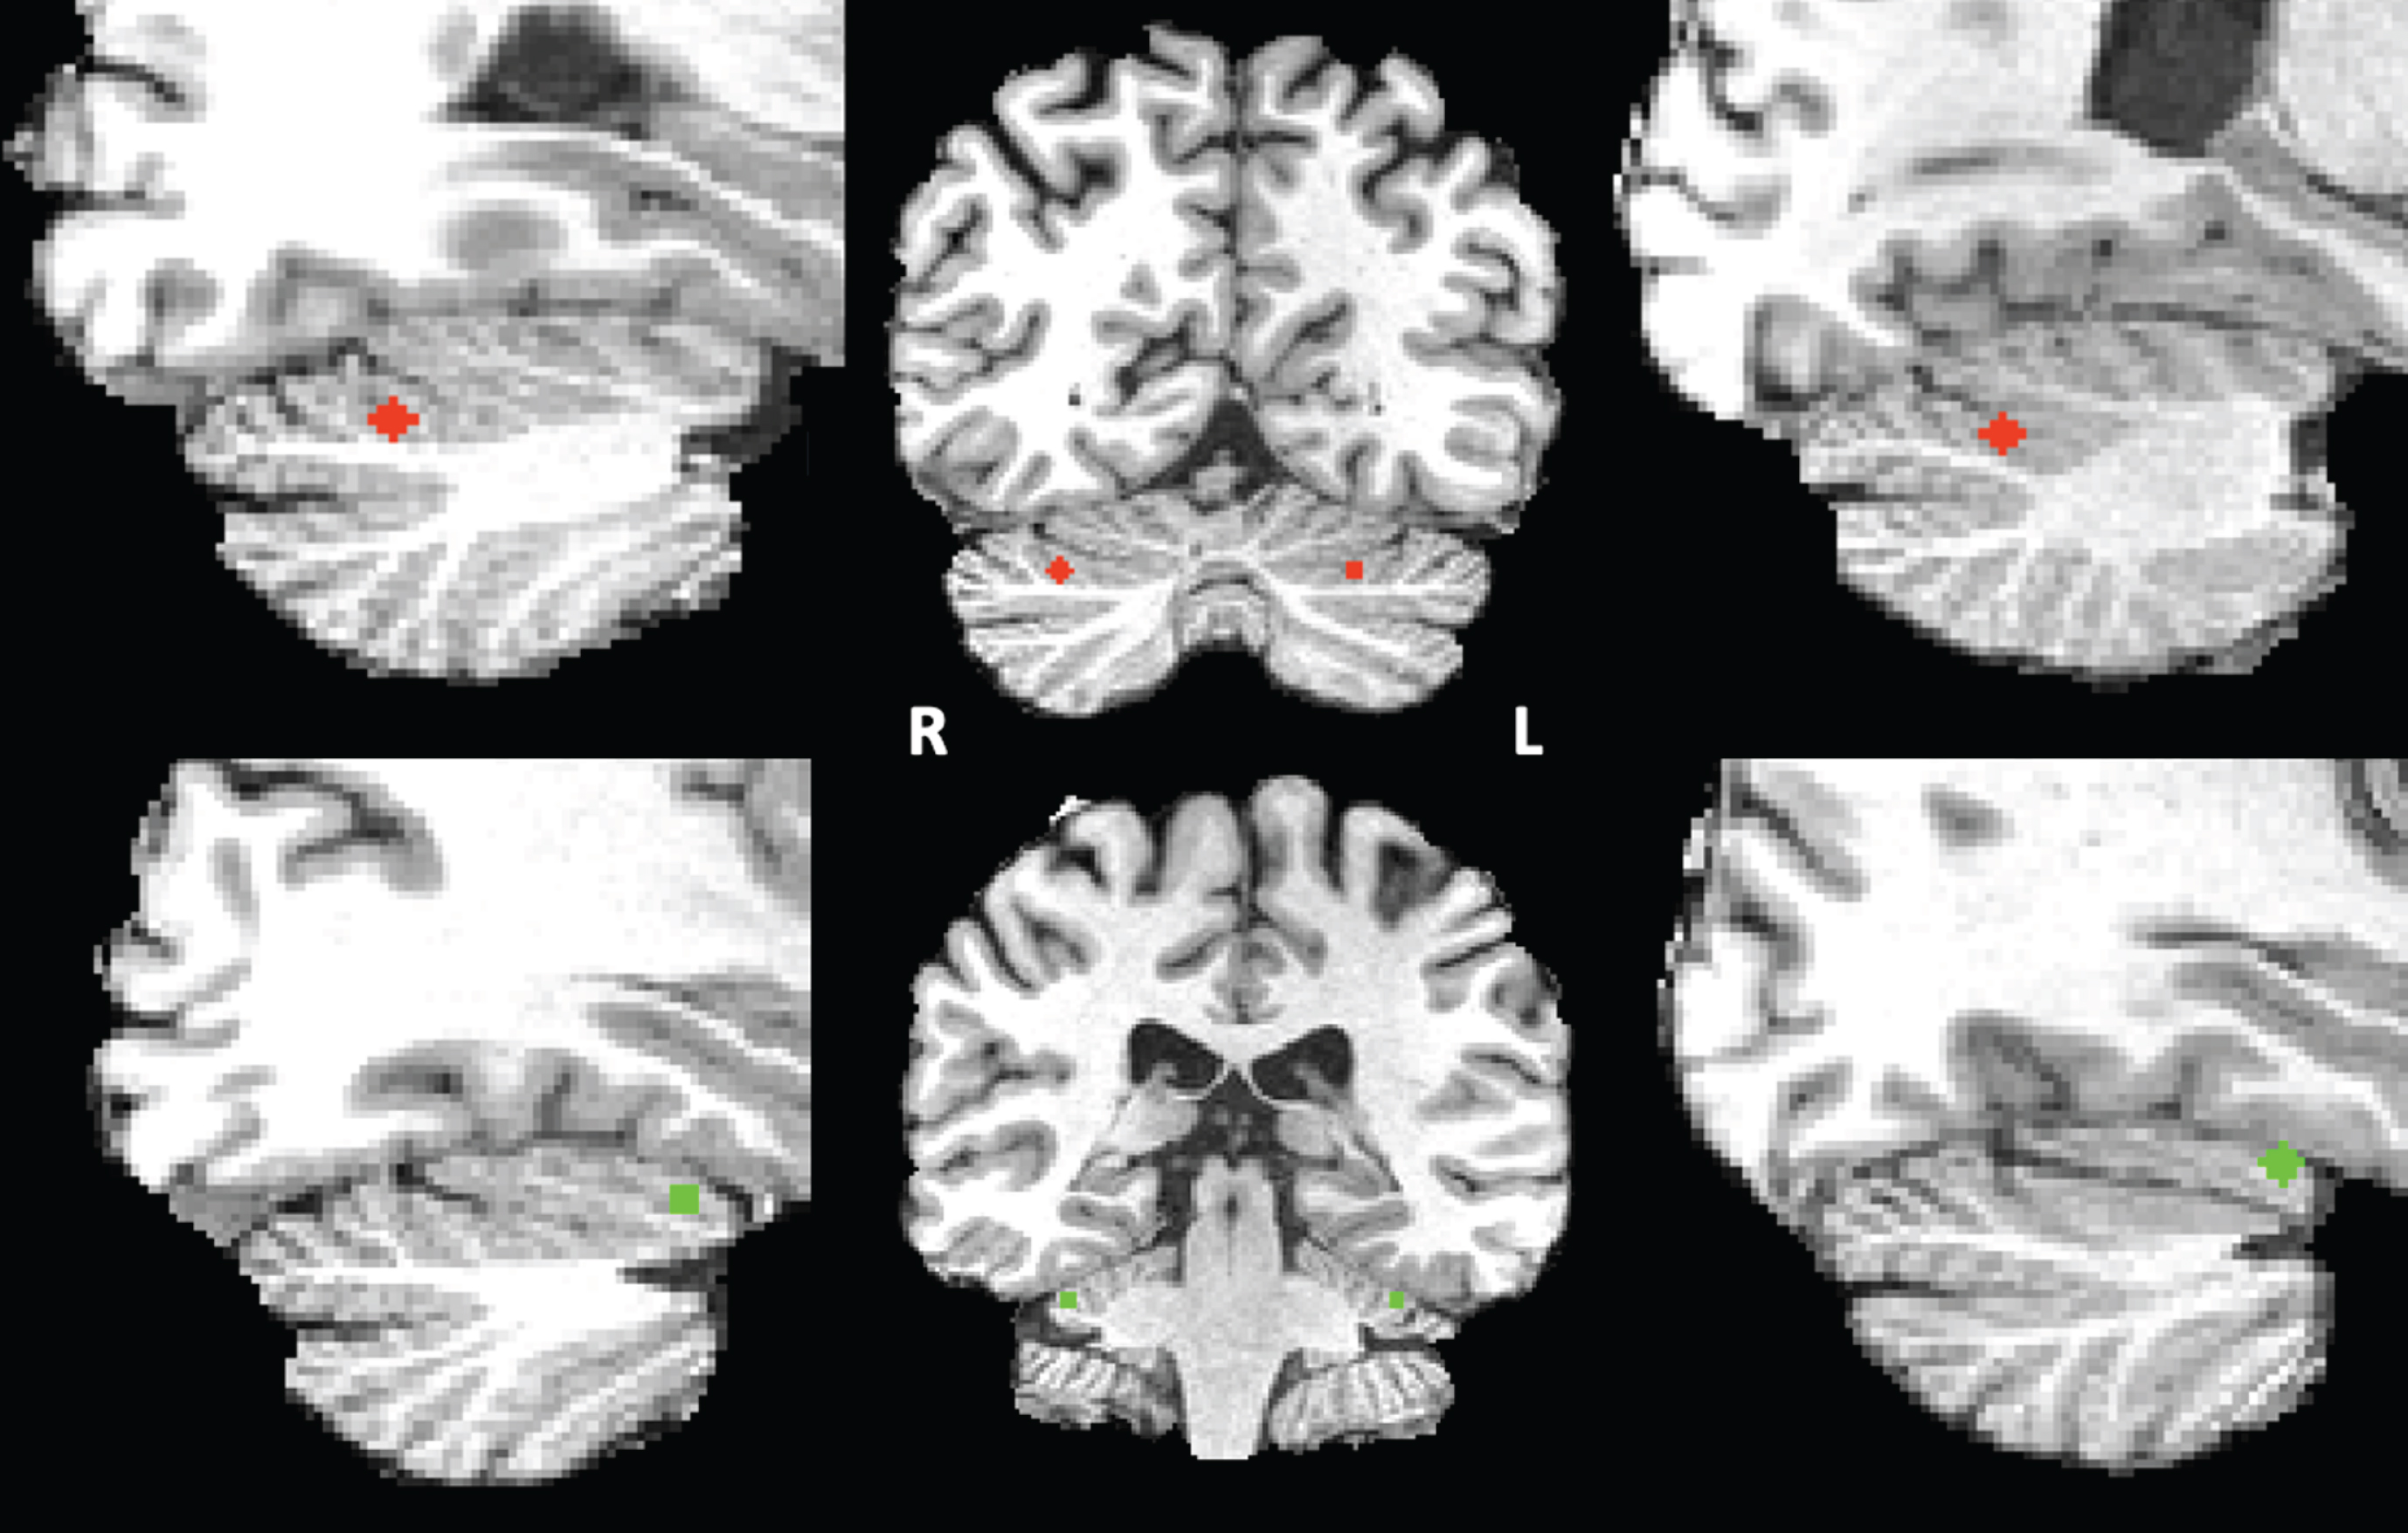
Seed definition of the cerebellar default mode and ventral attention network. For seed correlation analysis, we selected two networks based on Buckner’s “7 networks” atlas consisting of 7 left and 7 right cerebellar regions of interests (ROIs) estimated by their intrinsic functional connectivity [18]. As our network-of-interest we used the cerebellar default mode network seed and as control network we selected the ventral attention network (VAN). The VAN was chosen as it is a cognitive network involved in stimulus-driven attentional control [46]. In this atlas, the DMN consists mainly of the Crus I and the Crus II and the VAN consists of lobule VI. These bilateral DMN and VAN cerebellar ROIs were eroded to the smallest size possible after which their respective centers of gravity were derived. Each point was subsequently converted into a sphere with a diameter of 5 voxels, only including grey matter voxels, and a size of 93 voxels each within the Crus I and Crus II (DMN) or lobules VI (VAN) (see Fig. 1). The resulting spherical clusters were registered non-linearly to each individual’s anatomical data in BrainVoyager’s Talairach space by means of the associated T1 template using FLIRT and FNIRT from FSL version 5.0.4. These registrations were checked visually for anatomical accuracy. The resulting spherical clusters served as seed regions for either the DMN or VAN connectivity analysis.
Fig.1
Right and left cerebellar DMN (red) and VAN (green) seeds superimposed on the T1 images of one of the participants.
Mask of the cerebral default mode or ventral attention network. As our hypothesis was focused on cerebro-cerebral DMN interactions, we applied a mask for the cerebral DMN. In doing so, we assured that only voxels of the cerebral DMN were included. The cerebral DMN mask was created using the available and validated functional networks of Yeo et al. [47]. These functional resting-state network parcellations of Yeo et al. [47] were used as a reference for the creation of the cerebellar resting-state networks by [18] and therefore are topographically well-matched. The functional parcellation of this DMN was registered to the average of all individuals’ anatomical data using FLIRT and FNIRT. All statistical analyses were constrained to the voxels within this mask. For the control analyses involving the cerebellar VAN seed and cerebral VAN, a similar cerebral VAN mask was created employing the same method and applied during analyses.
Physiological denoising and functional connectivity analyses. Effects of variation unrelated to neural activity on the connectivity analyses were reduced by removing physiological nuisance variable from the resting state data via linear regression. These included time courses from the white matter and ventricles and the six motion parameters. Global signal regression was not included in the nuisance model, as it is known to introduce artefactual negative correlations between regions [48, 49].
After regressing out the nuisance variable, the residual time course files were used for further analyses. The functional connectivity maps, defined as the Pearson’s correlation coefficient r, between each seed and every cerebral DMN or VAN voxel were calculated for each participant. The individual r maps were z-transformed, normalized to Talairach space and fed into a random-effect General Linear Model with a two-group by two-seed design [50]. To statistically account for possible effects that could be explained by local structural differences or cortical atrophy, we added z-transformed total gray matter volume, normalized for intracranial volume as a covariate to the model [51]. Gray matter volume and intracranial volume were estimated using SIENAX [52], part of FSL version 5.0.4. The within and between-group analyses were restricted to the cerebral DMN (or VAN) mask.
The statistical maps were thresholded at a voxel-level threshold of p < 0.001, after which an empirical cluster size threshold was applied for multiple comparisons correction, using the cluster-level statistical threshold estimator plugin [43] with 1000 iterations (Monte Carlo simulations), and estimating the spatial smoothness from the source statistical map. Resulting voxel clusters of these simulations were thresholded at a 5% false positive rate, resulting in an empirical minimum cluster size of 405 mm3. Peak activations were extracted from all resulting clusters for every participant for further analyses using in-house matlab scripts (MathWorks, Natick, MA, USA). All clusters were labeled with an anatomic label using Talairach client 2.4.3 (http://www.talairach.org).
Statistical analysis of behavioral data
All statistical analyses were done using R 3.2.4 [53] (http://www.R-project.org/). Demographic and cognitive groups differences were investigated using two-sample t-test for continuous variables and a chi-square test for categorical variables.
Within each group, the relevance of the DMN or VAN functional connectivity differences for memory performance was investigated with partial Pearson correlations between functional connectivity measures and memory performance (WLT: total learning and delayed recall) and executive functioning (Stroop: interference score time in s [40]) while controlling for age as well as adjusted hippocampal volume using the ppcor package [54]. Subsequently hippocampal volume corrected for ICV was added to the model as covariate to investigate the independent effects of functional connectivity on memory performance or executive functioning. Correction for multiple comparisons was applied using the false discovery rate controlling procedure [55] with a significance threshold set at Q = 0.1.
RESULTS
Demographics and cognitive performance
The groups were successfully matched demonstrating no differences with respect to age and education (p > 0.05). There was no difference in prevalence of hypertension between the two groups (χ2 = 4.39, p = 0.11) or on the HDRS (t(34) = –1.75; p = 0.09) (see Table 1). As could be expected, the aMCI group demonstrated worse performance on several tests, including the MMSE (t(34) = 2.19; p = 0.04), the WLT total learning (t(34) = 3.91; p < 0.001), the WLT delayed recall (t(34) = 6.17; p < 0.001), the LDST (60 s) (t(34) = 2.43; p = 0.02), the CST (card 3) (t(34) = –2.22; p = 0.03), and verbal fluency (professions (t(34) = 2.63; p = 0.01); letter M (t(34) = 2.37; p = 0.02)).
Table 1
Characteristics of the aMCI patients and control participants
| Controls (n = 18) | aMCI (n = 18) | Group difference | ||
| mean (SD) | mean (SD) | t | p | |
| Age (y) | 64.56 (3.39) | 65.11 (4.52) | –0.42 | 0.68 |
| Education level | 6.61 (9.93) | 4.44 (2.55) | 0.90 | 0.38 |
| MMSE (score) | 28.89 (0.96) | 27.61 (2.28) | 2.19 | 0.04* |
| Total WLT (words) | 37.50 (7.60) | 26.06 (9.83) | 3.91 | <0.001*** |
| WLT- delayed recall (words) | 8.56 (1.89) | 3.67 (2.79) | 6.17 | <0.001*** |
| Stroop card 3 (in sec) | 108.14 (19.73) | 118.51 (45.75) | –0.88 | 0.38 |
| Stroop interference score (in sec) | 53.39(13.59) | 60.58(44.11) | –0.66 | 0.52 |
| LDST in 60 s (items) | 32.56 (5.94) | 26.72 (8.28) | 2.43 | 0.02* |
| CST card 3 (in sec) | 36.56 (13.12) | 49.04 (19.89) | –2.22 | 0.03* |
| Fluency animals (number) | 23.17 (5.33) | 21.39 (5.41) | 0.99 | 0.33 |
| Fluency professions (number) | 19.78 (4.28) | 15.28 (5.86) | 2.63 | 0.01** |
| Fluency letter M (number) | 15.83 (5.56) | 11.44 (5.58) | 2.37 | 0.02* |
| Hamilton depression rating scale (score) | 0.61 (1.24) | 1.56 (1.92) | –1.75 | 0.09 |
| Medial temporal lobe atrophy sum score | 1.11 (0.90) | 3.67 (0.97) | –8.19 | < 0.001*** |
| Left Hippocampal volume (%) | 0.31(0.03) | 0.29(0.04) | 2.12 | 0.04 |
| Right Hippocampal volume (%) | 0.32(0.05) | 0.28(0.05) | 2.25 | 0.03 |
| Left cerebellum volume (%) | 3.37(0.29) | 3.52(0.30) | –1.57 | 0.13 |
| Right cerebellum volume (%) | 3.45(0.30) | 3.54(0.28) | –0.87 | 0.39 |
Group differences were calculated with independent t-tests for the continuous variables and chi-square for categorical variables; Indication of the education level was given on an 8-point scale (range 1 = primary school to 8 = university); The hippocampal and cerebellar volumes reflect the volume/intracranial volume ratio.
The cerebellar DMN is negatively coupled with the cerebral DMN both within healthy controls and aMCI patients
All within group functional connectivity analyses revealed negative correlations between the cerebellar and cerebral DMN, with overall fewer clusters in the patient group compared to the control group (see Table 2). In contrast as expected the within group analyses for the VAN network revealed positive correlations between the cerebellar and cerebral VAN (see Table 3).
Table 2
Cerebellar-cerebral DMN connectivity patterns within the groups
| Region of interest | Hemisphere | Peak t | Talairach coordinates x;y;z | Size in voxels |
| Left cerebellar seed: Controls | ||||
| Superior Frontal Gyrus | R | –4.38 | 20; 20; 57 | 2204 |
| Middle Frontal Gyrus | R | –4.15 | 29; 23; 36 | 624 |
| Medial Frontal Gyrus | R | –5.58 | 8; 52; 3 | 9634 |
| Inferior Frontal Gyrus | R | –5.00 | 50; 19;9 | 3755 |
| Middle Temporal Gyrus | R | –6.27 | 62; –35; –3 | 9328 |
| Middle Temporal Gyrus | R | –5.16 | 56; –8; –5 | 3565 |
| Middle Frontal Gyrus | L | –4.56 | –25; 7; 45 | 1254 |
| Middle Frontal Gyrus | L | –4.66 | –40; 13; 33 | 1113 |
| Inferior Frontal Gyrus | L | –4.29 | –46; 31; 6 | 1020 |
| Superior Temporal Gyrus | L | –6.38 | –61; –44; 21 | 2487 |
| Superior Temporal Gyrus | L | –4.55 | –49; –2; –8 | 1033 |
| Superior Temporal Gyrus | L | –4.30 | –61; –26; 4 | 683 |
| Lingual Gyrus | L | –7.30 | –13; –50; 3 | 12986 |
| Left cerebellar seed: aMCI | ||||
| Inferior Frontal Gyrus | R | –4.08 | 43; 31; 9 | 673 |
| Inferior Frontal Gyrus | L | –4.98 | –55; 6; 18 | 5099 |
| Middle Temporal Gyrus | L | –4.07 | –40; –71; 18 | 960 |
| Middle Temporal Gyrus | L | –4.81 | –61; –50; 9 | 2267 |
| Middle Temporal Gyrus | L | –4.06 | –52; –41; 0 | 864 |
| Right cerebellar seed: Controls | ||||
| Superior Frontal Gyrus | R | –4.02 | 5; 49; 33 | 759 |
| Middle Frontal Gyrus | R | –5.28 | 27; 58; 12 | 719 |
| Middle Frontal Gyrus | R | –3.97 | 20; 19; 54 | 797 |
| Inferior Frontal Gyrus | R | –3.66 | 50; 15; 15 | 909 |
| Superior Temporal Gyrus | R | –4.96 | 41; –47; 19 | 3016 |
| Superior Temporal Gyrus | R | –4.53 | 44; –20; –3 | 917 |
| Middle Temporal Gyrus | R | –3.97 | 50; –2; –12 | 734 |
| Middle Temporal Gyrus | R | –5.41 | 37; –65; 21 | 1630 |
| Posterior Cingulate | R | –4.64 | 2; –14; 18 | 5544 |
| Middle Frontal Gyrus | L | –6.46 | –31; 58; 9 | 2677 |
| Inferior Frontal Gyrus | L | –4.58 | –43; 34; 4 | 2761 |
| Inferior Frontal Gyrus | L | –4.11 | –55; 26; 21 | 888 |
| Anterior Cingulate | L | –4.89 | –13; 34; 0 | 800 |
| Middle Temporal Gyrus | L | –3.81 | –40; –62; 15 | 980 |
| Inferior Parietal Lobule | L | –5.16 | –61; –44; 22 | 4246 |
| Right cerebellar seed: aMCI | ||||
| Inferior Frontal Gyrus | R | –4.48 | 44; 15; –3 | 1653 |
| Superior Temporal Gyrus | R | –4.31 | 44; –32; 0 | 706 |
| Inferior Frontal Gyrus | L | –4.11 | –40; 28; 7 | 2213 |
| Inferior Frontal Gyrus | L | –6.65 | –56; 10; 24 | 1963 |
| Middle Temporal Gyrus | L | –5.25 | –65; –50; 9 | 1067 |
Significant functional connectivity for Right or left cerebellar seed at p < 0.001.
Table 3
Cerebellar-cerebral VAN connectivity patterns within the groups
| Region of interest | Hemisphere | Peak t | Talairach coordinates x;y;z | Size in voxels |
| Left cerebellar seed: Controls | ||||
| Insula | R | 12.09 | 47; –29; 24 | 15584 |
| Middle Frontal Gyrus | R | 12.09 | 38; –4; 54 | 4214 |
| Precentral Gyrus | R | 10.33 | 47; –6; 9 | 18229 |
| Middle Frontal Gyrus | R | 11.77 | 33; 37; 24 | 4221 |
| Cingulate Gyrus | R | 16.34 | 8; –38; 39 | 41800 |
| Middle Frontal Gyrus | L | 9.52 | –31; 40; 33 | 6364 |
| Insula | L | 11.72 | –40; –17; 6 | 20143 |
| Postcentral Gyrus | L | 6.58 | –46; –48; 51 | 1242 |
| Postcentral Gyrus | L | 11.82 | –61; –26; 21 | 14316 |
| Left cerebellar seed: aMCI | ||||
| Middle Temporal Gyrus | R | 9.82 | 52; –53; 0 | 15666 |
| Precentral Gyrus | R | 7.57 | 43; –2; 36 | 4208 |
| Precentral Gyrus | R | 7.02 | 53; –5; 6 | 18264 |
| Superior Frontal Gyrus | R | 7.37 | 22; 46; 33 | 3760 |
| Precuneus | L | 12.77 | –14; –56; 45 | 40910 |
| Middle Frontal Gyrus | L | 6.13 | –34; 31; 36 | 5062 |
| Superior Temporal Gyrus | L | 10.26 | –55; –9; 9 | 18975 |
| Precentral Gyrus | L | 6.85 | –39; –11; 45 | 1242 |
| Superior Temporal Gyrus | L | 11.81 | –58; –38; 21 | 14320 |
| Right cerebellar seed: Controls | ||||
| Insula | R | 16.39 | 47; –29; 21 | 15556 |
| Middle Frontal Gyrus | R | 11.47 | 38; –4; 54 | 4214 |
| Precentral Gyrus | R | 9.47 | 50; –5; 9 | 16613 |
| Middle Frontal Gyrus | R | 11.98 | 32; 38; 24 | 4186 |
| Cingulate Gyrus | R | 17.80 | 5; –35; 39 | 41533 |
| Middle Frontal Gyrus | L | 11.36 | –34; 40; 33 | 6395 |
| Superior Temporal Gyrus | L | 11.35 | –55; 8; 3 | 19725 |
| Precentral Gyrus | L | 10.14 | –46; –5; 48 | 1242 |
| Inferior Parietal Lobule | L | 13.70 | –61; –22; 24 | 14237 |
| Right cerebellar seed: aMCI | ||||
| Middle Temporal Gyrus | R | 9.47 | 56; –53; 9 | 15659 |
| Precentral Gyrus | R | 7.50 | 41; –8; 42 | 4208 |
| Precentral Gyrus | R | 6.79 | 50; –2; 9 | 16865 |
| Superior Frontal Gyrus | R | 7.80 | 22; 46; 33 | 3429 |
| Cingulate Gyrus | L | 15.63 | –13; –44; 42 | 40626 |
| Middle Frontal Gyrus | L | 7.52 | –38; 31; 30 | 5534 |
| Superior Temporal Gyrus | L | 10.96 | –55; –9; 9 | 19268 |
| Precentral Gyrus | L | 6.30 | –43; –8; 48 | 1242 |
| Superior Temporal Gyrus | L | 10.82 | –58; –38; 21 | 14281 |
Significant functional connectivity for Right or left cerebellar seed at p < 0.001.
Within the healthy control group, negative functional connectivity was observed between the left cerebellar DMN seed and right and left regions in the cerebral DMN, including areas in the frontal lobe, temporal lobe, and parietal lobe. For our control network, the control group demonstrated positive functional connectivity between both the left and right cerebellar VAN seed and the left and right regions in the cerebral VAN, including areas in the frontal, temporal, and parietal lobe.
Within the group of aMCI patients negative functional connectivity was demonstrated between the left cerebellar DMN seed and the frontal lobe. Furthermore, negative functional connectivity was demonstrated between the left cerebellar DMN seed and areas in the left frontal and temporal lobe. Finally, the right cerebellar DMN seed showed negative functional connectivity with areas in the right and left frontal and temporal lobes. Within the group of aMCI patients our control network demonstrated positive functional connectivity between both the left and right cerebellar VAN seed and the left and right regions of the cerebral VAN, including frontal, temporal, and parietal lobe.
Lower anti-correlations in aMCI patients compared to healthy controls
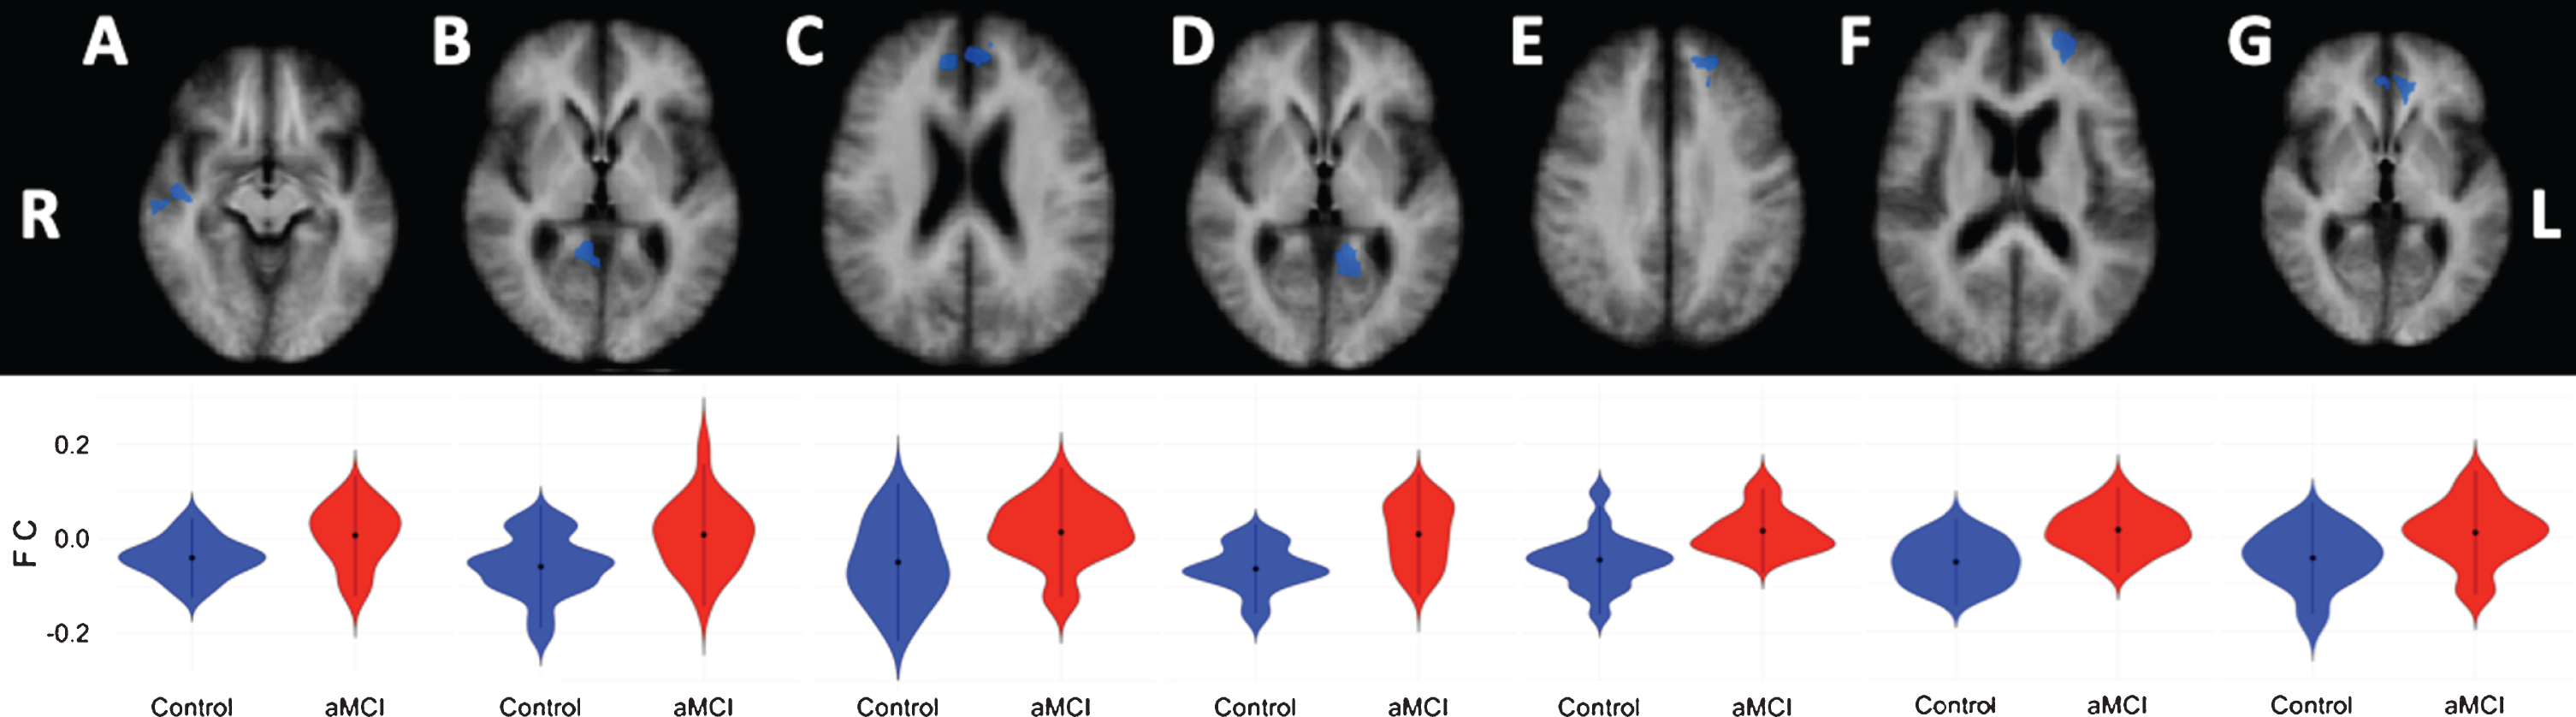
Compared to the healthy controls, aMCI patients showed lower negative correlations (anti-correlations) between the left cerebellar DMN seed and the right cerebral superior temporal gyrus (extending into the insula), and medial frontal gyrus (extending into the anterior cingulate cortex), as well as for the right parahippocampal gyrus (extending into the posterior cingulate cortex (PCC) and precuneus). Furthermore, lower anti-correlation was observed between the left cerebellar DMN seed and the left cerebral medial frontal gyrus, middle frontal gyrus (extending into the anterior cingulate cortex), and parahippocampal gyrus (extending into the PCC) in aMCI patients compared to healthy controls (see Table 4 and Fig. 2). For the right cerebellar seed, the aMCI patients showed lower negative correlations to the left anterior cingulate cortex (see Table 4 and Fig. 2).
Table 4
DMN Cerebellar-cerebral connectivity differences between the groups
| Region of interest | Hemisphere | Peak t | Talairach coordinates x;y;z | Size in voxels |
| Left cerebellar seed: controls > aMCI | ||||
| Medial Frontal Gyrus | R | –4.80 | 8; 46; 18 | 1883 |
| Superior Temporal Gyrus | R | –5.76 | 47; –11; –2 | 691 |
| Parahippocampal Gyrus | R | –3.67 | 11; –46; 6 | 2385 |
| Middle Frontal Gyrus | L | –4.44 | –22; 52; 15 | 933 |
| Medial Frontal Gyrus | L | –3.71 | –13; 43; 30 | 698 |
| Parahippocampal Gyrus | L | –6.91 | –14; –47; 3 | 961 |
| Right cerebellar seed: controls > aMCI | ||||
| Anterior Cingulate | L | –3.67 | –4; 37; 0 | 659 |
Significant difference in functional connectivity between groups at p < 0.001.
Fig.2
Cortical DMN-clusters showing significant anti-correlations with the left cerebellar DMN seed. A) Superior temporal gyrus; B) Parahippocampal gyrus; C) Medial frontal gyrus; D) Parahippocampal gyrus; E) Medial frontal gyrus; F) Middle frontal gyrus. Cortical DMN-cluster showing significant anti-correlation with right cerebellar DMN seed. G) Anterior cingulate. R, right; L, left. Lower halve shows violin plots corresponding to the distribution of the functional connectivity within the clusters, blue = controls, red = aMCI.
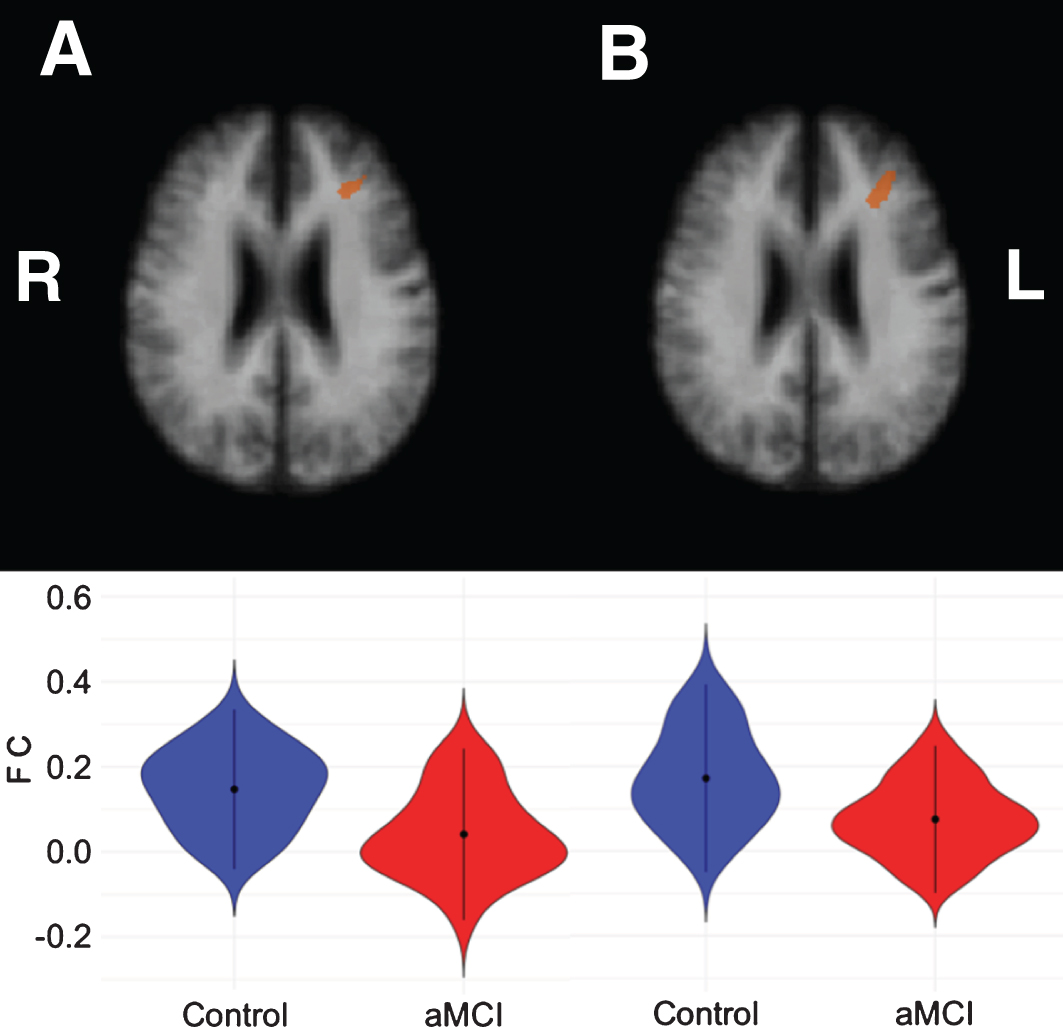
For the control cerebellar VAN seeds, aMCI patients showed lower correlations for both the left and right seed with the left middle frontal gyrus (see Table 5 and Fig. 3).
Table 5
VAN Cerebellar-cerebral connectivity differences between the groups
| Region of interest | Hemisphere | Peak t | Talairach coordinates x;y;z | Size in voxels |
| Left cerebellar seed: controls > aMCI | ||||
| Middle Frontal Gyrus | L | 3.51 | –29; 31; 24 | 525 |
| Right cerebellar seed: controls > aMCI | ||||
| Middle Frontal Gyrus | L | 3.40 | –29; 31; 24 | 560 |
Significant difference in functional connectivity between groups at p < 0.001.
Fig.3
Left middle frontal clusters showing significant correlations with the left cerebellar VAN seed (A) and right cerebellar VAN seed (B), respectively. The bottom row shows violin plots corresponding to the distribution of the functional connectivity within the clusters for each group, blue = controls, red = aMCI.
Relevance of cerebro-cerebellar DMN connectivity to memory performance
After multiple comparison correction, we observed within the aMCI group significant correlations between higher memory scores and stronger negative functional connectivity values between the left cerebellar seed and right medial frontal gyrus (Learning: r = –0.534, p = 0.027), left middle frontal gyrus (learning: r = –0.557, p = 0.020), and left parahippocampal gyrus (delayed recall: r = –0.597, p = 0.011). In contrast, no significant correlations between memory performance and cerebellar-cerebral functional connectivity were found for the control group or for the right cerebellar seed.
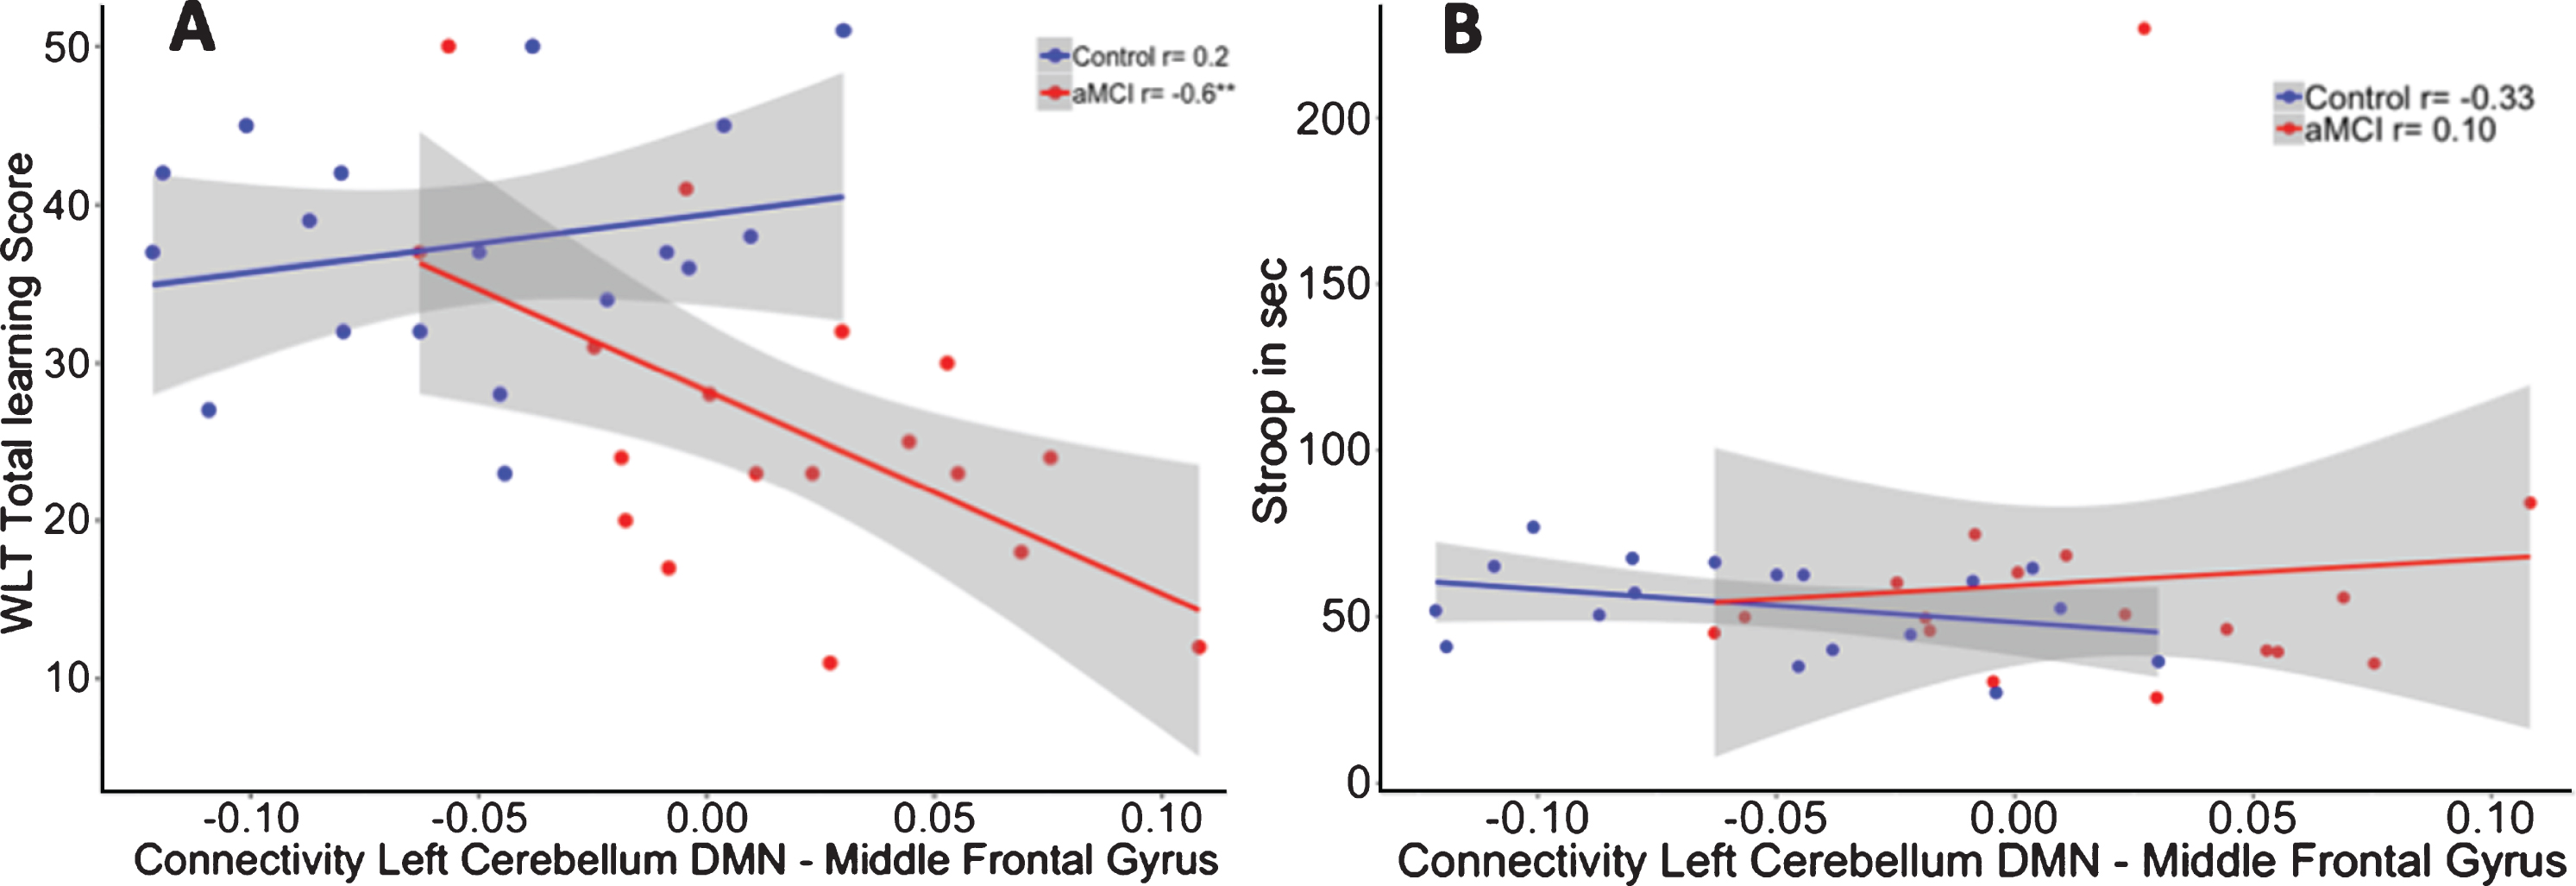
To investigate whether these correlations were different between the two groups, we performed a linear regression analysis including the interaction term “group by functional connectivity” on memory performance while controlling for age. The interaction for the functional connectivity between the left cerebellar seed and left middle frontal gyrus interaction showed significant group differences between both groups in memory performance (R2adj = 0.42). The model showed that in aMCI patients, and not in controls, positive correlations between the left cerebellar DMN and left middle frontal gyrus were associated with worse scores on the WLT (β= –156.77, p = 0.02) (see Fig. 4A). Accounting for the contribution of hippocampal volume revealed no effect of hippocampal volume (β= –7.15, p = 0.70) on memory performance, while the group by functional connectivity interaction remained significant (β= –156.57, p = 0.02; R2adj = 0.40).
Fig.4
A) Correlation between functional connectivity between the left cerebellum DMN and Middle Frontal Gyrus and performance on the WLT total learning for healthy controls (blue) and aMCI patients (red). In the aMCI group, positive correlations between the cerebellar DMN and middle frontal gyrus were associated with worse memory performance. This association was not observed in the healthy controls. **p < 0.01. B) No association was found between functional connectivity between the left cerebellum DMN and middle frontal gyrus and performance on the Stroop total learning for healthy controls (blue) and aMCI patients (red).
Specificity of cerebro-cerebellar DMN connectivity to memory performance
No significant group by DMN connectivity interaction effect was shown (β= 343.05, p = 0.23) on executive performance (R2adj = –0.08; see Fig. 4B).
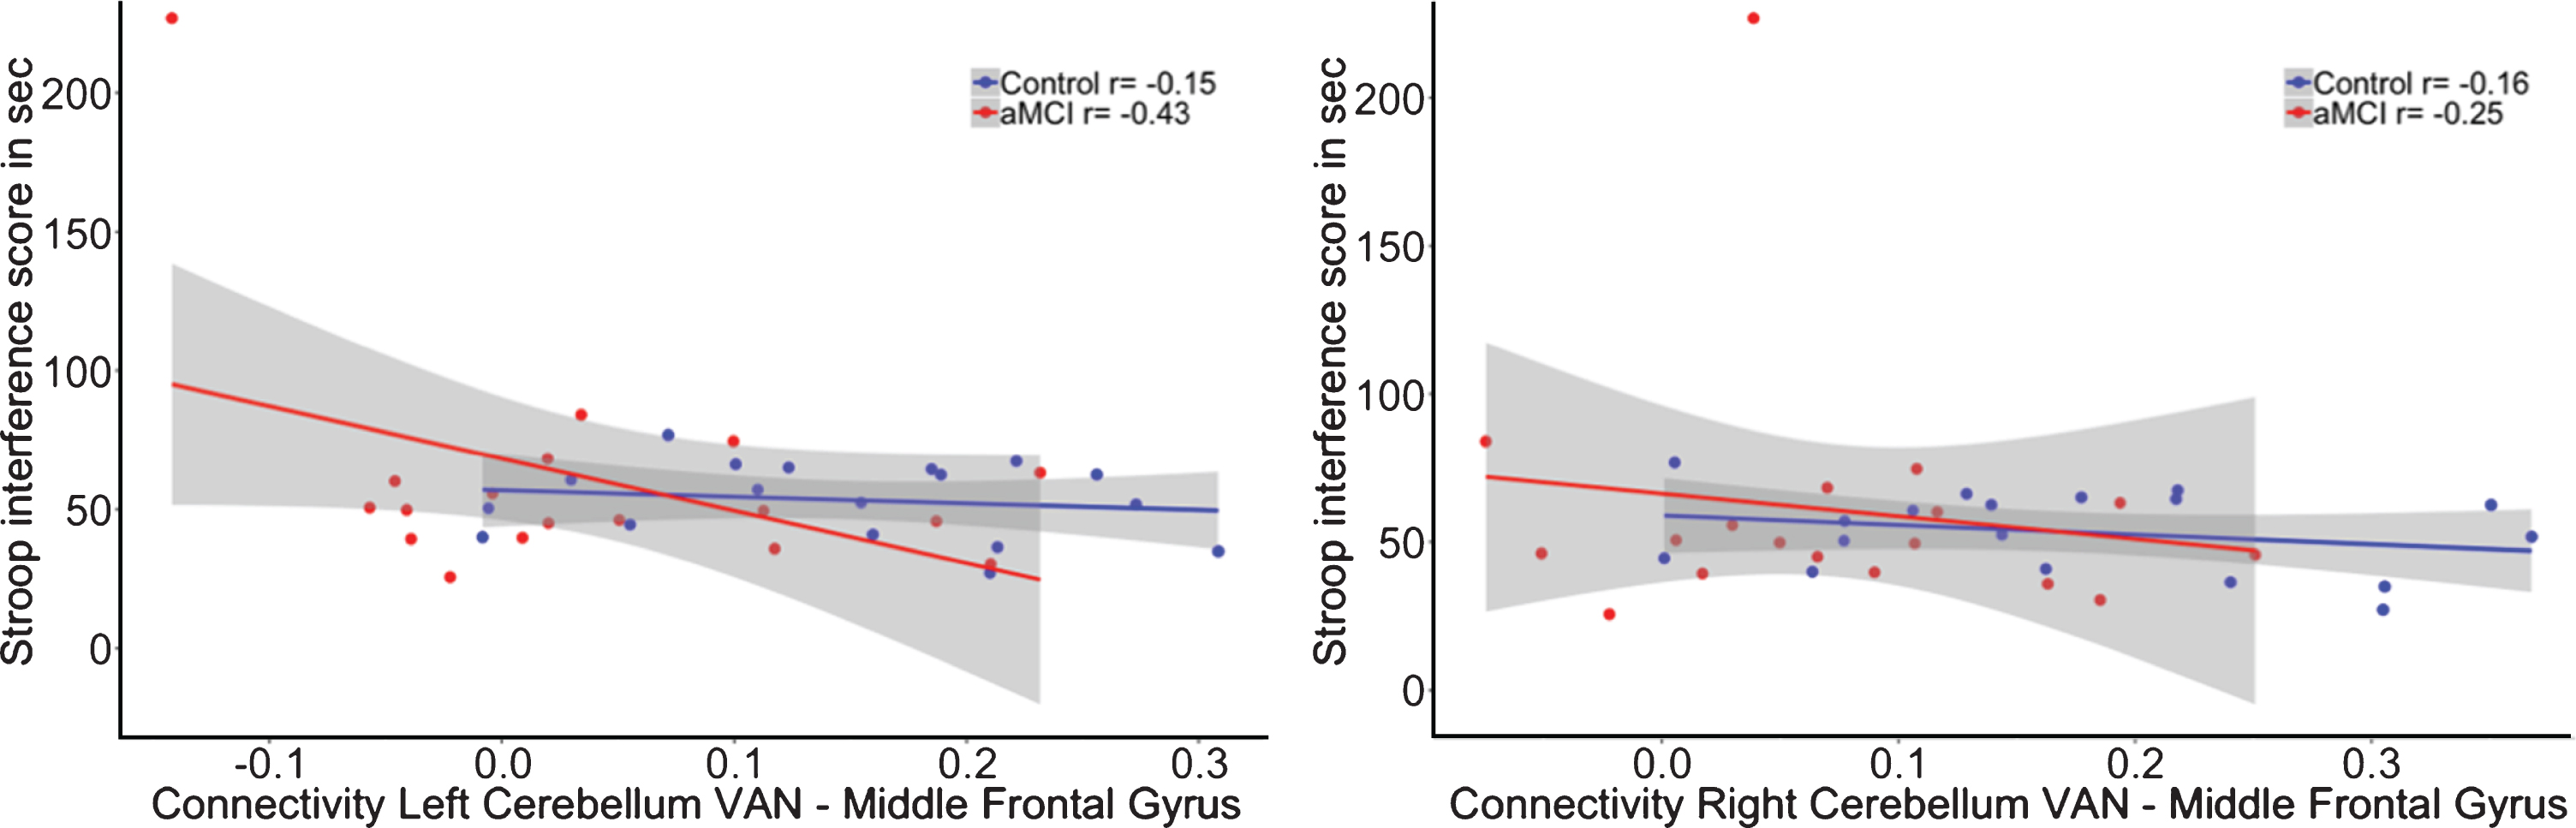
The interaction for the group by functional connectivity between the left cerebellar VAN seed (β= 28.45, p = 0.37; R2adj = 0.25) as well as the right cerebellar VAN seed (β= 22.33, p = 0.50; R2adj = 0.24) with the left middle frontal gyrus showed no significant relationship with memory performance (see Fig. 5). In addition, there was also no significant interaction for the cerebro-cerebellar VAN connectivity on executive functioning (Left: β= –131.95, p = 0.29; R2adj = 0.25; Right: β= –63.41, p = 0.63; R2adj = 0.24; see Fig. 6).
Fig.5
Correlation between functional connectivity between the right cerebellum VAN and middle frontal gyrus and performance on the WLT total learning for healthy controls (blue) and aMCI patients (red). No significant interaction was observed between the cerebellar VAN and middle frontal gyrus on memory performance.
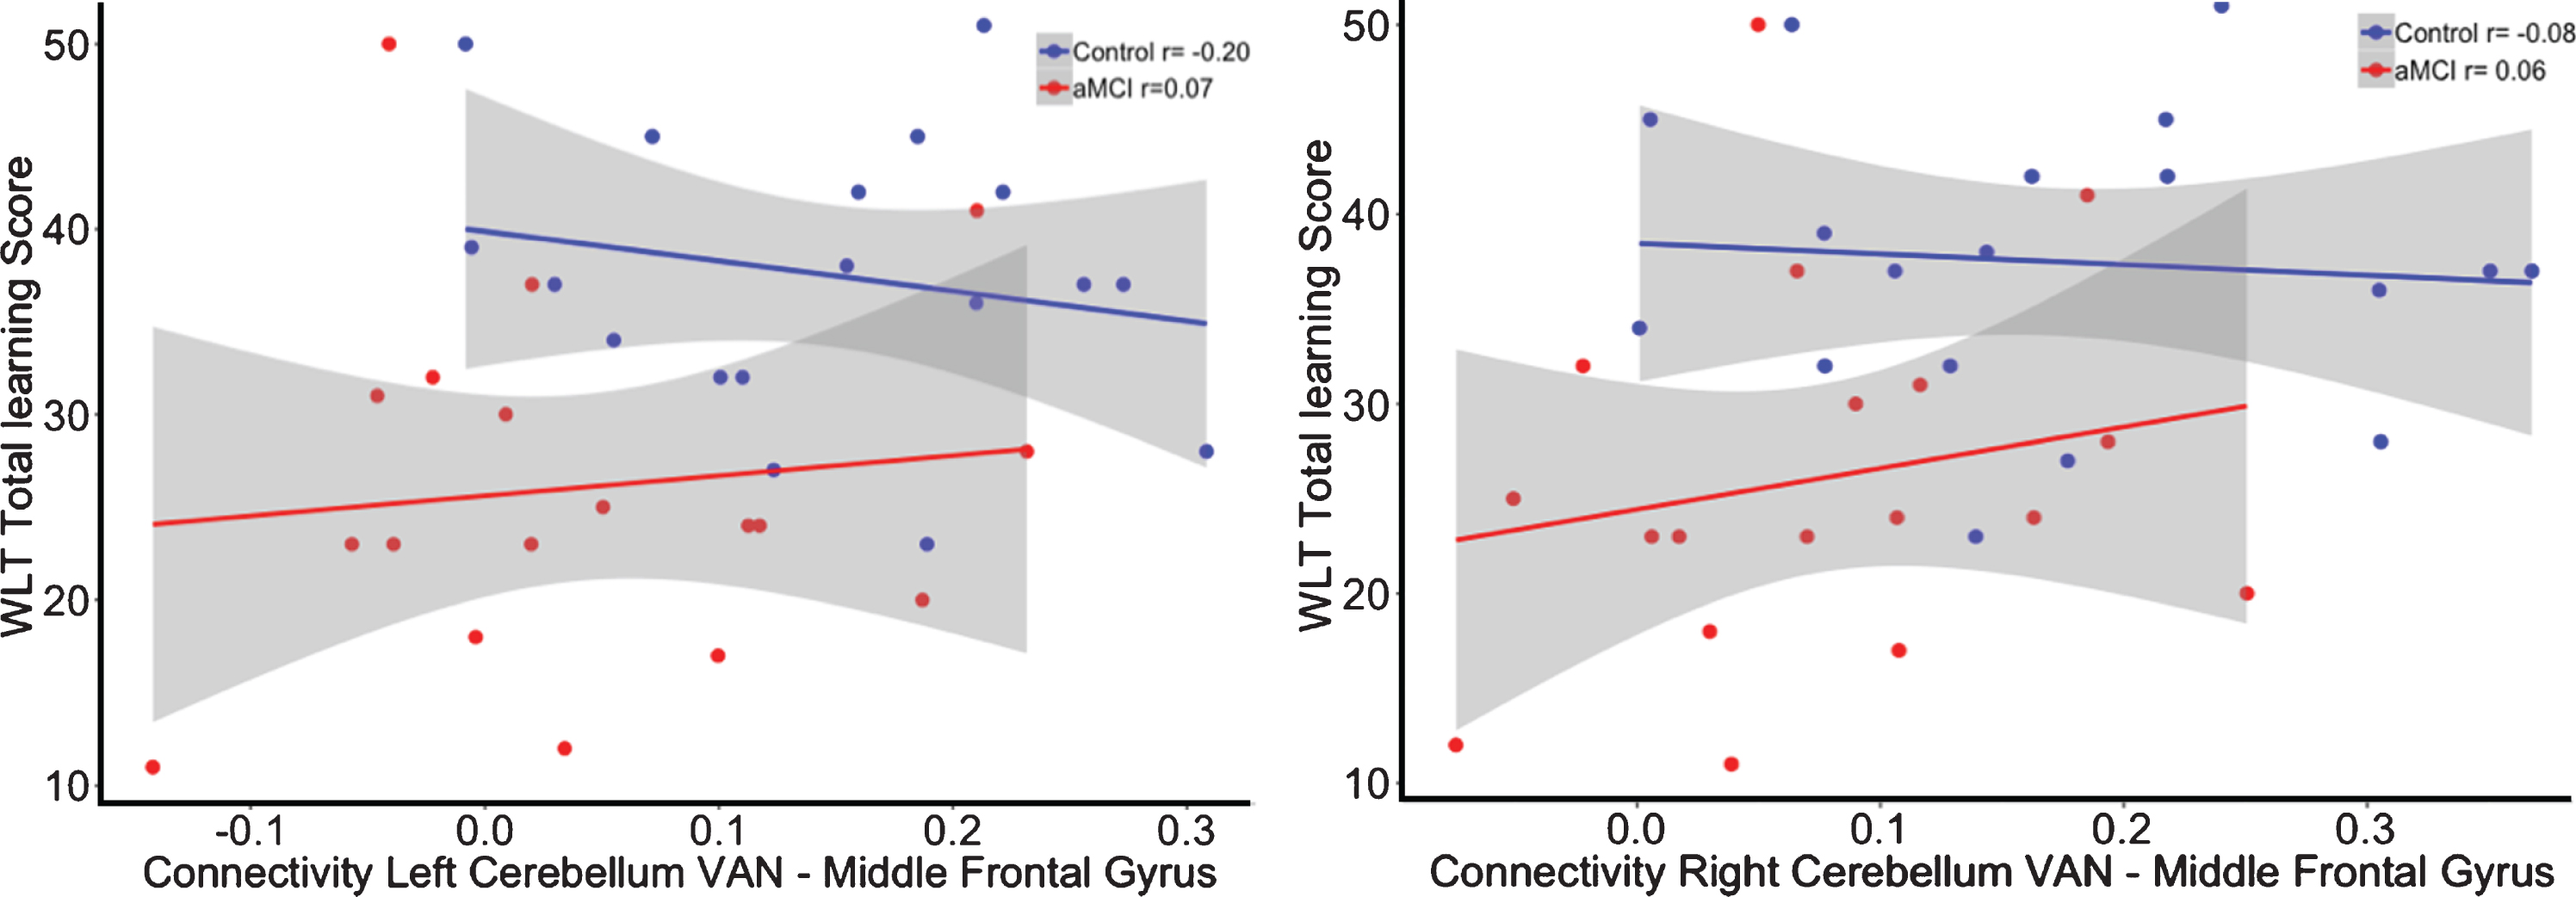
Fig.6
Correlation between functional connectivity between the right cerebellum VAN and middle frontal gyrus and performance on the WLT total learning for healthy controls (blue) and aMCI patients (red). No significant interaction was observed between the cerebellar VAN and middle frontal gyrus on memory performance.
DISCUSSION
The aim of this study was to investigate differences in the interaction between the cerebellar and cerebral DMN between healthy older individuals and patients with aMCI and whether these functional connectivity patterns are relevant for memory functioning. Previous studies have established that the cerebellum plays a modulatory role in cognition and that the intrinsic networks of the cerebrum can be mapped onto regions of the cerebellum, which are specifically targeted by neurodegenerative processes in AD and possibly MCI [18, 47]. Our results extend these observations with two novel findings: 1) during rest, the cerebellar DMN is negatively coupled to the cerebral DMN, and this anti-correlation is reduced in aMCI patients compared to controls; 2) these anti-correlations were associated with optimal memory performance, as lower memory performance correlates negatively with cerebellar-cerebral functional connectivity in the aMCI group. These findings show that DMN alterations extend beyond the cerebrum in early dementia, but importantly also carry clinical relevance.
The finding of negative correlations between the cerebellar and the cerebral DMN areas occurring in both groups suggests that these patterns might be inherent to older individuals. However, whether these anti-correlations are also observed in younger age groups, remains to be investigated. To the best of our knowledge, only four studies so far have investigated cerebellar resting-state functional connectivity in the context of aMCI or aging. All these studies reported both increased and decreased functional connectivity in patients compared to controls. However, these inconsistencies may be due to anatomic heterogeneity as their focus was not specifically on the cerebellar DMN, but rather on a large area of the cerebellum covering sensorimotor and cognition functions or lobule IX [24–26]. Earlier study by Zheng et al. [56] specifically compared an AD patient group with healthy controls, and demonstrated decreased functional connectivity between the cerebellum and various cortical networks including the DMN. Crucially, this study examined patients with end stage AD, a stage at which amyloid pathology may have propagated to the cerebellum and thus impact cerebellar connectivity. In contrast, our study investigated aMCI patients, a stage at which amyloid pathology is thought to have not yet spread outside the cerebral regions, and was therefore able to show that in an early phase of the disease loss of cerebellar-cerebral anti-correlations is already present and is detrimental for memory performance. Interestingly, Steininger et al. [57] showed in a group of cognitively healthy older adults that changes in functional connectivity of cerebellar DMN network is not dependent on amyloid deposition, but reported similar to our results, negative correlations with the limbic, medial temporal, and frontal areas, suggesting that cerebro-cerebellar anti-correlations between DMN regions could be a phenomenon typical for older individuals. It remains to be investigated if these anti-correlations will be observed in other cerebro-cerebellar networks, as well as younger age groups. In addition, Steininger et al. [57] also reported positive correlations between the cerebellar DMN and temporal, parietal, and occipital clusters, but the cerebral areas did not overlap with DMN areas in our study, and thus also not with the template from Yeo et al. [47], suggesting that the cerebro-cerebellar interactions in aging may behave differently within other intrinsic networks.
Negative correlations or anti-correlations in the DMN are a topic of debate, and therefore we opted to not apply global signal regression, as this could possibly induce mathematically generated anti-correlations [49, 58]. The observed diminished anti-correlations in the aMCI group are in accordance with findings that decreased DMN connectivity anti-correlation have been detected in healthy aging [59, 60], and in neurodegenerative disorders such as AD [61, 62]. Efficient anti-correlation of the task-negative DMN with the task-positive network has been suggested to be important for cognitive functioning in a healthy population [61, 63–65]. Our findings have extended these observations in the sense that anti-correlations also seem to occur between cerebellar and cerebral areas of the same functional network.
In addition, our results suggest specificity of the cerebral-cerebellar functional connectivity differences of the DMN for memory dysfunction in aMCI patients. In contrast to the DMN, the cerebral-cerebellar functional connectivity differences from our control seeds in the cerebellar VAN were not related to memory functioning, even though the aMCI group exhibited lower functional connectivity between the cerebellar VAN and the middle frontal gyrus compared to the control group. While static functional connectivity does not provide information on directionality and we cannot preclude top-down influences, we carefully speculate that these anti-correlations between the cerebellar and cerebrum DMN areas may be necessary for bottom-up regulations for higher order cognitive functions by keeping the functioning of the DMN in balance and thereby fine-tuning our behavior and cognitive performance. The cerebellum could aid in the accurate switching between default mode and task related attention networks. The ability to switch between modes is known to be affected in AD resulting in aberrant DMN activity [66]. The effects of bottom-up influences of the cerebellum were corroborated in animal research by showing that by enhancing bottom-up cerebellar connections to the cortex, cortical plasticity was promoted resulting in reparative reorganization after brain injury [67]. Additionally, bottom-up influences of the cerebellum have been associated with high-level goal-oriented behavior in rats during spatial navigation tasks. Specifically, by fine-tuning the memory integration of spatial locations thereby heightening the accuracy of hippocampal spatial codes [68]. Furthermore, human studies demonstrated that the balance between cortical and cerebellar activation is important for fine-tuning attentional strategies. Successfully coping with a high load on attentional recourses was associated with increased cerebellar recruitment coupled to lower cortical activity in high educated participants [69]. Further support for this hypothesis is found in our cognitive-imaging correlations that showed that negative connectivity between the cerebellum DMN and cerebral DMN is associated with better memory performance, whereas positive coupling was associated with worse memory performance in aMCI patients. This suggests that strong and intact cerebellar-cortical anti-correlations are beneficial for performance on memory tasks [59, 68, 70].
Notably, the relationship with memory performance was observed for cerebellar DMN connectivity with the middle frontal DMN regions. This is to the best of our knowledge the first study showing that the cerebellum plays a role in declarative memory deficits in aMCI patients and that this effect was independent of hippocampal volume. In line with previous literature our results do not show a significant difference in cerebellar volume between healthy individuals and aMCI patients [71, 72]. Recent work suggested that the Crus I would show atrophy late in the disease process [73] leaving us to speculate that functional connectivity changes of the cerebellar-cerebral DMN precede atrophy of the cerebellar DMN region. Since the association with memory was only observed for the frontal region and not the medial temporal regions and no association was shown with executive functioning, we propose—in keeping with the dysmetria of thought hypothesis [74, 75]—that the cerebellum has a modulating role on the executive components of memory performance. Specifically, our results support the executive working memory disturbances seen in patients with cerebellar lesions that the cerebellar frontal connectivity is important in regulating the retention of information thereby aiding memory capacity [75]. In addition to its known involvement in other cognitive operations such as timing, prediction, and integrating information for learning [1].
There are a number of limitations to our study. First, our study included a relatively small sample size of 36 male only participants in total. However, we were able to show differences in functional connectivity between aMCI patients and healthy controls and relate it to memory functioning. To further investigate how the cerebellar-cerebral functional connectivity supports memory performance in the general population, future studies should examine larger populations including both males and females. Additionally, including larger groups would open up the possibility to perform structured mediation analyses to test directly whether executive functioning or processing speed mediates the relation between cerebro-cerebellar functional connectivity and memory performance. Second, as we did not collect amyloid or tau burden on these individuals, we cannot rule out that some of our cognitively normal participants are in a preclinical AD stage and cannot fully guarantee that the cognitive impairment in the aMCI group was due to AD pathology. Additionally, future availability of longitudinal pathological information could have provided additional information about the changes in AD progression over time. Recent work by Schultz et al. [76] showed that hyper-connectivity was associated with the presence of amyloid, while hypo-connectivity was determined by the presence of both amyloid and tau pathology. The authors suggested this pattern of hyper- and hypo-connectivity to be consecutive phases in prodromal AD. Future research could investigate how patterns of cerebro-cerebellar connectivity differ depending on the amount of both neuropathological protein accumulations. In addition, future studies including larger groups as well as pathological information could explore specific volumetric changes of the Crus I and II in these groups. Lastly, the current study did not use the SUIT toolbox to parcellate the cerebellum we invite future studies to replicate the current findings using the SUIT toolbox [77].
Overall, our results suggest that healthy cognitive aging is supported by intact cerebellar-cerebral anti-correlations and that deterioration of these functional connections in MCI is associated with worse memory performance. Crucially, these findings suggest that the modulatory role of the cerebellum on cognitive functioning has relevance to memory performance and to neurodegenerative diseases involving memory deficits.
ACKNOWLEDGMENTS
We want to thank Lies Clerx and Carmen Echavarri for the manual segmentations of the hippocampal volumes.
Acquisition of the data was funded by pilot grant No 12557 of the Internationale Stichting voor Alzheimer Onderzoek (Heidi I.L. Jacobs).
Authors’ disclosures available online (https://www.j-alz.com/manuscript-disclosures/19-1127r2).
REFERENCES
[1] | Jacobs HI , Hopkins DA , Mayrhofer HC , Bruner E , van Leeuwen FW , Raaijmakers W , Schmahmann JD ((2017) ) The cerebellum in Alzheimer’s disease: Evaluating its role in cognitive decline. Brain 141: , 37–47. |
[2] | Leiner HC ((2010) ) Solving the mystery of the human cerebellum. Neuropsychol Rev 20: , 229–235. |
[3] | Schmahmann JD , Sherman JC ((1998) ) The cerebellar cognitive affective syndrome. Brain 121: , 561–579. |
[4] | Schmahmann JD , Weilburg JB , Sherman JC ((2007) ) The neuropsychiatry of the cerebellum - insights from the clinic. Cerebellum 6: , 254–267. |
[5] | Middleton FA , Strick PL ((1994) ) Anatomical evidence for cerebellar and basal ganglia involvement in higher cognitive function. Science 266: , 458–461. |
[6] | Schmahmann JD , Pandya DN ((1995) ) Prefrontal cortex projections to the basilar pons in rhesus monkey: Implications for the cerebellar contribution to higher function. Neurosci Lett 199: , 175–178. |
[7] | Middleton FA , Strick PL ((2001) ) Cerebellar projections to the prefrontal cortex of the primate. J Neurosci 21: , 700–712. |
[8] | Heath RG , Harper JW ((1974) ) Ascending projections of the cerebellar fastigial nucleus to the hippocampus, amygdala, and other temporal lobe sites: Evoked potential and histological studies in monkeys and cats. Exp Neurol 45: , 268–287. |
[9] | Schmahmann JD , Pandyat DN ((1997) ) The cerebrocerebellar system. Int Rev Neurobiol 41: , 31–60. |
[10] | Balsters JH , Laird AR , Fox PT , Eickhoff SB ((2014) ) Bridging the gap between functional and anatomical features of cortico-cerebellar circuits using meta-analytic connectivity modeling. Hum Brain Mapp 35: , 3152–3169. |
[11] | Habas C , Kamdar N , Nguyen D , Prater K , Beckmann CF , Menon V , Greicius MD ((2009) ) Distinct cerebellar contributions to intrinsic connectivity networks. J Neurosci 29: , 8586–8594. |
[12] | Schmahmann JD ((1996) ) From movement to thought: Anatomic substrates of the cerebellar contribution to cognitive processing. Hum Brain Mapp 4: , 174–198. |
[13] | Schmahmann JD ((2004) ) Disorders of the cerebellum: Ataxia, dysmetria of thought, and the cerebellar cognitive affective syndrome. J Neuropsychiatry Clin Neurosci 16: , 367–378. |
[14] | Stoodley CJ ((2012) ) The cerebellum and cognition: Evidence from functional imaging studies. Cerebellum 11: , 352–365. |
[15] | Stoodley CJ , Schmahmann JD ((2009) ) Functional topography in the human cerebellum: A meta-analysis of neuroimaging studies. Neuroimage 44: , 489–501. |
[16] | Stoodley CJ , Valera EM , Schmahmann JD ((2012) ) Functional topography of the cerebellum for motor and cognitive tasks: An fMRI study. Neuroimage 59: , 1560–1570. |
[17] | Buckner RL ((2013) ) The cerebellum and cognitive function: 25 years of insight from anatomy and neuroimaging. Neuron 80: , 807–815. |
[18] | Buckner RL , Krienen FM , Castellanos A , Diaz JC , Yeo BTT ((2011) ) The organization of the human cerebellum estimated by intrinsic functional connectivity. J Neurophysiol 106: , 2322–2345. |
[19] | De Smet HJ , Paquier P , Verhoeven J , Marien P ((2013) ) The cerebellum: Its role in language and related cognitive and affective functions. Brain Lang 127: , 334–342. |
[20] | Van Overwalle F , Heleven E , Ma N , Marien P ((2017) ) Tell me twice: A multi-study analysis of the functional connectivity between the cerebrum and cerebellum after repeated trait information. Neuroimage 144: , 241–252. |
[21] | Braak H , Braak E , Bohl J , Lang W ((1989) ) Alzheimer’s disease: Amyloid plaques in the cerebellum. J Neurol Sci 93: , 277–287. |
[22] | Cole G , Neal JW , Singhrao SK , Jasani B , Newman GR ((1993) ) The distribution of amyloid plaques in the cerebellum and brain stem in Down’s syndrome and Alzheimer’s disease: A light microscopical analysis. Acta Neuropathol 85: , 542–552. |
[23] | Suenaga T , Hirano A , Llena JF , Ksiezak-Reding H , Yen S-H , Dickson DW ((1990) ) Modified Bielschowsky and immunocytochemical studies on cerebellar plaques in Alzheimer’s disease. J Neuropathol Exp Neurol 49: , 31–40. |
[24] | Bai F , Liao W , Watson DR , Shi Y , Yuan Y , Cohen AD , Xie C , Wang Y , Yue C , Teng Y , Wu D , Jia J , Zhang Z ((2011) ) Mapping the altered patterns of cerebellar resting-state function in longitudinal amnestic mild cognitive impairment patients. J Alzheimers Dis 23: , 87–99. |
[25] | Castellazzi G , Palesi F , Casali S , Vitali P , Sinforiani E , Wheeler-Kingshott CA , D’Angelo E ((2014) ) A comprehensive assessment of resting state networks: Bidirectional modification of functional integrity in cerebro-cerebellar networks in dementia. Front Neurosci 8: , 223. |
[26] | Olivito G , Serra L , Marra C , Di Domenico C , Caltagirone C , Toniolo S , Cercignani M , Leggio M , Bozzali M ((2020) ) Cerebellar dentate nucleus functional connectivity with cerebral cortex in Alzheimer’s disease and memory: A seed-based approach. Neurobiol Aging 89: , 32–40. |
[27] | Seeley WW , Crawford RK , Zhou J , Miller BL , Greicius MD ((2009) ) Neurodegenerative diseases target large-scale human brain networks. Neuron 62: , 42–52. |
[28] | Guo CC , Tan R , Hodges JR , Hu X , Sami S , Hornberger M ((2016) ) Network-selective vulnerability of the human cerebellum to Alzheimer’s disease and frontotemporal dementia. Brain 139: , 1527–1538. |
[29] | Albert MS , DeKosky ST , Dickson D , Dubois B , Feldman HH , Fox NC , Gamst A , Holtzman DM , Jagust WJ , Petersen RC , Snyder PJ , Carrillo MC , Thies B , Phelps CH ((2011) ) The diagnosis of mild cognitive impairment due to Alzheimer’s disease: Recommendations from the National Institute on Aging-Alzheimer’s Association workgroups on diagnostic guidelines for Alzheimer’s disease. Alzheimers Dement 7: , 270–279. |
[30] | Morris JC ((1993) ) The Clinical Dementia Rating (CDR): Current version and scoring rules. Neurology 41: , 1588–1592. |
[31] | Wang D , Buckner RL , Liu H ((2013) ) Cerebellar asymmetry and its relation to cerebral asymmetry estimated by intrinsic functional connectivity. J Neurophysiol 109: , 46–57. |
[32] | Hamilton M ((1960) ) A rating scale for depression. J Neurol Neurosurg Psychiatry 23: , 56. |
[33] | Scheltens P , Leys D , Barkhof F , Huglo D , Weinstein HC , Vermersch P , Kuiper M , Steinling M , Wolters EC , Valk J ((1992) ) Atrophy of medial temporal lobes on MRI in” probable” Alzheimer’s disease and normal ageing: Diagnostic value and neuropsychological correlates. J Neurol Neurosurg Psychiatry 55: , 967–972. |
[34] | Clerx L , van Rossum IA , Burns L , Knol DL , Scheltens P , Verhey F , Aalten P , Lapuerta P , Van de Pol L , Van Schijndel R ((2013) ) Measurements of medial temporal lobe atrophy for prediction of Alzheimer’s disease in subjects with mild cognitive impairment. Neurobiol Aging 34: , 2003–2013. |
[35] | Clerx L , Gronenschild HBM , Echavarri C , Aalten P , Il Jacobs H ((2015) ) Can FreeSurfer compete with manual volumetric measurements in Alzheimer’s disease? Curr Alzheimer Res 12: , 358–367. |
[36] | Jack CR Jr. , Lowe VJ , Senjem ML , Weigand SD , Kemp BJ , Shiung MM , Knopman DS , Boeve BF , Klunk WE , Mathis CA , Petersen RC ((2008) ) 11C PiB and structural MRI provide complementary information in imaging of Alzheimer’s disease and amnestic mild cognitive impairment. Brain 131: , 665–680. |
[37] | Folstein MF , Folstein SE , McHugh PR ((1975) ) “Mini-mental state”: A practical method for grading the cognitive state of patients for the clinician. J Psychiatr Res 12: , 189–198. |
[38] | Van Der Elst WIM , Van Boxtel MPJ , Van Breukelen GJP , Jolles J ((2006) ) Normative data for the Animal, Profession and Letter M Naming verbal fluency tests for Dutch speaking participants and the effects of age, education, and sex. J Int Neuropsychol Soc 12: , 80–89. |
[39] | Van der Elst W , van Boxtel MPJ , van Breukelen GJP , Jolles J ((2006) ) The Letter Digit Substitution Test: Normative data for 1,858 healthy participants aged 24–81 from the Maastricht Aging Study (MAAS): Influence of age, education, and sex. J Clin Exp Neuropsychol 28: , 998–1009. |
[40] | Van der Elst W , Van Boxtel MPJ , Van Breukelen GJP , Jolles J ((2006) ) The Stroop color-word test: Influence of age, sex, and education; and normative data for a large sample across the adult age range. Assessment 13: , 62–79. |
[41] | Van Der Elst WIM , Van Boxtel MPJ , Van Breukelen GJP , Jolles J ((2005) ) Rey’s verbal learning test: Normative data for 1855 healthy participants aged 24–81 years and the influence of age, sex, education, and mode of presentation. J Int Neuropsychol Soc 11: , 290–302. |
[42] | Van der Elst W , Van Boxtel MPJ , Van Breukelen GJP , Jolles J ((2006) ) The concept shifting test: Adult normative data. Psychol Assess 18: , 424. |
[43] | Goebel R , Esposito F , Formisano E ((2006) ) Analysis of functional image analysis contest (FIAC) data with brainvoyager QX: From single-subject to cortically aligned group general linear model analysis and self-organizing group independent component analysis. Hum Brain Mapp 27: , 392–401. |
[44] | Gronenschild EHBM , Burgmans S , Smeets F , Vuurman EFPM , Uylings HBM , Jolles J ((2010) ) A time-saving and facilitating approach for segmentation of anatomically defined cortical regions: MRI volumetry. Psychiatry Res 181: , 211–218. |
[45] | Talairach J ((1988) ), Co-Planar Stereotaxic Atlas of the Human Brain: 3-D Proportional System: An Approach to Cerebral Imaging. Thieme. |
[46] | Corbetta M , Shulman GL ((2002) ) Control of goal-directed and stimulus-driven attention in the brain. Nat Rev Neurosci 3: , 201–215. |
[47] | Yeo BTT , Krienen FM , Sepulcre J , Sabuncu MR , Lashkari D , Hollinshead M , Roffman JL , Smoller JW , Zöllei L , Polimeni JR ((2011) ) The organization of the human cerebral cortex estimated by intrinsic functional connectivity. J Neurophysiol 106: , 1125–1165. |
[48] | Fox MD , Zhang D , Snyder AZ , Raichle ME ((2009) ) The global signal and observed anticorrelated resting state brain networks. J Neurophysiol 101: , 3270–3283. |
[49] | Murphy K , Birn RM , Handwerker DA , Jones TB , Bandettini PA ((2009) ) The impact of global signal regression on resting state correlations: Are anti-correlated networks introduced? Neuroimage 44: , 893–905. |
[50] | Friston KJ , Holmes AP , Price CJ , Büchel C , Worsley KJ ((1999) ) Multisubject fMRI studies and conjunction analyses. Neuroimage 10: , 385–396. |
[51] | Prvulovic D , Van de Ven V , Sack AT , Maurer K , Linden DEJ ((2005) ) Functional activation imaging in aging and dementia. Psychiatry Res 140: , 97–113. |
[52] | Smith SM , Rao A , De Stefano N , Jenkinson M , Schott JM , Matthews PM , Fox NC ((2007) ) Longitudinal and cross-sectional analysis of atrophy in Alzheimer’s disease: Cross-validation of BSI, SIENA and SIENAX. Neuroimage 36: , 1200–1206. |
[53] | Team RC ((2016) ), R: A Language and Environment for Statistical Computing. |
[54] | Kim S ((2015) ) ppcor: An R package for a fast calculation to semi-partial correlation coefficients. Commun Stat Appl Methods 22: , 665–674. |
[55] | Benjamini Y , Hochberg Y ((1995) ) Controlling the false discovery rate: A practical and powerful approach to multiple testing. J Royal Stat Soc 57: , 289–300. |
[56] | Zheng W , Liu X , Song H , Li K , Wang Z ((2017) ) Altered functional connectivity of cognitive-related cerebellar subregions in Alzheimer’s disease. Front Aging Neurosci 9: , 143. |
[57] | Steininger SC , Liu X , Gietl A , Wyss M , Schreiner S , Gruber E , Treyer V , Kalin A , Leh S , Buck A , Nitsch RM , Prussmann KP , Hock C , Unschuld PG ((2014) ) Cortical amyloid beta in cognitively normal elderly adults is associated with decreased network efficiency within the cerebro-cerebellar system. Front Aging Neurosci 6: , 52. |
[58] | Saad ZS , Gotts SJ , Murphy K , Chen G , Jo HJ , Martin A , Cox RW ((2012) ) Trouble at rest: How correlation patterns and group differences become distorted after global signal regression. Brain Connect 2: , 25–32. |
[59] | Keller JB , Hedden T , Thompson TW , Anteraper SA , Gabrieli JD , Whitfield-Gabrieli S ((2015) ) Resting-state anticorrelations between medial and lateral prefrontal cortex: Association with working memory, aging, and individual differences. Cortex 64: , 271–280. |
[60] | Wu JT , Wu HZ , Yan CG , Chen WX , Zhang HY , He Y , Yang HS ((2011) ) Aging-related changes in the default mode network and its anti-correlated networks: A resting-state fMRI study. Neurosci Lett 504: , 62–67. |
[61] | Broyd SJ , Demanuele C , Debener S , Helps SK , James CJ , Sonuga-Barke EJ ((2009) ) Default-mode brain dysfunction in mental disorders: A systematic review. Neurosci Biobehav Rev 33: , 279–296. |
[62] | Buckner RL , Andrews-Hanna JR , Schacter DL ((2008) ) The brain’s default network: Anatomy, function, and relevance to disease. Ann N Y Acad Sci 1124: , 1–38. |
[63] | Fransson P ((2006) ) How default is the default mode of brain function? Further evidence from intrinsic BOLD signal fluctuations. Neuropsychologia 44: , 2836–2845. |
[64] | Greicius MD , Krasnow B , Reiss AL , Menon V ((2003) ) Functional connectivity in the resting brain: A network analysis of the default mode hyothesis. Proc Natl Acad Sci U S A 100: , 253–258. |
[65] | Weissman DH , Roberts KC , Visscher KM , Woldorff MG ((2006) ) The neural bases of momentary lapses in attention. Nat Neurosci 9: , 971–978. |
[66] | Bai F , R Watson D , Shi Y , Yuan Y , Yu H , Zhang Z ((2012) ) Mobilization and redistribution of default mode network from resting state to task state in amnestic mild cognitive impairment. Curr Alzheimer Res 9: , 944–952. |
[67] | Cooperrider J , Furmaga H , Plow E , Park HJ , Chen Z , Kidd G , Baker KB , Gale JT , Machado AG ((2014) ) Chronic deep cerebellar stimulation promotes long-term potentiation, microstructural plasticity, and reorganization of perilesional cortical representation in a rodent model. J Neurosci 34: , 9040–9050. |
[68] | Passot JB , Sheynikhovich D , Duvelle E , Arleo A ((2012) ) Contribution of cerebellar sensorimotor adaptation to hippocampal spatial memory. PLoS One 7: , e32560. |
[69] | Bonnet MC , Dilharreguy B , Allard M , Deloire MS , Petry KG , Brochet B ((2009) ) Differential cerebellar and cortical involvement according to various attentional load: Role of educational level. Hum Brain Mapp 30: , 1133–1143. |
[70] | Sala-Llonch R , Pena-Gomez C , Arenaza-Urquijo EM , Vidal-Pineiro D , Bargallo N , Junque C , Bartres-Faz D ((2012) ) Brain connectivity during resting state and subsequent working memory task predicts behavioural performance. Cortex 48: , 1187–1196. |
[71] | Lin CY , Chen CH , Tom SE , Kuo SH , Alzheimer’s Disease Neuroimaging Initiative ((2020) ) Cerebellar volume is associated with cognitive decline in mild cognitive impairment: Results from ADNI. Cerebellum 19: , 217–225. |
[72] | Tabatabaei-Jafari H , Walsh E , Shaw ME , Cherbuin N , Alzheimer’s Disease Neuroimaging Initiative ((2017) ) The cerebellum shrinks faster than normal ageing in Alzheimer’s disease but not in mild cognitive impairment. Hum Brain Mapp 38: , 3141–3150. |
[73] | Toniolo S , Serra L , Olivito G , Marra C , Bozzali M , Cercignani M ((2018) ) Patterns of cerebellar gray matter atrophy across Alzheimer’s disease progression. Front Cell Neurosci 12: , 430. |
[74] | Schmahmann JD ((1991) ) An emerging concept: The cerebellar contribution to higher function. Arch Neurol 48: , 1178–1187. |
[75] | Schmahmann JD ((1998) ) Dysmetria of thought: Clinical consequences of cerebellar dysfunction on cognition and affect. Trends Cogn Sci 2: , 362–371. |
[76] | Schultz AP , Chhatwal JP , Hedden T , Mormino EC , Hanseeuw BJ , Sepulcre J , Huijbers W , LaPoint M , Buckley RF , Johnson KA , Sperling RA ((2017) ) Phases of hyper and hypo connectivity in the default mode and salience networks track with amyloid and tau in clinically normal individuals. J Neurosci 37: , 4323–4331. |
[77] | Diedrichsen J ((2006) ) A spatially unbiased atlas template of the human cerebellum. Neuroimage 33: , 127–138. |


