
Florbetapir Regional Distribution in Cerebral Amyloid Angiopathy and Alzheimer’s Disease: A PET Study
Abstract
Background:
Sporadic cerebral amyloid angiopathy shows progressive amyloid-β deposition in the wall of small arterioles and capillaries of the leptomeninges and cerebral cortex.
Objective:
To investigate whether amyloid load and distribution, assessed by florbetapir positron emission tomography (PET), differs between patients with probable CAA-related intracerebral hemorrhage (CAA-ICH) and mild cognitive impairment due to Alzheimer’s disease (MCI-AD).
Methods:
We assessed [18F]florbetapir uptake in 15 patients with probable CAA-ICH and 20 patients with MCI-AD patients. Global and regional florbetapir retention were assessed using standard uptake values ratio (SUVr) in region-based and voxel-wise approaches. Visual reading of florbetapir scans was performed for all participants. Group comparisons were performed using univariate and multivariate analysis.
Results:
Global florbetapir retention was lower in patients with CAA-ICH than MCI-AD (median SUVr, 1.33 [1.21–1.41] versus 1.44 [1.35–1.66]; p = 0.032). In the region-based analysis, regional florbetapir distribution was similar between the two groups. There was a trend for an increased occipital/global ratio in CAA-ICH patients compared to MCI-AD (p = 0.060). In the voxel-wise approach, two clusters, one in parietal regions and the other in temporal regions, had higher uptake in MCI-AD relative to CAA patients.
Conclusions:
Patients with CAA-ICH had a lower global florbetapir PET burden than patients with MCI-AD. Relative florbetapir retention in the posterior regions tended to be higher in CAA patients in region-based analysis but was not statistically different between groups. Investigation on differences in amyloid deposits distribution between groups required a fine-grained voxel-wise analysis. In future studies, selective amyloid tracers are needed to differentiate vascular from parenchymal amyloid.
INTRODUCTION
Sporadic cerebral amyloid angiopathy (CAA) is a cerebral small-vessel disease characterized by the deposition of amyloid-β (Aβ) in the walls of cortical and leptomeningeal vessels, leading to loss of smooth muscle cells [1]. Positron-emission tomography (PET) amyloid radiotracers binds to parenchymal Aβ deposits in Alzheimer’s disease (AD) but also to vascular Aβ in CAA patients [2–4]. Global amyloid tracer uptake is increased in CAA patients with or without intracerebral hemorrhage (ICH) relative to healthy controls and to patients with hypertension relative ICH (HT-ICH) [4, 5]. However, this global uptake was reported as lower in CAA than in AD patients [3, 5] in two studies that compared these populations using [11C]Pittsburgh compound B (PiB). Moreover, it has been suggested that the regional distribution of PiB retention may differ between patients with CAA and AD, with a greater proportion of PiB retention in the occipital lobe among patients with CAA [3, 5]. Difference in amyloid PET burden and distribution between patients with CAA and AD remain widely unknown. Identifying a specific pattern of amyloid PET distribution associated with CAA and AD respectively, may have important clinical implications since both diseases have increased amyloid burden.
In the present study, we pooled individual data from two independent cohorts [4, 6] to compare the in vivo uptake of the PET amyloid tracer [18F]florbetapir in patients with CAA-related ICH (CAA-ICH) and mild cognitive impairment due to AD (MCI-AD). Standard uptake values ratio (SUVr) were obtained and regional as well as voxel-wise approaches for florbetapir quantification were performed. We aimed to compare the global and regional florbetapir burden between CAA-ICH and MCI-AD. Consistent with PiB studies, we hypothesized a higher relative uptake in the posterior parts of the brain in CAA patients than in MCI-AD patients.
METHODS
Participants
Participants were recruited as part of two clinical research projects on ICH and AD. The recruitment procedure has been previously described [4, 6]. Briefly, we included two groups of participants in this study: CAA-ICH and MCI-AD. In order for both groups to be age-matched on mean age, two MCI-AD patients (the two oldest) were removed from analyses. CAA patients enrolled in this study presented with a symptomatic acute ICH, fulfilled the modified Boston criteria for probable CAA [7], and had no pre-ICH dementia (IQCODE < 3.4 [8]). Patients with MCI-AD were diagnosed with typical AD [9] at a pre-dementia stage (Clinical Dementia Rating = 0.5). All MCI-AD patients had a memory complaint lasting more than 6 months corroborated by neuropsychological assessment (sum of the three free recalls≤17/48 and/or sum of the three free and cued recalls≤40/48 in the Free and Cued Selective Reminding Test [10]) and a cerebrospinal fluid analysis exhibiting amyloid pathology (level of phospho-tau≥60 pg/ml and Innotest Amyloid Tau Index≤0.8). In the case of ambiguous profile (i.e., phospho-tau<60 pg/ml or Innotest Amyloid Tau Index > 0.8), the Aβ42/Aβ40 levels ratio was calculated and a ratio < 0.045 was considered compatible with AD diagnosis [11].
This study was approved by the local ethics committee and the French Agency for the Safety of Health Products (A90605-58 & B111269-20). All participants gave their written informed consent.
Brain MRI scans
Each patient underwent detailed structural magnetic resonance imaging (MRI) scans within 2 months of florbetapir PET imaging. MRI images were acquired on the same Philips 3-T Imager (Intera Achieva, Philips, Best, The Netherlands) and included a 3D T1-weighted sequence. A 3D FLAIR and a T2* GRE sequences was also performed for ICH patients to help diagnosis. A T2 sequence was performed for the MCI-AD group. MRI markers of small vessel disease in CAA patients were reported according to the Standards for Reporting Vascular Changes on Neuroimaging (STRIVE) [12], as previously described [4].
Florbetapir PET acquisitions and analysis
A florbetapir PET scan was performed for each patient on the same Biograph™ 6 TruePoint™ (Siemens Medical Solutions, Munich, Germany) high-resolution hybrid PET/CT scanner (3D detection mode, producing images with 1×1×1.5 mm voxels and a spatial resolution of 5 mm full width at half maximum at the field of view center). Cerebral emission scans started 50 min after intravenous injection of 3.7 MBq/kg of [18F]florbetapir. Frames from the 50–60-min time interval after injection were summed, and corrected for partial volume effects using the point spread function model implemented by Siemens (HD-PET©).
Florbetapir PET scans were first registered onto their corresponding MRI T1 scan, and then normalized in the MNI space using the transformation matrix resulting from T1 registration using FSL software (http://www.fmrib.ox.ac.uk/fsl). A grey matter mask (corresponding to all cortical regions from the Neuromorphometrics atlas available in SPM12) was applied to the normalized PET scans, and cortical standardized uptake values ratio (SUVr) images were obtained using the grey matter of the cerebellum as a reference region.
Because the presence of ICH is likely to bias the signal detection of the PET tracer, the lesioned hemisphere was masked out. Therefore, SUVr quantification was only performed in the controlesional hemisphere for the CAA group. In the MCI-AD patient group, because no significant difference in SUVr measurements was found between hemispheres (data not shown), one hemisphere was also masked out for each patient, so that SUVr from one hemisphere only was considered in that group too. The same proportion of left/right hemispheres considered in CAA patients was randomly chosen in the MCI-AD group (it is to note that similar findings were obtained when considering the other hemisphere; data not shown). In order to have all images comparable for further group analyses, all left hemispheres were flipped along the x-axis (see Supplementary Figure 1 for details).
Florbetapir uptake was first quantified as follows: mean SUVr uptake was obtained in the five cortical regions (temporal, parietal, occipital, frontal, and insular) using composite ROIs extracted from the Automated Atlas Labelling (AAL [13]) anatomical atlas. Global cortical SUVr was calculated as the mean of the SUVr in these 5 ROIs, weighed by the size of each ROI (frontal = 457436 voxels; insula = 29152 voxels; temporal = 286844 voxels; parietal = 281028 voxels; occipital = 190783 voxels). Finally, regional SUVr values were expressed proportionally to the global (weighed) SUVr measure. Ratios for SUVr values for the 5 ROIs were then computed by calculating the relative regional uptake in the five ROIs as proportionally scaled to the uptake in the global cortex. We specifically focused on the occipital/global and frontal/global ratios, as suggested by previous studies [3, 5].
We then opted for a voxel-wise approach as a second step. Each voxel of the SUVr images was proportionally scaled to the mean SUVr in the global cortex, in order to obtain relative SUVr images (or adjusted to global SUVr). The hemi-cortical florbetapir uptake was compared voxel-wise from smoothed images (8×8×8) between the two groups in SPM12. The MNI coordinates of the local maxima in each significant cluster were then transferred onto the AAL atlas for regional labelling.
In addition, Florbetapir PET images were visually assessed for both groups by two independent nuclear medicine physicists, blind to all clinical and diagnostic information in a randomized order. Florbetapir PET scans were classified as either amyloid-positive or negative. PET scans were considered as positive when a positive response was done for at least one rater.
Analysis
Comparisons of demographic and clinical data between the groups were performed using the Mann Whitney or the t-tests, when applicable. The relative regional SUVr of florbetapir were compared between the two groups using univariate Mann Whitney tests. General linear model analyses were performed with SPM12 to investigate voxel-wise relative SUVr differences between the groups with a cluster threshold of p = 0.05 (family-wise error [FWE] corrected). Only these resulting significant clusters were considered for post-hoc t-test analyses. Results of the model are reported with and without adjustment for age and gender. Finally, florbetapir PET positivity based on visual interpretation was tested by a χ2 test.
We used STATISTICA software (StatSoft, Tulsa, OK, USA) to perform all statistics.
RESULTS
Data from 15 patients with probable CAA-ICH (median age [IQR] 68 [59.5–78.0]) of which two with supporting pathology and 20 patients with MCI-AD (median age 72 [67.8–78.0]) were analyzed. The patients with CAA-ICH had no pre-ICH cognitive impairment (Table 1). The two groups were similar in age and gender. Frequencies of the APOE ɛ4 and ɛ2 alleles were no different between the groups. Presence of lobar microbleeds and severe Fazekas score were significantly associated to patients with CAA-ICH. The median delay between ICH onset and the PET scan was 39 [range: 21–93] days.
Table 1
Clinical and imaging data from the two groups
| CAA-ICH | MCI-AD | p | |
| Number | 15 | 20 | |
| Age, median [IQR] | 68 [59.5–78.0] | 72 [67.8–78.0] | 0.442 |
| Gender (F/M) | 5/10 | 9/11 | 0.486 |
| IQCODE score, median [IQR] | 3 [2.9–3.2] | NA | – |
| MMSE score, median [IQR] | 25 [21–28]* | 26 [25-26] | 0.457 |
| Previous symptomatic ICH, n (%) | 1 (6.7) | 0 | 0.241 |
| Biological characteristics | |||
| APOE genotype, n (%) | |||
| Presence of ɛ4 | 4 (26.7) | 10 (50) | 0.109 |
| Presence of ɛ2 | 5 (33.3) | 3 (15) | 0.480 |
| Clinical and imaging characteristics | |||
| Presence of lobar CMB, n (%) | 12 (80) | 3 (15) | <0.001 |
| Lobar CMB count, median [IQR] | 6 [2.5–15.5] | NA | – |
| Presence of chronic ICH, n (%) | 5 (33.3) | 0 (0) | 0.005 |
| Presence of cSS, n (%) | 10 (66.7) | NA | – |
| Disseminated cSS, n (%) | 8 (53.3) | NA | – |
| WMH Fazekas score, median [IQR] | 5 [2.5–5] | 2 [1–3] | 0.021 |
| Severe (Fazekas 5–6) WMH, n (%) | 8 (53.3) | 4 (20) | 0.040 |
*Data available for 14 out of the 15 patients. IQR, interquartile range; ICH, intracerebral hemorrhage; IQCODE, Informant Questionnaire on Cognitive Decline in the Elderly; MMSE, Mini-Mental State Examination; APOE, apolipoprotein E; CMB, cerebral microbleeds; cSS, cortical superficial siderosis; WMH, white matter hyperintensities; NA, not available.
Among patients with probable CAA, 80% had lobar microbleeds and 66% had cortical superficial siderosis (see Table 1 for further details).
Global and ROI-based regional florbetapir uptake
Global retention was higher in MCI-AD relative to CAA patients (1.44 [1.35–1.66] versus 1.33 [1.21–1.41]; p = 0.032) (Fig. 1A and Table 2). No difference was found between the two groups on any relative regional florbetapir retention (Table 2). There was a trend for an increased occipital/ global ratio in patients with CAA-ICH compared to those with MCI-AD (1.08 [1.04–1.10] versus 1.02 [0.98–1.07], respectively; p = 0.060).
Fig.1
Box-and-whiskers plot of median florbetapir SUVr in the two groups. A) Median global florbetapir SUVr. B) Median florbetapir SUVr ratios.
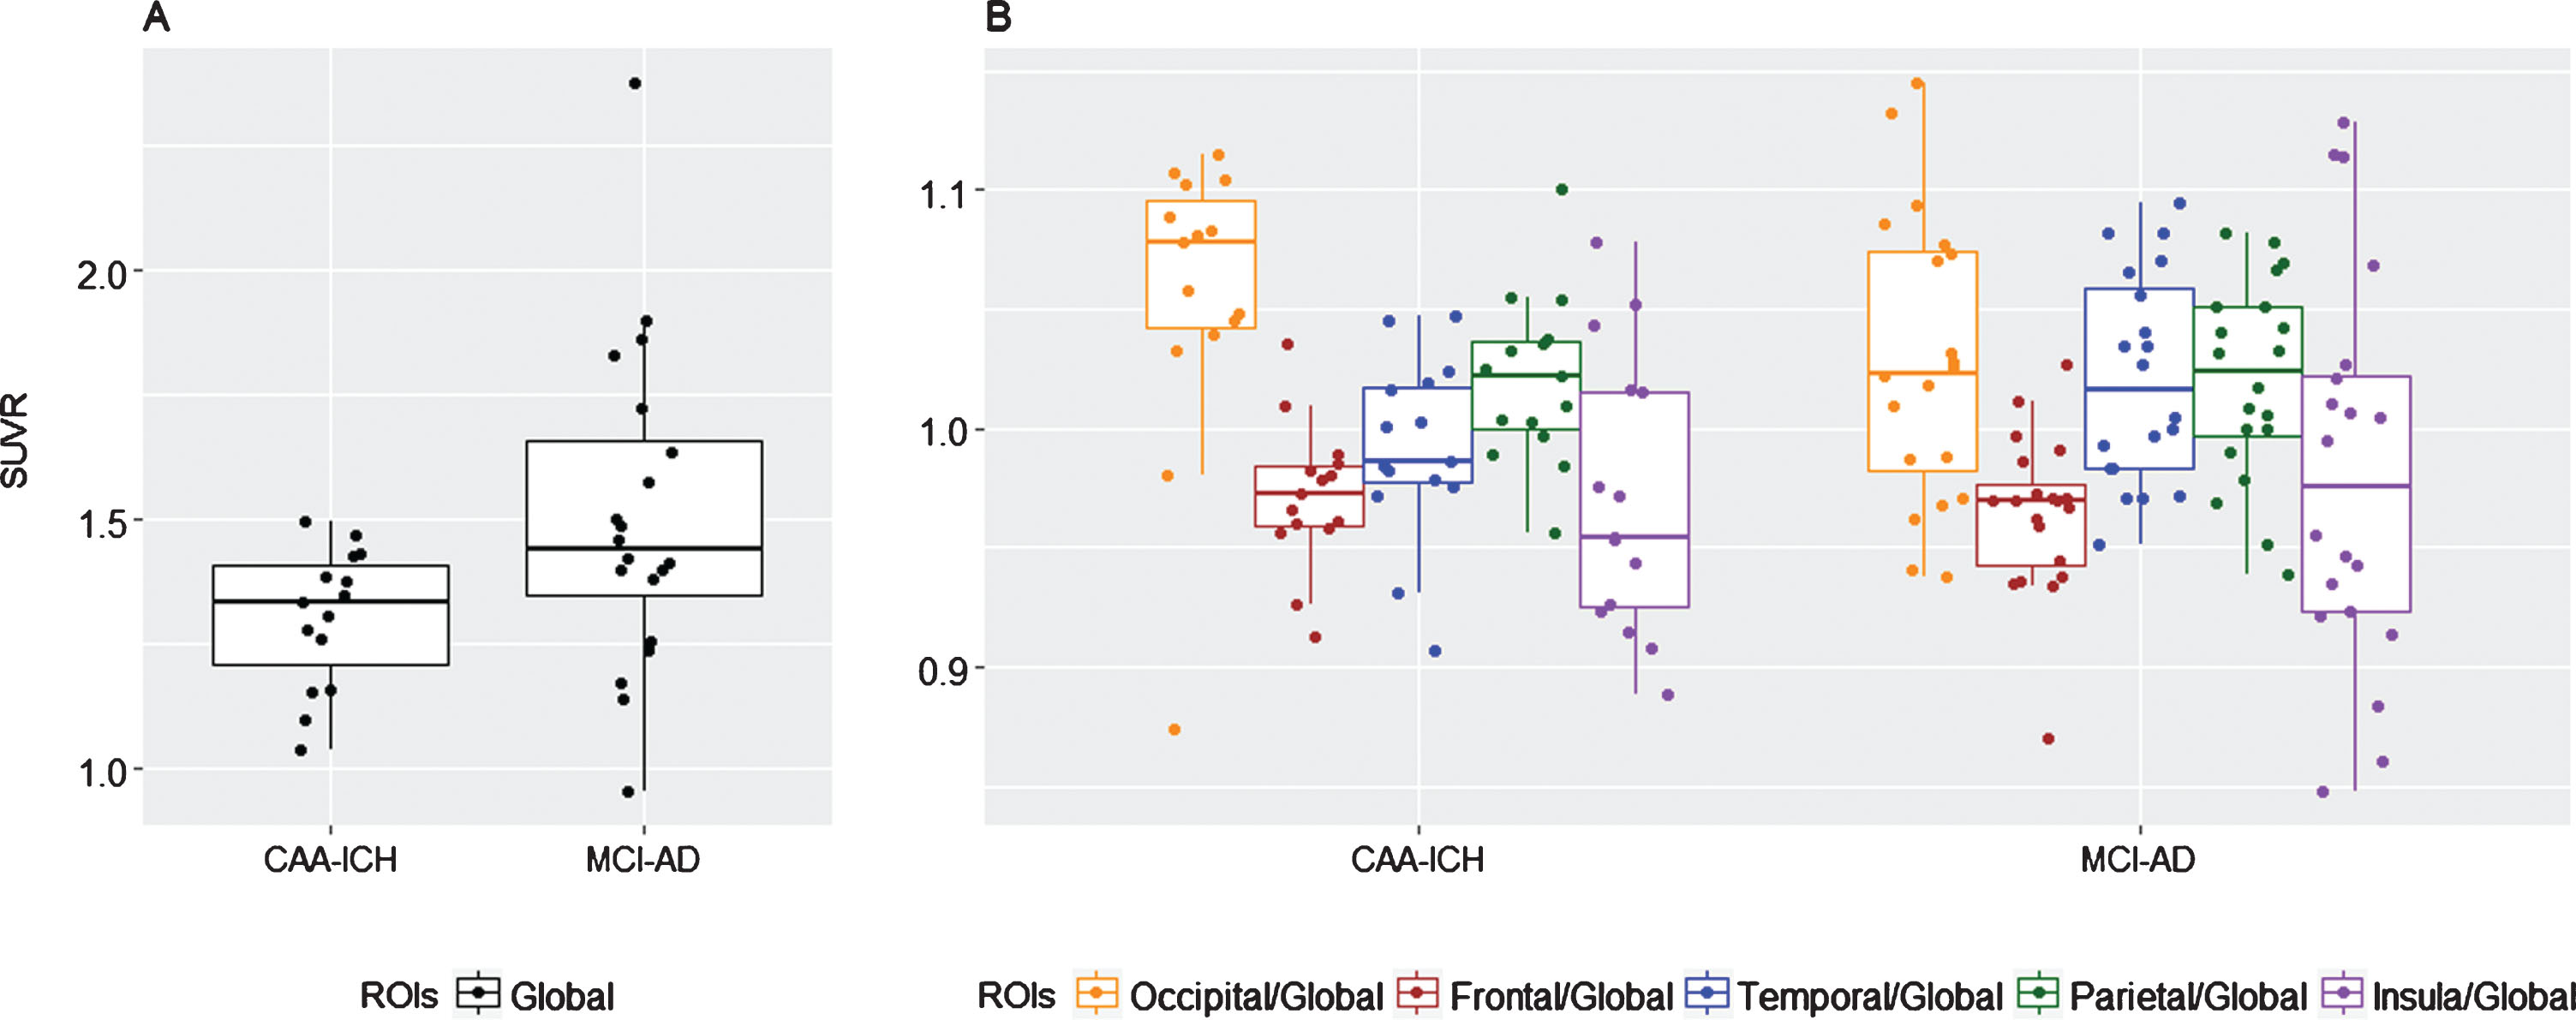
Table 2
Median SUVr in global uptake and in the five cortical regions. Global SUVr was obtained by averaging the SUVr of 5 ROIs. Regional SUVr are extracted from the AAL atlas
| Median SUVr, [IQR] | CAA-ICH | MCI-AD | p |
| Global | 1.33 [1.21–1.41] | 1.44 [1.35–1.66] | 0.032 |
| Frontal/Global | 0.97 [0.96–0.98] | 0.97 [0.94–0.98] | 0.653 |
| Occipital/Global | 1.08 [1.04–1.10] | 1.02 [0.98–1.07] | 0.060 |
| Parietal/Global | 1.02 [1–1.04] | 1.02 [1–1.05] | 0.881 |
| Temporal/Global | 0.99 [0.98–1.02] | 1.02 [0.98–1.06] | 0.129 |
| Insular/Global | 0.95 [0.92–1.02] | 0.98 [0.92–1.02] | 0.855 |
IQR, interquartile ratio; ROIs, regions of interest.
Voxel-wise SUVr results between the three groups
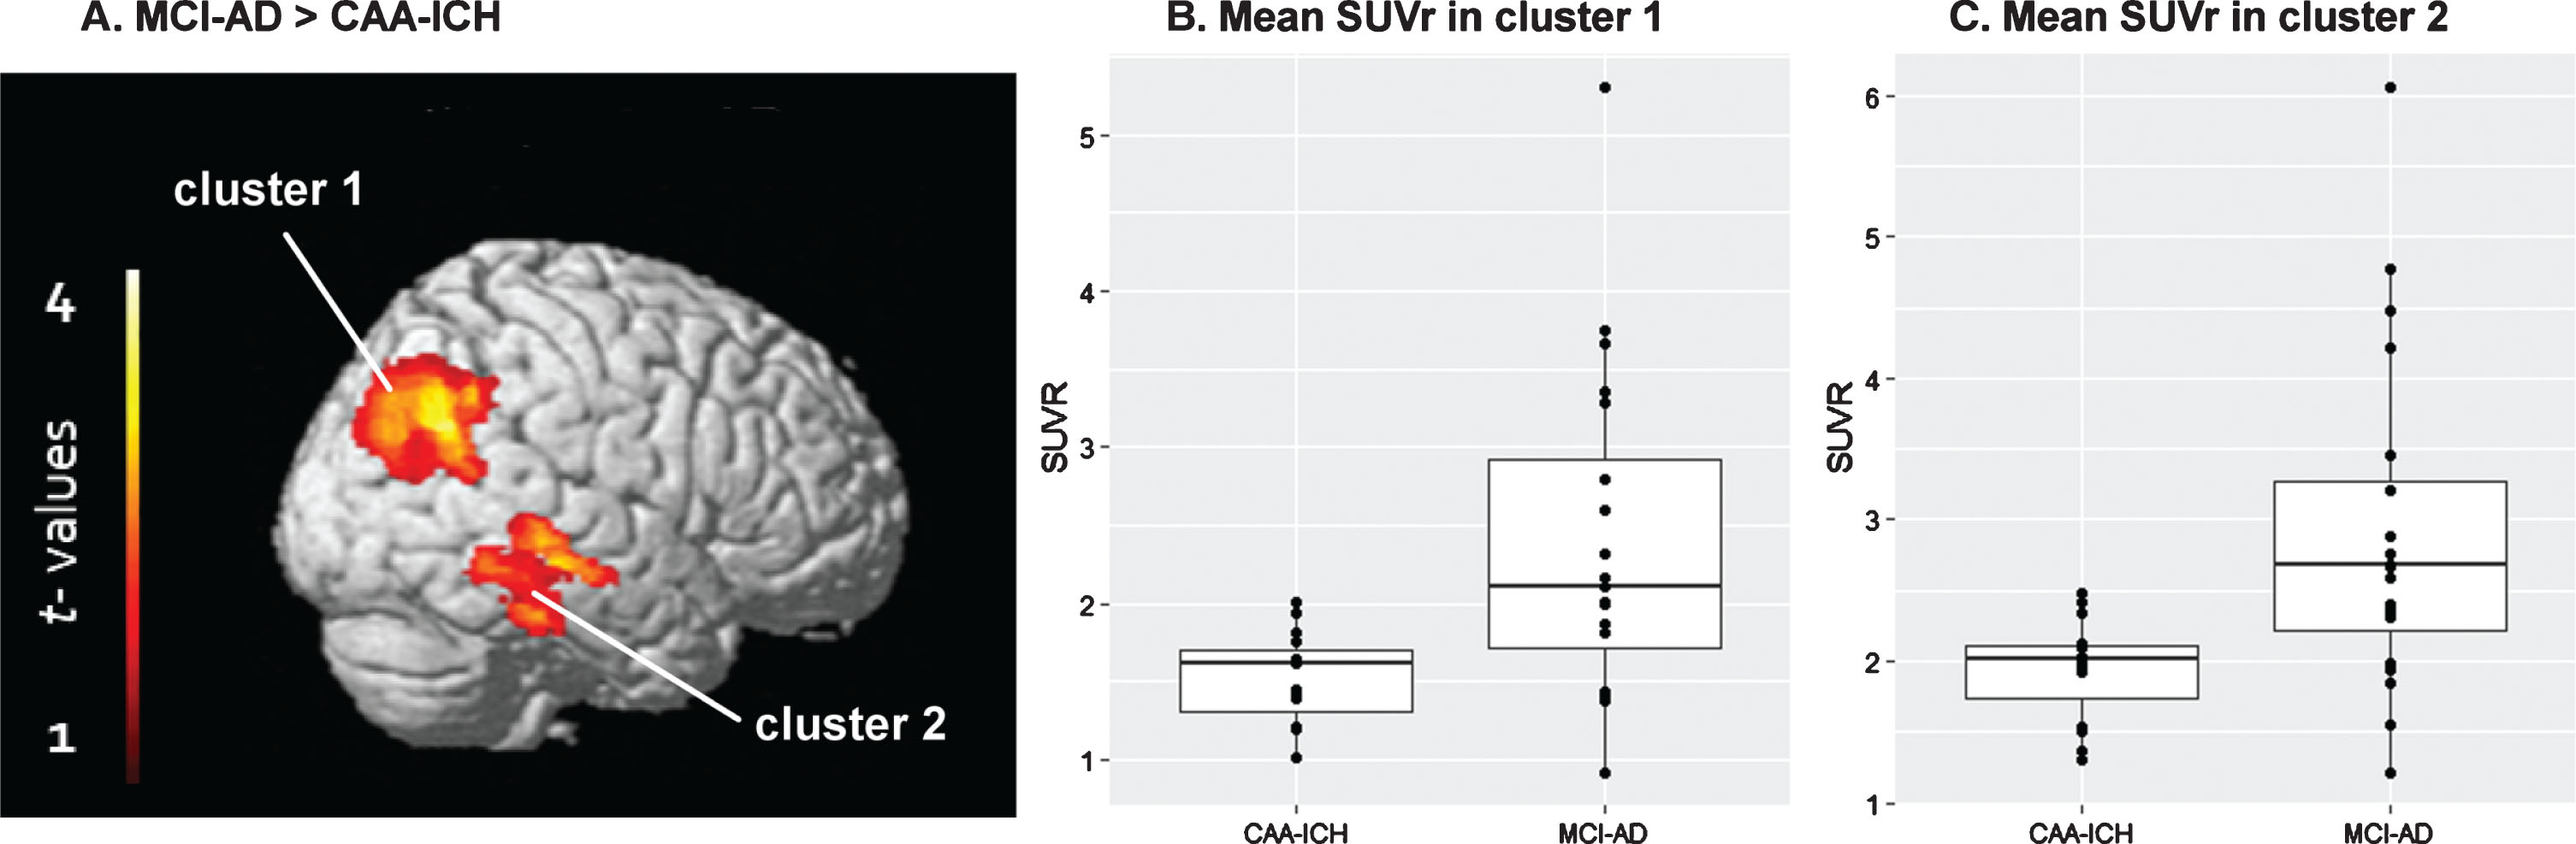
When comparing the groups at the voxel-wise level, two clusters showed significant SUVr differences after adjusting for global SUVr (i.e., relative SUVr voxel-wise differences) between the two groups: one main cluster in the parietal cortex (cluster 1, n = 2377 voxels, p = 0.007 FWE-corrected), and another in the temporal cortex (cluster 2, n = 1417 voxels, p = 0.031 FWE-corrected) (Table 3 and Fig. 2). Analysis performed in these two clusters revealed that SUVr were significantly higher in MCI-AD patients relative to CAA-ICH patients. When adjusting the model for age and gender, no significant difference survived. We did not find any significant region in the opposite comparisons.
Table 3
Description of the significant clusters from the voxel-wise group comparison. Regional labels are extracted from the AAL atlas
| Regions | Cluster characteristics | ||||||
| % of the cluster | p FWE-corr. | Voxel number | T | Peak | |||
| x | y | z | |||||
| Cluster 1 | 0.007 | 2377 | 4.35 | 44 | –75 | 38 | |
| Temporal superior | 56.12 | ||||||
| Parietal inferior | 18.72 | ||||||
| Supramarginal | 7.91 | ||||||
| Temporal middle | 5.05 | ||||||
| Angular | 0.93 | ||||||
| Occipital middle | 0.50 | ||||||
| Occipital superior | 0.04 | ||||||
| Cluster 2 | 0.031 | 1417 | 4.04 | 48 | –33 | 0 | |
| Temporal inferior | 59.84 | ||||||
| Temporal middle | 11.15 | ||||||
| Temporal superior | 2.05 | ||||||
Fig.2
Groups compared using a voxel-wise approach. A) Statistical parametric map displaying SUVr differences between the groups (p < 0.05 FWE-corrected). B) Mean SUVr values in cluster 1. C) Mean SUVr values in cluster 2.
Visual readings for florbetapir PET scan
Sixteen patients (80%) with MCI-AD were visually rated as florbetapir PET positive compared to 9 (60%) patients with CAA-ICH (p = 0.195). Cohen’s kappa on interrater agreement was considered excellent (κ= 0.922).
DISCUSSION
In this study, we found significantly higher global cortical florbetapir uptake in patients with MCI-AD compared to patients with probable CAA-ICH. Investigation of differences in distribution profile of amyloid deposits between the two groups have required a fine-grained voxel-wise analysis. The distribution of florbetapir assessed by ROI analysis was not statistically different between the two groups, even if the relative occipital florbetapir retention (expressed as the occipital-to-global-ratio) tended to be higher in the CAA group than in the MCI-AD group. In the voxel-wise quantitative analysis, patients with MCI-AD had higher florbetapir retention in the temporal and parietal regions compared to patients with CAA-ICH. No region showed significantly higher uptake in CAA-ICH versus MCI-AD patients.
Based on pathological studies demonstrating that the occipital lobe is the most severely affected by CAA [14, 15], it had been hypothesized that amyloid tracer retention would predominantly be increased in the occipital region. Only two amyloid PET studies, using PiB, have explored the burden and distribution of amyloid in CAA patients compared to patients with probable AD. In line with our florbetapir study, global PiB uptake was shown to be higher in patients with AD than in CAA. These two PiB PET studies also reported a higher occipital-to-global ratio in CAA patients than in AD patients. However, in a larger study of Gurol et al., comparing relative occipital-to-global PiB uptake in CAA versus MCI/AD patients, the authors found no difference between groups [16]. Our present results seem to converge with those of Ly et al. [3] and Johnson et al. [5]. In our amyloid PET studies, using [18F]florbetapir, although absolute occipital amyloid retention values (both in ROI-based and voxel-based analyses) were not increased in patients with CAA-ICH compared to MCI-AD, the relative occipital amyloid retention tented to be higher in CAA-ICH patients than in MCI-AD. Our results did not reach significance, possibly due to a limited statistical power. As pointed out by Charidimou et al. in their meta-analysis, there is an issue of high statistical heterogeneity in all previous published studies on amyloid PET, working on small sample populations [17]. Indeed, other research groups reported no significant difference in occipital-to-global ratio uptake between patients with CAA and healthy controls or patients with HT-ICH [4, 16, 18]. Taken together, these findings call for replication studies.
Compared to patients with MCI-AD, our CAA patients did not demonstrate significantly increased relative florbetapir retention in any region. Conversely, two clusters in the temporal and parietal regions had increased relative florbetapir retention in patients with MCI-AD compared to patients with CAA. Recently, Grothe et al. analyzed florbetapir PET scans of 667 patients from the ADNI cohort (from healthy controls to demented AD patients) [19]. They found a consistent regional hierarchy of PET amyloid deposition across participants that resemble neuropathologic observations, and established a four-stage model of amyloid deposition. In their model, the temporal and the parietal regions found in our voxel-wise analysis were reported to be affected by stage II amyloid deposits.
The present PET study is the first to combine ROI-based parcellation, as defined by an atlas, with an approach free from anatomical a priori (i.e., voxel-wise), on relative SUVr measurements. While these two approaches provide further insight into the burden and distribution of amyloid uptake in CAA compared to MCI-AD, the sample size is limited, and again the non-significant difference in the relative occipital florbetapir retention between the two groups may result from underpowered study.
Although CAA patient with pre-existing cognitive impairment were excluded to minimize the risk of accompanying AD pathology, we cannot totally rule out the possibility of pre-clinical AD in some of CAA cases. However, the “probable CAA” category of the validated MRI-based Boston criteria we used to define CAA cases have very good sensitivity and specificity. Conversely, in the absence of blood sensitive MRI sequences in subjects with MCI-AD, we cannot fully exclude the possibility of concomitant CAA in subjects with MCI-AD, although MCI-AD patients had no history of cerebrovascular event. Indeed, an autopsies study has reported mild to moderate vascular Aβ depositions in more than 80% of patients with AD [20]. In our study, the two CAA-ICH patients with pathological confirmation who had high florbetapir uptakes were reported to have both vascular amyloid and amyloid plaques. The biochemical study of cerebrospinal fluid (CSF) could help understand better the overlap observed in SUVr analysis between the two groups. However, it is well known that acute vascular lesions can distort the dosage of tau, phospho-tau, and Aβ proteins and such analysis remained unreliable. Similarly, although CSF amyloid positivity was required in all patients with MCI-AD, we cannot totally rule out the possibility that a few of them may not have AD, resulting in a negative florbetapir PET [21].
Distinct methodological approaches, in terms of protocol adherence and PET image quantification, may lead to different findings. Cortical atrophy may also influence estimations of radiotracer uptake. In this study, to get around this possible bias, we restricted our analyses to the cortex using a grey matter mask for quantification analyses. Taking one further step, one PiB PET study on CAA-ICH patients used post-processing MRI-based partial-volume correction to improve the accuracy of quantification by adjusting for this bias [18]. The effects of such a correction should be investigated in future studies. Another possible factor that might explain the discrepancies between studies is to the time frame in which ICH patients were scanned. Most of the previous PET studies were performed in the chronic phase of ICH. Here, PET scans were acquired in the acute phase of ICH, when intracranial pressure varies and may change cerebral hemodynamics.
Our findings suggest that global florbetapir retention is lower in patients with CAA-ICH compared to patients with MCI-AD. Relative florbetapir retention in the occipital region tended to be higher in CAA patients but was not significantly different from MCI-AD, based on two complementary analyses of amyloid PET burden whereas patients with MCI-AD had increased amyloid uptake in the temporal and parietal lobe. Despite strict inclusion criteria, a pathological overlap between the two population is the most likely explanation for similarities observed in the distribution pattern of amyloid retention between CAA-ICH and MCI-AD patients. As detailed below, it may be possible that some MCI-AD patients have concomitant CAA pathology that we could not observe in the absence of dedicated MRI sequences. Further larger studies including in vitro amyloid ligand binding in CAA patients are needed to better understand the selective affinity of florbetapir ligand retention. The development of a CAA-specific amyloid tracer is also required [22, 23].
ACKNOWLEDGMENTS
This study pooled data from two clinical research projects on intracerebral hemorrhage and Alzheimer’s disease. Both studies were supported by local grants from the University Hospital of Toulouse in 2007 and 2011, respectively. The study on ICH patients was also funded by Avid Radiopharmaceuticals and the Institut des Sciences et du Cerveau de Toulouse. Avid Radiopharmaceuticals provided funding for the PET scanning and supplied the florbetapir precursor. Labex IRON provided synthesis facilities for the florbetapir. The study on AD was also funded by the French Agence Nationale de la Recherche. This work was supported by CHU Toulouse regarding regulatory and ethical approval and compliance. The authors thank the sponsor of this study, CHU Toulouse.
Authors’ disclosures available online (https://www.j-alz.com/manuscript-disclosures/19-0625r3).
SUPPLEMENTARY MATERIAL
[1] The supplementary material is available in the electronic version of this article: https://dx.doi.org/10.3233/JAD-190625.
REFERENCES
[1] | Charidimou A , Gang Q , Werring DJ ((2012) ) Sporadic cerebral amyloid angiopathy revisited: Recent insights into pathophysiology and clinical spectrum. J Neurol Neurosurg Psychiatry 83: , 124–137. |
[2] | Gurol ME , Becker JA , Fotiadis P , Riley G , Schwab K , Johnson KA , Greenberg SM ((2016) ) Florbetapir-PET to diagnose cerebral amyloid angiopathy A prospective study. Neurology 87: , 2043–2049. |
[3] | Ly JV , Donnan GA , Villemagne VL , Zavala JA , Ma H , O’Keefe G , Gong SJ , Gunawan RM , Saunder T , Ackerman U , Tochon-Danguy H , Churilov L , Phan TG , Rowe CC ((2010) ) 11C-PIB binding is increased in patients with cerebral amyloid angiopathy-related hemorrhage. Neurology 74: , 487–493. |
[4] | Raposo N , Planton M , Péran P , Payoux P , Bonneville F , Lyoubi A , Albucher JF , Acket B , Salabert AS , Olivot JM ((2017) ) Florbetapir imaging in cerebral amyloid angiopathy-related hemorrhages. Neurology 89: , 697–704. |
[5] | Johnson KA , Gregas M , Becker JA , Kinnecom C , Salat DH , Moran EK , Smith EE , Rosand J , Rentz DM , Klunk WE , Mathis CA , Price JC , Dekosky ST , Fischman AJ , Greenberg SM ((2007) ) Imaging of amyloid burden and distribution in cerebral amyloid angiopathy. Ann Neurol 62: , 229–234. |
[6] | Saint-Aubert L , Barbeau EJ , Péran P , Nemmi F , Vervueren C , Mirabel H , Payoux P , Hitzel A , Bonneville F , Gramada R ((2013) ) Cortical florbetapir-PET amyloid load in prodromal Alzheimer’s disease patients. EJNMMI Res 3: , 43. |
[7] | Linn J , Halpin A , Demaerel P , Ruhland J , Giese A , Dichgans M , Van Buchem M , Bruckmann H , Greenberg S ((2010) ) Prevalence of superficial siderosis in patients with cerebral amyloid angiopathy. Neurology 74: , 1346–1350. |
[8] | Jorm AF , Jacomb PA ((1989) ) The Informant Questionnaire on Cognitive Decline in the Elderly (IQCODE): Socio-demographic correlates, reliability, validity and some norms. Psychol Med 19: , 1015–1022. |
[9] | Dubois B , Feldman HH , Jacova C , Dekosky ST , Barberger-Gateau P , Cummings J , Delacourte A , Galasko D , Gauthier S , Jicha G , Meguro K , O’Brien J , Pasquier F , Robert P , Rossor M , Salloway S , Stern Y , Visser PJ , Scheltens P ((2007) ) Research criteria for the diagnosis of Alzheimer’s disease: Revising the NINCDS-ADRDA criteria. Lancet Neurol 6: , 734–746. |
[10] | Van der Linden M , Coyette F , Poitrenaud J , Kalafat M , Calicis F , Wyns C , Adam S ((2004) ) L’épreuve de rappel libre/rappel indicéé à 16 items (RL/RI-16). L’évaluation des troubles de la mémoire. Solal: Marseille, pp. 25–47. |
[11] | Wiltfang J , Esselmann H , Bibl M , Hüll M , Hampel H , Kessler H , Frölich L , Schröder J , Peters O , Jessen F ((2007) ) Amyloid β peptide ratio 42/40 but not Aβ42 correlates with phospho-Tau in patients with low-and high-CSF Aβ40 load. J Neurochem 101: , 1053–1059. |
[12] | Wardlaw JM , Smith EE , Biessels GJ , Cordonnier C , Fazekas F , Frayne R , Lindley RI , T O’Brien J , Barkhof F , Benavente OR ((2013) ) Neuroimaging standards for research into small vessel disease and its contribution to ageing and neurodegeneration. Lancet Neurol 12: , 822–838. |
[13] | Tzourio-Mazoyer N , Landeau B , Papathanassiou D , Crivello F , Etard O , Delcroix N , Mazoyer B , Joliot M ((2002) ) Automated anatomical labeling of activations in SPM using a macroscopic anatomical parcellation of the MNI MRI single-subject brain. Neuroimage 15: , 273–289. |
[14] | Li X-Q , Su D-F , Chen H-S , Fang Q ((2015) ) Clinical neuropathological analysis of 10 cases of cerebral amyloid angiopathy-related cerebral lobar hemorrhage. J Korean Neurosurg Soc 58: , 30–35. |
[15] | Viswanathan A , Greenberg SM ((2011) ) Cerebral amyloid angiopathy in the elderly. Ann Neurol 70: , 871–880. |
[16] | Gurol ME , Viswanathan A , Gidicsin C , Hedden T , Martinez-Ramirez S , Dumas A , Vashkevich A , Ayres AM , Auriel E , Etten E ((2013) ) Cerebral amyloid angiopathy burden associated with leukoaraiosis: A positron emission tomography/magnetic resonance imaging study. Ann Neurol 73: , 529–536. |
[17] | Charidimou A , Farid K , Tsai HH , Tsai LK , Yen RF , Baron JC ((2018) ) Amyloid-PET burden and regional distribution in cerebral amyloid angiopathy: A systematic review and meta-analysis of biomarker performance. J Neurol Neurosurg Psychiatry 89: , 410–417. |
[18] | Baron J-C , Farid K , Dolan E , Turc G , Marrapu ST , O’Brien E , Aigbirhio FI , Fryer TD , Menon DK , Warburton EA ((2014) ) Diagnostic utility of amyloid PET in cerebral amyloid angiopathy-related symptomatic intracerebral hemorrhage. J Cereb Blood Flow Metab 34: , 753–758. |
[19] | Grothe MJ , Barthel H , Sepulcre J , Dyrba M , Sabri O , Teipel SJ , Alzheimer’s Disease Neuroimaging Initiative ((2017) ) In vivo staging of regional amyloid deposition. Neurology 89: , 2031–2038. |
[20] | Ellis R , Olichney J , Thal L , Mirra S , Morris J , Beekly D , Heyman A ((1996) ) Cerebral amyloid angiopathy in the brains of patients with Alzheimer’s disease The CERAD experience, part XV. Neurology 46: , 1592–1596. |
[21] | Landau SM , Horng A , Fero A , Jagust WJ , Alzheimer’s Disease Neuroimaging Initiative ((2016) ) Amyloid negativity in patients with clinically diagnosed Alzheimer disease and MCI. Neurology 86: , 1377–1385. |
[22] | Iikuni S , Ono M , Watanabe H , Yoshimura M , Ishibashi-Ueda H , Ihara M , Saji H ((2016) ) Novel bivalent 99mTc-complex with N-Methyl-substituted hydroxamamide as probe for imaging of cerebral amyloid angiopathy. PloS One 11: , e0163969. |
[23] | Zha Z , Song J , Choi SR , Wu Z , Ploessl K , Smith M , Kung H ((2016) ) 68Ga-Bivalent polypegylated styrylpyridine conjugates for imaging Aβ plaques in cerebral amyloid angiopathy. Bioconjug Chem 27: , 1314–1323. |


