
Preliminary Capillary Flow Experiments with Amyloid-β, Possible Needle and Capillary Aβ Adsorption, and a Proposal for Drug Evaluation Under Shear Conditions
Abstract
Amyloid-β (Aβ) solution injections into an aqueous mobile phase moving through narrow bore stainless-steel capillary tubing results in adsorption of at least 99% Aβ within the tubing or injection valve. However, if flow is stopped for a period of 5–10 minutes, then started, wall desorption yields Aβ-containing molecules in the new effluent. The amount of desorbed Aβ-containing effluent depends on flow rate, period of flow cessation, and number of successive Aβ injections into the same tube without cleaning between injections. Unexpected multiple chromatographic peaks in these experiments seem to imply “separation” of released, previously adsorbed Aβ-containing products in the empty capillary tubing. These preliminary experiments raise questions about possible errors in Alzheimer’s disease (AD) spinal tap analyses, which use stainless-steel needles of approximately the same inner diameter and encounter similar flow rates as those in our capillary experiments. Microliter syringes and HPLC connectors also contain stainless-steel tubing that have similar inner diameter dimensions and similar flow rates. The capillary system involved in these experiments has previously been proposed as a model system for studying the effects of shear on Aβ within the brain because it offers a research environment that provides highly restrictive flow through very small dimension channels. A suggestion is made for the use of this system in exploratory anti-amyloid drug studies in which both the drug and Aβ are injected in the same solution so that both drug and Aβ are subjected to the same shear environment. Reduction in adsorbed Aβ is suggested as an indicator of effective anti-Aβ drugs.
INTRODUCTION
It was proposed in an early paper [1] that the reason for protein adsorption and aggregation on the inside wall of a very narrow bore capillary tube was aggregation of shear-distorted protein molecules. A series of papers [2–6] on the potential role of liquid shear on amyloid protein monomer aggregation and its possible in vivo and in vitro consequences suggest that amyloid-β (Aβ) might undergo inside wall irreversible adsorption on narrow bore steel needles, especially those used in spinal taps for monitoring Aβ in cerebrospinal fluid (CSF) in Alzheimer’s disease (AD) patients. This current paper reports experiments where, upon injection and after initiation of mobile phase flow, nearly 100% of the injected Aβ adsorbs either to stainless-steel walls or injection valve surfaces or both. However, some of this adsorbed Aβ is desorbed when mobile phase flow is stopped for a short period and then started again at the original flow rate, the amount depending on the flow rate. We are concerned that both reversible and irreversible adsorption to inside walls may be happening within stainless-steel needles used for AD patient spinal taps, in amyloid laboratory research involving Aβ solution transfer in microliter syringes, and in HPLC connecting tubing between the injection valve and the packed column. Therefore, we suggest experiments with such needles and tubing be performed similar to those reported in this paper to test for analytical errors arising from such adsorption.
Background
Because of the combined effects of limited solute diffusion and severe laminar flow sample distortion, an injected cylindrical plug protein sample under variable flow rates produces a chromatographic peak and a shoulder for one injected protein sample [3] instead of the symmetrical Gaussian anticipated peak to the right of the last chromatogram of Fig. 1. Theoretical calculations involving only diffusion and laminar shear patterns have confirmed experimental results and predict the same general trends shown in Fig. 1 [7, 8]. There is no reversible or irreversible sample wall adsorption of dissolved solutes assumed in these calculations, only reflection from the capillary wall upon collision with it.
Fig.1
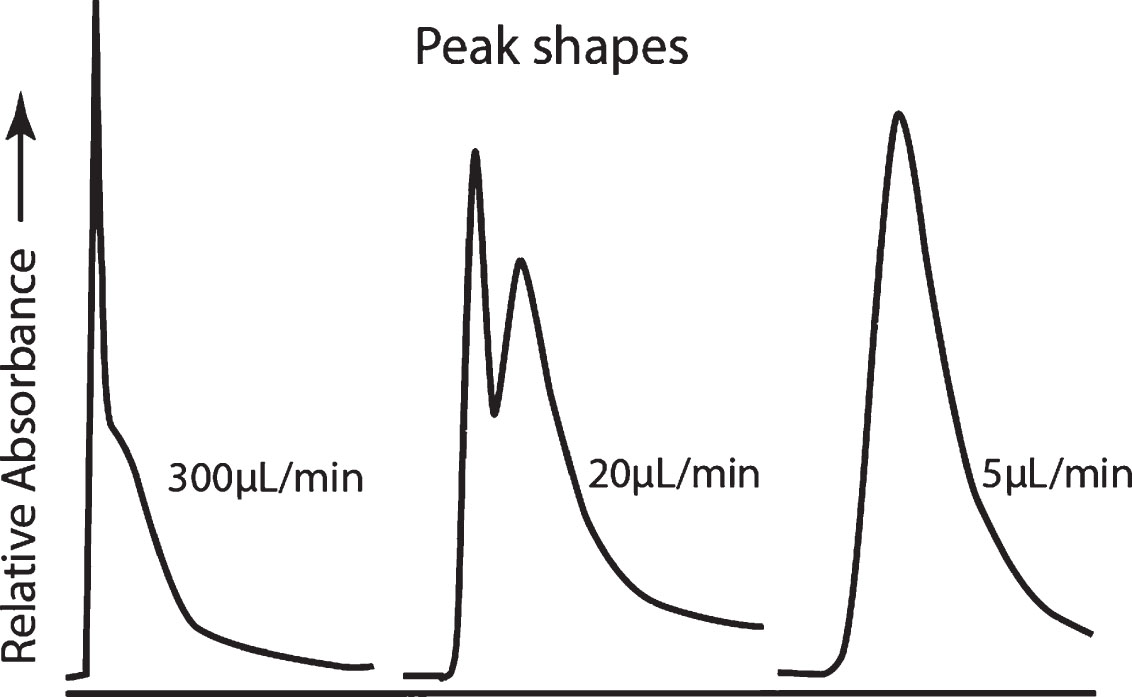
General chromatographic profiles of eluted solute during the passage of a laminar-flow-profile-distorted cylindrical plug of UV- absorbing liquid solute sample injected into a liquid mobile phase flowing through an empty capillary tube [3]. The only difference is in flow rate, which decreases in the above profiles from left to right. Alternatively, this same trend shows the effects of keeping the same flow rate as one injects samples with molecules of decreasing molecular weights and therefore increasing rates of diffusion.
![General chromatographic profiles of eluted solute during the passage of a laminar-flow-profile-distorted cylindrical plug of UV- absorbing liquid solute sample injected into a liquid mobile phase flowing through an empty capillary tube [3]. The only difference is in flow rate, which decreases in the above profiles from left to right. Alternatively, this same trend shows the effects of keeping the same flow rate as one injects samples with molecules of decreasing molecular weights and therefore increasing rates of diffusion.](https://content.iospress.com:443/media/jad/2019/72-3/jad-72-3-jad190522/jad-72-jad190522-g001.jpg)
The trends shown in Fig. 1 depend only on the flow rate and the amount of diffusion allowed, depending on the tubing length, and thus this same peak shape trend shows the effects of injecting samples containing various compounds of differing molecular weights and therefore of different diffusion coefficients, given the same experimental arrangement with the same flow rate.
The first peak is primarily that part of the flow-distorted cylindrical sample plug that resides in the center of the capillary where the protein solute has had little chance to diffuse to the capillary wall. The second peak or shoulder and following tail contains those injected sample molecules that have contacted the wall and, if there is no irreversible adsorption to the wall, diffuse back toward the center of the tube. In our early protein capillary experiments [1], every injected non-amyloid protein produced at least one peak and most of the time at least some shoulder under appropriate conditions. When injections of the same protein solution were repeated many times without cleaning the capillary after the preceding injection, this second peak or shoulder would often weaken or disappear, leaving only the first peak, implying increasing fractions of the injected protein are adsorbed on the inside surface of the capillary. Examination of the inside surface of the capillary confirmed this type of protein irreversible adsorption (Supplemental Material in [3]).
In addition to the observed protein adsorption on the inside surface of capillaries in the above studies [1], we also discovered unexpected “ghost peaks” in certain situations in unpublished studies [L.M. Jackson and C. N. Trumbore]. These “ghost peaks” would be produced if the flow was stopped, paused, and then started again after an initial injection and the complete anticipated passage of protein sample through the capillary. We believed that this was the result of relaxed, shear-induced, wall-adsorbed solid dissolving slowly back into the mobile phase after cessation of the mobile phase flow. We reasoned that some of this adsorbed protein remained adsorbed only because of the continued wall shear generated by the flowing liquid mobile phase and that when the flow stopped, shear also stopped, releasing the shear stress from the shear-adsorbed molecules, allowing them to migrate back into the mobile phase.
This same capillary system has been recommended [2–6] as a means of testing the effects of shear on Aβ and other amyloid systems. Because of the wide variety of proteins that gave results that implied similar shear-induced protein losses, it was predicted [3] that Aβ would undergo even more extreme adsorption because of its known high sensitivity to liquid shear. Several papers have reported on the initiation or enhancement of Aβ monomer aggregation during liquid shear [9, 10].
Here, we report brief preliminary experiments using Aβ for the first time as the sample protein in these types of capillary studies. We report these preliminary results in the hope that the amyloid research and clinical communities will carefully consider repeating and extending these experiments in their own laboratories because the results were so unexpected. Most important, in all experiments in there was greater than 99% Aβ adsorption. However, measurable amounts of Aβ-containing product were detected in three, not two, well-shaped peaks or a single peak with two shoulders, following mobile phase flow pauses and then resumption of flow. These sometimes fairly well separated peaks of unknown origin arose from flow through empty capillary tubes, not packed columns.
MATERIALS AND METHODS
A 10 mM solution of ammonium acetate (pH 6.8) was used as the mobile phase. A 50:50 methanol:water solution and a 50:50 methanol:water solution with 5% v/v acetic acid solution were used as tubing washes. All solutions were filtered using a Millipore filter, refrigerated and replaced with fresh solutions weekly.
Stock solutions of amyloid β1 - 40 were prepared in a manner similar to previous work [11]. 0.5 mg lyophilized amyloid β1 - 40 (Bachem, Bubendorf, Switzerland) was dissolved in 10 μL hexafluoroisopropanol (HFIP, Sigma-Aldrich) to create an 11.55 mM stock solution. This solution was vortexed at a low setting to disperse the peptide and collect the solution at the bottom of the tube, then separated into aliquots of 1 μL each and dried under air overnight. Films were stored in a freezer at –20°C. Less than 1 h before each series of injections, films were removed from the freezer and dissolved in 150 μL of the ammonium acetate mobile phase, then vortexed to create 20 μM Aβ1 - 40 samples for injections.
The 10 μL Aβ sample flowed through the injection port, then to an 18-cm stainless-steel capillary (Agilent part #G1313-87305 with an internal diameter of 0.17 mm) connected to a 30-cm long stainless-steel capillary (0.25 mm mm id) followed by the UV detector. Before analysis, new 30-cm long stainless-steel capillary tubing was left overnight filled with 1 M HNO3 to passivate the interior surface of the stainless-steel surface. The tubing was then rinsed thoroughly with MilliQ water. New 30-cm tubing was used for each flow rate analysis except in the case of the six successive injection runs without cleaning or rinsing. The mobile phase pump was an Agilent 1100 series HPLC with an Agilent 1100 autosampler G1367A, the needle assembly G1367-87201, seat assembly G1367-87101, and diode array UV detector. Column cleaning was performed by flowing 50:50 methanol:water with 5% acetic acid through the capillary at 2 mL/min. After 1 min, the flow of this cleaning solution was stopped for 5 min to induce diffusion of any material that could be adsorbed on the tubing walls. The flow was then restarted at 1 mL/min and allowed to flow for 1 min before switching to a solution of 50:50 methanol:water at 1 mL/min. This second cleaning solution was allowed to flow until a stable baseline absorbance was achieved. Upon stabilization, the ammonium acetate mobile phase was flowed through the capillary at 1 mL/min until a stable baseline absorbance was re-achieved, at which time the flow was switched to the experimental flow rate. After each experiment, the experimental capillary tubing was removed and the auto injector was directly connected to the UV detector, and the aforementioned tubing wash was repeated until re-equilibration with the mobile phase.
The needle and injection valve of the autosampler and 18 cm connector were cleaned using the following method: six needlefuls of MilliQ water were injected into the needle seat, followed by six needlefuls of ethanol, followed by another six needlefuls of MilliQ water. Following this procedure, six needlefuls of 50:50 methanol:water with 5% v/v acetic acid solution were injected into the needle seat, and the system was left to sit undisturbed for 5 min. After 5 min, another six needlefuls of 50:50 methanol:water with 5% v/v acetic acid solution were injected into the needle seat, followed by six needlefuls of 50:50 methanol:water solution, followed by six needlefuls of the mobile phase. After each injection, the needle was rinsed in MilliQ water six times, ethanol six times, MilliQ water six times, and then mobile phase six times.
For each flow rate at 20, 50, and 100 μL/min, 6 successive injections were performed. With the pump running at the experimental flow rate (20, 50, or 100 μL/min), the sample would be drawn into the auto injector needle at a rate of 10 μL/min to minimize shear. The sample was then injected into the capillary system via the needle seat and auto injector valve. UV detection of sample was performed at 214 nm. Flow was automatically set to stop at 5, 10, 15, or 20 min into the run (specified in Figs. 2 and 3) for 5–10 min (also specified in Figs. 2 and 3) to induce diffusion of metastable wall aggregates away from the capillary wall. The data in Fig. 4 were obtained with a system using an Isco syringe pump, a non-automatic injection valve, and a 30-inch stainless-steel column without the above 18-cm connector.
Fig.2
UV absorbance monitoring as a function of time of the effluent from two joined, very narrow bore stainless-steel capillary tubes, the first encountered by the sample being (0.17 mm id) and 18 cm long and the second being (0.25 mm id) 30 cm long, through which an injected, flow-distorted 10 μL cylindrical sample of 20 μM Aβ flows [3]. “Chromatograms” of three separate identical samples at three different flow rates are shown to the left: (a) 20 μL/min, (b) 50 μL/min, (c) 100 μL/min. The gray line in (b) is the result of a second identical injection following the first, without a column wash between the two injections. Note the three chromatograms have vastly different absorbance scales. After a certain time, the flow is stopped for the indicated period and then resumed at the initial flow rate, demonstrating that, at the faster flow rate, more UV absorbing material is released after a stopped flow period than comes through from the original injection prior to the stopped flow period. Perhaps most important, at the slower flow rates it would appear that nearly all of the Aβ is adsorbed to the capillary wall in a manner to that was different from that previously reported for other proteins (1). This adsorption process is highly flow rate dependent and is attributed to shear at the inner surface of the capillary wall.
![UV absorbance monitoring as a function of time of the effluent from two joined, very narrow bore stainless-steel capillary tubes, the first encountered by the sample being (0.17 mm id) and 18 cm long and the second being (0.25 mm id) 30 cm long, through which an injected, flow-distorted 10 μL cylindrical sample of 20 μM Aβ flows [3]. “Chromatograms” of three separate identical samples at three different flow rates are shown to the left: (a) 20 μL/min, (b) 50 μL/min, (c) 100 μL/min. The gray line in (b) is the result of a second identical injection following the first, without a column wash between the two injections. Note the three chromatograms have vastly different absorbance scales. After a certain time, the flow is stopped for the indicated period and then resumed at the initial flow rate, demonstrating that, at the faster flow rate, more UV absorbing material is released after a stopped flow period than comes through from the original injection prior to the stopped flow period. Perhaps most important, at the slower flow rates it would appear that nearly all of the Aβ is adsorbed to the capillary wall in a manner to that was different from that previously reported for other proteins (1). This adsorption process is highly flow rate dependent and is attributed to shear at the inner surface of the capillary wall.](https://content.iospress.com:443/media/jad/2019/72-3/jad-72-3-jad190522/jad-72-jad190522-g002.jpg)
Fig.3
Effects of six repeated injections of 20 μM Aβ at three different flow rates into the capillary system under the same stopped flow rate protocol described in Fig. 2. The sequence of injections is represented by the black line intensity, which decreases with increasing injection number. New 30-cm capillaries were prepared for each different flow rate, but there was no column treatment or cleaning between the 6 successive injection experiments. An important conclusion from these data is that slower flow rates cause the yields of all peaks to be diminished, implying that as the flow rate slowed, a larger fraction of the injected Aβ sample is adsorbed on the inner wall of the capillary and retained even after an extended stopped flow period. Also, decreased flow rates lower all peak heights in a nonlinear fashion. The inset in the 100 μL/min runs is the same data set for the post-stopped flow peaks using an expanded time scale and a reduced Absorbance scale to better illustrate the data trends.
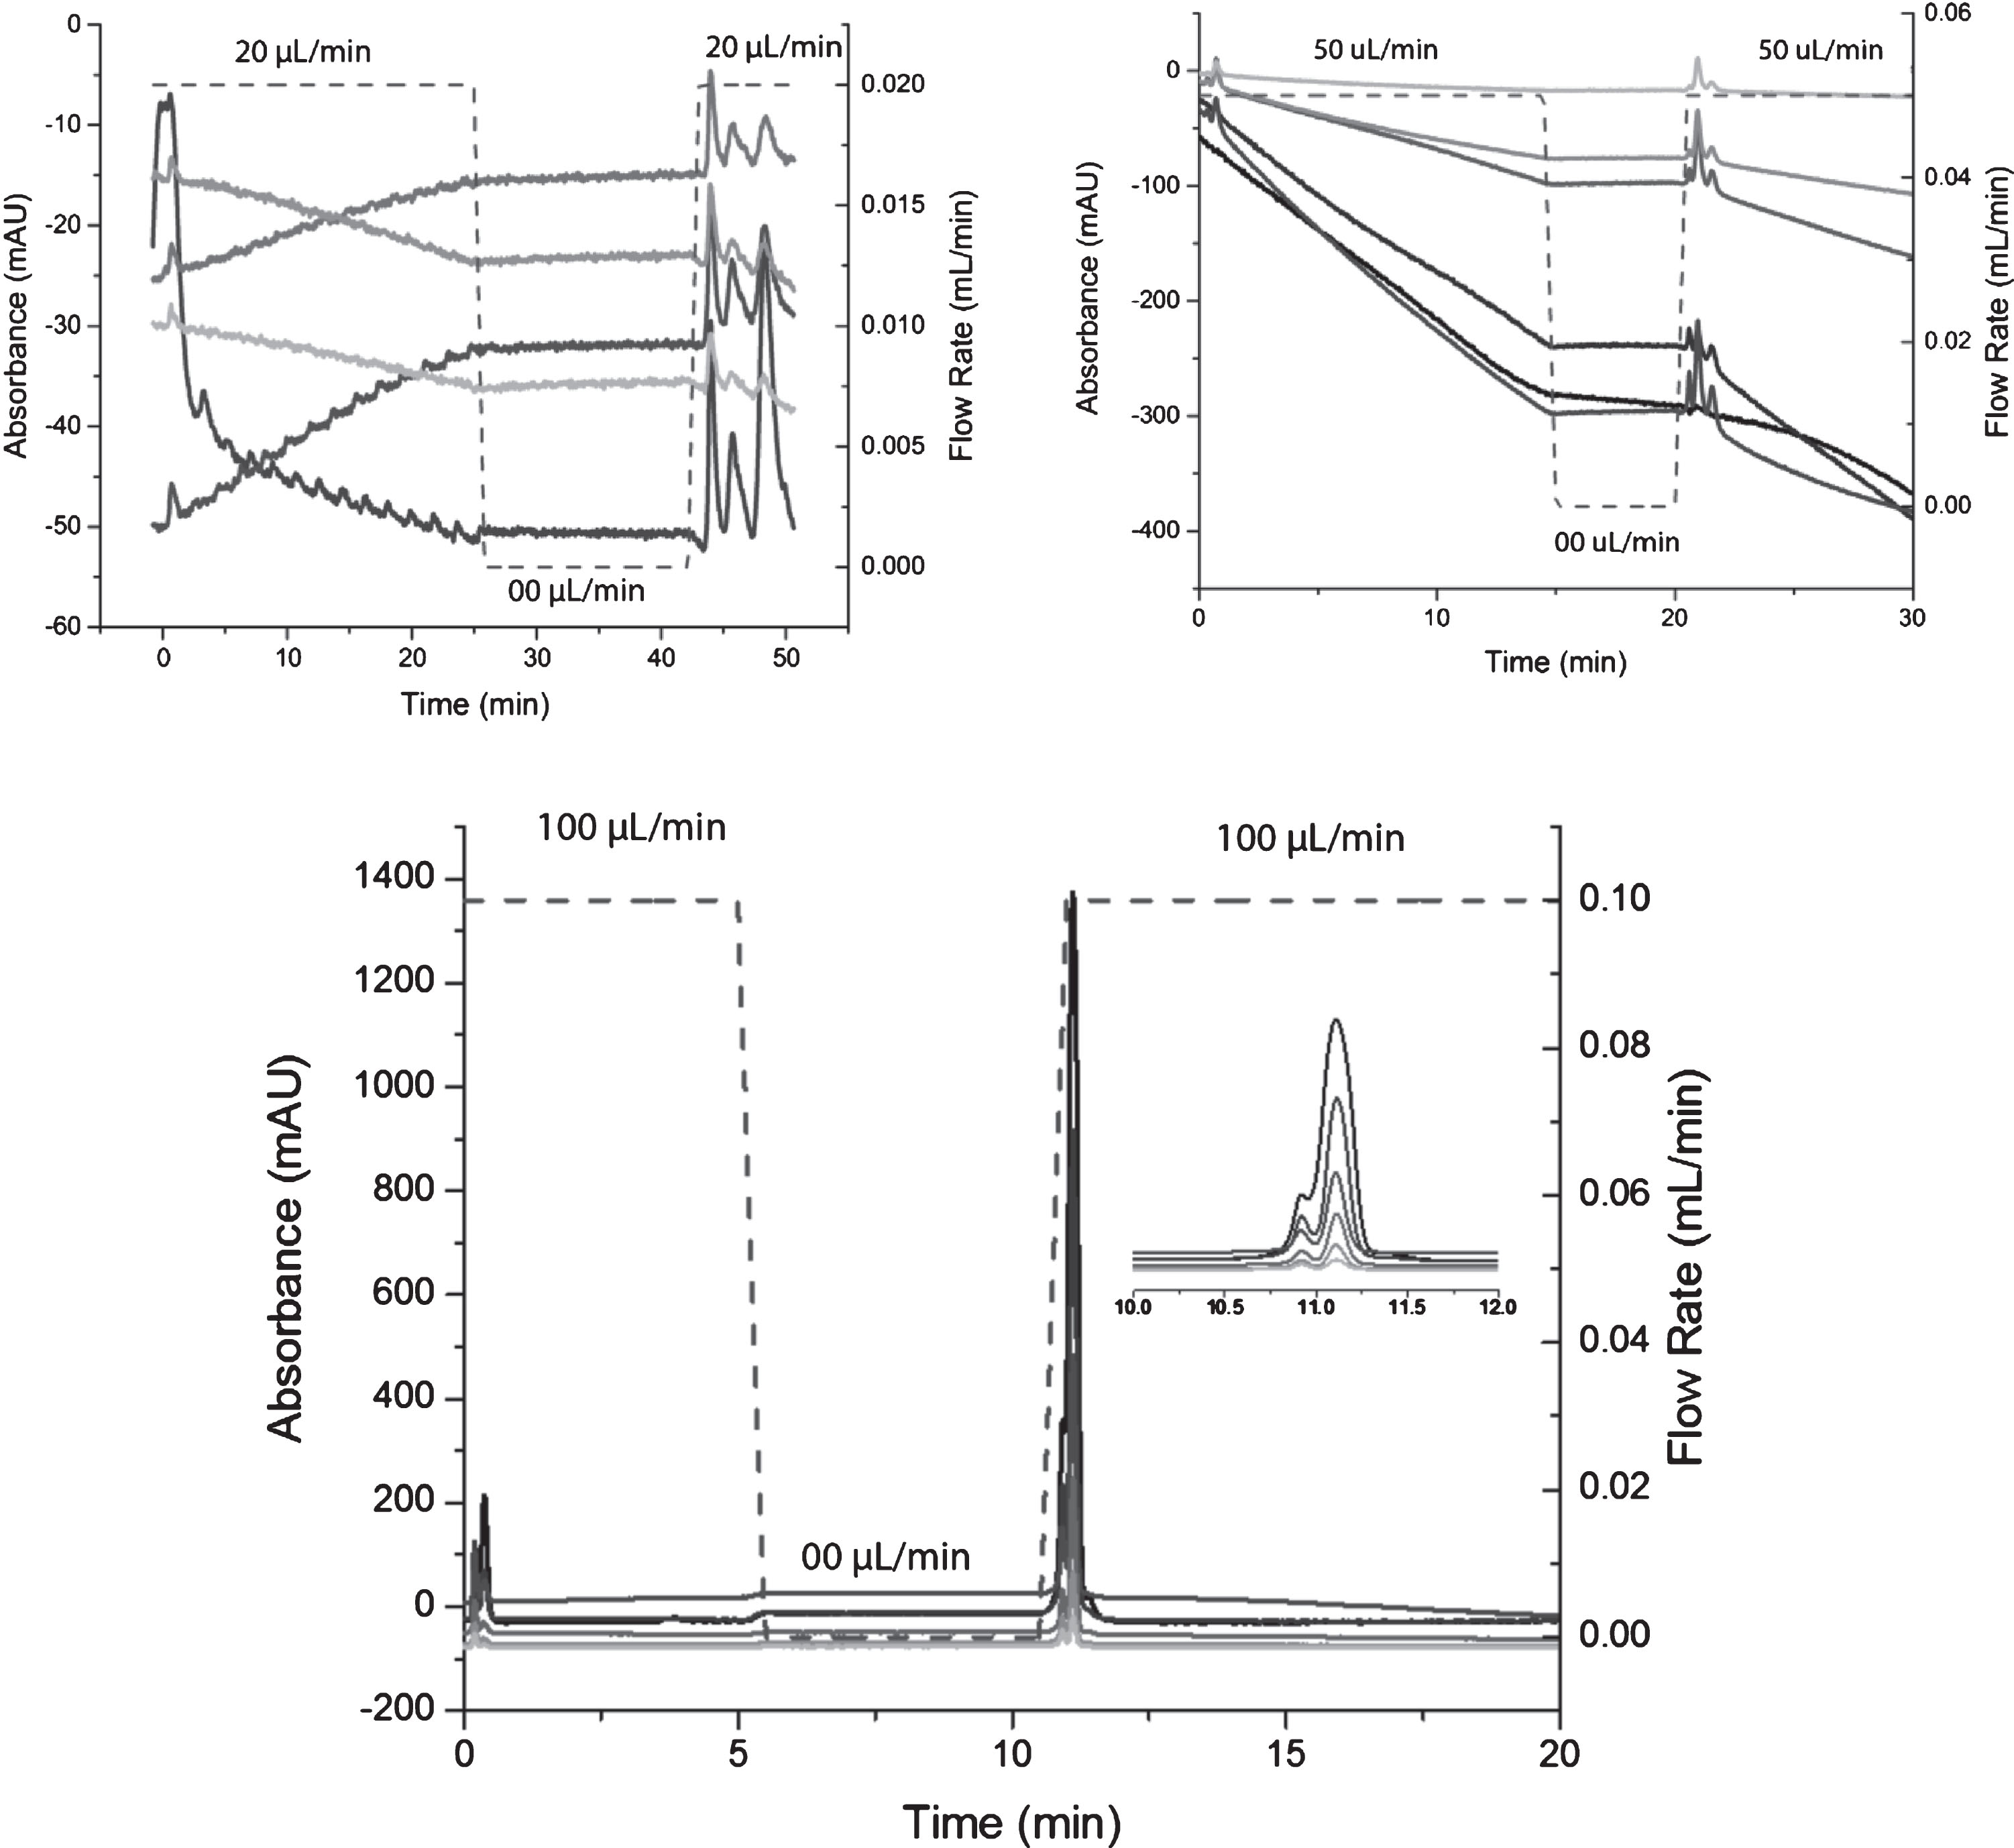
Fig.4
Comparative chromatographic peak shapes for plug injections of angiotensin I (Asp-Arg-Val-Tyr-Ile-His-Pro-Phe-His-Leu) into capillary tubing of similar dimensions and flow parameters as that used in Fig. 2. These results compare with anticipated peak shape changes in Fig. 1 in comparison with the results in Figs. 2 and 3.
RESULTS
In the capillary experiments with injected samples of amyloid-β (Aβ1 - 40) reported below, experimental conditions were such that the eluent chromatogram should resemble a peak and shoulder, similar to those on the left side in Fig. 1, if the experiments had been run on a 0.25 mm id 30-cm long stainless-steel capillary column alone. If there were significant Aβ wall adsorption, the shoulder would either be depleted or missing, especially with repeated injections without a column wash between injections. In such a case, we would have expected a first peak in the early injection effluent, representing the part of the plug sample that elutes within the central region of the distorted cylindrical sample. In the experiments reported below, preceding this 30-cm long column, the injected sample had to flow through a shorter, narrower 18 cm long 0.17 mm id stainless-steel capillary column with about one fourth the volume of the 30-cm column. This 18-cm column was an Agilent commercial HPLC connector.
Figure 2 shows data from single injection runs at mobile phase flow rates of 20, 50, and 100 μL/min demonstrating the capillary effluent UV absorbance versus time profiles using newly passivated 30-cm stainless-steel capillary columns not previously exposed to Aβ for each of the three runs. Surprisingly, especially at the lower flow conditions, we found only barely detectable effluent peaks (Fig. 2a, b), indicating that the majority of the Aβ sample had been adsorbed either in the injection valve or the capillary column or both. Operating on the assumption that there might be reversible, shear-induced wall adsorption of the sample and that the wall- or injection valve-adsorbed Aβ was possibly present in a shear-stabilized form, we stopped the mobile phase flow for 10 min (Fig. 2a) or 5 min (Fig. 2b, c) and then restarted it at the flow rate preceding the flow stop. Following the stopped flow restart period, UV-absorbing capillary effluent emerged, producing either three nearly separated peaks (Fig. 2a, b) or one large peak with shoulders on either side of it (Fig. 2c), depending on the mobile flow rates.
At each flow rate, six identical repeat injections of the same sample solution, without any column wash or cleaning between injections, generally yielded the same qualitative chromatographic pattern set by the first injection but, in general, with successive significant reductions in all peak heights with each sample injection. However, at the lower flow rates, all peaks were drastically reduced in size by an order of magnitude (Note the large difference in y-axis absorbance scales in the results in Figs. 2 and 3).
The most important conclusion from the data in Fig. 2 is that at slower flow rates, there is an approximately 5- to 50-fold decrease in peak heights and therefore a very strong, non-linear dependence on flow rate. Lowering the flow rate by a factor of 2 yielded an approximately 50-fold lower yield of UV-absorbing material flushed out following a zero flow period. Thus, increasing the flow rate significantly increased the recovery of Aβ-containing material and decreased the amount of Aβ trapped on the inner surface of the capillary systems after the flow pause period.
Chromatograms are shown at three different flow rates in Fig. 3 for six successive identical injection runs with no column cleaning. These were separately carried out at three different flow rates of 20, 50, and 100 μL/min. The peak height reduction with six successive injections at the 100 μL/min flow rate, followed an approximate exponential decay pattern (see plots in Fig. 5). That is, in general, repeat injections, without column wash or cleaning, gave smaller peaks in all respects with increasing injection number. These results implied that, after a large number of successive injections, all or nearly all injected Aβ would be trapped in the column or injection port and none would be released after a 5-10-min cessation of the mobile phase flow. At the lower flow rates, the data are qualitatively similar but do not follow the near-exponential decay pattern shown at 100 μL/min and were quantitatively drastically different. Peaks were dramatically lower at the lower flow rates. In general, yields of all peaks were lower, the lower the flow rate and the later the injection number. In all cases except the first injection at the lowest flow rate, eluate peaks were larger following the flow stoppage and flow return. Prior to the flow stoppage, the early small peaks could have been due to impurities present in the injected Aβ solution or higher molecular weight aggregates formed by shearing processes during preparation of the Aβ samples for these experiments.
Fig.5
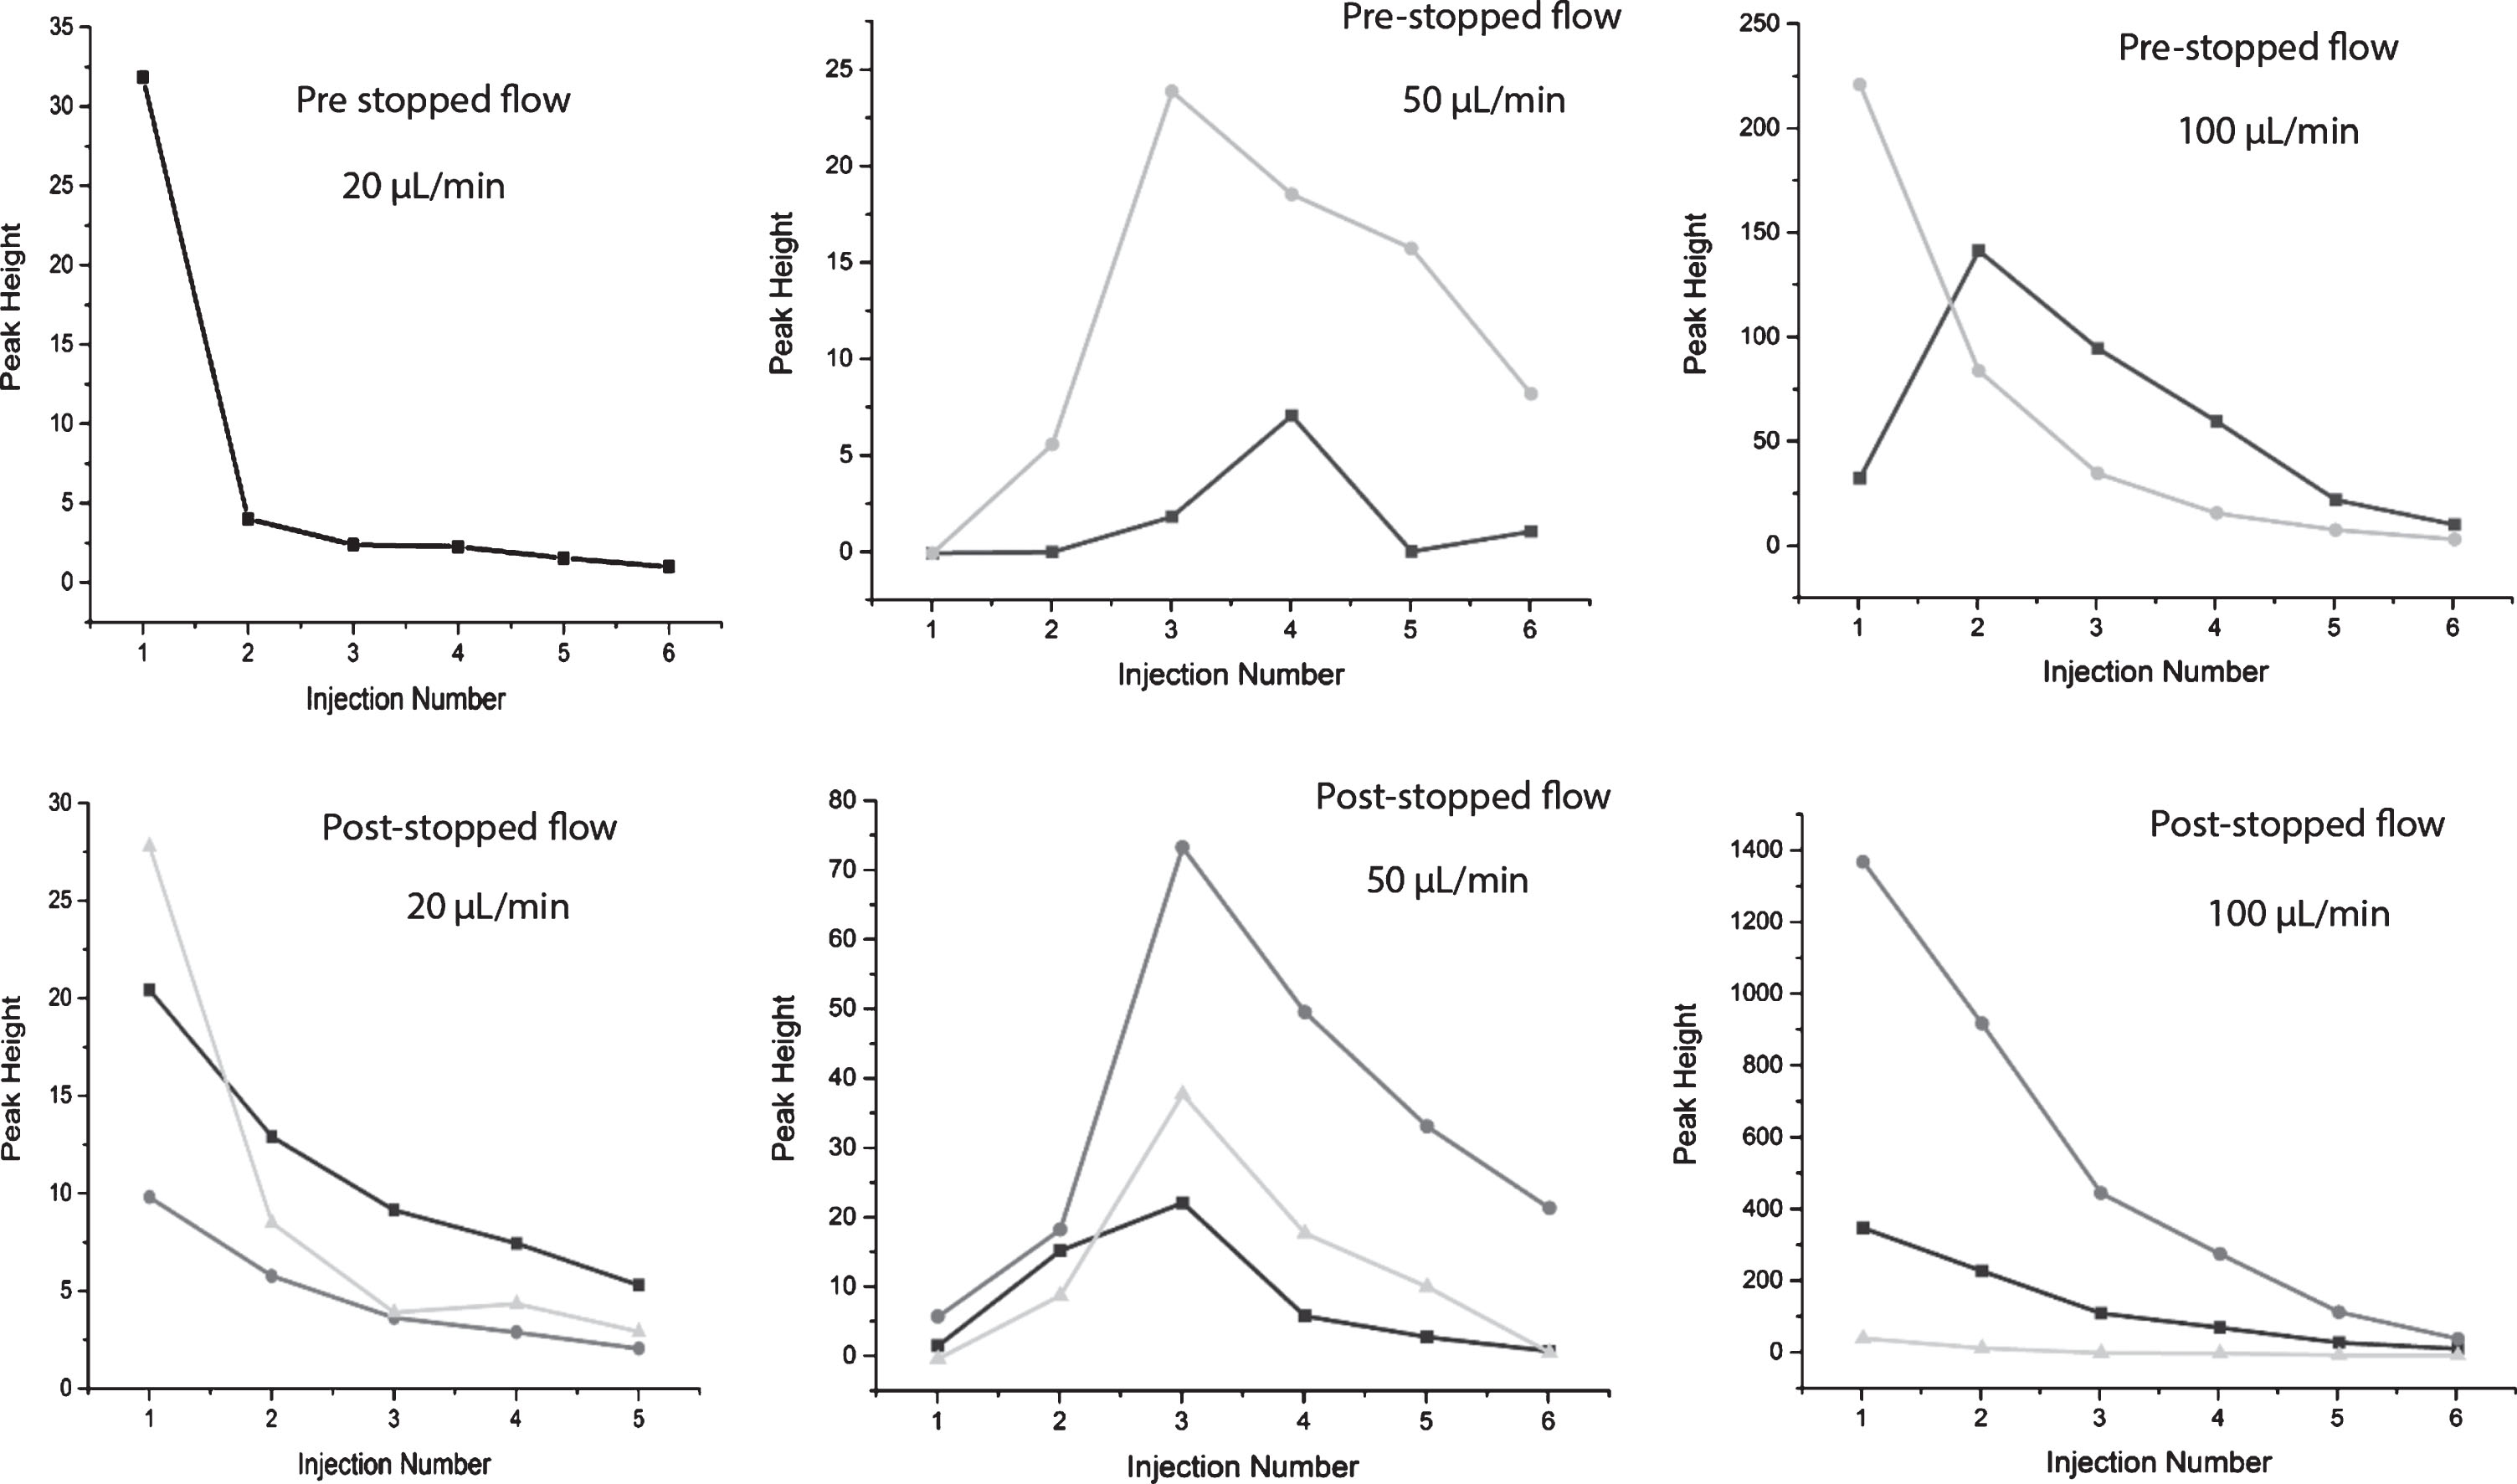
Relative peak height trends in Fig. 3 as a function of mobile phase flow rate and injection sequence number. Two sets of peaks are represented, those that emerge before the stopped flow period and those that emerge following a 5 or 10 min pause in mobile phase flow.
The results from Figs. 2 and 3 are qualitatively unexpected and different from those published in our earlier paper [1] and those obtained more recently with a similar capillary system to that used for the lower molecular weight protein, angiotensin I, shown in Fig. 4. The smaller inner diameter (0.17 mm) connector was not present in this experimental arrangement, but the 30 cm (0.25 mm id) was identical with that used for the Aβ experiments, and the Autoinjector was not used.
Peak trends with repeat injections without column washing
Although there are somewhat different overall trends seen in Fig. 5 in relative pre- and post-stopped flow peak heights in a given run at one flow rate, there is only a downward trend in peak height after the third or fourth sample injection without washing the column. Since decreasing heights indicate a larger percentage of irreversible adsorption to the inner capillary wall, it would appear that each successive adsorbed layer, after a critical point, forms a more stable aggregate layer than initial layers. And each layer, once adhered, is less prone to drift back into the mobile phase after release of the shear and is more prone to irreversibly adsorb the next layer.
Data summary
1) At all three flow rates, after the first Aβ sample injection but prior to a mobile phase flow stop, a negligible amount of UV absorbing solute emerged from the capillary column. The length of time the capillary effluent was monitored before the flow stop was sufficient so that all injected Aβ should have entirely exited the column if there had been no adsorption of the Aβ while under these flow conditions.
2) We suggest that during the periods of Aβ sample loading into the injection loop, Aβ sample injection into the capillary, and very early Aβ sample flow through the capillary, the majority of the Aβ in the injected sample was adsorbed on the wall of the 18-cm capillary wall and/or injection valve. This suggestion is because of the well-defined character of the three post-stopped flow peaks. Their shapes indicate that they contain high molecular weight compounds that have limited diffusion times and that the post-stopped flow sample comes from a limited segment zone of the two capillaries or from the injection valve region.
3) While the mobile phase was flowing, some portion of the adsorbed Aβ was retained in an unstable, flow rate-dependent adsorbed and possibly shear-distorted state. Upon repeated injections, lowered peak heights in Fig. 3 in successive injections demonstrate that the fraction of the injected sample adsorbed in the capillary increased with injection number. In all cases, at higher injection numbers, this fraction was increasing to a limit of an adsorbed fraction of 1.0. That is, ultimately, upon repeated injection, nearly all Aβ injected in this type of repeated injection experiment would be adsorbed to the wall and remain there after a short flow-stop period followed by resumed flow.
4) It is assumed that even though some Aβ-containing compounds are released back into the mobile phase during the stopped-flow period, there must be some remaining adsorbed sample that attracted a larger fraction of sheared Aβ molecules to the wall during the next injection. Otherwise, the repeated injections should yield the same pattern each time. Instead, the fraction of UV-absorbing material not exiting the column increases. This observation implies that the increased loss from this injected sample was due to the consequences of the previous injection, i.e. an increase in the amount of adsorbed Aβ resulting in a more flow-stable adsorbate.
Tentative interpretations of results
Based upon previous published papers [1–6] and hypotheses contained therein, we suggest the following observations:
a) According to Figs. 1 and 4, injection of a cylindrical plug of Aβ solution into a capillary of the given flow geometry and flow rates in this paper should yield capillary exit chromatograms consisting one peak and a shoulder [3]. The shapes of most of the very small initial peaks in the Figs. 2 and 3 are difficult to analyze. The initial peaks in the 100 μL/min chromatograms are not clearly recognizable as those anticipated from Fig. 1 and may be due to impurities.
b) One possible interpretation of the complex pre- and post-stopped flow peaks involves the different densities of collisions of Aβ resulting in adsorption with the inner capillary wall surface at the different flow rates. At low flow rates, Aβ diffusion from the sample to the wall is more localized, allowing multiple Aβ collisions in the same region, possibly resulting in the formation of adsorbed Aβ oligomers in a confined region. As the flow rate is increased, the density of such collisions is reduced, increasing the number of lower molecular weight Aβ oligomers formed over a larger surface region. The higher molecular weight oligomers are much less soluble. However, the lower molecular weight oligomers become solubilized when the flow stops, possibly because they are shear induced, metastable states. Multiple injections increase the molecular weight of these shear adsorbed oligomers, making them more stable and insoluble. The chemical and/or physical character of the wall aggregate appears to be changing with successive layers. However, a complicating factor is the increasing shear rates at and near the wall surface with increased flow rates. Experiments separating these two factors are needed.
c) The three post-stopped-flow peaks are puzzling, since there are no published theories for chromatographic separations resulting from an injected sample plug flow through an empty capillary tube. There are a number of unorthodox explanations for the appearance of three post stopped-flow peaks, each involving metastable shear-trapped adsorbates. One might be that there are shear-induced reversible adsorption events in three different locations of the capillaries. Another might be that there are three different layers or types of adsorbed molecules in the same location around the injection port, releasing from the surface at different times. Or there may be two or three groups of varying molecular weight oligomers that have different diffusion characteristics from the wall. Other explanations are being explored, but await identification of the chemical identity of the contents of each peak.
d) Since there has been no molecular analysis of the material exiting the capillary, the identity of this UV-absorbing material is not known but it may consist of Aβ, dimers, trimers, other oligomers, or higher molecular weight aggregates or some combination of all of these. Analysis of effluent aliquots is obviously needed but is not currently possible by the authors of this paper.
DISCUSSION
Implications from these results in the clinical setting and research laboratory
There are several research and clinical implications of this short exploratory study of the near complete adsorption of Aβ in narrow capillary tubing and its partial release upon flow stoppage. Previous papers [3, 4, 6] have urged clinical researchers to undertake studies similar to those reported here, especially with Aβ, studies in which our stainless-steel capillaries are replaced by needles used in clinical spinal taps as well as experiments done under a clinical setting. The results reported here with Aβ far exceed our previous expectations of the potential complications that shear might bring to the spinal tap clinical results. Spinal tap needles are of almost identical inner diameters as those used in this and previous research with other proteins revealing inner wall protein adsorption. Clinical CSF spinal tap flow rates are approximately equal to or exceed those used in our experiments. More detailed suggestions for clinical experiments are found elsewhere [3, Supplemental Material] or can be obtained from the corresponding author (CNT). The primary point here is to suggest experiments with Aβ be conducted in a clinical setting with variable flow rates of the CSF fluid exiting from the spinal fluid tap needle so as to prevent wall aggregation of Aβ as well as other potentially shear-sensitive CSF proteins. In particular, it is suggested that spinal tap experiments be performed with back pressure applied to the tap needle while obtaining the sample in order to minimize possible sharp CSF pulses that might significantly increase the shear during the sampling and to control the CSF flow rate.
In the amyloid research laboratory, microliter syringes are in daily usage for critical handling of amyloid monomers and oligomers. The inner bores of these syringes are on the same order of magnitude as that of the narrow bore stainless-steel connecting tubing used in our shear studies. In many cases, flow rates are probably faster than those in our experiments. There may be Aβ solute adsorption problems with microliter-syringes similar to those postulated above for spinal tap needles and the experiments reported here. Again, it is suggested that experiments be done to check for such potential error-causing amyloid steel wall adsorption. It is possible that in both clinical and research laboratories the types of stainless-steel surfaces are different because of factory treatment.
The first section of the capillary tubing pair used in our experiments was a commercial HPLC coupling designed to connect the injection valve to HPLC packed columns. We believe that at least some of and perhaps all of the initial adsorption of Aβ in our experiments reported here was in this commercial tubing. The negative implications for HPLC of amyloid formation on tubing surface is obvious. The smaller inner diameter of this tubing may be responsible for enhanced adsorption within this first of two sections of capillary tubing in our experiments. HPLC losses of amyloid monomers are privately shared among researchers but rarely reported because it is expected that adsorption is to the HPLC packing and is therefore unavoidable. Using wider bore tubing may solve this problem, although the tradeoff is in lower HPLC resolution.
Proposal for the study of anti-amyloid drugs under shear conditions
Given the experimental results in Figs. 2 and 3, we suggest that the capillary system described in these studies could also be used to study the effects of anti-amyloid drugs or other compounds such as chaperones under shear conditions. The question raised is, doesn’t a sheared in vivo environment shear not only dissolved Aβ, but also the companion in vivo anti-Aβ drug or chaperone?
When an Aβ solution plug is injected into our capillary system [3] and subjected to flow, we report here that nearly all of the Aβ is attached at least during mobile phase flow to the treated capillary or injection valve wall. Anti-amyloid drugs are designed to interfere with the formation of toxic oligomers. Thus, an injection of a sample plug containing a mixture of Aβ and a proposed anti-amyloid drug, antibody, or chaperone [12] would place all of these molecules initially near each other in the wall region generating the highest shear during periods of liquid flow. During flow, this is the exactly the natural shear environment that the corresponding author of this paper (CNT) has suggested [3, 4] be used in anti-amyloid drug studies, especially if the drug, antibody, or Aβ-chaperone complex is itself shear-sensitive. Our experimental capillary arrangement could serve as a more realistic test of the anti-amyloid substance, since the in vivo Aβ target and drug are probably both present within a shear environment near a shear-generating surface.
If there is a productive collision between shear-extended Aβ and shear-altered anti-amyloid agent forming a soluble product, that would prevent the formation of an adsorbed amyloid oligomer, this would diminish Aβ aggregation and more Aβ molecules would be prevented from being adsorbed. Therefore, soluble Aβ-containing product would flow through the capillary, and be detected as capillary effluent. If the anti-amyloid concentration is increased, there should be more Aβ containing molecules making a full transit through the capillary and could be detected by mass spectrometry. Thus, increasing concentration of the anti-amyloid drug causing the increased prevention of Aβ wall adsorption during the initial injection phase could help screen and possibly predict the in vivo effectiveness of the drug. However, it would also be interesting to study the effect of the anti-amyloid agent on Aβ adsorption in subsequent injections without washing out the previously adsorbed Aβ.
ACKNOWLEDGMENTS
JP wishes to acknowledge the help of Blaise Arden and Tyler Marcinko and wishes to thank the UMass Amherst Commonwealth Honors College for a grant.
Authors’ disclosures available online (https://www.j-alz.com/manuscript-disclosures/19-0522r2).
REFERENCES
[1] | Trumbore CN , Tremblay R , Penrose J , Mercer M , Kelleher F ((1983) ) Unusual flow behavior in high-performance liquid chromatography capillary tubing. J Chromatogr 280: , 43–57. |
[2] | Trumbore CN ((2016) ) Shear-induced amyloid formation in the brain. I. Potential vascular and parenchymal processes. J Alzheimers Dis 54: , 457–470. |
[3] | Trumbore CN ((2017) ) Shear-induced amyloid formation in the brain II. An experimental system for monitoring amyloid shear processes and investigating potential spinal tap problems. J Alzheimers Dis 59: , 543–557. |
[4] | Trumbore CN ((2018) ) Shear-induced amyloid formation in the brain: III. The roles of shear energy and seeding in aroposed shear model. J Alzheimers Dis 59: , 543–557. |
[5] | Trumbore CN ((2018) ) Shear-induced amyloid formation in the brain: IV. Liquid shear in synase regions near senile plaques. J Alzheimers Dis 66: , 57–73. |
[6] | Trumbore CN ((2019) ) Shear-induced amyloid formation of IDPs in the brain. In Dancing protein clouds: Intrinsically disordered proteins in health and disease, Part A, Progress in Molecular Biology and Translational Science, Volume 166: , UverskyVN, ed. Elsevier Inc., pp. 225–309. |
[7] | Shankar A , Lenhoff AM ((1989) ) Dispersion in laminar flow in short tubes. AIChE J 35: , 2048–2052. |
[8] | Shankar A , Lenhoff AM ((1991) ) Dispersion in round tubes and its implications for extra-column dispersion. J Chromatogr 556: , 235–248. |
[9] | Dunstan DE , Hamilton-Brown P , Asimakis P , Ducker W , Bertolini J ((2009) ) Shear flow promotes amyloid fibrilization. Protein Eng Des Sel 22: , 741–746. |
[10] | Cohen SIA , Linse S , Luheshi LM , Hellstrand E , White A , Rajah L , Otzen DE , Vendruscolo M , Dobson CM , Knowles TPJ ((2013) ) Proliferation of amyloid-42 aggregates occurs through a secondary nucleation mechanism. Proc Natl Acad Sci U S A 110: , 9758–9763. |
[11] | Stine WB , Jungbauer L , Yu C , LaDu MJ ((2011) ) Preparing synthetic Aβ in different aggregation states. Methods Mol Biol 670: , 13–32. |
[12] | Mannini B , Chiti F ((2017) ) Chaperones as suppressors of protein misfolded oligomer toxicity. Front Mol Sci 10: , 98. |


