
Interplay Between Macular Retinal Changes and White Matter Integrity in Early Alzheimer’s Disease
Abstract
This study aims to investigate the relationship between structural changes in the retina and white matter in the brain, in early Alzheimer’s disease (AD). Twenty-three healthy controls (mean age = 63.4±7.5 years) and seventeen AD patients (mean age = 66.5±6.6 years) were recruited for this study. By combining two imaging techniques—optical coherence tomography and diffusion tensor imaging (DTI)—the association between changes in the thickness of individual retinal layers and white matter dysfunction in early AD was assessed. Retinal layers were segmented, and thickness measurements were obtained for each layer. DTI images were analyzed with a quantitative data-driven approach to evaluating whole-brain diffusion metrics, using tract-based spatial statistics. Diffusion metrics, such as fractional anisotropy, are markers for white matter integrity. Multivariate and partial correlation analyses evaluating the association between individual retinal layers thickness and diffusion metrics were performed. We found that axial diffusivity, indexing axonal integrity, was significantly reduced in AD (p = 0.016, Cohen’s d = 1.004) while in the retina, only a marginal trend for significance was found for the outer plexiform layer (p = 0.084, Cohen’s d = 0.688). Furthermore, a positive association was found in the AD group between fractional anisotropy and the inner nuclear layer thickness (p < 0.05, r = 0.419, corrected for multiple comparisons by controlling family-wise error rate). Our findings suggest that axonal damage in the brain dominates early on in this condition and shows an association with retinal structural integrity already at initial stages of AD. These findings are consistent with an early axonal degeneration mechanism in AD.
INTRODUCTION
Alzheimer’s disease (AD) is a neurodegenerative disorder and the most common form of dementia in older adults. Its incidence increases exponentially with age. Disease hallmarks include plaques, composed of amyloid-β, and tangles, composed of hyperphosphorylated tau [1]. AD pathology starts much before the clinical manifestations of dementia [2].
Therefore, there is an urgent need to find biomarkers for different pathological processes involved in this disease, preferentially involving non-invasive techniques. Optical coherence tomography (OCT) is a non-invasive technique for cross-sectional imaging of the internal retinal structure. Since the retina develops as an extension of the central nervous system, it has been previously described as an in vivo window to the brain in some neurodegenerative diseases, including AD [3]. Many AD patients suffer from complex visual problems, and the severity of these deficits correlates with lower scores in clinical dementia rating [4–6]. Several studies have reported a significant decrease in the mean overall peripapillary retinal nerve fiber layer (RNFL) thickness in patients with AD and also mild cognitive impairment (MCI) [7], while Kromer and colleagues report a reduction only in the nasal superior sector in mild to moderate stages of AD [8].
However, other studies have questioned the clinical usefulness of peripapillary RNFL thickness, finding no difference between AD, MCI, and healthy controls [9]. Moreover, no differences were found concerning macular and peripapillary RNFL thickness in early-onset AD [10].
Regarding other retinal layers, Cheung and colleagues reported reduced ganglion cell layer (GCL)-inner plexiform layer (IPL) joint thickness in all retinal in all quadrants in AD, with similar results in MCI, suggesting pathological changes in the retina start at early stages of AD [11].
Although visual deficits in AD patients have been historically attributed to degenerative damage in primary and associative visual cortical areas, these are not easily explained only by visual cortex dysfunction [12–14]. This may hint at other mechanisms contributing to the general visual problems that occur during AD [15].
Pathological white matter (WM) changes have been documented in at least 50% of patients with AD postmortem [16], and recent MRI studies have provided further evidence of WM abnormalities in AD [17, 18].
Diffusion tensor imaging (DTI) can be used to calculate diffusion metrics—fractional anisotropy (FA), mean diffusivity (MD), radial diffusivity (RD), and axial diffusivity (DA)—based on the three diffusion eigenvectors. These indices are indirect and sensitive markers of WM integrity. A recent meta-analysis of DTI in AD revealed that microstructural alterations in WM are widespread throughout the brain in this disease [19].
However, studies assessing OCT measurements together with other biomarkers of neurodegeneration in AD are scarce [20]. In this study, we aim to investigate the relation between the integrity of individualized retinal layers and WM tract integrity in the AD brain, evaluating these biological and structural changes at the same point in time in patients diagnosed with AD at a relatively early disease stage. We used tract-based spatial statistics (TBSS) in order to assess whole-brain diffusion metrics, and OCT to measure retinal layers’ thickness, using spectral-domain OCT and a recent algorithm for semi-automated segmentation of retinal layers [21–23].
MATERIALS AND METHODS
Participants
Forty participants were recruited for this study. All participants in the study gave their written informed consent, approved by the Ethics Committee of the University of Coimbra. Participants had no history of ocular diseases and were submitted to a comprehensive ophthalmological examination to guarantee the absence of any visual complication, which comprised visual acuity assessment with Snellen chart, ocular tension (Goldmann applanation tonometer), slit lamp biomicroscopy, and OCT imaging. Only subjects with normal or corrected to normal vision (visual acuity ≥8/10), with refractor error between±5 dioptres, with intraocular pressure ≤21 mmHg, and without apparent alterations of the optic disc or macula, were recruited.
The clinical group comprised 17 individuals with early AD diagnosis (less than 2 years) recruited and prospectively evaluated by a neurologist (BS and IS), at the Memory Clinic of the Neurology department of the Centro Hospitalar e Universitário de Coimbra (CHUC). The standard criteria for the diagnosis of AD were the Diagnostic and Statistical Manual of Mental Disorders – fourth edition (DSM-IV-TR) [24] and the National Institute of Neurological and Communicative Disorders and Stroke- Alzheimer’s Disease and Related Disorders (NINCDS-ADRDA) [25].
In order to accomplish these criteria, the diagnostic investigation comprehended a standard clinical evaluation, an extensive cognitive and staging assessment, laboratory tests, imaging studies, and Apolipoprotein E allele genotyping. For this project, we further selected AD patients with a probable diagnosis supported by biological biomarkers (cerebrospinal fluid (CSF) or PiB-PET) and patients in mild stages, according to the global staging scale Clinical Dementia Rating (CDR = 1) [26]. Considering the neuropsychological evaluation, a comprehensive battery was administered, including: Cognitive instruments as the Mini-Mental State Examination (MMSE) with Portuguese normative data [27, 28], the Montreal Cognitive Assessment (MoCA) [29, 30], and a comprehensive neuropsychological battery with normative data for the Portuguese population (BLAD) [31] exploring memory and other cognitive domains.
MRI was considered to support AD diagnosis whenever a dominant pattern of hippocampal and/or posterior parieto-temporal atrophy was present, using visual rating scores. Volumetric analysis is also available but not used for diagnosis in this investigation. CSF samples were collected after a fasting and resting period of 8 h. Pre-analytical and analytical procedures were done in accordance with previously proposed protocols [32].
Briefly, CSF samples were collected in sterile polypropylene tubes, immediately centrifuged at 1,800 g for 10 min at 4°C, aliquoted into polypropylene tubes and stored at –80°C until analysis. CSF Aβ1–42, Aβ1–40, tau, and pTau181 were measured in duplicate, by commercially available sandwich ELISAs (Innotest, Innogenetics/Fujirebio, Ghent, Belgium), as previously described [33]. External quality control of the measurements was performed under the quality control scheme of the Alzheimer’s Association Quality Control Program for CSF Biomarkers [34]. CSF biomarkers were classified as normal/abnormal according to previously reported laboratory reference values [35]. Briefly, we used CSF samples (n = 35) from neurological controls (10 male, 25 female; age = 57.3±11.9 years). Most of these individuals suffered from acute or chronic headaches, and a lumbar puncture was performed as part of their routine diagnostic evaluation in order to exclude bleeding or inflammation; in some cases this procedure was considered in the investigation of a peripheral polineuropathy. In both cases, the CSF cytochemical evaluation was normal and a major CNS disease excluded. They had no subjective cognitive complaints and were independent in their instrumental daily life activities, and most of them were still professionally active. The cut-off values used in our laboratory, and applied in this work, were: 580 pg/mL for Aβ1–42, 0.068 for Aβ42/Aβ40, 250 pg/mL for tau, and 37 pg/mL for pTau181 (Table 1).
Table 1
CSF biomarker levels of AD patients
| Aβ1–42* (n = 17) | Aβ42/Aβ40* (n = 14) | Tau* (n = 17) | pTau* (n = 17) | Tau/Aβ42* (n = 17) | Aβ42/pTau* (n = 17) | |
| Mean | 510.94 | 0.057 | 445.64 | 63.15 | 0.98 | 9.32 |
| SD | 215.00 | 0.021 | 246.80 | 24.36 | 0.52 | 6.28 |
*Normal values: Aβ42 > 580 pg/mL; Aβ42/Aβ40 > 0.068; Tau < 250 pg/mL; pTau (181) < 37 pg/mL; Tau/Aβ42 < 0.40; Aβ42/pTau > 15.8.
We considered that patients had to be in a stable condition, without acute significant events or recent/undergoing changes in medication, and we defined as exclusion criteria ophthalmological comorbidities or neurological/psychiatric conditions other than AD, or MRI demonstration of significant vascular burden (large cortico-subcortical infarct; extensive subcortical WM lesions superior to 25%; uni- or bilateral thalamic lacune; lacune in head of caudate nucleus; more than 2 lacunes) [36].
The collected data included age, gender, visual acuity, MoCA [29], and CDR [37]. Given that we required normal or near normal visual acuity (>0.8) and intraocular pressure data on these measures reflect such stringent inclusion criteria. Visual acuity data were as follows: AD patients: 0.90±0.22 SEM; Controls:= 0.96±0.17 SEM. Intraocular pressure were as follows (below the cutoff or 21 mmHg): 16.2±1.1; Controls:= 14±0.53.
The control group was composed of age- and gender-matched individuals from the community, with no history of cognitive deterioration, neurological or acquired CNS disorders, traumatic brain injury, or psychiatric disorders. The controls were also screened for retinopathies or retina injuries secondary to other factors and severe visual or auditory impairment. They were not subject to medication that could interfere with the study nor had previous or current alcohol abuse or other substance abuse, or other conditions that could preclude MRI.
The control group was also submitted to a brief cognitive assessment to exclude the presence of cognitive impairment. Therefore, the individuals in the control group had no significant memory complaints (assessed by an SMC scale), a normal general cognitive function (assessed by MoCA), preserved daily living activities (assessed by Lawton & Brody scale), and no evidence of depressive symptoms (measured by Geriatric Depression Scale).
Medical history of healthy controls was obtained by an interview preceding assessment. Visual acuity testing was performed monocularly in all participants, using the Snellen acuity chart.
MRI acquisition
All MRI acquisitions were performed on a 3 Tesla Siemens Magnetom TrioTim scanner (Erlangen, Germany) at the Institute of Nuclear Sciences Applied to Health (ICNAS) using a 12-channel birdcage head coil.
One high-resolution T1-weighted three-dimensional Magnetization Prepared Rapid Acquisition Gradient Echo (MPRAGE) was acquired, with repetition time (TR)/echo time (TE)/inversion time (TI)/ flip angle = 2530 ms/3.42 ms/1100 ms/7°, a FOV (field of view) of 256 ×256 mm with a matrix size of 256×256, 176 sagittal slices with voxel resolution 1.0×1.0×3.0 mm3 and a total time of acquisition (TA) = 6 min 3 s.
The DTI sequence had TR/TE/number of excitations (NEX) = 7800 ms/90 ms/1; matrix, 96×96×63 contiguous axial slices; isotropic voxel resolution of 2×2×2 mm3; bandwidth of 1628 Hz/pixel and echo spacing of 0.72 ms. The diffusion tensor was acquired along 63 non-collinear directions (b = 1000 s/mm2), with one scan without diffusion weighting (b = 0 s/mm2, b0). Generalized autocalibrating partially parallel acquisitions (GRAPPA) were used to reduce the scanning time to around 9 min.
MRI analysis
DTI images were processed using Oxford University’s FMRIB Software Library (FSL, http://www.fmrib.ox.ac.uk/fsl) version 5.0.9, on a Linux-based platform, following the TBSS pipeline. TBSS is a whole-brain, automated and observer-independent method that allows for statistically powerful analyses [38].
Initially, eddy current distortions (induced by the alternating magnetic field) and motion artifacts were corrected, and extracerebral tissue was removed. Diffusion tensors were fitted to each voxel, and quantitative measures of FA, MD, RD, and DA were derived voxel-wise for each participant.
The FA images were then non-linearly registered to a 1×1×1 mm3 standard space image (FMRIB58_FA) and averaged. A threshold of FA >0.2 was applied to the resulting mean FA image when creating the thinned mean FA skeleton, to exclude non-WM voxels. The remaining diffusion metrics data were processed similarly, using the nonlinear warps and skeleton projections attained during the FA processing steps.
OCT acquisition and analysis
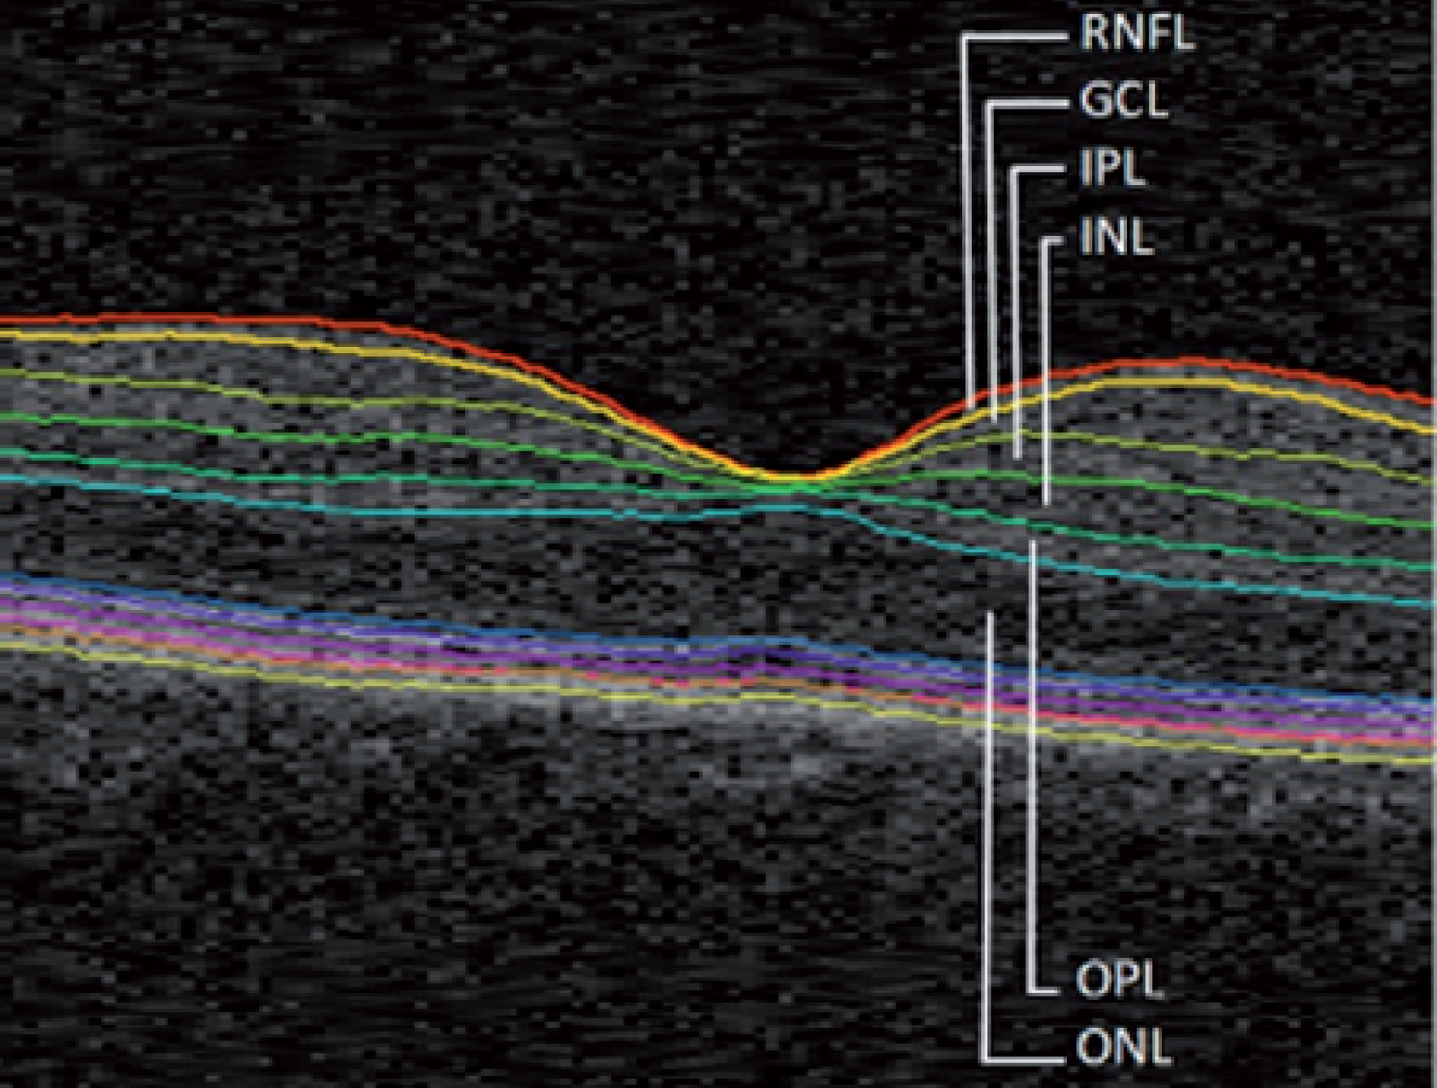
Retinal macular scans were acquired with spectral domain OCT. In this work, the Cirrus HD-OCT system (Carl Zeiss Meditec, Dublin, CA, USA) and the 512×128 Macular Cube Protocol (128 B-scans composed of 512 A-scans each) were used. Frame averaging is not available within this system. Data were analyzed using the Iowa Reference Algorithm software, version 4.0.0 (Retinal Image Analysis Lab, Iowa Institute for Biomedical Imaging, Iowa City, IA) [21–23]. This software allows for reliable segmentation of the following retinal layers: RNFL, GCL, IPL, inner nuclear layer (INL), outer plexiform layer (OPL), outer nuclear layer (ONL), inner segment/outer segment junction, outer segment, outer photoreceptor, subretinal virtual space, and retinal pigment epithelium.
We focused on the individual layers from RNFL to ONL for this study (Fig. 1). The thickness of each layer was calculated as the average of the whole macular area, and the average of both eyes was considered for the analyses.
Fig.1
Macular image segmentation results, identifying the layers considered for this study. RNFL, retinal nerve fiber layer; GCL, ganglion cell layer; IPL, inner plexiform layer; INL, inner nuclear layer; OPL, outer plexiform layer; ONL, outer nuclear layer.
Following the segmentation process, all scans and layers were verified by one of the authors (LJ). Manual corrections were made whenever a clear algorithm failure was identified.
[11C]-Pittsburgh Compound B (PiB) PET acquisition
A Philips Gemini GXL PET/CT scanner (Philips Medical Systems, Best, the Netherlands) was used to perform a dynamic 3-dimensional PET [11C]-PiB scan of the entire brain (90 slices, 2 mm slice sampling) and a low-dose brain CT scan, for attenuation correction.
PET scan started immediately after the intravenous bolus injection of approximately 555 MBq of [11C]-PiB and was acquired over a period of 90 min (37 frames: 4 × 15 s + 8 × 30 s + 9 × 60 s + 2×180 s + 14×300 s). To minimize head movement, the patients’ head was restrained with a soft elastic tape.
PET data were reconstructed using a LOR-RAMLA algorithm, with attenuation and scatter correction.
All images were spatially normalized to the Montreal Neurological Institute (MNI) template. The SUVR was computed at voxel level for all images, considering the cerebellum as the reference region using a homemade software and visual analysis was performed with a fixed reference scale of 2.5. An experienced nuclear medicine medical doctor rated these images with emphasis to frontal cortex, parietal/precuneus cortex, temporal cortex, anterior and posterior cingulate cortex, basal ganglia, and occipital cortex (which SUVR values were also as features for a machine learning algorithm, which as used to help provide computer assisted diagnosis).
Statistical analysis
Group comparisons were performed using the t-test for unpaired samples or the nonparametric Mann-Whitney test, when applicable. A Chi-Square test was used for comparing categorical variables. Normality was previously assessed using the Shapiro-Wilk test for small sample sizes.
A power analysis indicated that sample sizes of ∼20 participants per group would be sufficient to detect a significant difference in at least one of the main between-group parameters with a power of 0.80 and an alpha of 0.05, considering an effect size of 0.91.
Statistical testing was performed using SPSS version 19.0 (SPSS Inc., Chicago, IL, USA). The tests were performed two-tailed and p < 0.05 was used as a threshold for statistical significance.
Regarding the TBSS analysis, voxel-wise statistics for each mean FA skeleton voxel were calculated using FSL’s randomize, which combines permutation test theory and a general linear model design matrix. Partial correlation analyses were thus performed between retinal layers’ thickness and diffusion metrics for the AD and HC (Healthy Control) groups, treating age as a covariate of no interest [39].
A total of 5000 permutations were used with Threshold-Free Cluster Enhancement fully corrected for multiple comparisons by controlling for family-wise error (FWE) rates [40].
The skeletal regions with significant results were labelled anatomically by mapping the TBSS FWE-corrected statistical maps to the JHU-ICBM-DTI-81 WM atlas, containing a total of 48 WM tract labels [41]. The tracts were dilated by using the “tbss_fill” command in FSL to enhance visualization of the results.
RESULTS
Group differences in demographic, clinical, DTI and OCT data
Age and gender were matched between all participants. MoCA assessment results were significantly different between groups, as expected. Every patient had a CDR of 1, being affected by mild dementia (Table 2).
Table 2
Demographics and clinical characteristics of all participants
| HC (n = 23) | AD (n = 17) | p | |
| Age±SD | 63.43±7.53 | 66.47±6.63 | 0.193 |
| Female/Male (ratio) | 11/12 (0.92) | 8/9 (0.89) | 0.962 |
| Education (y) | 9.3±5.93 | 8.95±5.20 | |
| MMSE | 23,1±2.97 | ||
| MoCA | 25.83±3.31 | 14.47±4.51 | <0.001* |
| CDR | 0 | 1 | – |
| ApoE ɛ4 (%) | 44% |
HC, healthy controls; AD, patients with Alzheimer’s disease; SD, standard deviation; MoCA, Montreal cognitive assessment; CDR, Clinical Dementia Rating; MMSE, Mini-Mental State Examination. Data are expressed as mean±S.D, except for ApoE that is expressed as percentage of ɛ4 carriers. MMSE and MoCA: higher scores correspond to better performance. Concerning BLAD affected domains they showed the following ratios of impairment in AD participants: (Memory, 16/17; Executive, 12/17; Language, 7/17; Constructive, 4/17; Calculation, 3/17).
Regarding DTI metrics, only DA (axial diffusivity) was significantly decreased in the AD group (p = 0.016, Cohen’s d = 1.004) (Table 3). A post hoc regional analysis was also performed for this metric (Supplementary Table 2).
Table 3
FA, MD, RD. and DA whole-brain values (mean±SD), for all participants
| DTI metric (whole skeleton) | HC (n = 23) | AD (n = 17) | p |
| FA | 0.434±0.024 | 0.441±0.018 | 1.00 |
| MD (×103 mm2/s) | 0.730±0.031 | 0.716±0.047 | 1.00 |
| RD (×103 mm2/s) | 0.550±0.029 | 0.553±0.045 | 1.00 |
| DA (×103 mm2/s) | 1.09±0.040 | 1.04±0.058 | 0.016* |
HC, healthy controls; AD, patients with Alzheimer’s disease; SD, standard deviation; FA, fractional anisotropy; MD, mean diffusivity; RD, radial diffusivity; DA, axial diffusivity.* p-values <0.05 were considered statistically significant (corrected for multiple comparisons by using post-hoc Bonferroni correction for the number of metrics considered).
There were no significant differences between the retinal layers thickness in both groups (Supplementary Table 1). There was, however, a trend towards significance regarding the OPL layer (p = 0.084).
Partial correlations between diffusion metrics and thickness of retinal layers
To investigate the relationship between the retina and WM tract integrity in the brain, we conducted a partial correlation analysis for the AD group, between OCT and DTI data. No relation could be found between MD, RD, and DA and the thickness of the retinal layers (data not shown). However, TBSS analysis showed a positive association between the thickness of the INL and FA, in AD. This correlation was observed both in tracts associated with the visual system (optic radiation, splenium of the corpus callosum) and other regions as well (Fig. 2, Table 4).
Fig.2
TBSS results for the correlation analysis between FA and INL thickness in the AD group. The results shown are for statistical testing of a positive correlation. Regions with significant correlation (with cluster-based thresholding corrected for multiple comparisons) are displayed in red to yellow. Results are overlaid on the mean WM skeleton (green) and mean FA image (grey). The significant portion of the tracts was dilated by using the “tbss_fill” command in FSL to enhance visualization.
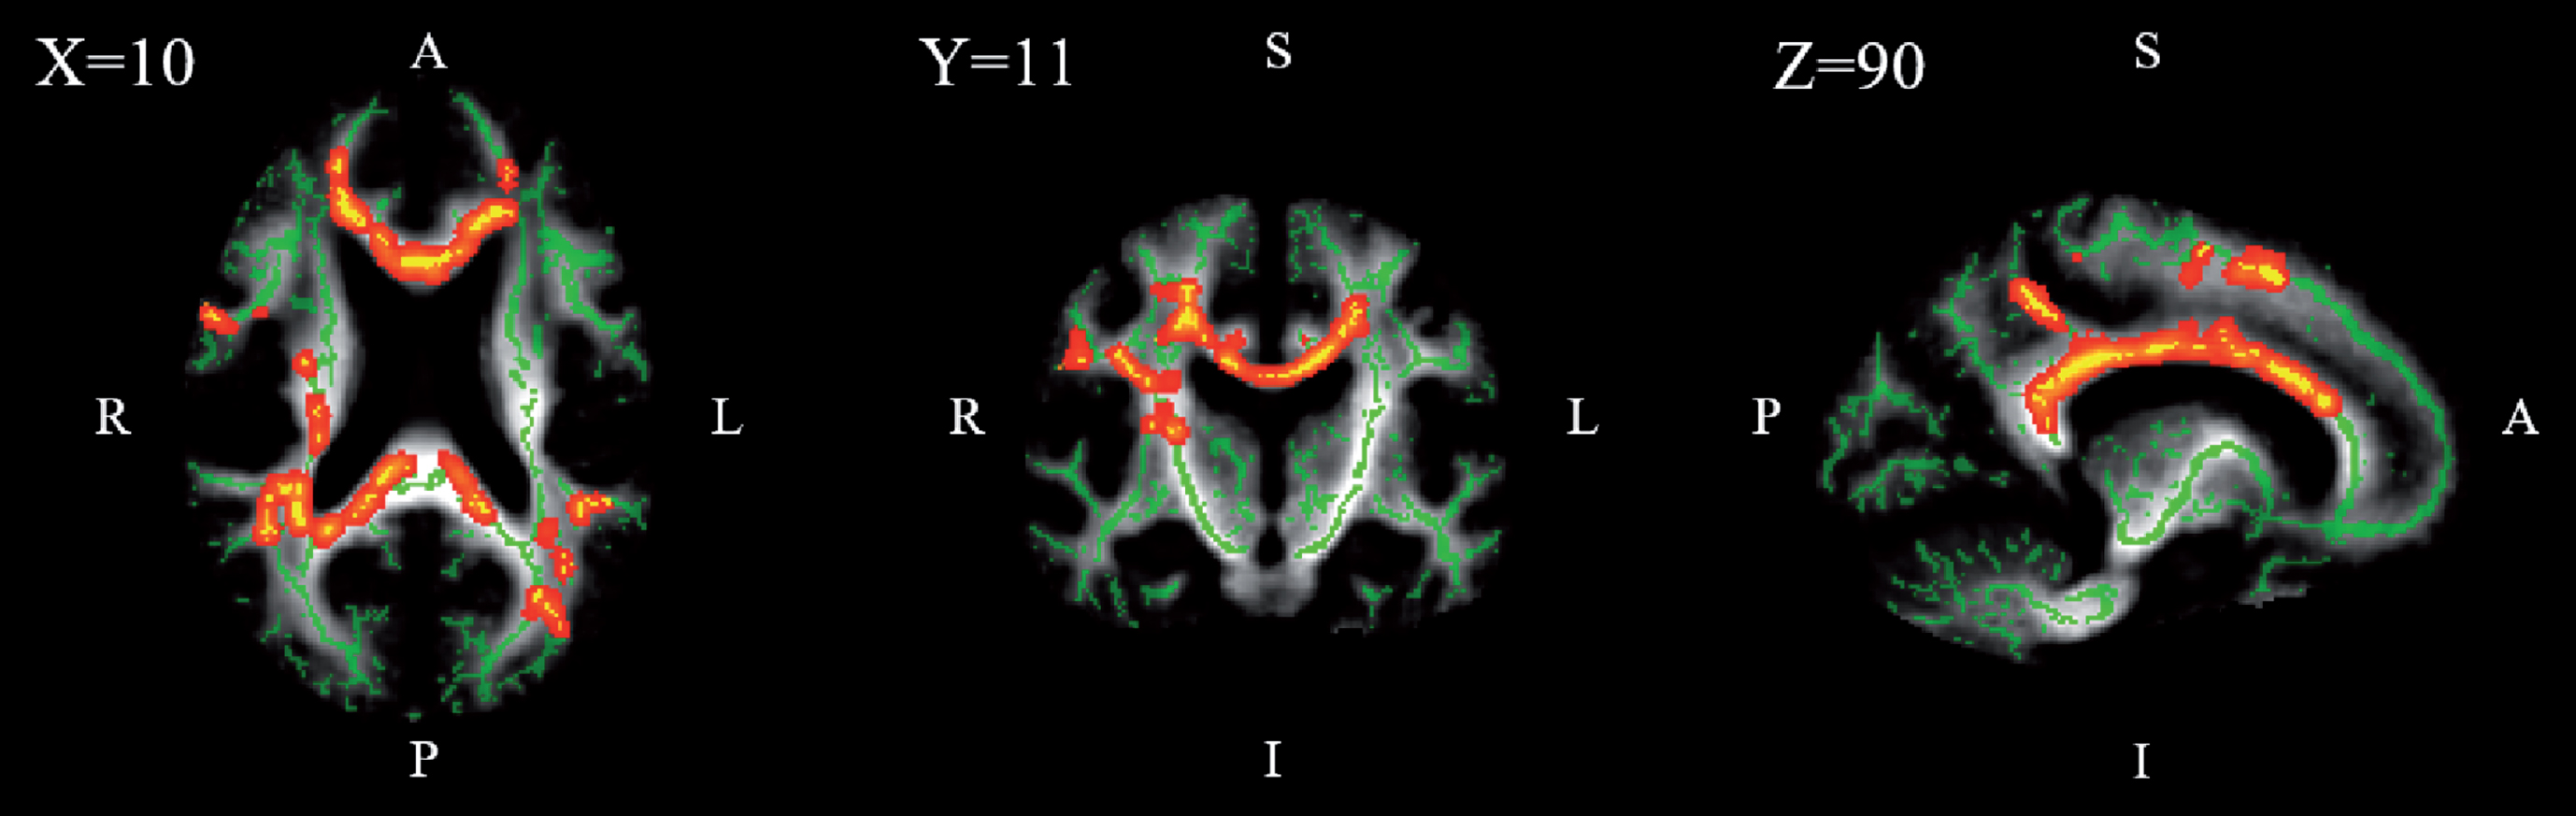
Table 4
White matter tracts’ FA correlated with INL thickness in patients with Alzheimer’s disease (n = 17), with the largest effects in terms of spatial extent
| WM tracts | p* | Significant voxels (%)** |
| Body of corpus callosum | 0.033 | 58.67 |
| Tapetum R | 0.042 | 43.24 |
| Posterior corona radiata R | 0.037 | 39.07 |
| Retrolenticular part of internal capsule R | 0.040 | 33.12 |
| Posterior thalamic radiation (include optic radiation) L | 0.043 | 31.67 |
| Superior corona radiata R | 0.032 | 30.60 |
| Anterior corona radiata R | 0.028 | 28.81 |
| Splenium of corpus callosum | 0.035 | 26.91 |
| Cingulum (cingulate gyrus) L | 0.039 | 22.76 |
| Superior longitudinal fasciculus R | 0.043 | 21.11 |
| Superior corona radiata L | 0.037 | 20.35 |
| Genu of corpus callosum | 0.035 | 19.11 |
| Posterior corona radiata L | 0.034 | 18.16 |
| Cingulum (cingulate gyrus) R | 0.035 | 16.99 |
| Fornix (cres)/Stria terminalis L | 0.043 | 14.29 |
| Posterior thalamic radiation (include optic radiation) R | 0.041 | 11.85 |
| Posterior limb of internal capsule R | 0.041 | 8.51 |
| Anterior corona radiata L | 0.037 | 8.49 |
| Superior longitudinal fasciculus L | 0.043 | 6.17 |
*p-values <0.05 were considered statistically significant (corrected for multiple comparisons by controlling for family-wise error rates). **Percentage of statistically significant voxels within each labelled tract.
However, at over 25% of the spatial extent of correlation between FA and INL, we find the body and splenium of the corpus callosum, the corona radiata, the posterior thalamic radiation (which includes the optic radiation), the tapetum and the retrolenticular part of the internal capsule, including most of the fibers associated with the visual system.
No correlation was found for the control group, for any layer or diffusion metric (data not shown).
DISCUSSION
To our knowledge, this is the first study to simultaneously investigate macular retinal atrophy and WM tract integrity in early AD and their interplay. In order to detect possible alterations in the retina and brain in an initial stage of AD, only recently diagnosed patients with mild dementia were considered for our study.
Regarding the diffusion metrics, we chose to go beyond the more common FA and MD analysis since more elusive orientation dependent behaviors missed by FA can be discovered by considering the primary components of MD—DA and RD. The lack of sensitivity of FA in earlier stages of the AD has been previously reported [42]. DTI-based DA measures water diffusion parallel to axons and is a marker of axonal integrity, while RD assesses water diffusion perpendicular to fibers, related to myelin changes [43, 44].
We found a decrease in whole-brain DA in our early AD patients’ cohort (p = 0.016, Cohen’s d = 1.004), while other diffusion metrics remained unchanged. This is consistent with the notion that DA changes are one of the first abnormalities to appear in early stages of AD, preceding changes in FA and RD. Although the underlying mechanisms are still unclear, an early DA change in AD has been proposed to capture an upstream event to axonal degeneration, while processes more directly related to neuronal loss might influence RD and FA changes. A hypothesis for a possible upstream event could be inflammatory change and associated microglial activation, prevalent in AD [45]. Neuroinflammation is a known contributor to the pathogenesis of AD. Analysis of clinical manifestations that precede AD suggest an early and substantial involvement of inflammation in the development of the disease [46].
However, we have found a significant decrease in DA, while other literature in AD reports an increase. A DA decrease with no alteration of RD has been associated with axonal degeneration with no detectable demyelination [47, 48].
In AD, deposition of amyloid and abnormal phosphorylation of tau protein are primary processes behind neuronal degeneration. In a study assessing the relationship between WM structural integrity measured with DTI and AD-related CSF biomarkers, t-tau and t-tau/Aβ42 correlated with indices of brain microstructure (MD, RD, and DA) in healthy adults with elevated risk of developing AD [44]. This suggests early pathological changes in AD happen in WM and can be detected by DTI.
No alteration was found in the retina at this stage of the disease, for any of the layers considered for this study. Only a marginally significant decrease was found for the OPL (Supplementary Table 1). In the literature, most OCT studies in AD indicate a significant decline in peripapillary (not macular) RNFL in all quadrants [14, 20] and overall macular thickness [20], while a study by [11] reported macular GCL-IPL reduction. However, no other explicitly segmented retinal layers have been investigated.
Furthermore, most of these studies have been conducted in patients in later stages of the disease, in mild to moderate or severe AD stages. Considering the degenerative nature of this disease, it would be expected that at higher severity stages the structural integrity of the retina would be more affected, as reported previously by [49]. Thus, since our cohort consists solely of recently diagnosed patients in a mild stage of AD, this might explain why no overt alteration was seen in the retina, as well as the distinct cortical changes in DA. Other possible explanations to this finding include the possible presence of very early AD cases, the relatively small group size considered, or issues with the segmentation analysis or OCT acquisition.
Nevertheless, we found evidence that the retina already mirrors the brain status in early AD, since we found a significant correlation between FA and the INL thickness (Fig. 2, Table 4). Thus, the INL thickness might reflect WM tract dysfunction. This relationship was found to extend beyond the visual system, mirroring whole-brain WM (Table 4). Importantly, at over 25% of spatial extent of correlation, we find the splenium of the corpus callosum, the corona radiata, the posterior thalamic radiation including the optical radiation, and the retro lenticular part of the internal capsule—fibers associated with the visual system.
Since INL and RNFL correspond respectively to cell bodies and their fibers, one would expect to find a similar relation between them. However, no correlation was found between any DTI metrics and RNFL. This could be explained by lower SNR at the RNFL level, precluding detection of a significant correlation.
Learning the sequence of events in AD would be very important in understanding its pathogenesis. Our findings provide further insight into the interplay of different biomarkers of the disease at rather early stages, when mean changes are quite subtle. The eye, being an extension of the brain, shares functional building blocks in the form of neurons and axons, as well as common degenerative processes [3]. These retinocortical connections suggest that direct or indirect retrograde or anterograde degeneration mechanisms [50] should be investigated in future research.
In the present study, we have captured a “snapshot” of an early stage of AD. Based both on our results and on the current literature, we hypothesize the following cascade of events: 1) in an initial stage of the disease, the loss of WM integrity in the brain is related mainly to axonal loss (indexed by axial diffusivity). Its underlying cause, namely possible neuroinflammation [45] needs to be explored in future studies. The relation found between FA and INL is also intriguing and suggests concomitant retinocortical changes. 2) With the subsequent cascade of pathological events in AD and at later stages of the disease, RD in the brain increases as demyelination occurs [42] and other inner retinal layers are also progressively affected [49].
It is important to note that within the human CNS, pathologic inflammatory changes from the acute to the chronic stage result in DA becoming less informative over time [51]. The pathological changes occurring in microglia may defectively alter neural integrity and affect both DA and RD. Therefore, on later stages of the disease, other biomarkers of inflammation based on PET and MR spectroscopy may become useful in this context.
One of the limitations of our study is the small sample investigated. Furthermore, being a cross-sectional study, the dynamics of the interaction between retinal changes and WM dysfunction warrants additional investigation in longitudinal studies, from early AD up to more advanced disease stages.
By only selecting patients with good vision, we may have introduced a conservative bias to the study. By doing so, we aimed at ensuring that cortical changes were not simply a consequence of decreased visual acuity or peripheral visual loss. Although acuity is not critical in the retina periphery, visual contrast sensitivity may still be affected. Since overt visual loss is generally due to retinal causes and we aimed at studying early AD stages, this strategy might have led to a conservative approach, while a more liberal strategy, including patients with overt visual loss might have decreased specificity of findings.
ACKNOWLEDGMENTS
Strategic project FCT-UID/NEU/04539/2013 – COMPETE, POCI-01-0145-FEDER-007440, BIGDATIMAGE, CENTRO-01-0145-FEDER-000016, Centro 2020 FEDER, COMPETE, PAC – MEDPERSYST, POCI-01- 0145-FEDER-016428, Neuroscience Mantero Belard Prize 2015 (Santa Casa da Misericórdia): Ref: MB-1049-2015. Centro 2020 (CENTRO-01-0145-FEDER-000008: BrainHealth 2020).
Authors’ disclosures available online (https://www.j-alz.com/manuscript-disclosures/19-0152r2).
SUPPLEMENTARY MATERIAL
[1] The supplementary material is available in the electronic version of this article: http://dx.doi.org/10.3233/JAD-190152.
REFERENCES
[1] | Blennow K , Leon MJ De , Zetterberg H ((2006) ) Alzheimer’s disease. Lancet 368: , 387–403. |
[2] | Holtzman DM , Morris JC , Goate AM ((2011) ) Alzheimer’s disease: The challenge of the second century. Sci Transl Med 3: , 1–35. |
[3] | London A , Benhar I , Schwartz M ((2013) ) The retina as a window to the brain - from eye research to CNS disorders. Nat Rev Neurol 9: , 44–53. |
[4] | Rizzo M , Nawrot M ((1998) ) Perception of movement and shape in Alzheimer’s disease. Brain 121: , 2259–2270. |
[5] | Wijk H , Berg S , Sivik L , Steen B ((1999) ) Colour discrimination, colour naming and colour preferences among individuals with Alzheimer’s disease. Int J Geriatr Psychiatry 14: , 1000–1005. |
[6] | Lemos R , Figueiredo P , Santana I , Simões MR , Castelo-Branco M ((2012) ) Temporal integration of 3D coherent motion cues defining visual objects of unknown orientation is impaired in amnestic mild cognitive impairment and Alzheimer’s disease. J Alzheimers Dis 28: , 885–896. |
[7] | Thomson KL , Yeo JM , Waddell B , Cameron JR , Pal S ((2015) ) A systematic review and meta-analysis of retinal nerve fiber layer change in dementia, using optical coherence tomography. Alzheimers Dement (Amst) 1: , 136–143. |
[8] | Serbecic N , Froelich L , Hausner L , Aboul-Enein F , Beutelspacher SC , Kromer R ((2014) ) Detection of retinal nerve fiber layer defects in Alzheimer’s disease using SD-OCT. Front Psychiatry 5: , 1–7. |
[9] | Sánchez D , Castilla-Marti M , Rodríguez-Gómez O , Valero S , Piferrer A , Martínez G , Martínez J , Serra J , Moreno-Grau S , Hernández-Olasagarre B , De Rojas I , Hernández I , Abdelnour C , Rosende-Roca M , Vargas L , Mauleón A , Santos-Santos MA , Alegret M , Ortega G , Espinosa A , Pérez-Cordón A , Sanabria Á , Ciudin A , Simó R , Hernández C , Villaoslada P , Ruiz A , Tàrraga L , Boada M ((2018) ) Usefulness of peripapillary nerve fiber layer thickness assessed by optical coherence tomography as a biomarker for Alzheimer’s disease. Sci Rep 8: , 1–10. |
[10] | den Haan J , Janssen SF , van de Kreeke JA , Scheltens P , Verbraak FD , Bouwman FH ((2018) ) Retinal thickness correlates with parietal cortical atrophy in early-onset Alzheimer’s disease and controls. Alzheimers Dement (Amst) 10: , 49–55. |
[11] | Cheung CY , Ong YT , Hilal S , Ikram MK , Low S , Ong YL , Venketasubramanian N , Yap P , Seow D , Chen CLH , Wong TY ((2015) ) Retinal ganglion cell analysis using high-definition optical coherence tomography in patients with mild cognitive impairment and Alzheimer’s disease. J Alzheimers Dis 45: , 45–56. |
[12] | Cogan DG ((1985) ) Visual disturbances with focal progressive dementing disease. Am J Ophthalmol 100: , 68–72. |
[13] | Leuba G , Kraftsik R ((1994) ) Visual cortex in Alzheimer’s disease: Occurencee of neuronal death and glial proliferation, and correlation with pathological hallmarks. Neurobiol Aging 15: , 29–43. |
[14] | Coppola G , Renzo A Di , Ziccardi L , Martelli F ((2015) ) Optical coherence tomography in Alzheimer’s disease: a meta-analysis. PLoS One 10: , e0134750. |
[15] | Nishioka C , Poh C , Sun S-W ((2016) ) Diffusion tensor imaging reveals visual pathway damage in patients with mild cognitive impairment and Alzheimer’s disease. J Alzheimers Dis 45: , 97–107. |
[16] | Brun A , Englund E ((1986) ) A white matter disorder in dementia of the Alzheimer type: A pathoanatomical study. Ann Neurol 19: , 253–262. |
[17] | Bartzokis G , Cummings JL , Sultzer D , Henderson VW , Nuechterlein KH , Mintz J ((2003) ) White matter structural integrity in healthy aging adults and patients with Alzheimer disease. Arch Neurol 60: , 393. |
[18] | Brickman AM , Muraskin J , Zimmerman ME ((2009) ) Structural neuroimaging in Alzheimer’s disease: Do white matter hyperintensities matter? Dialogues Clin Neurosci 11: , 181–190. |
[19] | Sexton CE , Kalu UG , Filippini N , Mackay CE , Ebmeier KP ((2011) ) A meta-analysis of diffusion tensor imaging in mild cognitive impairment and Alzheimer’s disease. Neurobiol Aging 32: , 2322.e5–2322.e18. |
[20] | Haan J Den , Verbraak FD , Jelle P , Bouwman FH ((2017) ) Retinal thickness in Alzheimer’s disease: A systematic review and meta-analysis. Alzheimers Dement (Amst) 6: , 162–170. |
[21] | Abràmoff MD , Garvin MK , Sonka M ((2011) ) Retinal imaging and image analysis. IEEE Trans Med Imaging 3: , 169–208. |
[22] | Garvin MK , Abràmoff MD , Wu X , Russell SR , Burns TL , Sonka M ((2009) ) Automated 3-D intraretinal layer segmentation of macular spectral-domain optical coherence tomography images. IEEE Trans Med Imaging 28: , 1436–1447. |
[23] | Li K , Wu X , Chen DZ , Sonka M ((2006) ) Optimal surface segmentation in volumetric images - a graph-theoretic approach. IEEE Trans Pattern Anal Mach Intell 28: , 119–134. |
[24] | American Psychiatric Association ((2000) ), Diagnostic and Statistical Manual of Mental Disorders (DSM-IV-TR), Washington, DC. |
[25] | McKhann G , Knopman D , Chertkow H , Hyman B , Jack CJ , Kawas C , Klunk W , Koroshetz W , Manly J , Mayeux R , Mohs R , Morris J , Rossor M , Scheltens P , Carrillo M , Thies B , Weintraub S , Phelps C ((2011) ) The diagnosis of dementia due to Alzheimer’s disease: recommendations from the National Institute on Aging-Alzheimer’s Association workgroups on diagnostic guidelines for Alzheimer’s disease. Alzheimers Dement 7: , 263–269. |
[26] | Morris JC ((2012) ) The Clinical Dementia Rating (CDR): Current version and scoring rules. Neurology 43: , 2412–2412. |
[27] | Folstein M , Folstein S , McHugh P ((1975) ) Mini-Mental State: a practical method for grading the cognitive state of patients for the clinician. J Psychiatr Res 12: , 189–198. |
[28] | Freitas S , Simões MR , Alves L , Santana I ((2015) ) The relevance of sociodemographic and health variables on MMSE normative data. Appl Neuropsychol 22: , 311–319. |
[29] | Nasreddine ZS , Phillips NA , Bedirian V , Charbonneau S , Whitehead V , Collin I , Cummings JL , Chertkow H ((2005) ) The Montreal Cognitive Assessment MoCA: a brief screening tool for mild cognitive impairment. J Am Geriatr Soc 53: , 695–699. |
[30] | Freitas S , Simões M , Alves L , Santana I ((2013) ) Montreal Cognitive Assessment (MoCA): Validation study for mild cognitive impairment and Alzheimer’s disease. Alzheimer Dis Assoc Disord 27: , 37–43. |
[31] | Guerreiro M ((1998) ) Contributo da Neuropsicologia para o Estudo das Demências [Contribution of Neuropsychology to the Study of Dementias]. |
[32] | del Campo M , Mollenhauer B , Bertolotto A , Engelborghs S , Hampel H , Simonsen AH , Kapaki E , Kruse N , Le Bastard N , Lehmann S , Molinuevo JL , Parnetti L , Perret-Liaudet A , Sáez-Valero J , Saka E , Urbani A , Vanmechelen E , Verbeek M , Visser PJ , Teunissen C ((2012) ) Recommendations to standardize preanalytical confounding factors in Alzheimers and Parkinsons disease cerebrospinal fluid biomarkers: An update. Biomark Med 6: , 419–430. |
[33] | Baldeiras I , Santana I , Leitão MJ , Gens H , Pascoal R , Tábuas-Pereira M , Beato-Coelho J , Duro D , Almeida MR , Oliveira CR ((2018) ) Addition of the Aβ42/40 ratio to the cerebrospinal fluid biomarker profile increases the predictive value for underlying Alzheimer’s disease dementia in mild cognitive impairment. Alzheimers Res Ther 10: , 1–15. |
[34] | Mattsson N , Andreasson U , Persson S , Arai H , Batish S , Bernardini S , Bocchio-Chiavetto L , Blankenstein M , Carrillo M , Chalbot S ((2011) ) The Alzheimer’s Association external quality control program for cerebrospinal fluid biomarkers. Alzheimers Dement 7: , 386–395. |
[35] | Baldeiras I , Santana I , Garrucho MH , Pascoal R , Lemos R , Santiago B , Oliveira CR ((2012) ) CSF biomarkers for the early diagnosis of Alzheimer’s disease in a routine clinical setting – the first Portuguese study. Sinapse 12: , 14–22. |
[36] | Román GC , Tatemichi TK , Erkinjuntti T , Cummings JL , Masdeu JC , Garcia JH , Amaducci L , Orgogozo JM , Brun A , Hofman A ((1993) ) Vascular dementia: diagnostic criteria for research studies. Report of the NINDS-AIREN International Workshop. Neurology 43: , 250–60. |
[37] | Hughes CP , Berg L , Danziger WL , Coben LA , Martin RL ((1982) ) A new clinical scale for the staging of dementia. Br J Psychiatry 140: , 566–572. |
[38] | Smith SM , Jenkinson M , Johansen-berg H , Rueckert D , Nichols TE , Mackay CE , Watkins KE , Ciccarelli O , Cader MZ , Matthews PM , Behrens TEJ ((2006) ) Tract-based spatial statistics: Voxelwise analysis of multi-subject diffusion data. Neuroimage 31: , 1487–1505. |
[39] | Inano S , Takao H , Hayashi N , Abe O , Ohtomo K ((2011) ) Effects of age and gender on white matter integrity. Am J Neuroradiol 32: , 2103–2109. |
[40] | Smith SM , Nichols TE ((2009) ) Threshold-free cluster enhancement: Addressing problems of smoothing, threshold dependence and localisation in cluster inference. Neuroimage 44: , 83–98. |
[41] | Oishi K , Zilles K , Amunts K , Faria A , Jiang H , Li X , Akhter K , Hua K , Woods R , Toga AW , Pike GB , Rosa- P , Evans A , Zhang J , Huang H , Miller MI , Van PCM , Mazziotta J , Mori S , Brain F ((2009) ) Human brain white matter atlas: identification and assignment of common anatomical structures in superficial white matter. Neuroimage 43: , 447–457. |
[42] | Acosta-Cabronero J , Nestor PJ ((2014) ) Diffusion tensor imaging in Alzheimer’s disease: Insights into the limbic-diencephalic network and methodological considerations. Front Aging Neurosci 6: , 1–21. |
[43] | Kumar R , Chavez AS , Macey PM , Woo MA , Harper RM ((2013) ) Brain axial and radial diffusivity changes with age and gender in healthy adults. Brain Res 1512: , 22–36. |
[44] | Bendlin BB , Carlsson CM , Johnson SC , Zetterberg H , Blennow K , Willette AA , Okonkwo OC , Sodhi A , Ries ML , Birdsill AC , Alexander AL , Rowley HA , Puglielli L , Asthana S , Sager MA ((2012) ) CSF T-TAU/Aβ 42 predicts white matter microstructure in healthy adults at risk for Alzheimer’s disease. PLoS One 7: , e37720. |
[45] | Acosta-Cabronero J , Alley S , Williams GB , Pengas G , Nestor PJ ((2012) ) Diffusion tensor metrics as biomarkers in Alzheimer’s disease. PLoS One 7: , e49072. |
[46] | Heneka MT , Carson MJ , Khoury J El , Gary E , Brosseron F , Feinstein DL , Jacobs AH , Wyss-coray T , Vitorica J , Ransohoff RM ((2015) ) Neuroinflammation in Alzheimer’s disease. Lancet Neurol 14: , 388–405. |
[47] | Song SK , Sun SW , Ju WK , Lin SJ , Cross AH , Neufeld AH ((2003) ) Diffusion tensor imaging detects and differentiates axon and myelin degeneration in mouse optic nerve after retinal ischemia. Neuroimage 20: , 1714–1722. |
[48] | Loy DN , Kim JH , Xie M , Schmidt RE , Trinkaus K , Song S-K ((2007) ) Diffusion tensor imaging predicts hyperacute spinal cord injury severity. J Neurotrauma 24: , 979–990. |
[49] | Cunha LP , Lopes LC , Costa-Cunha LVF , Costa CF , Pires LA , Almeida ALM , Monteiro MLR ((2016) ) Macular thickness measurements with frequency domain-oct for quantification of retinal neural loss and its correlation with cognitive impairment in Alzheimer’s disease. PLoS One 11: , e0153830. |
[50] | Jindahra P , Petrie A , Plant GT ((2009) ) Retrograde trans-synaptic retinal ganglion cell loss identified by optical coherence tomography. Brain 132: , 628–634. |
[51] | Winklewski PJ , Sabisz A , Naumczyk P , Jodzio K , Szurowska E , Szarmach A ((2018) ) Understanding the physiopathology behind axial and radial diffusivity changes - What do we know? Front Neurol 9: , 92. |


