Albuminuria and Microalbuminuria as Predictors of Cognitive Performance in a General Population: An 11-Year Follow-Up Study
[Journal of Alzheimer’s Disease 62(2), 2018, 635-648, DOI 10.3233/JAD-170972] https://content.iospress.com/articles/journal-of-alzheimers-disease/jad170972
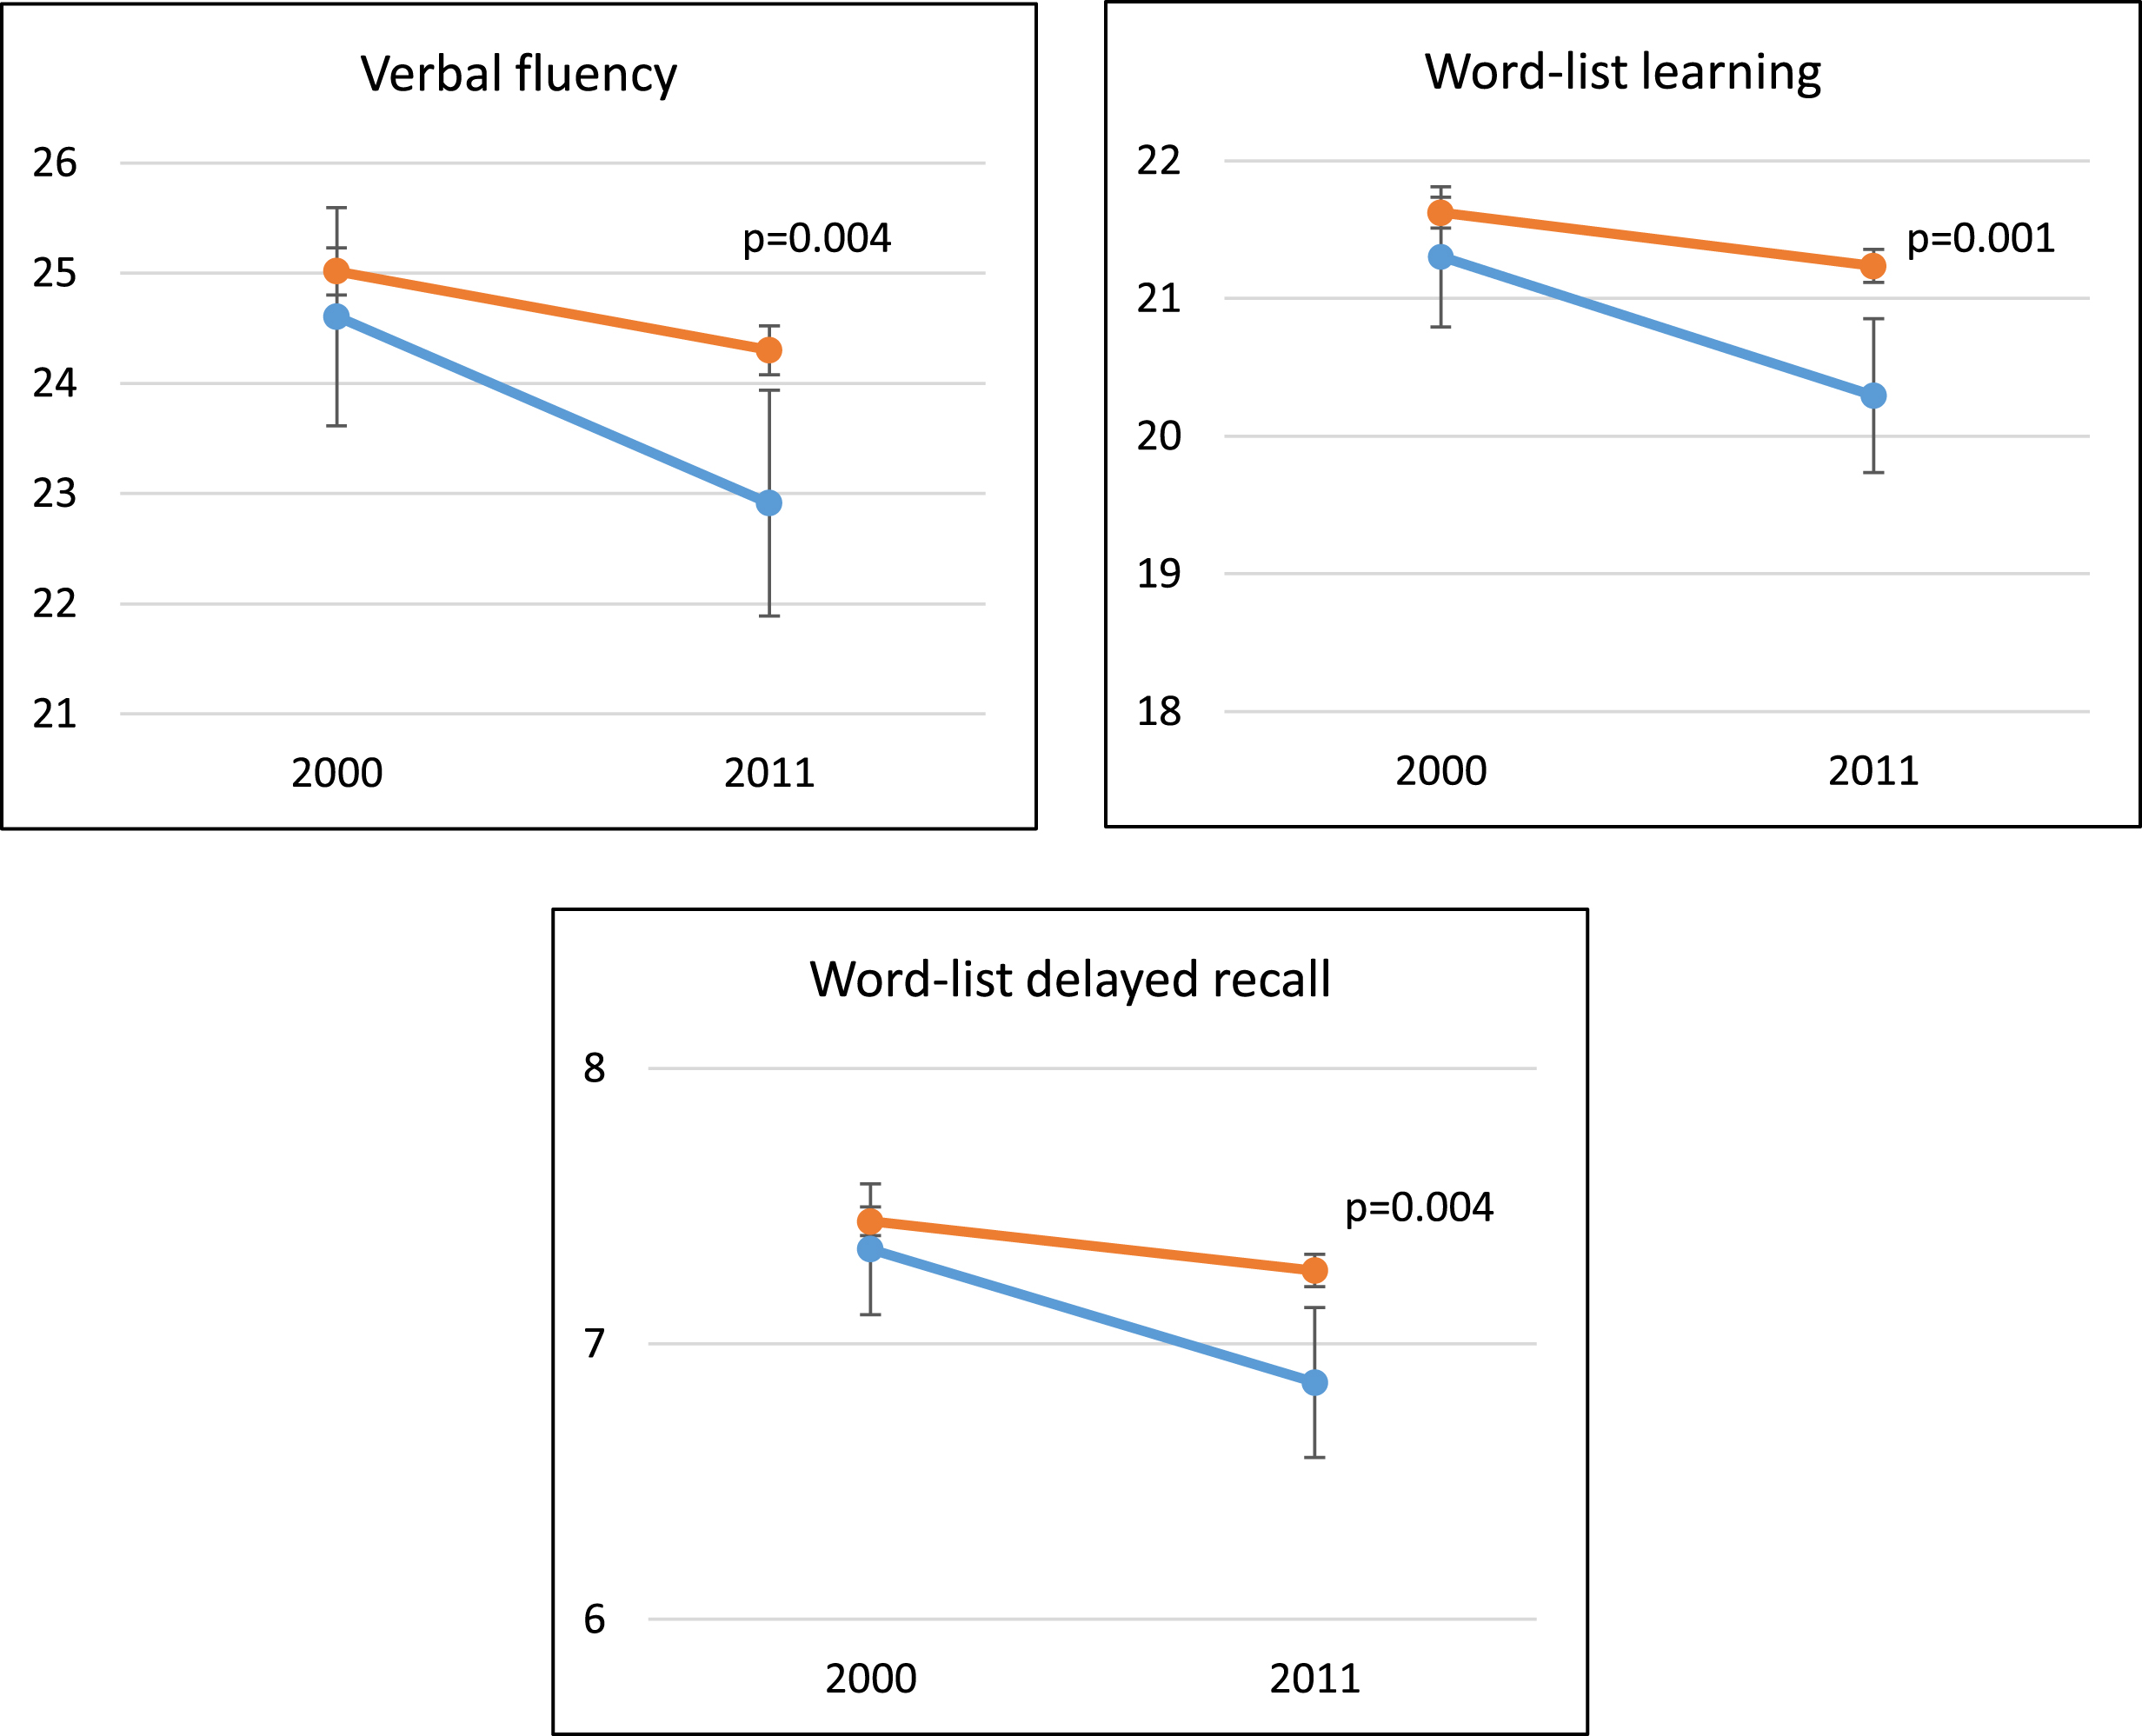
On p. 642, in line 4 of the figure legend for figure 2, the colors for “No albuminuria” and “Micro- or macroalbuminuria” are switched. “No albuminuria” should have an orange line, and “Micro- or macroalbuminuria” should have a blue line. The correct figure 2 is included below.
Fig. 1.
Age, sex, and education adjusted cognitive test scores at baseline and at follow-up in individuals with and without micro- or
macroalbuminuria, in the study population that attended the follow-up examination, n = 3,687. The results are shown as adjusted means with 95% confidence intervals. p-values for a difference in the rate of decline in cognitive test scores between the two groups from 2000 to 2011, assessed with linear regression analysis and adjusted for age, sex, and education.  No albuminuria.
  Micro- or macroalbuminuria.