
Neuronal Apolipoprotein E4 Expression Results in Proteome-Wide Alterations and Compromises Bioenergetic Capacity by Disrupting Mitochondrial Function
Abstract
Apolipoprotein (apo) E4, the major genetic risk factor for Alzheimer’s disease (AD), alters mitochondrial function and metabolism early in AD pathogenesis. When injured or stressed, neurons increase apoE synthesis. Because of its structural difference from apoE3, apoE4 undergoes neuron-specific proteolysis, generating fragments that enter the cytosol, interact with mitochondria, and cause neurotoxicity. However, apoE4’s effect on mitochondrial respiration and metabolism is not understood in detail. Here we used biochemical assays and proteomic profiling to more completely characterize the effects of apoE4 on mitochondrial function and cellular metabolism in Neuro-2a neuronal cells stably expressing apoE4 or apoE3. Under basal conditions, apoE4 impaired respiration and increased glycolysis, but when challenged or stressed, apoE4-expressing neurons had 50% less reserve capacity to generate ATP to meet energy requirements than apoE3-expressing neurons. ApoE4 expression also decreased the NAD+/NADH ratio and increased the levels of reactive oxygen species and mitochondrial calcium. Global proteomic profiling revealed widespread changes in mitochondrial processes in apoE4 cells, including reduced levels of numerous respiratory complex subunits and major disruptions to all detected subunits in complex V (ATP synthase). Also altered in apoE4 cells were levels of proteins related to mitochondrial endoplasmic reticulum–associated membranes, mitochondrial fusion/fission, mitochondrial protein translocation, proteases, and mitochondrial ribosomal proteins. ApoE4-induced bioenergetic deficits led to extensive metabolic rewiring, but despite numerous cellular adaptations, apoE4-expressing neurons remained vulnerable to metabolic stress. Our results provide insights into potential molecular targets of therapies to correct apoE4-associated mitochondrial dysfunction and altered cellular metabolism.
INTRODUCTION
Apolipoprotein (apo) E4 is the major genetic risk factor for Alzheimer’s disease (AD) and occurs in approximately two-thirds of all cases [1–3]. ApoE4 increases risk for AD and lowers the age of onset [4–14]. ApoE4 differs from apoE3 by a single amino acid [15], which alters the intramolecular interactions in apoE4 and increases its cleavage by a stress-induced neuron-specific protease [7, 12, 16]. The resulting apoE fragments escape the secretory pathway into the cytosol, where they engage in abnormal interactions that lead to neurodegeneration [17–19]. Although apoE fragments interact directly with mitochondria and disrupt their function [17, 20], the extent to which apoE4 disrupts mitochondrial function and cellular metabolism in neurons remains poorly defined.
Compelling evidence links neurodegeneration to altered brain metabolism and mitochondrial dysfunction, both of which are early hallmarks of AD [21–28]. Young, cognitively normal apoE4 carriers have glucose hypometabolism in brain regions affected by AD [29–31], most likely related to early mitochondrial dysfunction. Indeed, in nondemented apoE4 carriers, the activity of mitochondrial complex IV is decreased in cortical regions susceptible to AD [32]. Mice expressing human apoE4 show deficient uptake and metabolism of glucose in the brain [33]. In neurons, apoE4 is associated with impaired mitochondrial respiration, decreased neurite outgrowth, and neurotoxicity [10, 17–19, 34, 35]. Cell-specific toxicity is the result of neuron-specific apoE4 proteolysis [7, 12]. Expression of apoE4 in mouse neurons, but not astrocytes, selectively decreases the expression of mitochondrial respiratory subunits [18]. ApoE4 also reduces the level of respiratory chain subunits in Neuro-2a (N2a) cells and impairs respiratory function [18]. The largest apoE4 fragment, apoE4(1–272), interacts directly with mitochondria to reduce mitochondrial membrane potential and cause mitochondrial fragmentation [10, 17, 20], possibly through direct interactions with respiratory chain complexes or secondary effects on their activity [20]. The interaction of apoE4 fragments with mitochondria is dependent on the apoE lipid-binding domain, and expression of fragments containing this domain in N2a cells results in neurotoxicity [17]. The aberrant proteolytic processing of apoE4 and consequent neurotoxicity can be blocked by treating apoE4-expressing cells with small-molecule “structure correctors,” which convert apoE4 to an apoE3-like conformation and prevent apoE4 fragment generation [12, 13, 18, 19].
Mitochondria communicate with the rest of the cell by metabolite shuttling, direct interactions with other organelles, and altered proteostasis [36, 37]. For example, the large respiratory complexes of mitochondria require balanced transcription of subunits from both the nuclear and mitochondrial genomes. In addition, the vast majority of mitochondrial proteins require import, proteolytic maturation, and delivery to the correct submitochondrial compartment [38]. Once targeted, many must be assembled into large, multi-subunit structures, some of which form “supercomplexes” [39] that are essential for mitochondrial energy metabolism [40].
Mitochondria are also involved in neuronal redox homeostasis, reactive oxygen species (ROS) production, calcium buffering, and intracellular signaling [41–44]. Moreover, direct interactions between mitochondria and the endoplasmic reticulum (ER), particularly at mitochondria–ER-associated membranes (MAM), allow direct calcium exchange between the organelles and facilitate lipid synthesis, exchange, and metabolism [45, 46]. Alterations in the integrity of MAM have been linked to processes underlying dementia [47–49]. Disruption of the communication networks between mitochondria and the rest of the cell is thought to contribute to aging and neurodegeneration [50, 51].
In this study, we used cellular bioenergetic profiling and label-free, quantitative proteomics in neuronal cells expressing apoE3 or apoE4 to identify the metabolic machinery perturbed by apoE4 expression and the compensatory mechanisms by which apoE4-expressing cells respond to bioenergetic challenges. ApoE4-expressing neurons display impaired mitochondrial energy production and a coordinated decrease in respiratory chain subunits. These changes are associated with a lower NAD+/NADH ratio, increased ROS production, and altered calcium handling (increased mitochondrial calcium) and are countered by increased levels of subsets of other mitochondrial proteins involved in mitochondrial morphology, protein transport, and protein degradation. Our results highlight the pronounced effects of apoE4 on neuronal metabolism, which likely lead to cellular decline and susceptibility to additional stressors.
MATERIALS AND METHODS
Cell lines
Mouse neuroblastoma N2a cell lines stably expressing full-length apoE3 or apoE4 (N2a-apoE3 and N2a-apoE4) have been described [52]. N2a cells have been used extensively in our laboratory and have served as a model system that displays numerous neuronal properties, which are modulated by apoE4 versus apoE3 expression [7, 12, 16–19]. Cells were cultured in minimum essential medium containing 10% fetal bovine serum (HyClone #SH30071.03), Glutamax, 1% nonessential amino acids, 1 mM sodium pyruvate, and 400μg/ml geneticin (G-418) (all from Thermo Fisher).
Seahorse-based metabolic profiling
The day before assays were done, N2a cell lines were seeded into Seahorse 96-well cell culture microplates precoated with poly-l-lysine (Sigma P4707). Wells were coated with 15μL of 0.01% poly-l-lysine solution for 30 min at 22°C and rinsed three times with 50μL of sterile phosphate-buffered saline (PBS) (Thermo Fisher). After the final wash was vacuum aspirated, cells were suspended, counted, seeded (15,000 per well) in 0.1 mL of complete cell culture medium, allowed to settle for 15–20 min at 22°C, and incubated at 37°C in 5% CO2. After 4 h, 0.1 mL of pre-warmed complete cell culture medium was added to all wells, and the cells were incubated at 37°C for 20 h.
The next day, assay medium was freshly prepared by supplementing Seahorse XF base medium [glucose- and bicarbonate-free Dulbecco’s modified Eagle’s medium (DMEM); Agilent 102353-100] with 4.5 g/L glucose (Sigma G7021), 1 mM sodium pyruvate (Sigma P2256), Glutamax, and nonessential amino acids; the medium was pre-warmed to 37°C at ambient CO2, and pH was adjusted to 7.4. Metabolic modulators were diluted in assay medium and loaded into a pre-equilibrated Seahorse cartridge.
During calibration of the cartridge, cells were removed from the incubator, and culture medium was replaced with assay medium by four near-complete (85%) volume exchanges with an electronic multichannel pipette set to a slow dispense rate. After equilibration for 25 min at 37°C at ambient CO2, cells were loaded into a Seahorse XF96e (Agilent). Cells were assayed with a 3-min mix/3-min measure cycle for three baseline measurements followed by two measurement cycles after each addition of metabolic modulators via ports A, B, and C. The following modulators were injected: 1–4μM oligomycin A (Sigma 75351) to inhibit ATP synthase; 0.2–1μM carbonyl cyanide 4-(trifluoromethoxy) phenylhydrazone (FCCP; Sigma C2920) to chemically uncouple respiration from the ATP synthesis [53]; and 5–25μM of the Na+/H+ antiporter monensin (Sigma M5273) and 0.5μM antimycin A (Sigma A8674) to drive maximal glycolytic activity in the absence of mitochondrial respiration [54]. Titration of metabolic modulators was performed to ensure no differential sensitivities existed between N2a-apoE3 and N2a-apoE4 cells and that fully inhibited or stimulated rates were always obtained for each Seahorse run. Nonmitochondrial respiration was determined by adding 0.5μM antimycin A to all wells via port D.
The protein content of each well was determined by aspirating the assay buffer at the end of the run, adding 10μL of RIPA buffer (Thermo Fisher 89901), incubating the mixture at low speed on a plate shaker for 10 min, and adding 100μL of bicinchoninic acid (BCA) assay mix (Thermo Fisher 23225). Bovine serum albumin calibration standards were included in the outer blank control wells. After a 30-min incubation, BCA absorbance (562 nm) was measured with a FlexStation 3 Multi-Mode Microplate Reader (Molecular Devices).
After subtraction of nonmitochondrial background, the oxygen consumption rate was normalized to the total protein content of each well. Basal, oligomycin-sensitive, and FCCP-stimulated respiration rates were determined as described [53, 55]. Basal and monensin-stimulated extracellular acidification rates were normalized to the protein content of each well and converted to proton production rates as described, using the reported buffering power of Seahorse DMEM [54, 55]. Glycolysis rates were estimated by correcting the proton production rates for acidification due to activity of the mitochondrial tricarboxylic acid cycle [54–56]. Rates of glycolytic and oxidative ATP production, the cellular glycolytic index, and the spare capacity for ATP production were calculated as described [55].
Cellular NAD(H) levels
NAD+ and NADH levels were measured with an NAD(H)-specific kit (BioVision K337-100) as recommended by the manufacturer. Briefly, cells on 24-well culture plates were washed with ice-cold PBS, lysed with 400μL of extraction buffer by two freeze-thaw cycles (freeze 20 min on dry ice, thaw 10 min at 22°C), harvested into tubes, vortexed for 10 s, and centrifuged at 20,000 g for 5 min at 4°C. Supernatants were divided for measurement of NADH+NAD+, NADH (after NAD+ decomposition at 60°C for 30 min), and protein content. Dinucleotide levels were normalized to protein content determined by BCA assay and expressed relative to the levels in N2a-apoE3 cells for each independent experiment.
ROS levels
Cellular ROS levels were estimated by flow cytometry (BD FACSCalibur, BD Biosciences) after incubation of cells with the cell-permeable ROS indicator CellROX Orange (Invitrogen C10443). Unstimulated cells grown under standard culture conditions were washed with PBS and harvested with enzyme-free cell-dissociation buffer. Cells were pelleted at 300 g for 3 min and resuspended in Hanks’ balanced salt solution (Invitrogen 14025) containing 10 mM HEPES (Invitrogen 15630) and 5μM CellROX Orange for 30 min in an incubator. Cells were washed with Hanks’ balanced salt solution containing 10 mM HEPES, and the average fluorescence intensity of 20,000 cells was measured for each cell line.
Cellular ATP content
Total cellular ATP was measured in equal numbers of N2a-apoE3 and N2a-apoE4 cells after a 1-h incubation under conditions designed to drive ATP production from respiration with or without glycolysis and in response to differing energetic demand. To generate these conditions, basal DMEM containing l-glutamine (Gibco 11966025), but neither glucose nor pyruvate, was supplemented with 5 mM glucose (Sigma G7528) and 5 mM sodium pyruvate (Sigma P2256) to create “Basal Glycolysis + Respiration” medium; with 5 mM galactose (Sigma G0750) and 5 mM sodium pyruvate to create “Basal Respiration Only” medium; with 5 mM glucose, 5 mM sodium pyruvate, 10μM oligomycin A, and 20μM FCCP to create “Stimulated Glycolysis Only” medium); or with 5 mM 2-deoxyglucose (Sigma D8375), 5 mM sodium pyruvate, and 1μM monensin to create “Stimulated Respiration Only” medium. Monensin was used in place of FCCP in this condition because FCCP prevents ATP production by mitochondrial respiration, whereas monensin induces a strong energetic demand in the cytosol while allowing mitochondria to produce ATP through pyruvate oxidation [54].
Nearly confluent cells were dissociated with enzyme-free cell-dissociation buffer for 3 min, diluted with cell culture medium, pelleted, and rinsed by resuspension in PBS. Cells were counted and diluted to 400,000 cells per mL with each of the four media, and 20,000 cells/well were seeded into triplicate wells of white-walled 96-well plates (ATP measurement) or clear 96-well plates (protein measurement). The ATP plate was incubated for 1 h at 37°C in a humidified incubator containing 5% CO2. Total ATP was measured with a luciferase-based assay (Cell Titer Glo 2.0, Promega G9242). Assay reagent (50μL) was added to each well, cells were lysed on shaker plates for 3 min and incubated at room temperature for 10 min, and total luminescence was measured with a FlexStation 3 Multi-Mode Microplate Reader. Protein content was measured by BCA assay as described above. Protein content did not differ in equivalent numbers of N2a-apoE3 and N2a-apoE4 cells. Total ATP content under the standard condition (“Basal Glycolysis + Respiration”) was the same in both cell lines; ATP content under the other conditions was normalized to the baseline level to reflect relative changes in ATP in response to differing energetic demand.
Cellular growth
The relative long-term growth rate of N2a-apoE3 and N2a-apoE4 cells under “Glycolysis + Respiration” and “Respiration Only” conditions was determined by culturing each line for 48 h in DMEM (Gibco 11966025) supplemented with 10% fetal bovine serum, 5 mM sodium pyruvate, and either 5 mM glucose (ATP generated by glycolysis and respiration) or 5 mM galactose (ATP generated by respiration only). Near-confluent cultures were passaged, resuspended in each medium, seeded at 20,000 cells per well in standard 96-well culture plates, cultured for 4, 24, or 48 h, and rinsed with PBS. The total protein content of each well was then measured by BCA assay as described above. Protein content at 4 h after seeding was unchanged, so growth at 24 and 48 h was normalized to this value for each cell line and condition.
Live cell calcium (Ca2+) imaging
Ca2+ imaging was done at 37°C in live cell imaging solution (LCIS; Invitrogen A14291DJ) containing 140 mM NaCl, 2.5 mM KCl, 1.8 mM CaCl2, 1 mM MgCl2, 20 mM HEPES (300 mOsm, pH 7.4), and 10 mM glucose. Intracellular Ca2+ was measured with Fura-2 AM (Invitrogen F1221); mitochondrial Ca2+ was measured with Rhod-2 AM (Invitrogen R1244). Cells were plated on 27-mm glass-bottom dishes (Nunc 150682) coated with poly-l-lysine (Sigma P4707). The next day, cells were washed twice with LCIS + glucose and incubated for 45 min with 5μM Fura-2 AM (excitation, 340/380 nm; emission, 510 nm) and 5μM Rhod-2 AM (excitation, 552 nm; emission, 570 nm) in LCIS + glucose with 0.02% pluronic acid F-127 (Invitrogen P3000MP) in 5% CO2 at 37°C. Cells were rinsed three times with LCIS + glucose and incubated for 15 min.
Ca2+ imaging was done at 40x magnification on an inverted epifluorescence microscope (Zeiss Axio Observer.Z1, Carl Zeiss Microscopy) equipped with an ORCA-ER sCMOS camera (Hamamatsu Photonics). Fura-2 AM was alternately excited with ultraviolet light from a Lambda DG4 illumination system equipped with an optical splitter (Sutter Instruments). Ca2+ was measured under basal conditions, and increases in the level and rate of change were measured for up to 8 min after the addition of 2 mM CaCl2 or 5μM thapsigargin (Sigma T9033). The Ca2+ influx rate was calculated by using the slope of the linear fit of the change in the ratio (ΔRatio) or fluorescence (ΔF) 2 min after initiation of apparent influx (ΔRatio/Δt or ΔF/Δt). Images were processed with Zen Pro software (Carl Zeiss Microscopy).
Label-free quantitative proteomic profiling
Nearly confluent N2a-apoE3 and N2a-apoE4 cells on 25-cm dishes were rinsed once with 10 mL of ice-cold PBS, scraped off the plate with 10 mL of fresh, ice-cold PBS, and pelleted at 1500 g for 10 min at 4°C. The supernatant was decanted, and cells were rinsed by resuspension in 10 mL of fresh, ice-cold PBS, pelleted at 1500 g for 10 min at 4°C, flash frozen on dry ice, and stored at –80°C until all replicates were collected. Three independent sets of cultures were harvested separately but processed in parallel for LC-MS/MS analysis.
Cells were lysed by probe sonication on ice in a buffer composed of 8 M urea, 100 mM ammonium bicarbonate (pH 8.0), 150 mM NaCl, cOmplete Mini protease inhibitor cocktail (Sigma 11836153001), and phosphatase inhibitor cocktails 2 and 3 (Sigma P5726 and P0044). To reduce proteins, 4 mM TECP was added and lysates were incubated at 22°C for 30 min. To alkylate cysteines, 10 mM iodoacetamide was added and lysates were incubated in the dark at 22°C for 30 min. Alkylation was quenched by adding 10 mM dithiothreitol and incubating the lysates in the dark at 22°C for 30 min. Proteins were digested overnight at 37°C by adding trypsin (Promega) at a 1:100 enzyme:substrate ratio. Samples were acidified (pH 2) with trifluoroacetic acid and desalted in C18 SepPak cartridges (Waters).
Peptides were resuspended in 4% formic acid and 3% acetonitrile, and approximately 1 μg was loaded onto a 75-μm ID column packed with 25 cm of Reprosil C18 1.9-μm, 120-Å particles (Dr. Maisch GmbH HPLC). Peptides were eluted into an Orbitrap Fusion Tribrid mass spectrometer (Thermo Fisher) with an acetonitrile gradient (5–35% over 165 min) delivered by an Easy1000 nLC system (Thermo Fisher). All MS1 spectra were collected in the orbitrap, and the most abundant ions fragmented by higher-energy collisional dissociation were detected in the ion trap. All data were searched against the Mus musculus UniProt database. Peptide and protein identification searches and label-free quantitation were done with the MaxQuant [57, 58] data analysis algorithm, and all peptide and protein identifications were filtered to a 1% false-discovery rate. Label-free quantification and statistical analysis were done with MSstats [59].
Enrichment of specific cellular pathways and associated functions in proteins whose levels increased or decreased significantly was determined by inputting lists of proteins into Gene Ontology analysis and KEGG pathway analysis with DAVID v6.7 [60–62]. Enrichment in genes putatively regulated by specific transcription factors was determined by using default settings in PASTAA and Pscan analyses [63, 64]. Briefly, lists of proteins significantly increased (501 proteins) or decreased (606 proteins) at a p < 0.01 threshold were queried together to identify the transcription factors most likely to drive the coordinated changes in protein expression in N2a-apoE4 cells. For each analysis platform, the 10 transcription factors most significantly associated with changes in protein expression are presented in Table 1.
Table 1
Transcriptional factors predicted to regulate differentially expressed proteins in N2a-apoE4
| Pscan Rank | Transcription Factor | p | PASTAA Rank | Transcription Factor | p |
| 1 | NRF1 | 3.09E-67 | 1 | NRF2a | <1.00E-06 |
| 2 | ETV5 | 2.05E-57 | 2 | E2F | <1.00E-06 |
| 3 | ELK1 | 3.98E-54 | 3 | NFY | <1.00E-06 |
| 4 | SP4 | 1.10E-53 | 4 | NRF1 | <1.00E-06 |
| 5 | KLF14 | 3.36E-53 | 5 | E2F1 | <1.00E-06 |
| 6 | Tcfl5 | 1.76E-52 | 6 | GC | <1.00E-06 |
| 7 | ELK3 | 1.48E-51 | 7 | GABP/Gabpab | <1.00E-06 |
| 8 | GABP/Gabpab | 2.81E-51 | 8 | E2F1/DP1RB | <1.00E-06 |
| 9 | HINFP | 7.82E-50 | 9 | E2F4/DP1 | <1.00E-06 |
| 10 | ELK4 | 1.37E-49 | 10 | ELK1 | <1.00E-06 |
The top 10 ranked transcription factors identified by Pscan and PASTAA analyses by inputting all proteins significantly changed in N2a-apoE4 cells versus N2a-apoE3 cells at the p < 0.01 level. Higher-ranking factors are those known or predicted to regulate the transcription of genes encoding proteins significantly changed in N2a-apoE4 cells. Transcription factors in bold regulate expression of mitochondrial, metabolic, or redox-related genes and/or are involved in the response to neurodegenerative disease or mitochondrial insults. E2F, E2F1, E2F1/DP1RB, E2F4/DP1, E2F family transcription factors; NFY, nuclear transcription factor Y; ELK1, 3, 4, ETS domain-containing proteins Elk-1, 3, 4; ETV5, ETS variant 5; GABP/Gabpa, GA binding protein (alpha) or nuclear respiratory factor 2; GC, general GC box recognition factors; HINFP, histone H4 transcription factor; KLF14, Krüppel-like factor 14; NRF1, nuclear respiratory factor 1; NRF2, nuclear factor erythroid-2-like 2; Tcfl5, transcription factor like 5. aNote that NRF2 refers to “nuclear factor erythroid-2-like 2” and not “nuclear respiratory factor 2,” which is officially named GABP/Gabpa. bNote that for GA binding protein, Pscan lists only the DNA-binding alpha subunit while PASTAA lists GABP, the abbreviation for complete heterotetrameric factor.
Data analysis
Values are presented as mean±SD. Except for analyses of the unbiased proteomics described above, statistical differences between conditions were analyzed by t test, one-sample t test, or ANOVA with Holm-Sidak post-hoc analysis using Prism 7.03; p < 0.05 was considered significant.
RESULTS
ApoE4 expression alters the bioenergetics profile in neuronal cells
As shown by bioenergetic profiling with Seahorse, apoE4-expressing neuronal cells had significantly lower rates of basal and FCCP-stimulated respiration than apoE3-expressing cells (Fig. 1A). In contrast, the basal glycolytic rate (estimated as the proton production rate) [56] showed that apoE4-expressing cells shift to glycolysis to meet energy demands under basal conditions (Fig. 1B). Interestingly, the maximal glycolysis rate was similar in apoE3- and apoE4-expressing cells when glycolysis was stimulated by monensin and respiration was inhibited by antimycin A. Thus, it seems that despite enhanced glycolysis under basal conditions, apoE4-expressing cells cannot call upon greater glycolytic reserves during periods of high energy demand to compensate for their lower respiration rate.
Fig.1
ApoE4 expression limits the bioenergetic capacity of neural cells. A) Respiration rates of N2a-apoE3 and N2a-apoE4 cells under basal and FCCP-stimulated conditions. B) Estimated glycolytic rates of N2a-apoE3 and N2a-apoE4 cells under basal and monensin- and antimycin A–stimulated conditions. C) ATP production rates calculated from mitochondrial and glycolytic rates under basal conditions in A and B. Total ATP production rate is the sum of OXPHOS and glycolytic rates for each cell line. D) Spare ATP production capacity for mitochondrial and glycolytic sources during maximal stimulation. E) Bioenergetic space plot of mitochondrial and glycolytic ATP production rates under basal, ATP-synthase inhibited (Oligomycin), respiration-stimulated (FCCP), or glycolysis-only stimulated (Monensin + Antimycin A) conditions. The dashed line marks the transition where cells generate over 50% of their ATP from OXPHOS (above dashed line) or from glycolysis (below dashed line). FCCP-stimulated ATP production rates are theoretically based on expected ATP from coupled mitochondria respiring at the same rate. A–E, values are mean±SD (n = 6). *p < 0.05, **p < 0.01, ***p < 0.001, #p < 0.0001 versus N2a-apoE3 under same condition by t test. Mon, monensin; AA, antimycin A.
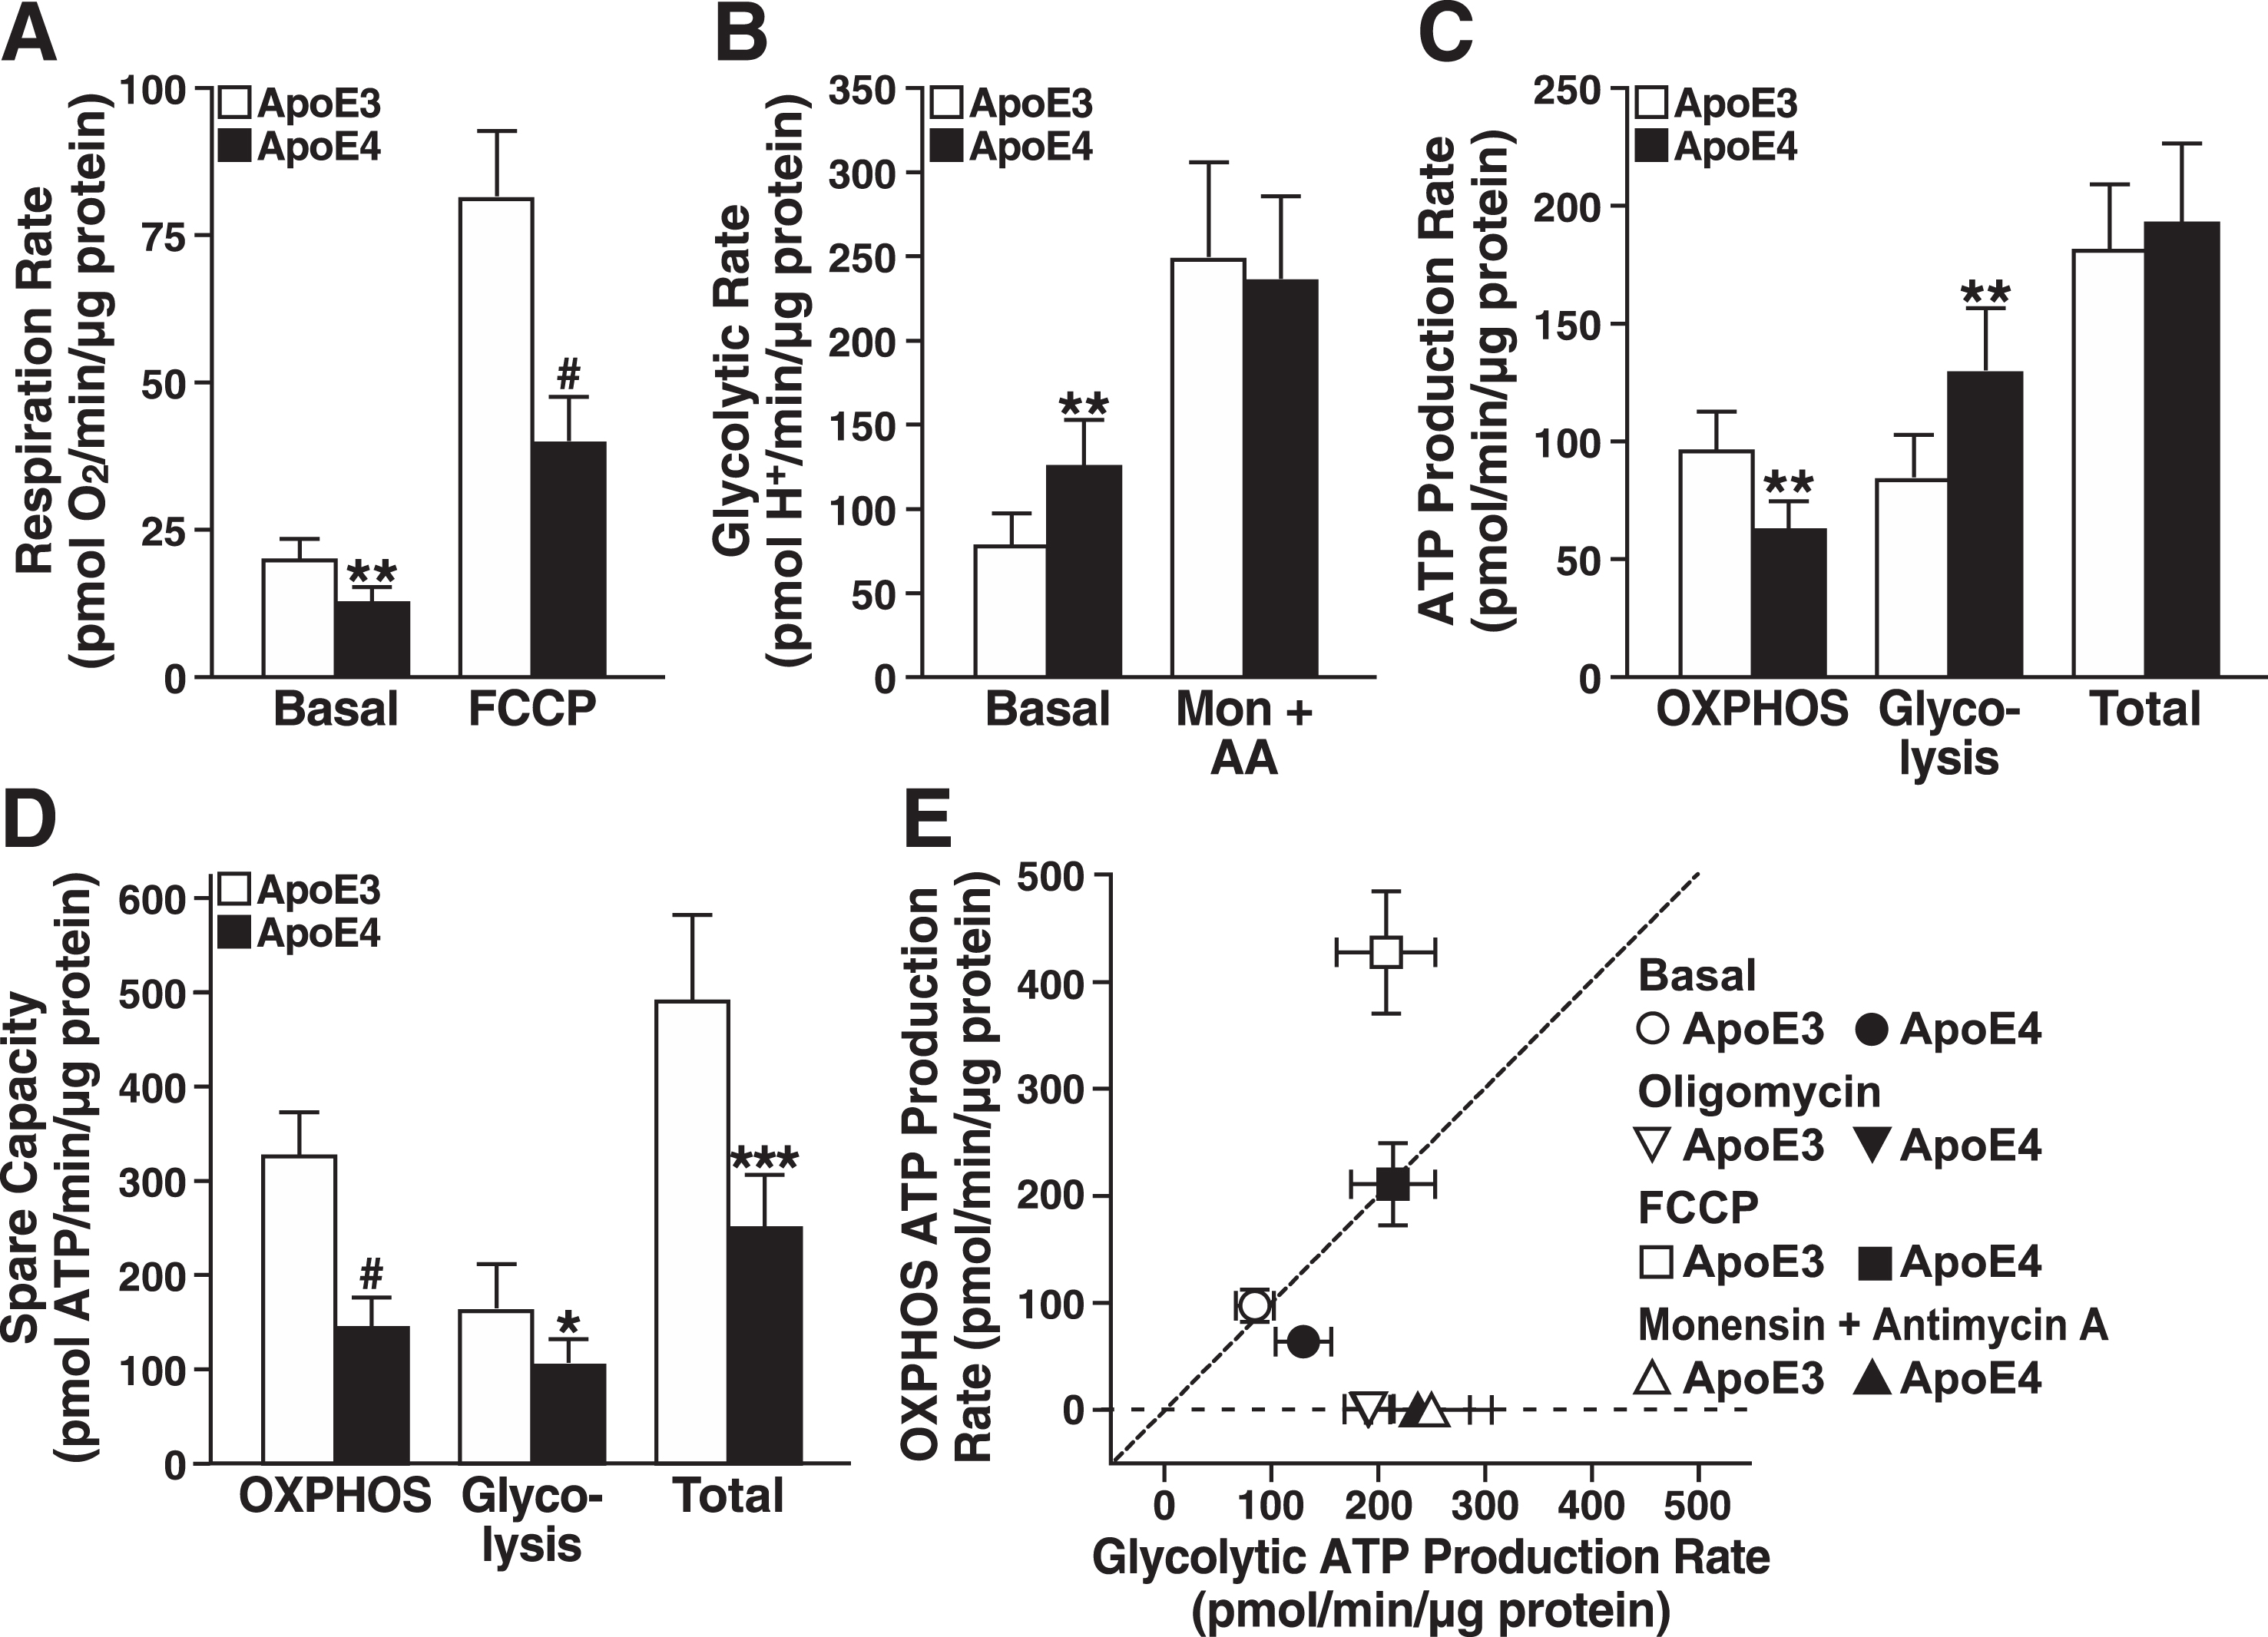
Oxygen consumption and proton production rates reflect metabolism in intact cells but do not directly equate to ATP production. To better evaluate actual changes in rates of energy production and shifts in metabolism [55], we estimated the ATP production rates attributable specifically to oxidative phosphorylation (OXPHOS) or glycolysis under basal and stressful conditions. ATP production rates by OXPHOS in apoE4 cells were 33% lower and were increased to a greater extent by glycolysis than in apoE3 cells (Fig. 1C). The combined total ATP production rates under basal conditions were similar. However, under maximal stress stimulation of respiration with FCCP and stimulation of glycolysis with monensin and antimycin A, apoE4-expressing neurons, unlike those expressing apoE3, lacked spare capacity to generate significant ATP levels by OXPHOS and glycolysis (Fig. 1D). In fact, the total reserve capacity was about 50% lower in apoE4-expressing cells.
As shown by bioenergetic space plots (Fig. 1E) [55], apoE4-expressing cells were more reliant on glycolysis under basal conditions than apoE3 cells; however, glycolytic ATP production by apoE3- and apoE4-expressing cells increased to comparable levels when mitochondrial ATP synthesis was blocked with oligomycin or when respiration was inhibited with antimycin A and monensin. Strikingly, when cells were stressed with FCCP, ATP production by glycolysis in apoE4-expressing cells was similar to that in apoE3-expressing cells, but ATP production by OXPHOS was markedly lower. Thus, apoE4-expressing cells appear to lack both the capacity to meet high levels of energy demand and the metabolic flexibility to respond to stress.
ApoE4 expression impairs cellular responses to metabolic stress
ATP levels were measured in the apoE3- and apoE4-expressing cells under basal and stimulated (stressed) conditions to determine whether the apoE4 metabolic inflexibility observed acutely (i.e., lack of spare respiratory capacity in Seahorse profiling) resulted in short-term (1 h) deficits in whole-cell energy level. Basal ATP levels were similar in apoE3- and apoE4-expressing cells in a luciferase-based assay (9.9±2.2 versus 8.1±3.1 integrated counts per cell, respectively) (Fig. 2A). Surprisingly, under conditions that prevent net ATP production by glycolysis (basal respiration only) [65], apoE4-expressing cells maintained total ATP levels during the 1-h challenge, possibly by decreasing energy utilization or increasing reliance on glycogen stores. Under conditions that increase ATP demand by glycolysis and impair mitochondrial ATP production (stimulated glycolysis only), apoE3- and apoE4-expressing cells showed a similar partial loss of cellular ATP production. However, when the mitochondria were forced to produce ATP from pyruvate oxidation in the absence of glucose (stimulated respiration only), total ATP levels decreased markedly in both cell lines, but the apoE4-expressing cells had a small, but significantly greater deficit in energy levels (Fig. 2A). Evidently, apoE4 expression is associated with metabolic inflexibility under conditions of high-energy demand.
Fig.2
ApoE4 causes metabolic inflexibility in neuronal cells. A) Total ATP levels in N2a-apoE3 and N2a-apoE4 cells normalized to basal glycolysis and respiration (5 mM glucose and 5 mM pyruvate) (Basal Glyc. + Resp.). The other conditions are basal respiration only (5 mM galactose added in place of glucose) (Basal Resp. Only); stimulated glycolysis only (metabolism stimulated by depolarizing cellular membranes with 20μM FCCP and blocking ATP synthase with 10μM oligomycin) (Stim. Glyc. Only); and stimulated respiration only (energetic demand induced by both futile phosphorylation of 5 mM 2-deoxyglucose and Na+ cycling by 1μM monensin) (Stim. Resp. Only). Values are mean±SD (n = 4). *p < 0.05 versus N2a-apoE3 cells under same condition (t test). B) Growth of N2a-apoE3 and N2a-apoE4 cells in medium containing 5 mM pyruvate and either 5 mM glucose (to support glycolysis and respiration) or 5 mM galactose (to support respiration only). Values are mean±SD (n = 3). *p < 0.05, ***p < 0.001 versus N2a-apoE4 + galactose cells at the 48-h time point (one-way ANOVA with Holm-Sidak post test).
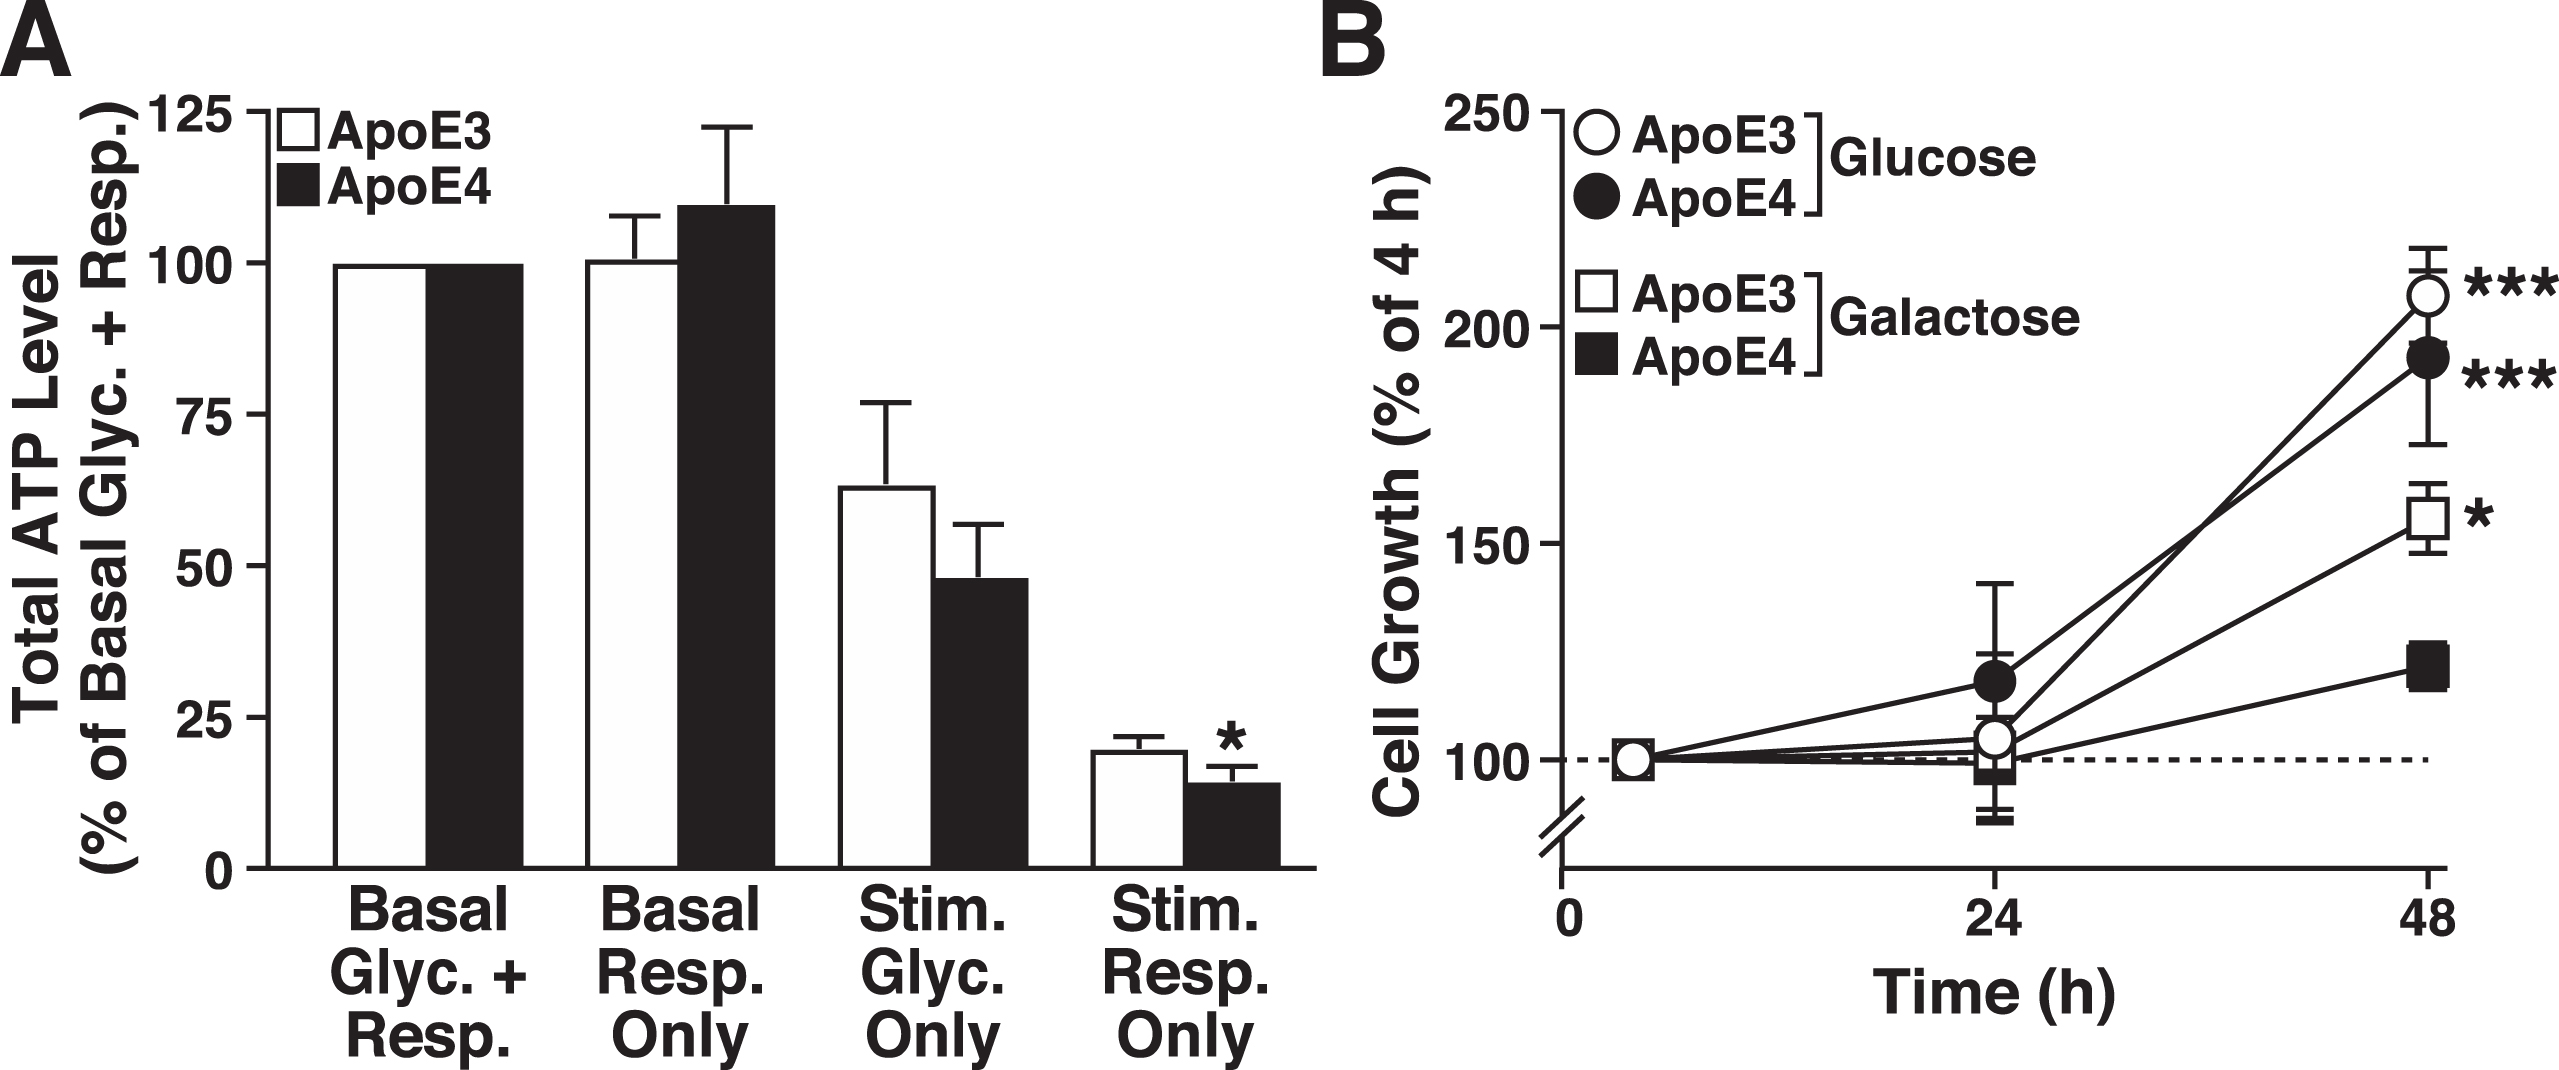
To examine the effects of apoE4 on metabolic inflexibility over a longer period, we examined the growth of apoE3- and apoE4-expressing cells (4, 24, and 48 h) under basal conditions and under conditions that restricted ATP production to mitochondria (Fig. 2B). When forced to use mitochondria to generate ATP, both cell lines grew slower than under basal conditions, a response common in cells restricted to grow only on mitochondrial energy production [66]; however, the slowing was significantly greater in the apoE4-expressing cells. Thus, apoE4 expression impairs mitochondrial energy production, leading to metabolic inflexibility and inability to respond to metabolic demand.
ApoE4 expression decreases the NAD+/NADH ratio, increases ROS production, and impairs mitochondrial Ca2+ flux
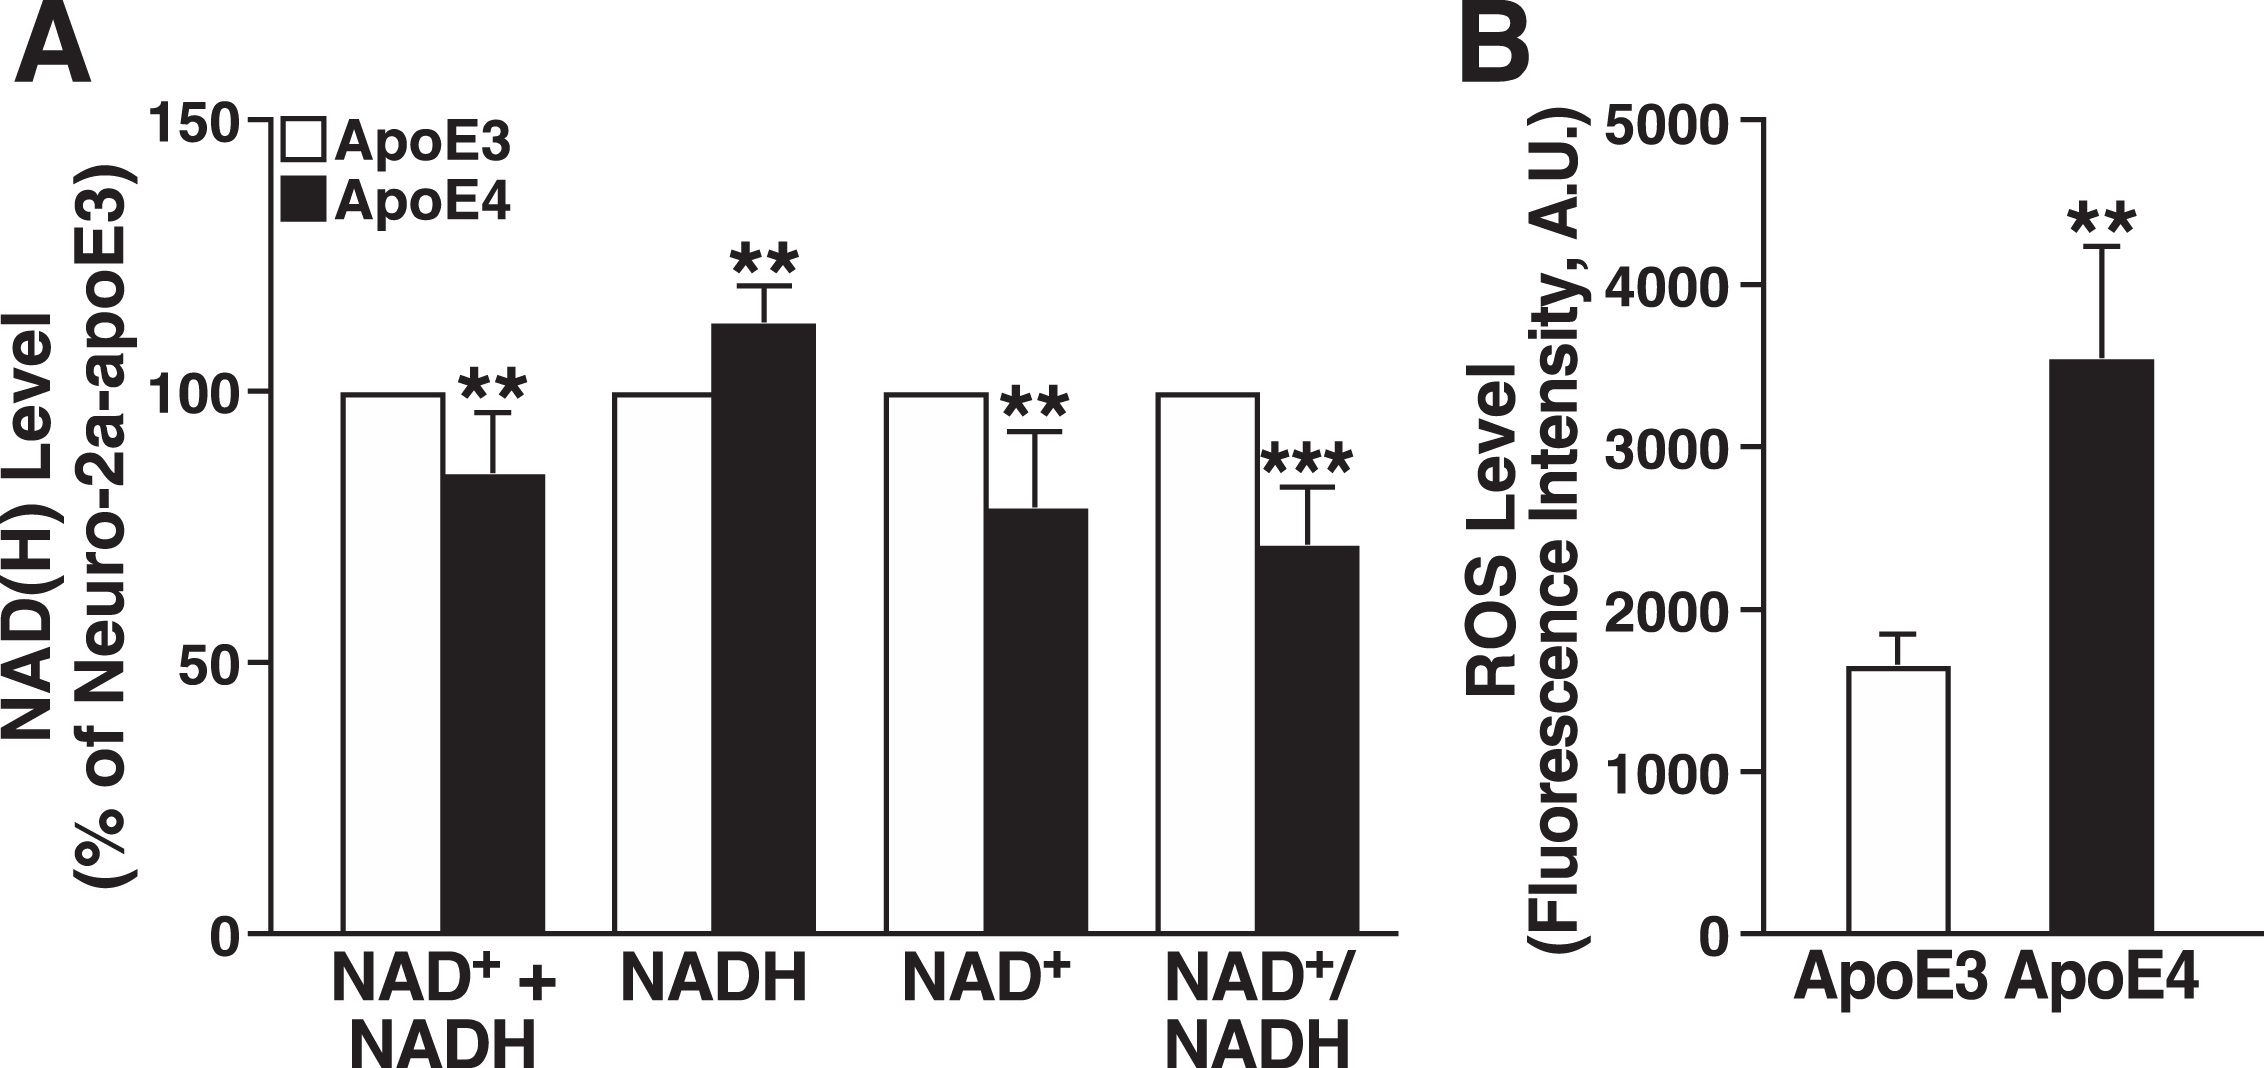
Impaired mitochondrial respiration can alter NAD+ and NADH levels in various ways, including slowing the oxidation of NADH by complex I [67]. We found that NADH was significantly higher, and NAD+ was significantly lower, in apoE4-expressing cells, resulting in a lower NAD+/NADH ratio (Fig. 3A). Interestingly, the total NAD+ + NADH pool was smaller in the apoE4 cells, suggesting that apoE4 impairs NAD+ synthetic capacity [68]. Impaired mitochondrial respiration is also associated with altered redox homeostasis and excess ROS production [69]. Intracellular ROS levels determined by CellROX assay were approximately twofold higher in apoE4-expressing cells (Fig. 3B).
Fig.3
ApoE4 expression decreases the NAD+/NADH ratio and increases ROS production. A) Total levels of NAD+ + NADH, NADH, NAD+, and NAD+/NADH ratio in N2a-apoE4 cells under basal conditions relative to those in N2a-apoE3 cells (n = 5). One sample t test with theoretical mean at 100% (no change from level in N2a-apoE3 cells). B) Intracellular ROS levels in N2a-apoE3 and N2a-apoE4 cells stained with CellROX Orange (n = 3). Values are mean±SD. **p < 0.01, ***p < 0.001 versus N2a-apoE3 under same condition (t test). A.U., arbitrary units.
Ca2+ is a key regulator of mitochondrial function, and excessive Ca2+ uptake is linked to mitochondrial dysfunction [70]. Ca2+ levels in the cytoplasm and mitochondria were measured with Fura-2 AM and Rhod-2 AM, respectively, in apoE3- and apoE4-expressing cells (Fig. 4). The two cell lines did not differ in basal cytosolic Ca2+ levels (Fig. 4A) or in overall Ca2+ influx induced by extracellular Ca2+ (Fig. 4B). Although the cytosolic Ca2+ level did not differ between apoE3- and apoE4-expressing cells at 8 min (Fig. 4C), the rate of cytosolic Ca2+ influx was twofold higher in apoE4 cells (Fig. 4D). In contrast, in response to extracellular Ca2+, both the basal mitochondrial Ca2+ level (Fig. 4E) and the rate of Ca2+ influx into mitochondria in response to extracellular Ca2+ were much greater in cells expressing apoE4 (Fig. 4F, H), culminating in twofold higher levels of mitochondrial Ca2+ (Fig. 4G). Thus, apoE4 cells regulate mitochondrial Ca2+ differently from apoE3 cells.
Fig.4
ApoE4 alters mitochondrial Ca2+ handling in neuronal cells. A) Basal cytosolic Ca2+ levels measured by Fura-2 AM in unstimulated N2a-apoE3 and N2a-apoE4 cells. B) Representative traces of Ca2+-induced increases in cytosolic Ca2+ levels after bolus addition of CaCl2. C) Cytosolic Ca2+ levels 8 min after CaCl2 addition. D) Cytosolic Ca2+ influx rate after CaCl2 addition. E) Basal mitochondrial Ca2+ levels measured as average fluorescence intensity of Rhod-2 AM dye in unstimulated N2a-apoE3 and N2a-apoE4 cells. F) Representative traces of Ca2+-induced increases in mitochondrial Ca2+ levels after bolus addition of CaCl2. G) Mitochondrial Ca2+ levels 8 min after CaCl2 addition. H) Mitochondrial Ca2+ influx rate after CaCl2 addition. I) Representative traces of thapsigargin-induced changes in cytosolic Ca2+ levels measured by Fura-2 AM. J) Cytosolic Ca2+ levels 6 min after thapsigargin addition. K) Representative traces of thapsigargin-induced changes in mitochondrial Ca2+ levels measured by Rhod-2 AM. L) Mitochondrial Ca2+ levels 6 min after thapsigargin addition. Values are mean±SD; four independent experiments; 25–40 individual cells per group were averaged for each independent experimental replicate. **p < 0.01, ***p < 0.001, #p < 0.0001 versus N2a-apoE3 (t test). A.U., arbitrary units.
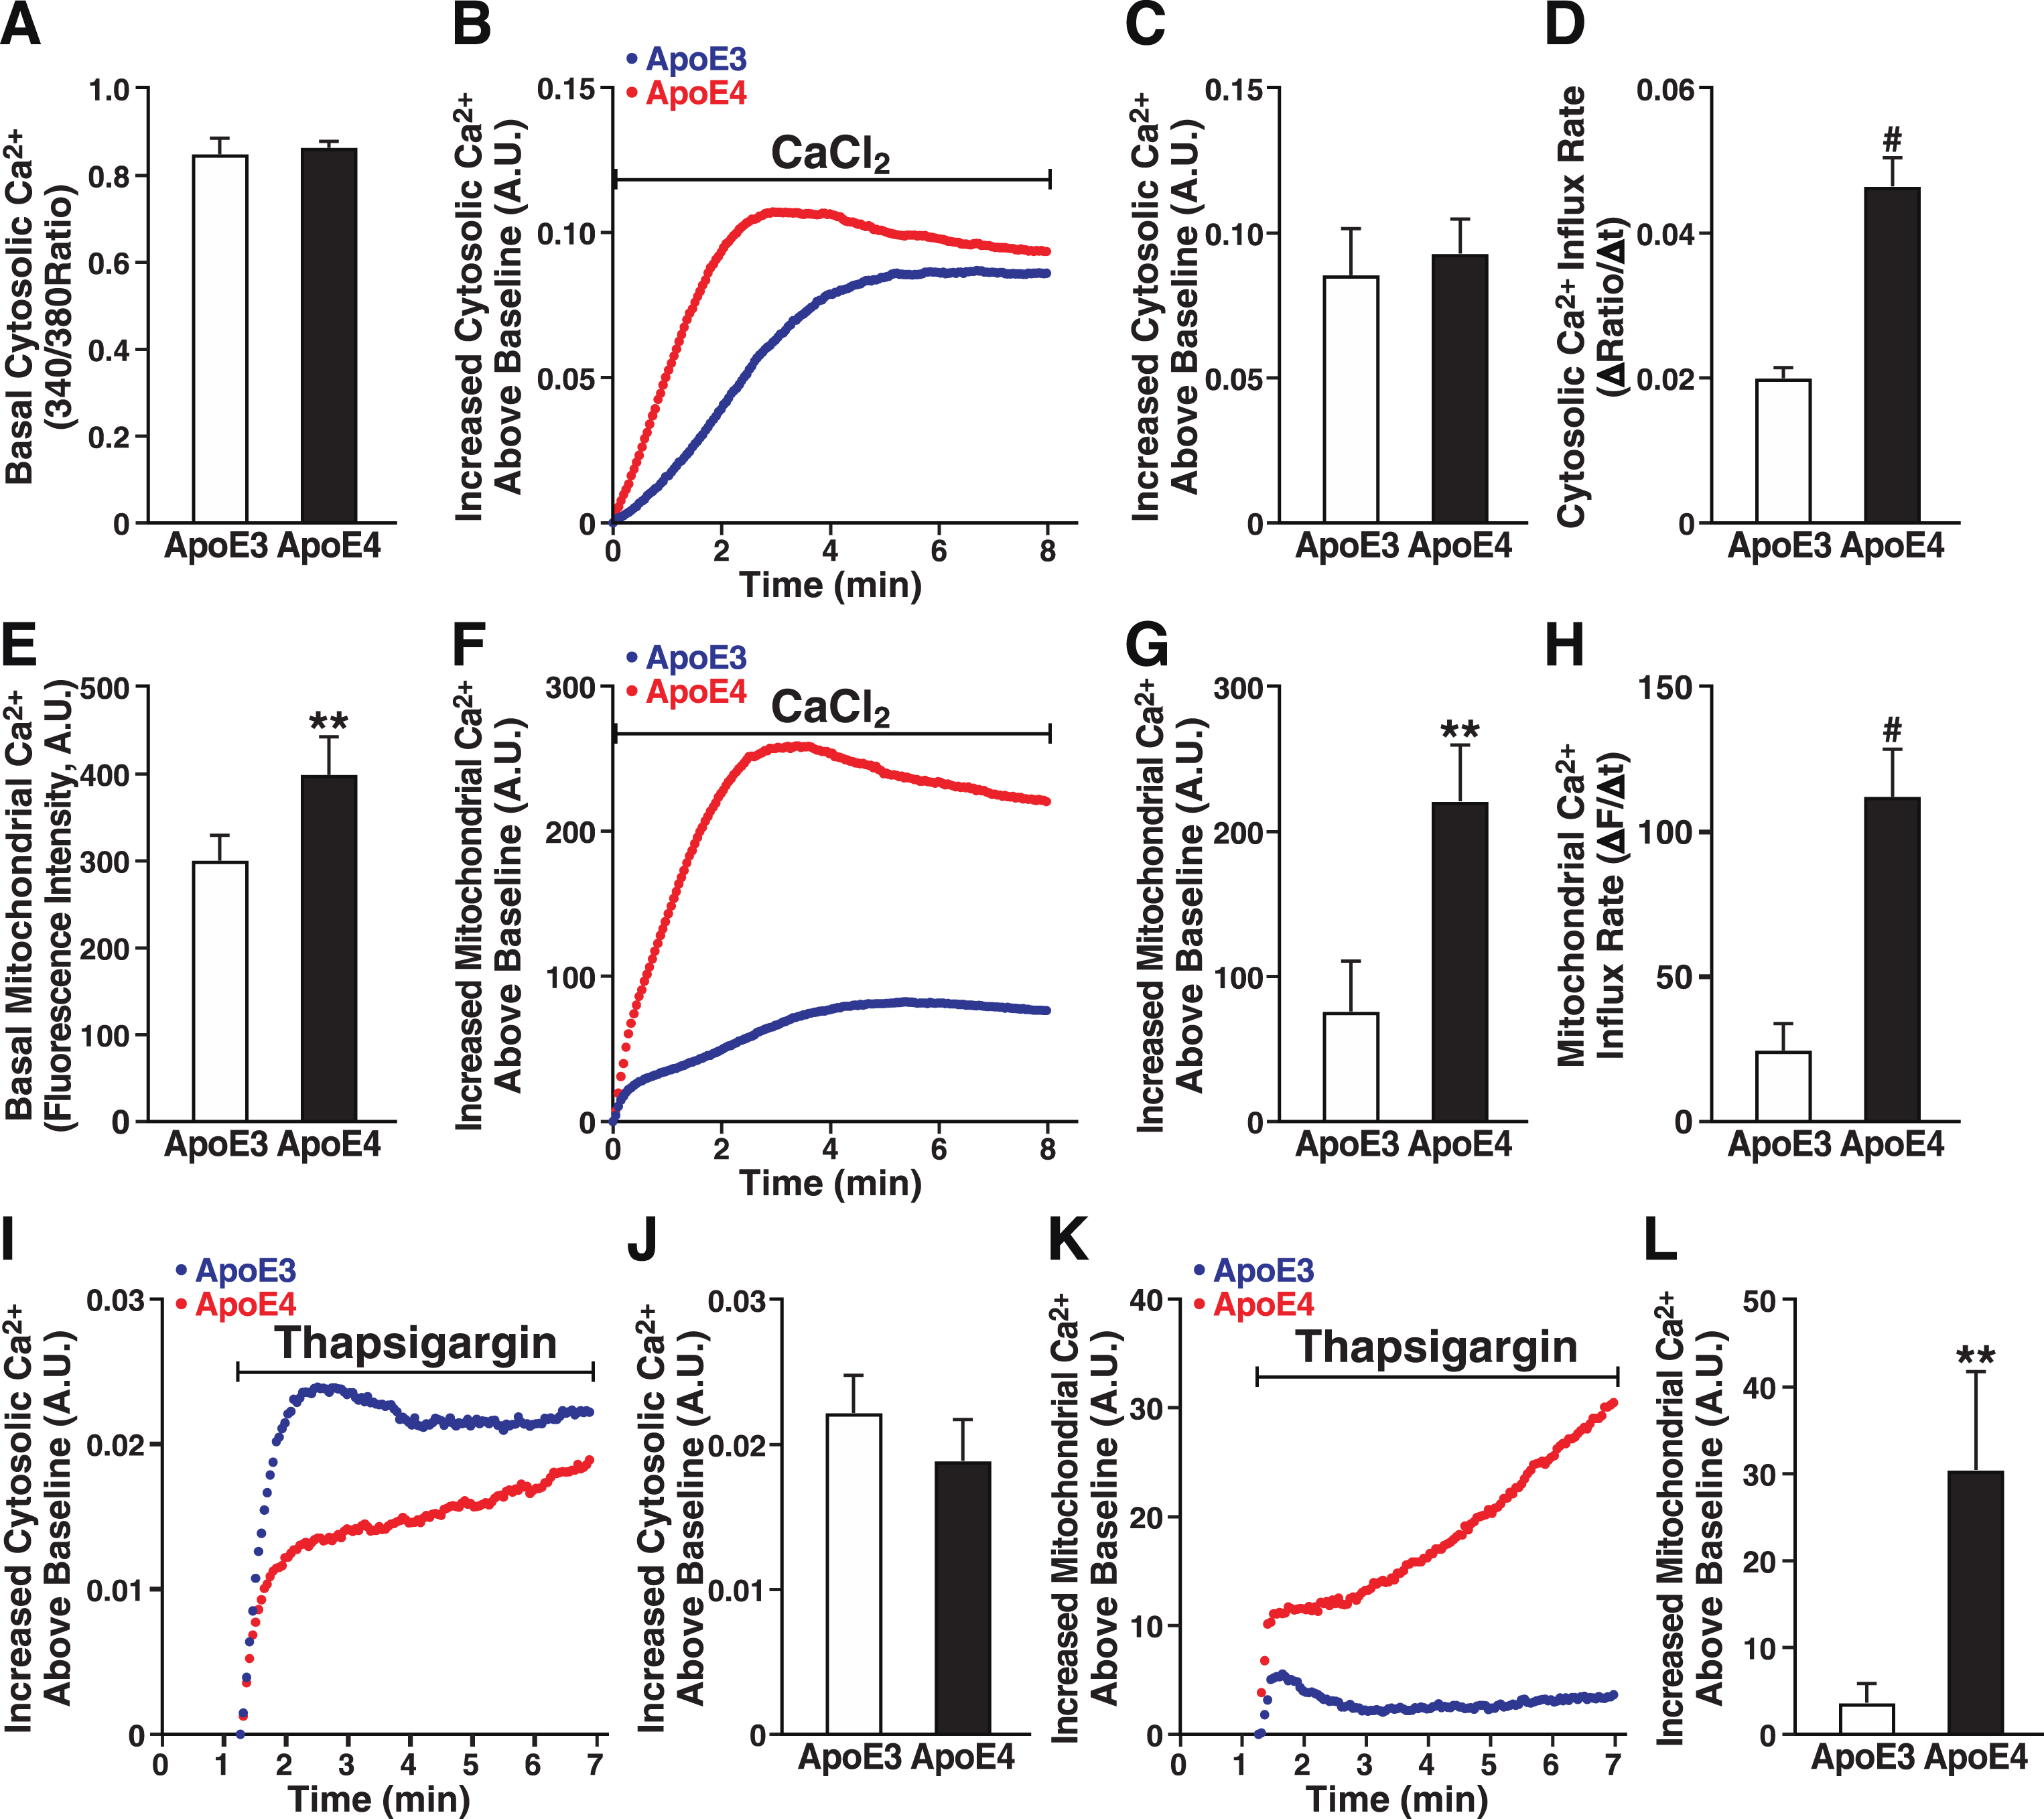
To assess the effect of apoE4 on mitochondrial Ca2+ handling, we treated the cells with thapsigargin, which induces Ca2+ release from ER stores, increases cytosolic Ca2+, and facilitates mitochondrial Ca2+ uptake at sites closely apposed to the ER membrane [71]. Cytosolic Ca2+ influx after treatment with thapsigargin was not significantly lower in apoE4 than apoE3 cells (Fig. 4I, J), but mitochondrial Ca2+ influx was significantly greater in apoE4 cells (Fig. 4K), resulting in nearly eightfold higher levels (Fig. 4L). The initial lower cytosolic Ca2+ influx coincided with the initial higher mitochondrial Ca2+ influx in apoE4 than in apoE3 cells, suggesting that Ca2+ released from the ER of apoE4 cells flowed more quickly into mitochondria, bypassing the cytoplasm. Thus, mitochondria in apoE4 cells have a higher resting level of Ca2+ and accumulate Ca2+ faster and to higher levels.
ApoE4 expression alters the neuronal proteome, mitochondrial OXPHOS subunits, and metabolic pathways
Label-free, quantitative proteomic profiling of whole-cell lysates from N2a-apoE3 and N2a-apoE4 cells by LC-MS/MS identified approximately 4500 distinct proteins (Fig. 5A). Over one-third differed in their expression in apoE4 versus apoE3 cells; similar numbers of proteins were significantly increased or decreased (p < 0.05). According to the MitoCarta 2.0 database [72], 654 proteins were specific to or associated with mitochondria. ApoE4 expression altered the levels of 44% of these proteins; similar numbers were significantly increased or decreased. Using the MitoMiner 4.0 database [73] and the Gene Ontology “Mitochondrion” category [74, 75], we identified 953 proteins associated with mitochondria; the levels of 42% of those proteins were significantly changed by apoE4 expression, again with equal numbers increased and decreased (Fig. 5A). Volcano plots of –log10 (adjusted p-value) significance levels versus fold change in protein levels confirmed that there were both significantly higher and significantly lower levels of subsets of mitochondrial proteins in the apoE4-expressing cells (Fig. 5B).
Fig.5
ApoE4 expression has widespread effects on the proteome of neuronal cells. A) Summary of total, mitochondria-specific, and mitochondria-associated proteins shown by LC-MS/MS to be significantly altered in N2a-apoE4 versus N2a-apoE3 cells. Total proteins detected are those accurately mapped to unique proteins in N2a-apoE3 or N2a-apoE4 cells. Mitochondria-specific proteins are those mapped to proteins in the MitoCarta 2.0 database. Mitochondria-associated proteins include additional proteins in the MitoMiner 4.0 database and the Gene Ontology “Mitochondrion” category (GOMitochondrion). Changed proteins were those whose levels differed (p < 0.05) between N2a-apoE4 and N2a-apoE3 cells. B) Volcano plot of all proteins detected in N2a-apoE3 and N2a-apoE4 cells. –Log10 (p-value) greater than 14 (p = 0 in analysis of the proteomics data set) were arbitrarily assigned a value of 15. C) Bar plot of Gene Ontology and KEGG pathways enriched in proteins that were significantly decreased in N2a-apoE4 cells. D) Bar plot of Gene Ontology and KEGG pathways enriched in proteins that were significantly increased in N2a-apoE4 cells.
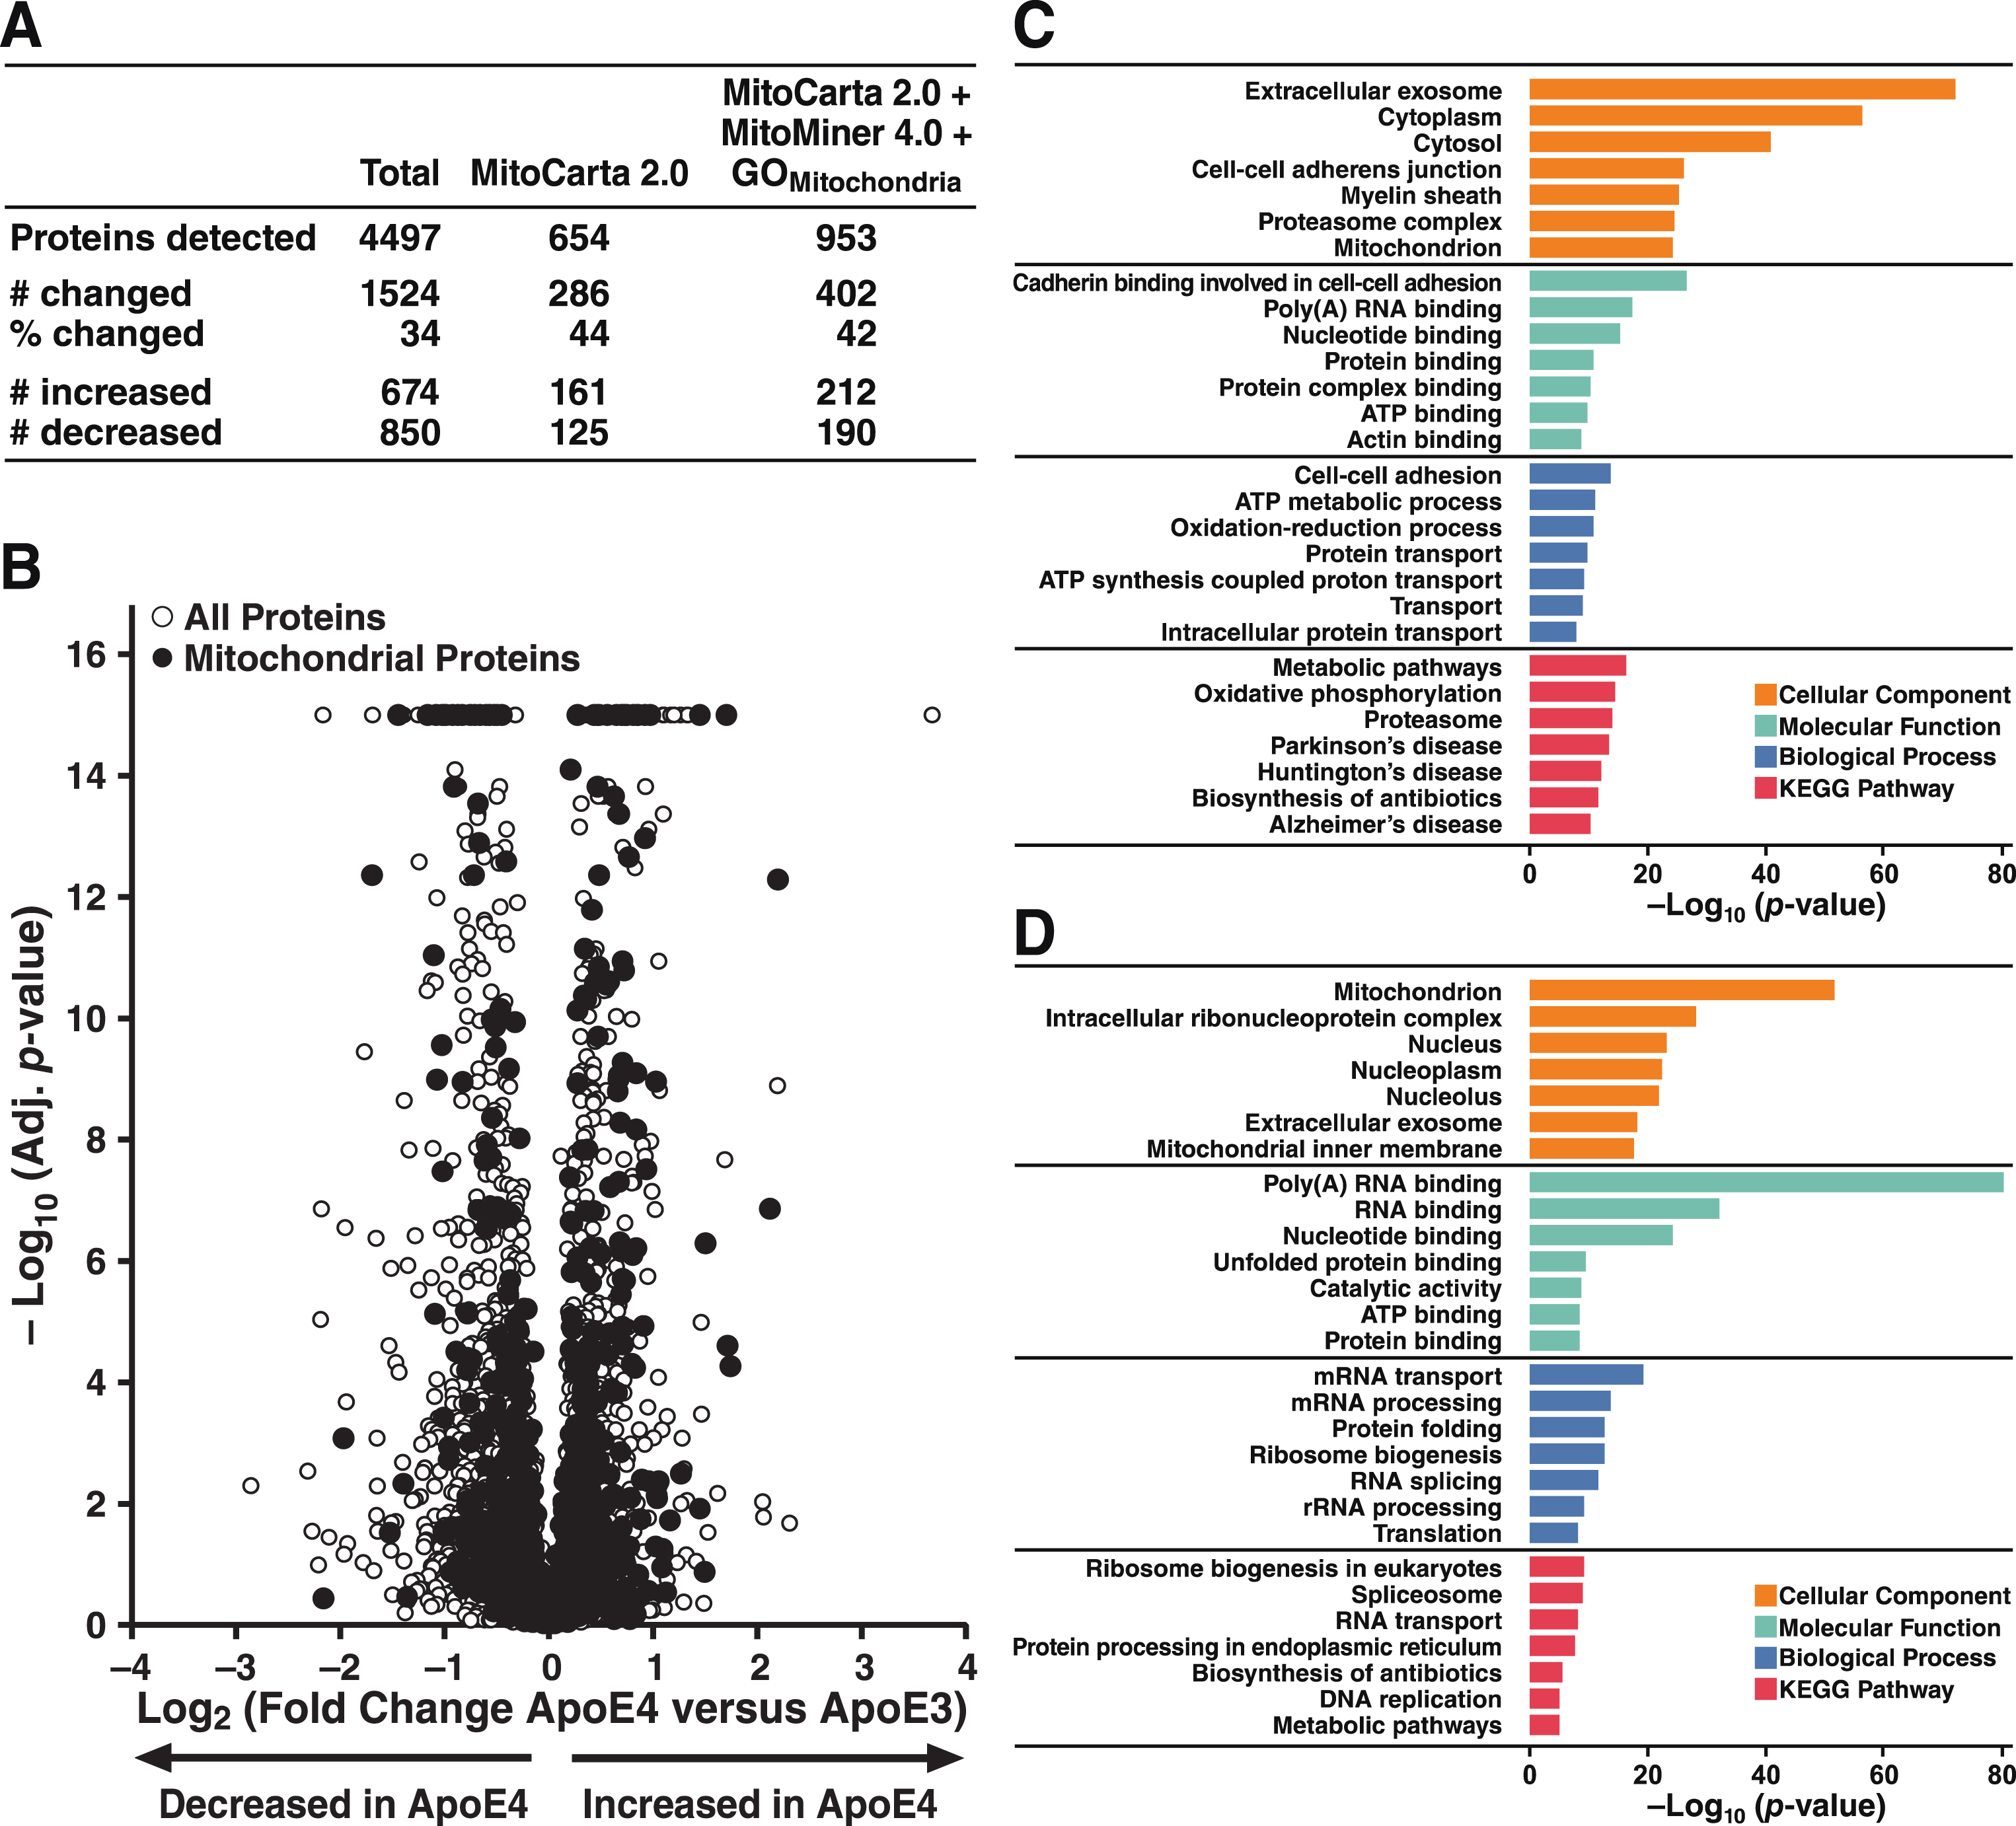
Gene Ontology [74, 75] and KEGG pathway-enrichment analyses [76–78] were used to identify pathways overrepresented by proteins whose levels were significantly decreased (Fig. 5C) or increased (Fig. 5D) by apoE4 expression. These analyses revealed a diverse array of effects of apoE4 on cellular processes. Interestingly, mitochondrial processes and pathways were identified from the sets of proteins increased or decreased by apoE4. Broadly speaking, in addition to mitochondrion and mitochondrial inner membrane proteins, pathways enriched with proteins significantly increased by apoE4 were strongly related to RNA-related processes, whereas pathways and processes enriched with proteins significantly decreased by apoE4 were heavily involved in OXPHOS, including ATP binding, ATP metabolic processes, ATP synthesis, and metabolism.
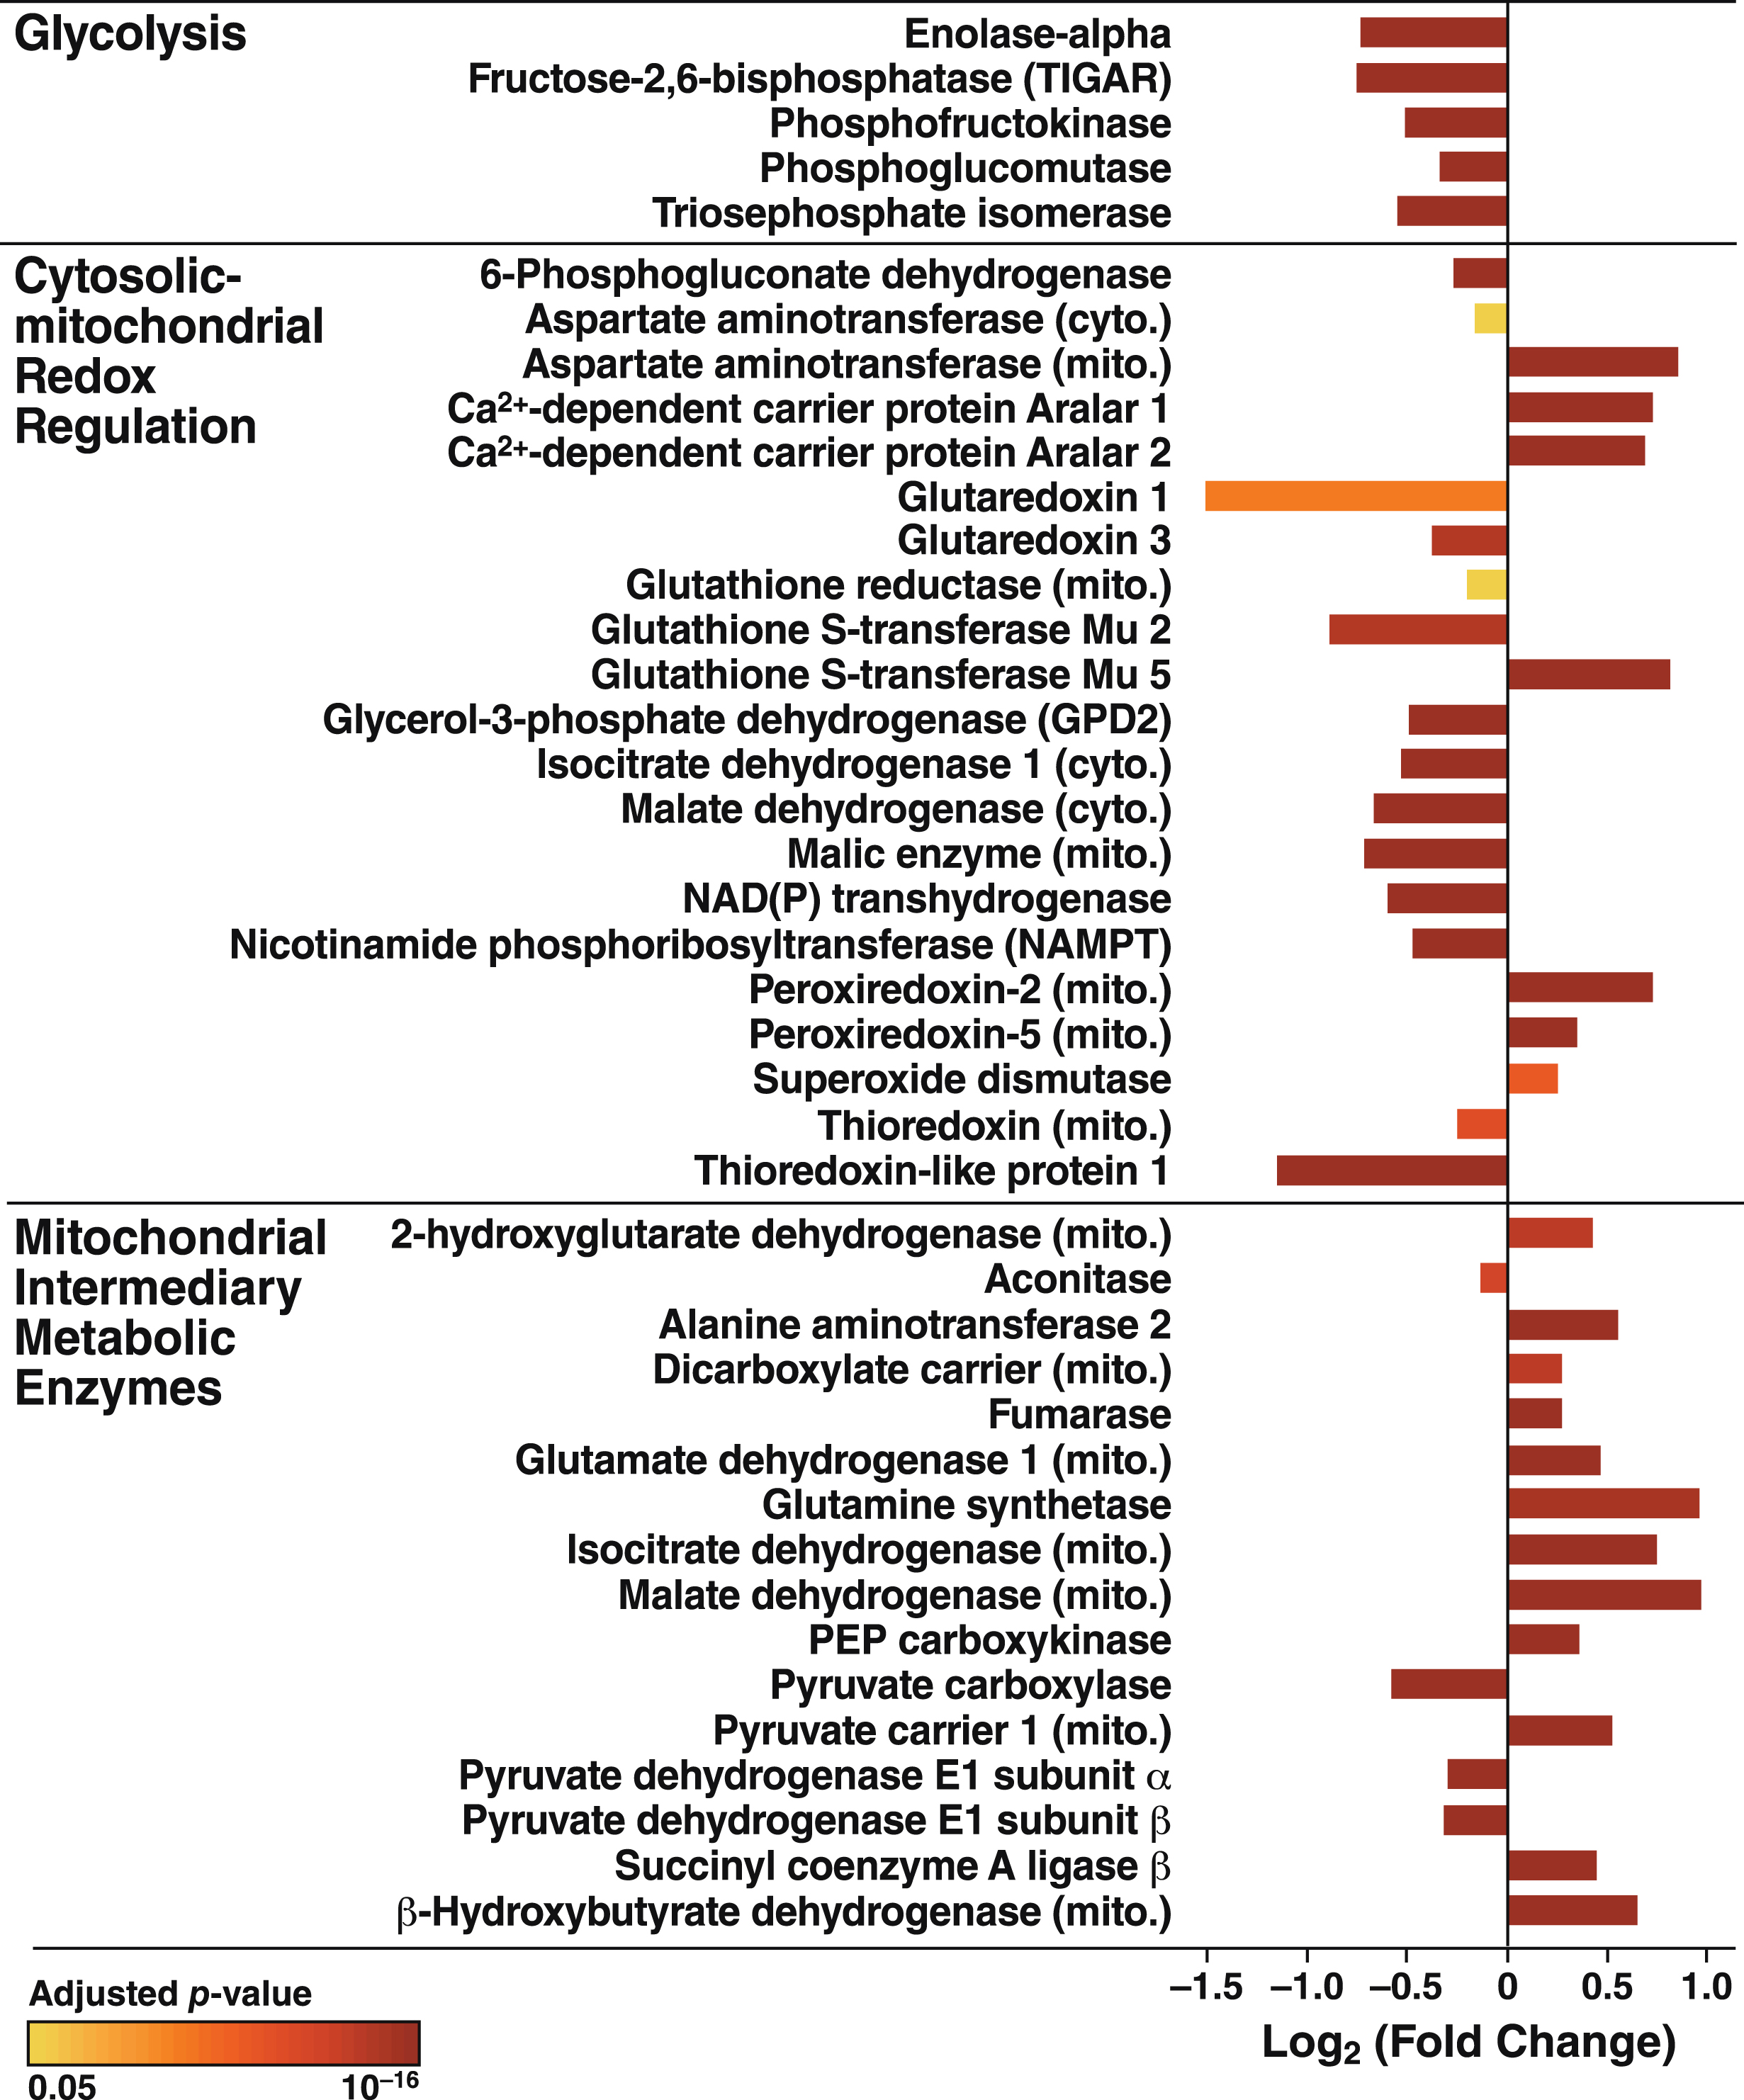
We next examined proteomic data for insights into the effects of apoE4 expression responsible for the mitochondrial dysfunction and metabolic inflexibility revealed by the bioenergetic profiling studies (Figs. 1–3). ApoE4 altered a wide range of proteins involved in OXPHOS, redox homeostasis, and glucose and amino acid metabolism (Fig. 6). Selected proteins that were significantly increased or decreased are highlighted below for their roles in glycolysis, cytosolic-mitochondrial redox regulation, and mitochondrial intermediary metabolism.
Fig.6
ApoE4 disrupts protein expression in both cytosolic and mitochondrial metabolic pathways. Proteins involved in glycolysis, redox homeostasis, and intermediary metabolism whose expression was significantly altered by apoE4. Bar colors indicate p values for differences in expression levels between N2a-apoE4 and N2a-apoE3 cells.
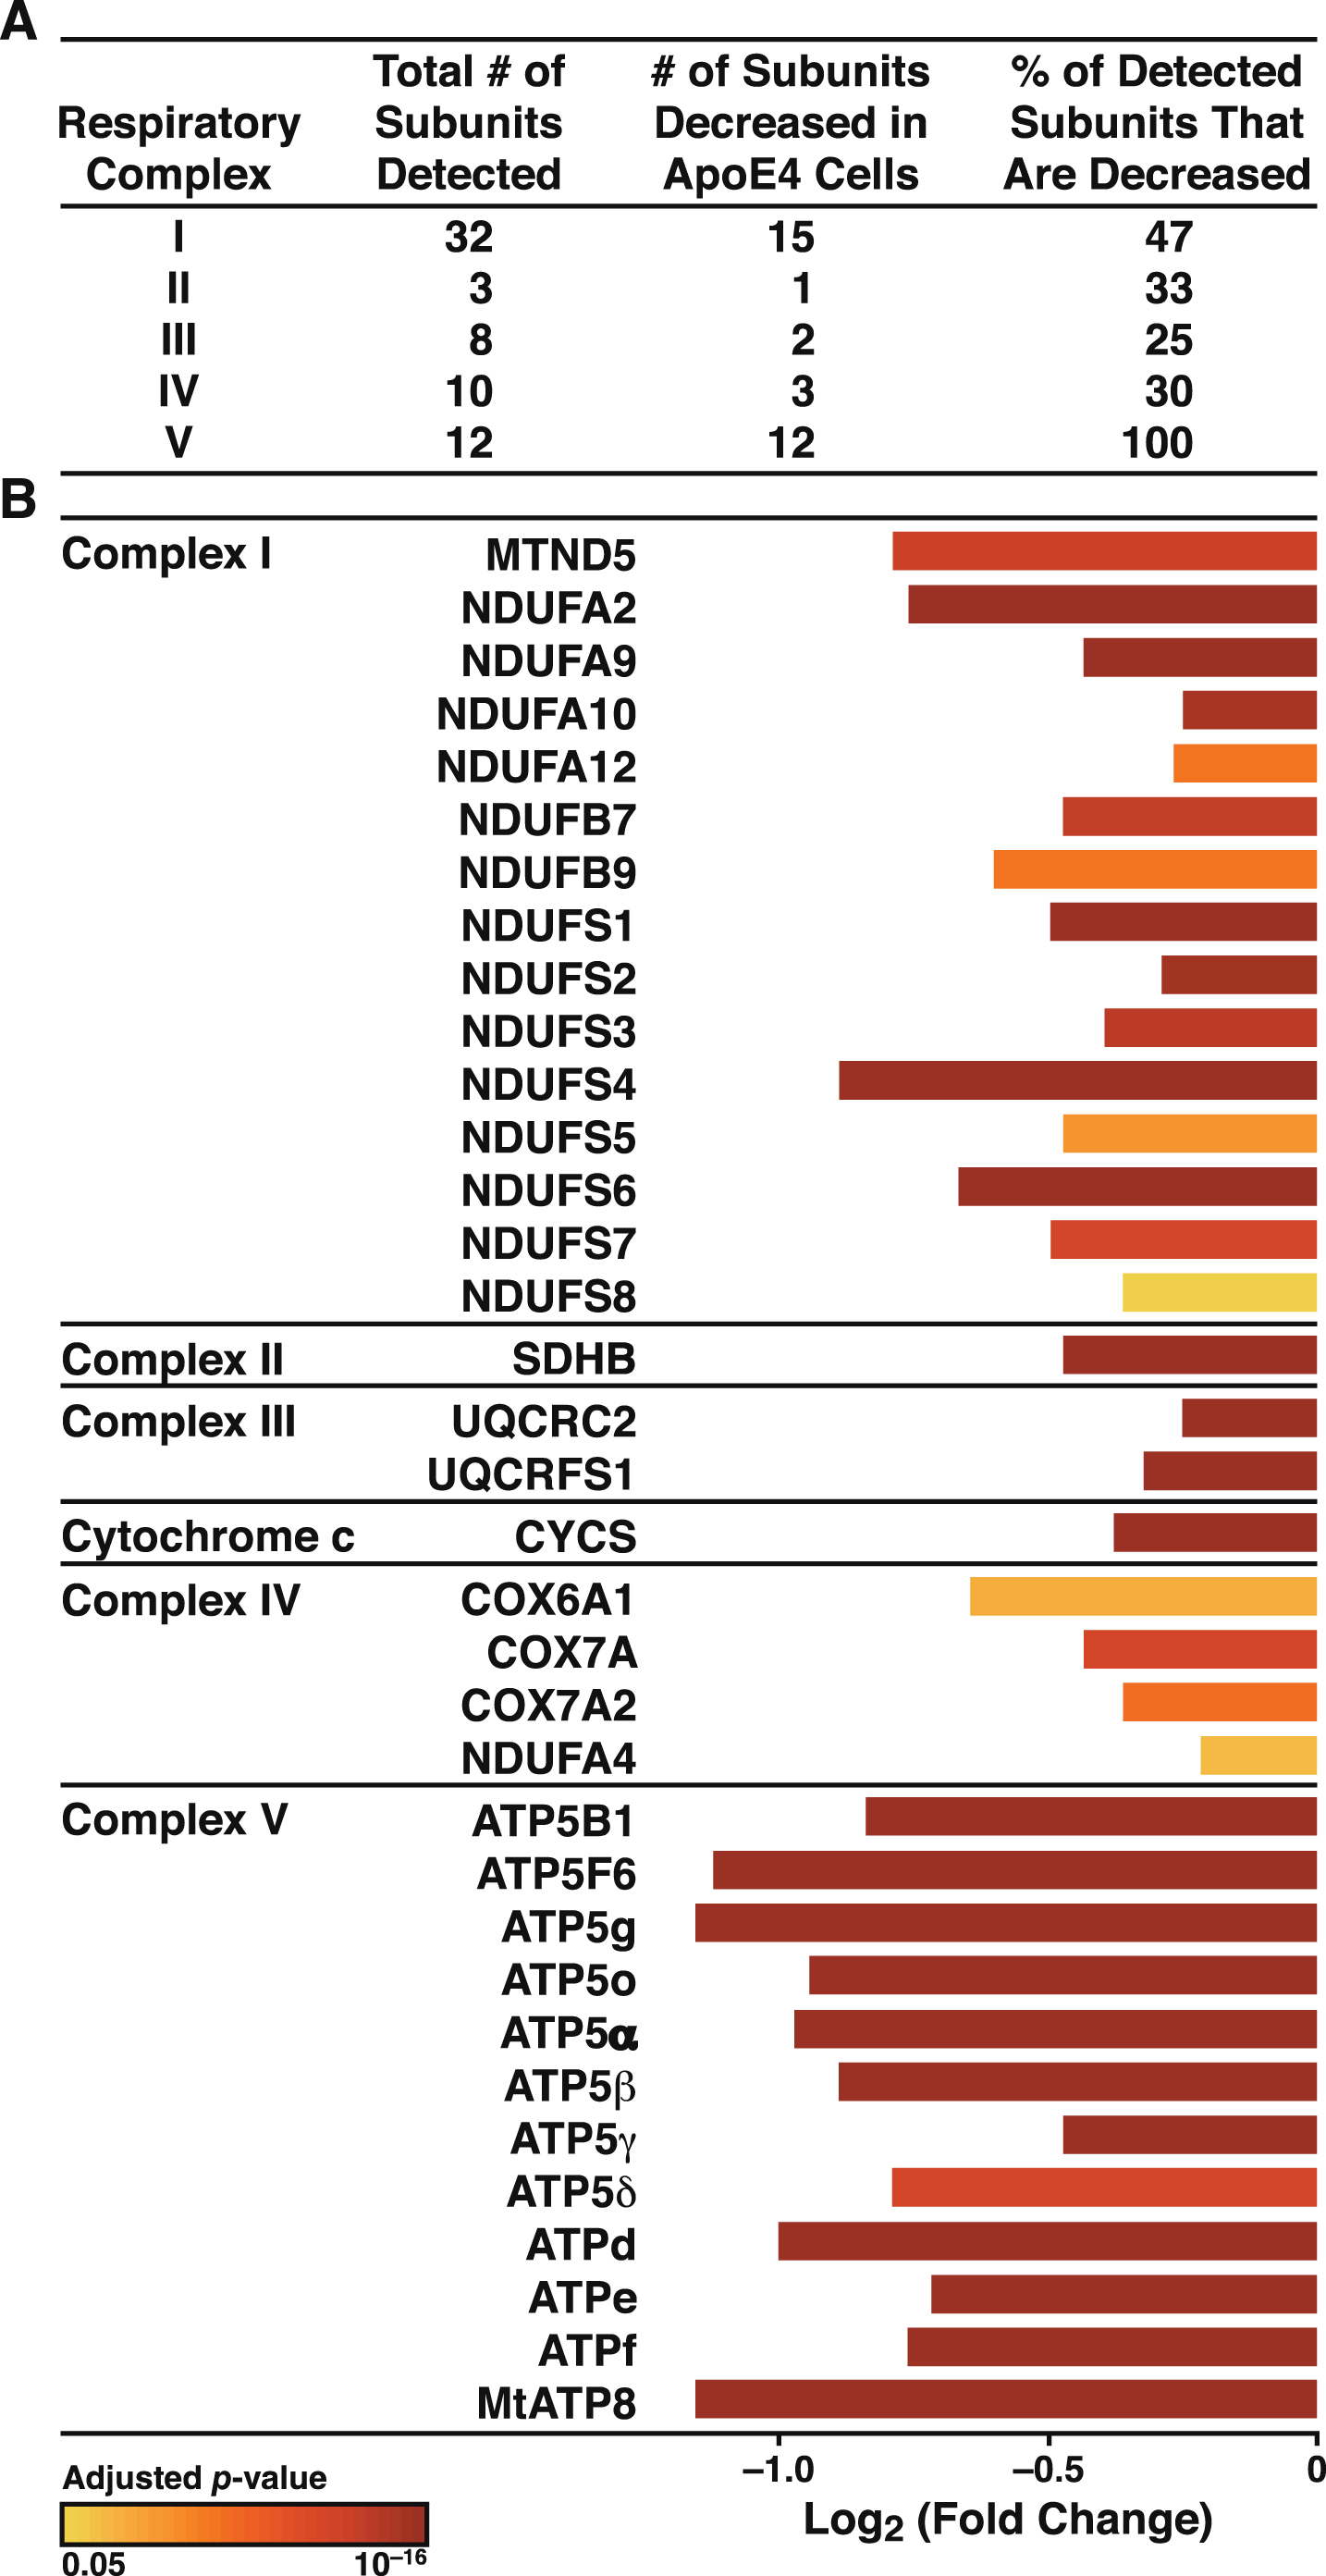
Previously, we reported deficits in single subunits of each of the OXPHOS complexes in the apoE4-expressing neuronal cells [18]. To establish that the deficits in mitochondrial respiration and ATP production in apoE4-expressing cells were associated with impairments in the OXPHOS system, we analyzed the levels of the subunits in all five OXPHOS complexes by proteomics. A total of 65 subunits plus cytochrome c were detected (Fig. 7A). Remarkably, the levels of all 33 subunits altered by apoE4 were significantly decreased (p < 0.05), as was the level of cytochrome c. Most strikingly, the levels of all 12 subunits detected in complex V (ATP synthase) were decreased, some by greater than 50% (Fig. 7B).
Fig.7
ApoE4 disrupts all five complexes of the mitochondrial OXPHOS system. A) Summary of subunits detected in all five respiratory complexes and the number that were significantly altered (p < 0.05) in N2a-apoE4 versus N2a-apoE3 cells. B) ApoE4 significantly affected the assembly of respiratory subunits. Bar colors indicate p values for differences in expression levels between N2a-apoE4 and N2a-apoE3 cells.
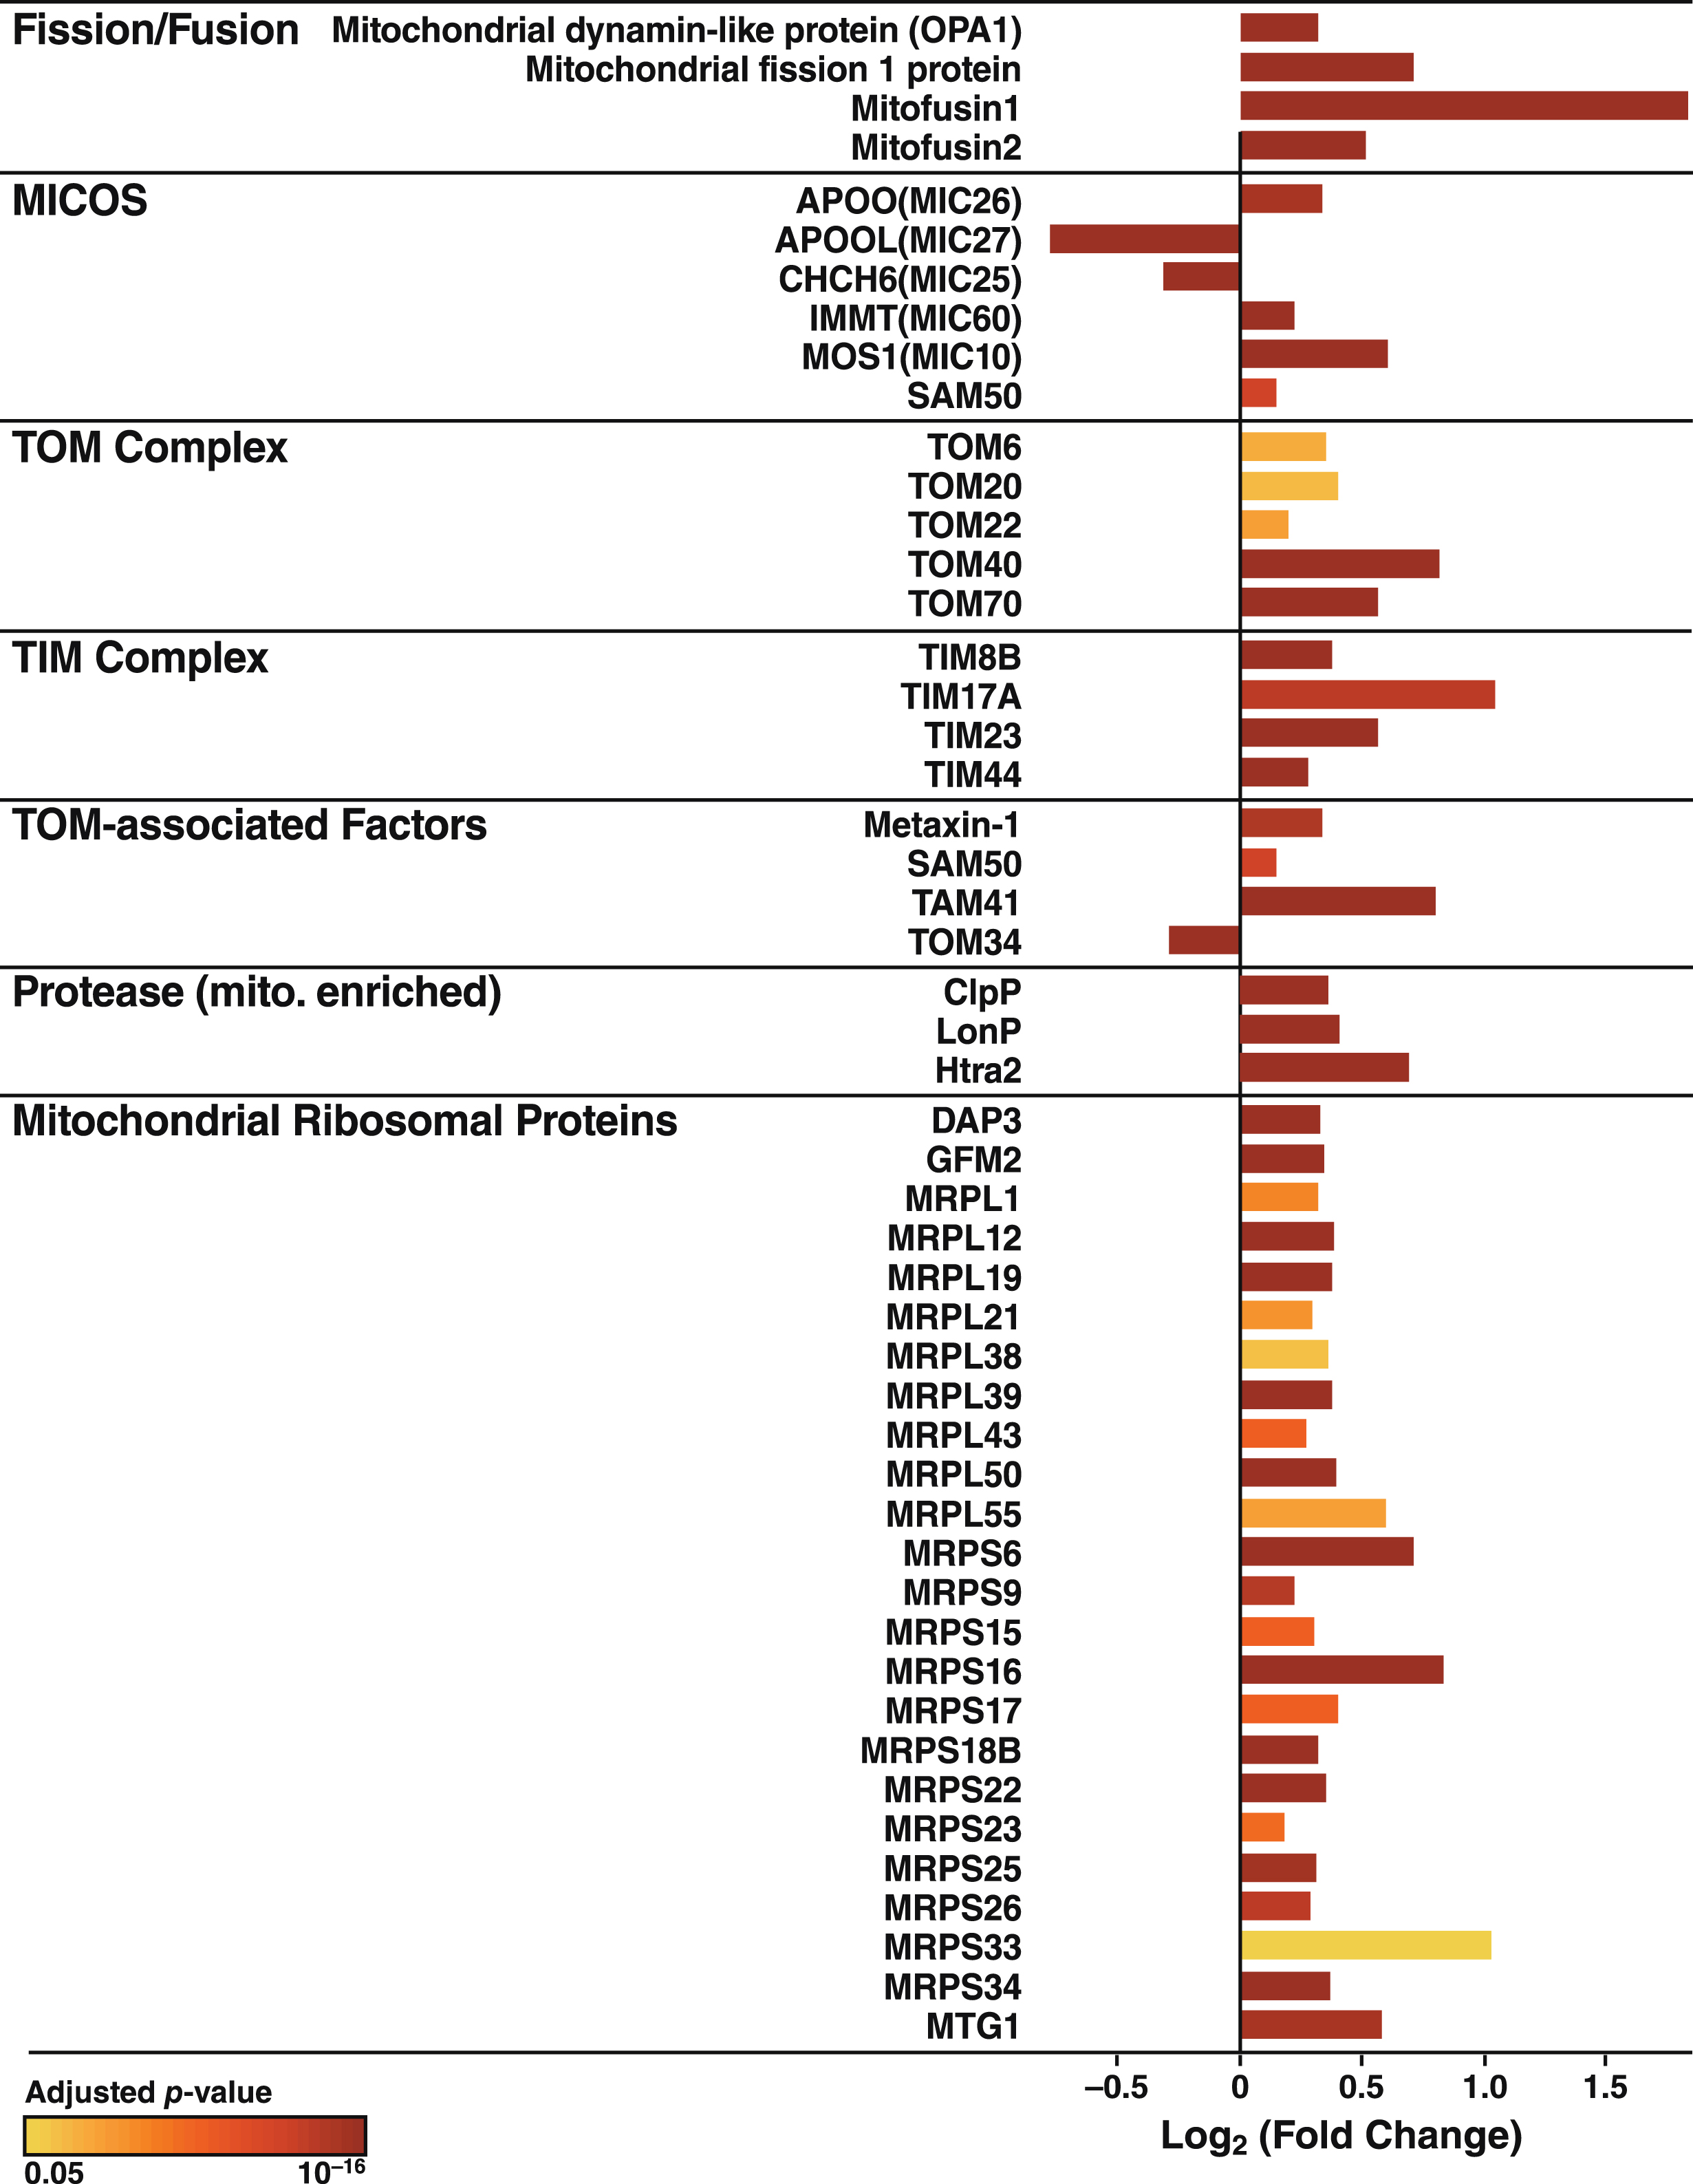
The increased Ca2+ flow from the ER to mitochondria in apoE4 cells (Fig. 4) may reflect a tighter coupling between these organelles [79], whose association is mediated by tethering proteins that define zones referred to as MAM (Fig. 8A). To explore whether the increased Ca2+ transport from the ER to mitochondria in apoE4 cells was associated with molecular changes in MAM components, we analyzed the levels of MAM tethering proteins in the proteomic data set. Of six detected tethering proteins, the levels of five were increased in apoE4-expressing cells and the level of one (GRP75) was decreased (Fig. 8B). We also detected increases in many other mitochondrial components in apoE4 cells, including proteins involved in mitochondrial morphology (fusion/fission; cristae formation), protein import (TOM/TIM complexes and assembly), protein maturation and degradation (proteases), and mitochondrial protein synthesis (ribosomal subunits) (Fig. 9).
Fig.8
ApoE4 alters the expression of proteins involved in tethering mitochondria to the ER. A) Schematic representation of links between mitochondrial and ER-resident proteins and their reported roles in organelle and cellular physiology. B) Summary of ER-mitochondrial contact proteins that were significantly altered in N2a-apoE4 cells. Bar colors indicate p values for differences in expression levels between N2a-apoE4 and N2a-apoE3 cells. FIS1, mitochondrial fission 1 protein; MFN2, mitofusin 2.
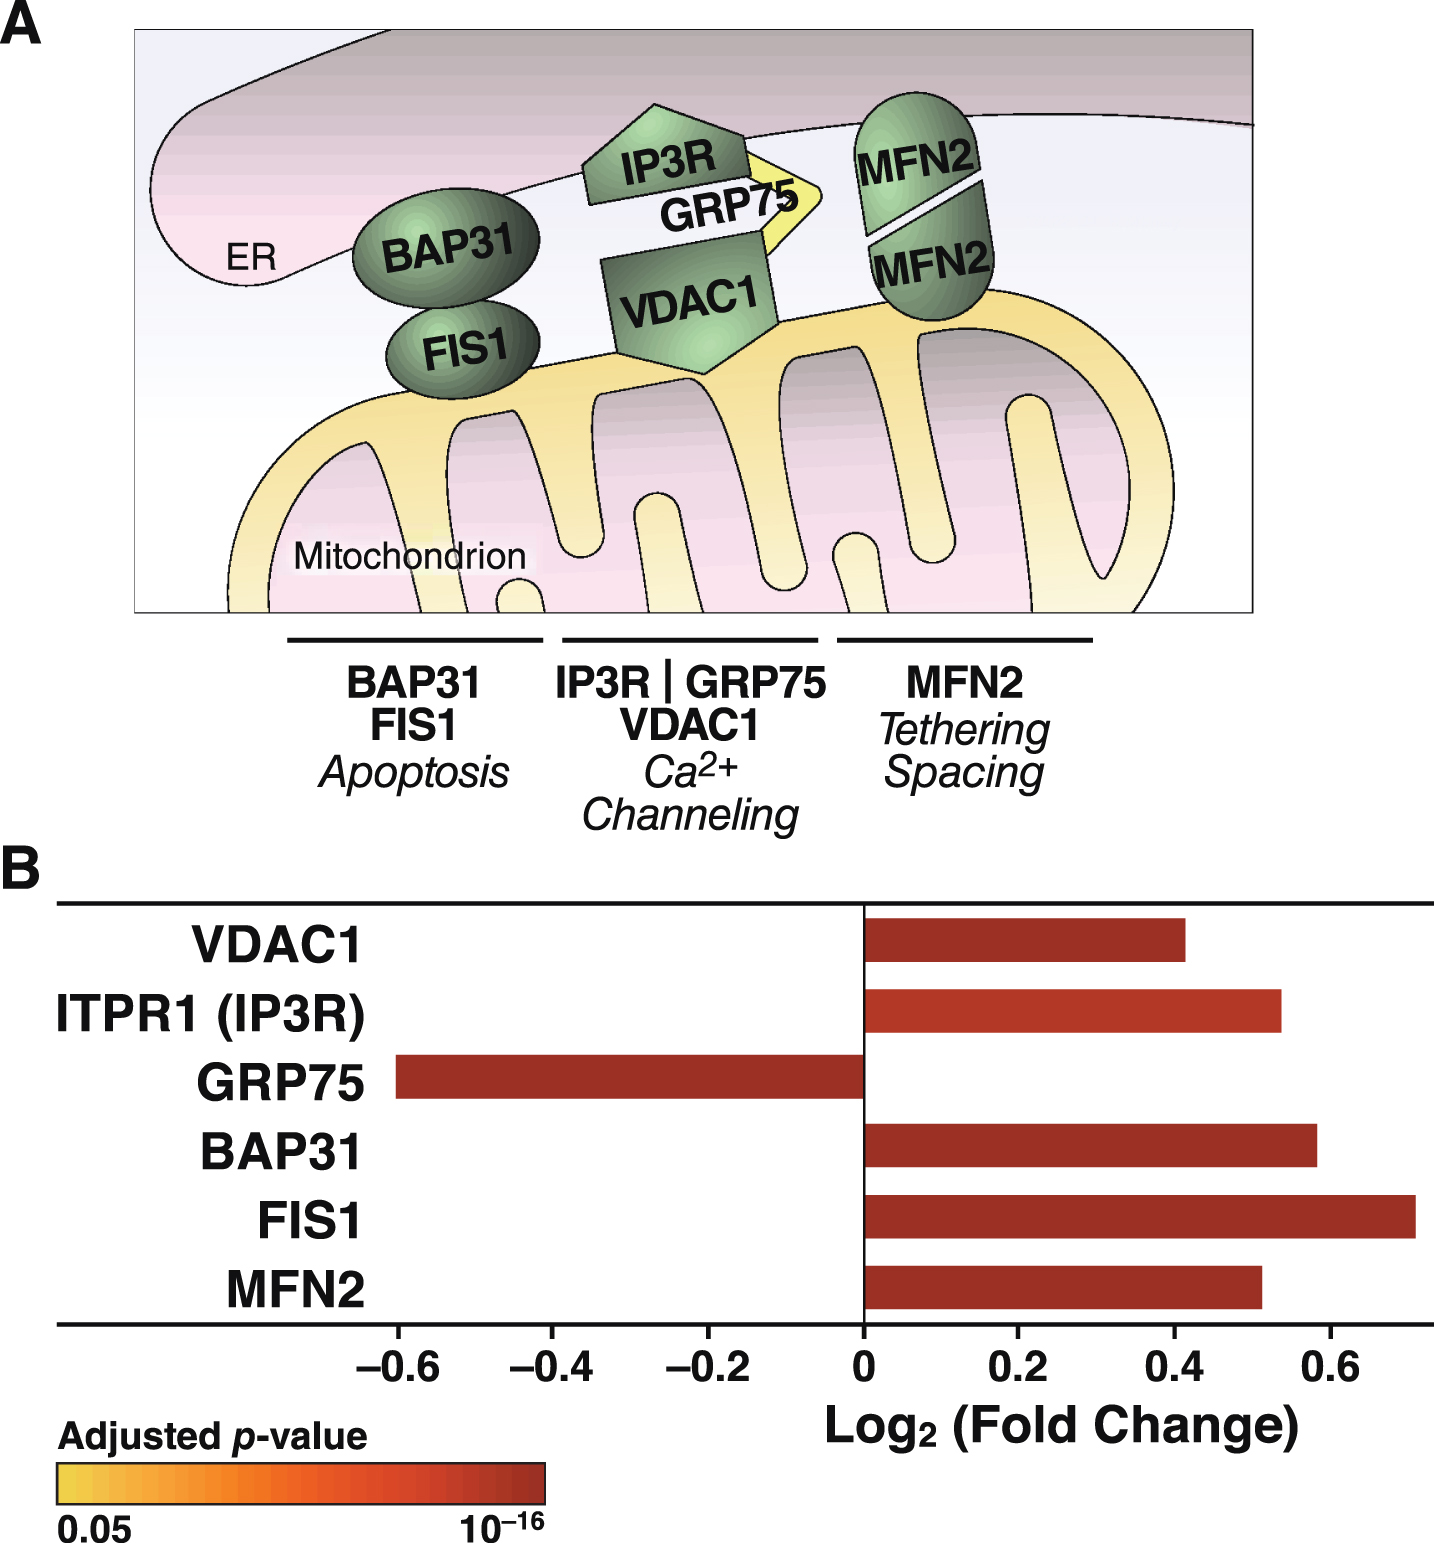
Fig.9
ApoE4 alters the expression of proteins linked to mitochondrial morphology and the import, synthesis, maturation, and degradation of mitochondrial proteins. Mitochondrial proteins involved in mitochondrial morphology (fusion/fission), cristae formation (MICOS), protein import (TOM/TIM complexes and assembly), protein maturation and degradation (proteases), and mitochondrial protein synthesis (ribosomal proteins) that were significantly altered in N2a-apoE4 cells. Bar colors indicates p values for differences in expression levels between N2a-apoE4 and N2a-apoE3 cells.
To determine which regulatory pathways help compensate for apoE4-induced mitochondrial dysfunction, we used Pscan [64] and PASTAA [63] to identify transcription factors that may coordinate the changes in protein levels in apoE4-expressing cells (Table 1). Both analyses highlighted transcription factors that regulate the expression of mitochondrial genes and genes related to metabolism and redox homeostasis.
DISCUSSION
ApoE4 disrupts the mitochondrial respiratory chain
In this study, we used bioenergetic profiling and proteomic analysis to characterize in detail the effects of apoE4 expression on mitochondrial function and cellular metabolism. We found that mitochondrial respiration and OXPHOS-dependent ATP production are impaired in apoE4-expressing cells, being 40–50% lower than in apoE3-expressing cells. Glycolysis was enhanced in apoE4 cells under basal conditions; however, the glycolytic rate and ATP production were insufficient to maintain total cellular energy under conditions of high metabolic demand. As a result, apoE4-expressing neuronal cells were more severely affected by stress. Associated with the impaired mitochondrial activity were a decreased NAD+/NADH ratio and increased levels of mitochondrial Ca2+ and cellular ROS. Proteomic analysis revealed a remarkable reduction in the levels of 50% of detected subunits of mitochondrial respiratory complexes I–V; none were increased. There were also alterations in a wide range of proteins involved in glycolysis, redox regulation, and intermediary metabolism; in mitochondrial morphology; and in the import, synthesis, and degradation of mitochondrial proteins.
The pronounced reduction of multiple subunits in respiratory complexes I–V provides insights into how apoE4 disrupts respiration and ATP production and more clearly reveals the breadth of the effects of apoE4 on the respiratory chain than previously observed by western blotting for single subunits. This broad influence of apoE4 on OXPHOS machinery could serve as a model system to explore the essential subunits required for assembly and processes required for normal function. Respiratory complexes consist of 13 subunits encoded by mitochondrial DNA and 78 encoded by nuclear DNA [80]. Normal respiration requires the coordinated production of subunits for proper assembly into functional complexes [81]. Our proteomic analysis showed that apoE4 decreased the levels of 33 of 64 detected subunits, undoubtedly altering complex assembly. Previously we showed that apoE4 decreases levels of cytochrome c oxidase 1 (COX1) [18], a mitochondrially encoded subunit that initiates complex IV assembly [82]. COX1 depletion results in defective assembly, and delivery of nuclear-encoded subunits reduces COX1 levels and also disrupts assembly [82–87].
Additional subunits also affect the assembly and function of multiple complexes. For example, COX7a has a critical role in stabilizing complexes III and IV [39] and is significantly decreased in apoE4-expressing neurons. Several hundred proteins are required for delivery of subunits to the inner mitochondrial membrane, coordination of subunit levels, and final assembly of respiratory complexes. For example, complex IV assembly requires the MITRAC assembly complex, a central component of which, MITRAC12, was reduced by 47% in apoE4-expressing cells (p < 1×10⁻⁹). Therefore, even if the interaction of apoE4 with mitochondria disrupts just a few critical assembly factors or subunits, it might cause the widespread depletion of functional complexes, impaired respiration, and the reduced ATP levels we observed in our cells. Likewise, the profound effect on all detected subunit levels in complex V (ATP synthase) would disrupt mitochondrial ATP production. Thus, the altered stoichiometry of respiratory complex subunits could adversely affect various aspects of mitochondrial activity.
ApoE4 has widespread effects on neuronal cell metabolism
Our proteomic analyses also shed light on apoE4-induced changes in metabolism (Fig. 6). For example, the levels of all glycolytic enzymes in apoE4-expressing cells that differed from the levels in apoE3-expressing cells were lower in the apoE4 cells. Interestingly, TIGAR, an enzyme that negatively regulates glycolytic activity [88, 89], was also decreased significantly, perhaps to enhance glycolytic activity in the context of mitochondrial dysfunction and reduced levels of glycolytic enzymes. Regardless, glycolysis in apoE4 cells was insufficient to compensate for the impaired mitochondrial ATP production during metabolic stress.
The shift toward a lower NAD+ level and a higher NADH level in apoE4-expressing cells may reflect impaired respiration, resulting in NADH build-up in the mitochondrial matrix as electron transport stalls in the apoE4-expressing cells. However, our proteomics analysis suggests effects on other factors that control the NAD+/NADH pool. For example, there were significant alterations in NADH shuttle components (components of both malate-aspartate and glycerol phosphate shuttles), NAD(P)-dependent metabolic enzymes [NAD(P)-dehydrogenase (which converts NADH into NADPH)], numerous cytosolic and mitochondrial antioxidant enzymes, and the NAD synthetic enzyme NAMPT (Fig. 6). It remains to be determined whether the phenotypes in apoE4-expressing cells can be mitigated by augmenting total NAD(H) levels with NAD+ precursors such as nicotinamide riboside [90] or by expressing a targeted alternative NADH-oxidase to restore the mitochondrial NAD+/NADH ratio [91].
Our results suggest that apoE4 disrupts the metabolism of glycolysis-derived pyruvate by pyruvate dehydrogenase (PDH). Indeed, levels of both E1 subunits of PDH in apoE4 cells were reduced by 20%. Since PDH deficiency limits respiratory capacity and causes lactic acidosis in humans [92], impaired PDH activity might be partly responsible for the respiratory deficits in apoE4 cells. In contrast, many other mitochondrial matrix enzymes, including those involved in the tricarboxylic acid cycle and in amino acid and ketone body metabolism, were significantly increased in apoE4-expressing cells (Fig. 6). This induction of specific enzymes likely accommodates altered metabolite fluxes in response to slowed respiration and NADH build-up. Tracing studies with radiolabeled metabolites would help determine the precise metabolic adjustments made by apoE4-expressing neurons and identify important nodes that could be therapeutically targeted to prevent stress- or age-related decline in apoE4 patients.
ApoE4 is associated with increased ER-mitochondria tethering and excessive mitochondrial Ca2+ accumulation
Our findings on Ca2+ fluxes imply that mitochondrial Ca2+ overload in apoE4-expressing neurons promotes mitochondrial impairment and neurodegeneration. Live-cell imaging showed an increase in mitochondrial Ca2+ and faster mitochondrial Ca2+ uptake during thapsigargin-induced Ca2+ release from the ER. Ca2+ in the ER is released through channels such as inositol 1,4,5-trisphosphate receptors (IP3R) and ryanodine receptors (RyR). Extra-mitochondrial Ca2+ enters the mitochondria via outer membrane voltage-dependent anion channels (VDACs) and the mitochondrial Ca2+ uniporter on the inner membrane [71]. Furthermore, thapsigargin-induced Ca2+ transfer from the ER to mitochondria depends on IP3R in the ER and VDACs on the outer mitochondrial membrane [93, 94]. IP3R and VDACs are MAM components that tether the ER to mitochondria through the molecular chaperone GRP75 [95]. Other important MAM tethering proteins are B-cell receptor–associated protein 31, mitochondrial fission 1 protein [96], and mitofusin [97]. Remarkably, levels of all of these MAM proteins except GRP75 were significantly increased in the apoE4 cells (Fig. 8). Increased expression of mitofusin enhances the interaction between VDAC1 and IP3R [98].
Besides controlling Ca2+ flux, MAM participate in lipid synthesis, membrane stability, mitochondrial dynamics, and ROS signaling [99–101]. Increased expression of MAM proteins enhances tethering between the organelles and modulates connectivity/conductivity [102]. Increased tethering may be associated with neurodegeneration, including the risk of AD [103]. Increased ER-mitochondrial interactions increase MAM activity in neurons treated with conditioned medium from apoE4- but not apoE3-expressing astrocytes [104]. Thus, the increased levels of MAM proteins in apoE4-expressing cells might reflect increased tethering that is associated with the increased Ca2+ flux and increased ROS production we observed.
ApoE4 cells adapt to impaired mitochondrial respiration by coordinated changes to other mitochondrial pathways
Numerous proteins linked to mitochondrial morphology and to the synthesis, import, maturation, and degradation of mitochondrial proteins were also coordinately changed in apoE4 cells, with most proteins in these pathways showing increased expression (Fig. 9). Fission/fusion processes help modulate mitochondrial function in both normal and pathological conditions [105]. Levels of four major proteins directly involved in mitochondrial dynamics were significantly increased by apoE4 expression, as shown by proteomics analyses. Also increased were levels of the translocases of both the outer and inner mitochondrial membrane (the TOM and TIM complexes), which control the delivery of cytosolic proteins to the mitochondria, and three of four TOM-associated factors [106]. These changes could reflect an attempt to restore normal mitochondrial function. ApoE4 expression also altered the mitochondrial cristae–organizing system, which stabilizes the cristae junction between the inner and outer membranes. In concert with mitochondrial proteases, which respond to altered mitochondrial protein stoichiometry [107], apoE4 also affects respiratory complex formation [108]. Interestingly, the levels of all mitochondrial ribosomal proteins [109] detected by proteomics were increased. These changes in factors involved in mitochondrial morphology, biogenesis, and quality control may compensate for the large-scale apoE4-induced decreases in OXPHOS complexes.
Our unbiased analyses to predict which transcription factors might control the proteomic changes in apoE4 cells identified a surprising number of factors known to influence mitochondrial biogenesis and regulate the expression of additional metabolism- and redox-related genes. These factors, including nuclear respiratory factor 1, nuclear factor erythroid-2-like 2, GA binding protein (nuclear respiratory factor 2), and Sp4 [110–114] directly and indirectly control the expression of respiratory chain subunits encoded by nuclear and mitochondrial DNA [110, 115, 116]. Additionally, several of the transcription factors identified are implicated in neurodegeneration, including nuclear respiratory factor 1 [117, 118], nuclear factor erythroid-2-like 2 [110, 111], ETS domain-containing protein Elk-1 [119], Kruppel-like factor 14 [120], and Sp4 [121]. These analyses provide important clues as to which factors underlie neuronal adaptation to apoE4 expression. Augmenting beneficial adaptations may be a new strategy to prevent apoE4-associated cognitive decline.
Conclusion
Our results shed light on the extensive metabolic rewiring associated with apoE4-induced mitochondrial dysfunction. Despite various adaptations, apoE4-expressing neuronal cells remained vulnerable to adverse metabolic events. Judging from the broad effects of apoE4 on the respiratory complexes, we propose that mitochondrial-associated apoE4 disrupts the balance of core subunits of the respiratory complexes to prevent complete maturation of assembled complexes in the inner mitochondrial membrane. The initiating event may involve disruptions in the production/delivery of OXPHOS subunits and the assembly of the OXPHOS complexes. Systems biology approaches integrating mRNA expression profiling, mapping of protein–protein interactions, metabolite tracing, and functional genetic screens will be important for uncovering the upstream drivers of apoE4-induced metabolic dysregulation in neurons. We hypothesize that the interaction between mitochondria and the neurotoxic fragments generated by neuron-specific proteolysis of apoE4 [7, 10, 12] contributes to the detrimental effects of apoE4 and mitochondrial dysfunction. Our results highlight the need to continue studying the cell-autonomous effects of apoE4-induced metabolic dysfunction, with the goal of identifying metabolic targets that might be explored to correct or prevent apoE4-associated neuropathology, including AD.
ACKNOWLEDGMENTS
We thank Dr. Shona A. Mookerjee for advice on calculating ATP production rates from Seahorse analyses. We greatly appreciate Dr. Ken Nakamura’s insightful comments on the manuscript, Sylvia Richmond for manuscript preparation, Stephen B. Ordway for editorial assistance, and John C. W. Carroll for graphics. This work was supported by the Gladstone Institutes and, in part, by National Institutes of Health grant 1R56AG057932 and the BrightFocus Foundation.
Authors’ disclosures available online (https://www.j-alz.com/manuscript-disclosures/18-1184r1).
REFERENCES
[1] | Corder EH , Saunders AM , Strittmatter WJ , Schmechel DE , Gaskell PC , Small GW , Roses AD , Haines JL , Pericak-Vance MA ((1993) ) Gene dose of apolipoprotein E type 4 allele and the risk of Alzheimer’s disease in late onset families. Science 261: , 921–923. |
[2] | Farrer LA , Cupples LA , Haines JL , Hyman B , Kukull WA , Mayeux R , Myers RH , Pericak-Vance MA , Risch N , Van Duijn CM ((1997) ) Effects of age, sex, and ethnicity on the association between apolipoprotein E genotype and Alzheimer disease. A meta-analysis. J Am Med Assoc 278: , 1349–1356. |
[3] | Genin E , Hannequin D , Wallon D , Sleegers K , Hiltunen M , Combarros O , Bullido MJ , Engelborghs S , De Deyn P , Berr C , Pasquier F , Dubois B , Tognoni G , Fiévet N , Brouwers N , Bettens K , Arosio B , Coto E , Del Zompo M , Mateo I , Epelbaum J , Frank-Garcia A , Helisalmi S , Porcellini E , Pilotto A , Forti P , Ferri R , Scarpini E , Siciliano G , Solfrizzi V , Sorbi S , Spalletta G , Valdivieso F , Vepsäläinen S , Alvarez V , Bosco P , Mancuso M , Panza F , Nacmias B , Bossù P , Hanon O , Piccardi P , Annoni G , Seripa D , Galimberti D , Licastro F , Soininen H , Dartigues J-F , Kamboh MI , Van Broeckhoven C , Lambert JC , Amouyel P , Campion D ((2011) ) APOE and Alzheimer disease: A major gene with semi-dominant inheritance. Mol Psychiatry 16: , 903–907. |
[4] | Biundo F , Ishiwari K , Del Prete D , D’Adamio L ((2015) ) Interaction of apoE3 and apoE4 isoforms with an ITM2b/BRI2 mutation linked to the Alzheimer disease-like Danish dementia: Effects on learning and memory. Neurobiol Learn Mem 126: , 18–30. |
[5] | Bu G ((2009) ) Apolipoprotein E and its receptors in Alzheimer’s disease: Pathways, pathogenesis and therapy. Nat Rev Neurosci 10: , 333–344. |
[6] | Holtzman DM , Herz J , Bu G ((2012) ) Apolipoprotein E and apolipoprotein E receptors: Normal biology and roles in Alzheimer disease. Cold Spring Harb Perspect Med 2: , a006312. |
[7] | Huang Y , Mucke L ((2012) ) Alzheimer mechanisms and therapeutic strategies. Cell 148: , 1204–1222. |
[8] | Kim J , Basak JM , Holtzman DM ((2009) ) The role of apolipoprotein E in Alzheimer’s disease. Neuron 63: , 287–303. |
[9] | Liu C-C , Kanekiyo T , Xu H , Bu G ((2013) ) Apolipoprotein E and Alzheimer disease: Risk, mechanisms and therapy. Nat Rev Neurol 9: , 106–118. |
[10] | Mahley RW , Weisgraber KH , Huang Y ((2006) ) Apolipoprotein E4: A causative factor and therapeutic target in neuropathology, including Alzheimer’s disease. Proc Natl Acad Sci U S A 103: , 5644–5651. |
[11] | Mahley RW , Weisgraber KH , Huang Y ((2009) ) Apolipoprotein E: Structure determines function, from atherosclerosis to Alzheimer’s disease to AIDS. J Lipid Res 50: , S183–S188. |
[12] | Mahley RW , Huang Y ((2012) ) Apolipoprotein E sets the stage: Response to injury triggers neuropathology. Neuron 76: , 871–885. |
[13] | Mahley RW , Huang Y ((2012) ) Small-molecule structure correctors target abnormal protein structure and function: The structure corrector rescue of apolipoprotein E–associated neuropathology. J Med Chem 55: , 8997–9008. |
[14] | Spinney L ((2014) ) Alzheimer’s disease: The forgetting gene. Nature 510: , 26–28. |
[15] | Mahley RW ((1988) ) Apolipoprotein E: Cholesterol transport protein with expanding role in cell biology. Science 240: , 622–630. |
[16] | Huang Y , Liu XQ , Wyss-Coray T , Brecht WJ , Sanan DA , Mahley RW ((2001) ) Apolipoprotein E fragments present in Alzheimer’s disease brains induce neurofibrillary tangle-like intracellular inclusions in neurons. Proc Natl Acad Sci U S A 98: , 8838–8843. |
[17] | Chang S , Ma TR , Miranda RD , Balestra ME , Mahley RW , Huang Y ((2005) ) Lipid- and receptor-binding regions of apolipoprotein E4 fragments act in concert to cause mitochondrial dysfunction and neurotoxicity. Proc Natl Acad Sci U S A 102: , 18694–18699. |
[18] | Chen H-K , Ji Z-S , Dodson SE , Miranda RD , Rosenblum CI , Reynolds IJ , Freedman SB , Weisgraber KH , Huang Y , Mahley RW ((2011) ) Apolipoprotein E4 domain interaction mediates detrimental effects on mitochondria and is a potential therapeutic target for Alzheimer disease. J Biol Chem 286: , 5215–5221. |
[19] | Chen H-K , Liu Z , Meyer-Franke A , Brodbeck J , Miranda RD , McGuire JG , Pleiss MA , Ji Z-S , Balestra ME , Walker DW , Xu Q , Jeong D-E , Budamagunta MS , Voss JC , Freedman SB , Weisgraber KH , Huang Y , Mahley RW ((2012) ) Small molecule structure correctors abolish detrimental effects of apolipoprotein E4 in cultured neurons. J Biol Chem 287: , 5253–5266. |
[20] | Nakamura T , Watanabe A , Fujino T , Hosono T , Michikawa M ((2009) ) Apolipoprotein E4 (1–272) fragment is associated with mitochondrial proteins and affects mitochondrial function in neuronal cells. Mol Neurodegener 4: , 35. |
[21] | Minoshima S , Giordani B , Berent S , Frey KA , Foster NL , Kuhl DE ((1997) ) Metabolic reduction in the posterior cingulate cortex in very early Alzheimer’s disease. Ann Neurol 42: , 85–94. |
[22] | Kish SJ , Bergeron C , Rajput A , Dozic S , Mastrogiacomo F , Chang L-J , Wilson JM , DiStefano LM , Nobrega JN ((1992) ) Brain cytochrome oxidase in Alzheimer’s disease. J Neurochem 59: , 776–779. |
[23] | Maurer I , Zierz S , Möller H-J ((2000) ) A selective defect of cytochrome c oxidase is present in brain of Alzheimer disease patients. Neurobiol Aging 21: , 455–462. |
[24] | Liang WS , Reiman EM , Valla J , Dunckley T , Beach TG , Grover A , Niedzielko TL , Schneider LE , Mastroeni D , Caselli R , Kukull W , Morris JC , Hulette CM , Schmechel D , Rogers J , Stephan DA ((2008) ) Alzheimer’s disease is associated with reduced expression of energy metabolism genes in posterior cingulate neurons. Proc Natl Acad Sci U S A 105: , 4441–4446. |
[25] | Moreira PI ((2018) ) Sweet mitochondria: A shortcut to Alzheimer’s disease. J Alzheimers Dis 62: , 1391–1401. |
[26] | Selfridge JE , E L , Lu J , Swerdlow RH ((2013) ) Role of mitochondrial homeostasis and dynamics in Alzheimer’s disease. Neurobiol Dis 51: , 3–12. |
[27] | Reddy PH , Tripathi R , Troung Q , Tirumala K , Reddy TP , Anekonda V , Shirendeb UP , Calkins MJ , Reddy AP , Mao P , Manczak M ((2012) ) Abnormal mitochondrial dynamics and synaptic degeneration as early events in Alzheimer’s disease: Implications to mitochondria-targeted antioxidant therapeutics. Biochim Biophys Acta 1822: , 639–649. |
[28] | Onyango IG , Khan SM , James J , Bennett P ((2017) ) Mitochondria in the pathophysiology of Alzheimer’s and Parkinson’s diseases. Front Biosci 22: , 854–872. |
[29] | Reiman EM , Caselli RJ , Yun LS , Chen K , Bandy D , Minoshima S , Thibodeau SN , Osborne D ((1996) ) Preclinical evidence of Alzheimer’s disease in persons homozygous for the ɛ4 allele for apolipoprotein E. N Engl J Med 334: , 752–758. |
[30] | Small GW , Ercoli LM , Silverman DHS , Huang S-C , Komo S , Bookheimer SY , Lavretsky H , Miller K , Siddarth P , Rasgon NL , Mazziotta JC , Saxena S , Wu HM , Mega MS , Cummings JL , Saunders AM , Pericak-Vance MA , Roses AD , Barrio JR , Phelps ME ((2000) ) Cerebral metabolic and cognitive decline in persons at genetic risk for Alzheimer’s disease. Proc Natl Acad Sci U S A 97: , 6037–6042. |
[31] | Reiman EM , Chen K , Alexander GE , Caselli RJ , Bandy D , Osborne D , Saunders AM , Hardy J ((2004) ) Functional brain abnormalities in young adults at genetic risk for late-onset Alzheimer’s dementia. Proc Natl Acad Sci U S A 101: , 284–289. |
[32] | Valla J , Yaari R , Wolf AB , Kusne Y , Beach TG , Roher AE , Corneveaux JJ , Huentelman MJ , Caselli RJ , Reiman EM ((2010) ) Reduced posterior cingulate mitochondrial activity in expired young adult carriers of the APOE ɛ4 allele, the major late-onset Alzheimer’s susceptibility gene. J Alzheimers Dis 22: , 307–313. |
[33] | Wu L , Zhang X , Zhao L ((2018) ) Human apoE isoforms differentially modulate brain glucose and ketone body metabolism: Implications for Alzheimer’s disease risk reduction and early intervention. J Neurosci 38: , 6665–6681. |
[34] | Brodbeck J , Balestra ME , Saunders AM , Roses AD , Mahley RW , Huang Y ((2008) ) Rosiglitazone increases dendritic spine density and rescues spine loss caused by apolipoprotein E4 in primary cortical neurons. Proc Natl Acad Sci U S A 105: , 1343–1346. |
[35] | Brodbeck J , McGuire J , Liu Z , Meyer-Franke A , Balestra ME , Jeong D-e , Pleiss M , McComas C , Hess F , Witter D , Peterson S , Childers M , Goulet M , Liverton N , Hargreaves R , Freedman S , Weisgraber K , Mahley RW , Huang Y ((2011) ) Structure-dependent impairment of intracellular apolipoprotein E4 trafficking and its detrimental effects are rescued by small-molecule structure correctors. J Biol Chem 286: , 17217–17226. |
[36] | Chandel NS ((2014) ) Mitochondria as signaling organelles. BMC Biol 12: , 34. |
[37] | Pellegrino MW , Nargund AM , Haynes CM ((2013) ) Signaling the mitochondrial unfolded protein response. Biochim Biophys Acta 1833: , 410–416. |
[38] | Rampelt H , Pfanner N ((2016) ) Coordination of two genomes by mitochondrial translational plasticity. Cell 167: , 308–310. |
[39] | Letts JA , Fiedorczuk K , Sazanov LA ((2016) ) The architecture of respiratory supercomplexes. Nature 537: , 644–648. |
[40] | Ikeda K , Shiba S , Horie-Inoue K , Shimokata K , Inoue S ((2013) ) A stabilizing factor for mitochondrial respiratory supercomplex assembly regulates energy metabolism in muscle. Nat Commun 4: , 2147. |
[41] | Spinelli JB , Haigis MC ((2018) ) The multifaceted contributions of mitochondria to cellular metabolism. Nat Cell Biol 20: , 745–754. |
[42] | Giorgi C , Marchi S , Pinton P ((2018) ) The machineries, regulation and cellular functions of mitochondrial calcium. Nat Rev Mol Cell Biol 19: , 713–730. |
[43] | Angelova PR , Abramov AY ((2018) ) Role of mitochondrial ROS in the brain: From physiology to neurodegeneration. FEBS Lett 592: , 692–702. |
[44] | Shadel GS , Horvath TL ((2015) ) Mitochondrial ROS signaling in organismal homeostasis. Cell 163: , 560–569. |
[45] | van Vliet AR , Verfaillie T , Agostinis P ((2014) ) New functions of mitochondria associated membranes in cellular signaling. Biochim Biophys Acta 1843: , 2253–2262. |
[46] | Hayashi T , Rizzuto R , Hajnoczky G , Su T-P ((2009) ) MAM: More than just a housekeeper. Trends Cell Biol 19: , 81–88. |
[47] | Paillusson S , Stoica R , Gomez-Suaga P , Lau DHW , Mueller S , Miller T , Miller CCJ ((2016) ) There’s something wrong with my MAM; the ER–mitochondria axis and neurodegenerative diseases. Trends Neurosci 39: , 146–157. |
[48] | Area-Gomez E , de Groof A , Bonilla E , Montesinos J , Tanji K , Boldogh I , Pon L , Schon EA ((2018) ) A key role for MAM in mediating mitochondrial dysfunction in Alzheimer disease. Cell Death Dis 9: , 335. |
[49] | Schon EA , Przedborski S ((2011) ) Mitochondria: The next (neurode)generation. Neuron 70: , 1033–1053. |
[50] | Moehle EA , Shen K , Dillin A ((2019) ) Mitochondrial proteostasis in the context of cellular and organismal health and aging. J Biol Chem. doi: 10.1074/jbc.TM1117.000893 |
[51] | Carvalho C , Correia SC , Santos RX , Cardoso S , Moreira PI , Clark TA , Zhu X , Smith MA , Perry G ((2009) ) Role of mitochondrial-mediated signaling pathways in Alzheimer disease and hypoxia. J Bioenerg Biomembr 41: , 433–440. |
[52] | Harris FM , Brecht WJ , Xu Q , Mahley RW , Huang Y ((2004) ) Increased tau phosphorylation in apolipoprotein E4 transgenic mice is associated with activation of extracellular signal-regulated kinase: Modulation by zinc. J Biol Chem 279: , 44795–44801. |
[53] | Orr AL , Vargas L , Turk CN , Baaten JE , Matzen JT , Dardov VJ , Attle SJ , Li J , Quackenbush DC , Goncalves RLS , Perevoshchikova IV , Petrassi HM , Meeusen SL , Ainscow EK , Brand MD ((2015) ) Suppressors of superoxide production from mitochondrial complex III. Nat Chem Biol 11: , 834–836. |
[54] | Mookerjee SA , Nicholls DG , Brand MD ((2016) ) Determining maximum glycolytic capacity using extracellular flux measurements. PLoS One 11: , e0152016. |
[55] | Mookerjee SA , Gerencser AA , Nicholls DG , Brand MD ((2017) ) Quantifying intracellular rates of glycolytic and oxidative ATP production and consumption using extracellular flux measurements. J Biol Chem 292: , 7189–7207. |
[56] | Mookerjee SA , Goncalves RLS , Gerencser AA , Nicholls DG , Brand MD ((2015) ) The contributions of respiration and glycolysis to extracellular acid production. Biochim Biophys Acta 1847: , 171–181. |
[57] | Cox J , Hein MY , Luber CA , Paron I , Nagaraj N , Mann M ((2014) ) Accurate proteome-wide label-free quantification by delayed normalization and maximal peptide ratio extraction, termed MaxLFQ. Mol Cell Proteomics 13: , 2513–2526. |
[58] | Cox J , Mann M ((2008) ) MaxQuant enables high peptide identification rates, individualized p.p.b.-range mass accuracies and proteome-wide protein quantification. Nat Biotechnol 26: , 1367–1372. |
[59] | Choi M , Chang C-Y , Clough T , Broudy D , Killeen T , MacLean B , Vitek O ((2014) ) MSstats: An R package for statistical analysis of quantitative mass spectrometry-based proteomic experiments. Bioinformatics 30: , 2524–2526. |
[60] | Huang da W , Sherman BT , Lempicki RA ((2008) ) Systematic and integrative analysis of large gene lists using DAVID bioinformatics resources. Nat Protoc 4: , 44–57. |
[61] | Kanehisa M , Goto S , Hattori M , Aoki-Kinoshita KF , Itoh M , Kawashima S , Katayama T , Araki M , Hirakawa M ((2006) ) From genomics to chemical genomics: New developments in KEGG. Nucleic Acids Res 34: Suppl 1, D354–D357. |
[62] | Kumada Y , Zhao C , Ishimura R , Imanaka H , Imamura K , Nakanishi K ((2007) ) Protein–protein interaction analysis using an affinity peptide tag and hydrophilic polystyrene plate. J Biotechnol 128: , 354–361. |
[63] | Roider HG , Manke T , O’Keeffe S , Vingron M , Haas SA ((2009) ) PASTAA: Identifying transcription factors associated with sets of co-regulated genes. Bioinformatics 25: , 435–442. |
[64] | Zambelli F , Pesole G , Pavesi G ((2009) ) Pscan: Finding over-represented transcription factor binding site motifs in sequences from co-regulated or co-expressed genes. Nucleic Acids Res 37: Suppl 2, W247–W252. |
[65] | Gohil VM , Sheth SA , Nilsson R , Wojtovich AP , Lee JH , Perocchi F , Chen W , Clish CB , Ayata C , Brookes PS , Mootha VK ((2010) ) Nutrient-sensitized screening for drugs that shift energy metabolism from mitochondrial respiration to glycolysis. Nat Biotechnol 28: , 249–255. |
[66] | Mendelsohn BA , Bennett NK , Darch MA , Yu K , Nguyen MK , Pucciarelli D , Nelson M , Horlbeck MA , Gilbert LA , Hyun W , Kampmann M , Nakamura JL , Nakamura K ((2018) ) A high-throughput screen of real-time ATP levels in individual cells reveals mechanisms of energy failure. PLoS Biol 16: , e2004624. |
[67] | Titov DV , Cracan V , Goodman RP , Peng J , Grabarek Z , Mootha VK ((2016) ) Complementation of mitochondrial electron transport chain by manipulation of the NAD+/NADH ratio. Science 352: , 231–235. |
[68] | Verdin E ((2015) ) NAD+ in aging, metabolism, and neurodegeneration. Science 350: , 1208–1213. |
[69] | Murphy MP ((2009) ) How mitochondria produce reactive oxygen species. Biochem J 417: , 1–13. |
[70] | Brookes PS , Yoon Y , Robotham JL , Anders MW , Sheu S-S ((2004) ) Calcium, ATP, and ROS: A mitochondrial love-hate triangle. Am J Physiol Cell Physiol 287: , C817–C833. |
[71] | Brisac C , Téoulé F , Autret A , Pelletier I , Colbère-Garapin F , Brenner C , Lemaire C , Blondel B ((2010) ) Calcium flux between the endoplasmic reticulum and mitochondrion contributes to poliovirus-induced apoptosis. J Virol 84: , 12226–12235. |
[72] | Calvo SE , Clauser KR , Mootha VK ((2016) ) MitoCarta2.0: An updated inventory of mammalian mitochondrial proteins. Nucleic Acids Res 44: , D1251–D1257. |
[73] | Smith AC , Robinson AJ ((2016) ) MitoMiner v3.1, an update on the mitochondrial proteomics database. Nucleic Acids Res 44: , D1258–D1261. |
[74] | Ashburner M , Ball CA , Blake JA , Botstein D , Butler H , Cherry JM , Davis AP , Dolinski K , Dwight SS , Eppig JT , Harris MA , Hill DP , Issel-Tarver L , Kasarskis A , Lewis S , Matese JC , Richardson JE , Ringwald M , Rubin GM , Sherlock G ((2000) ) Gene Ontology: Tool for the unification of biology. Nat Genet 25: , 25–29. |
[75] | The Gene Ontology Consortium ((2017) ) Expansion of the Gene Ontology knowledgebase and resources. Nucleic Acids Res 45: , D331–D338. |
[76] | Kanehisa M , Goto S ((2000) ) KEGG: Kyoto encyclopedia of genes and genomes. Nucleic Acids Res 28: , 27–30. |
[77] | Kanehisa M , Sato Y , Kawashima M , Furumichi M , Tanabe M ((2016) ) KEGG as a reference resource for gene and protein annotation. Nucleic Acids Res 44: , D457–D462. |
[78] | Kanehisa M , Furumichi M , Tanabe M , Sato Y , Morishima K ((2017) ) KEGG: New perspectives on genomes, pathways, diseases and drugs. Nucleic Acids Res 45: , D353–D361. |
[79] | Esterberg R , Hailey DW , Rubel EW , Raible DW ((2014) ) ER–mitochondrial calcium flow underlies vulnerability of mechanosensory hair cells to damage. J Neurosci 34: , 9703–9719. |
[80] | Signes A , Fernandez-Vizarra E ((2018) ) Assembly of mammalian oxidative phosphorylation complexes I–V and supercomplexes. Essays Biochem 62: , 255–270. |
[81] | Fernández-Vizarra E , Tiranti V , Zeviani M ((2009) ) Assembly of the oxidative phosphorylation system in humans: What we have learned by studying its defects. Biochim Biophys Acta 1793: , 200–211. |
[82] | Dennerlein S , Rehling P ((2015) ) Human mitochondrial COX1 assembly into cytochromeoxidase at a glance. J Cell Sci 128: , 833–837. |
[83] | Diaz F ((2010) ) Cytochrome c oxidase deficiency: Patients and animal models. Biochim Biophys Acta 1802: , 100–110. |
[84] | Mick David U , Dennerlein S , Wiese H , Reinhold R , Pacheu-Grau D , Lorenzi I , Sasarman F , Weraarpachai W , Shoubridge Eric A , Warscheid B , Rehling P ((2012) ) MITRAC links mitochondrial protein translocation to respiratory-chain assembly and translational regulation. Cell 151: , 1528–1541. |
[85] | Richter-Dennerlein R , Oeljeklaus S , Lorenzi I , Ronsör C , Bareth B , Schendzielorz AB , Wang C , Warscheid B , Rehling P , Dennerlein S ((2016) ) Mitochondrial protein synthesis adapts to influx of nuclear-encoded protein. Cell 167: , 471–483. |
[86] | Richter-Dennerlein R , Dennerlein S , Rehling P ((2015) ) Integrating mitochondrial translation into the cellular context. Nat Rev Mol Cell Biol 16: , 586–592. |
[87] | Barrientos A , Gouget K , Horn D , Soto IC , Fontanesi F ((2009) ) Suppression mechanisms of COX asbly defects in yeast and human: Insights into the COX assembly process. Biochim Biophys Acta 1793: , 97–107. |
[88] | Bensaad K , Tsuruta A , Selak MA , Vidal MNC , Nakano K , Bartrons R , Gottlieb E , Vousden KH ((2006) ) TIGAR, a p53-inducible regulator of glycolysis and apoptosis. Cell 126: , 107–120. |
[89] | Wanka C , Steinbach JP , Rieger J ((2012) ) Tp53-induced glycolysis and apoptosis regulator (TIGAR) protects glioma cells from starvation-induced cell death by up-regulating respiration and improving cellular redox homeostasis. J Biol Chem 287: , 33436–33446. |
[90] | Zhang H , Ryu D , Wu Y , Gariani K , Wang X , Luan P , D’Amico D , Ropelle ER , Lutolf MP , Aebersold R , Schoonjans K , Menzies KJ , Auwerx J ((2016) ) NAD+ repletion improves mitochondrial and stem cell function and enhances life span in mice. Science 352: , 1436–1443. |
[91] | Vemuri GN , Eiteman MA , McEwen JE , Olsson L , Nielsen J ((2007) ) Increasing NADH oxidation reduces overflow metabolism in. Proc Natl Acad Sci U S A 104: , 2402–2407. |
[92] | Fluge Ø , Mella O , Bruland O , Risa K , Dyrstad SE , Alme K , Rekeland IG , Sapkota D , Røsland GV , Fosså A , Ktoridou-Valen I , Lunde S , Sørland K , Lien K , Herder I , Thürmer H , Gotaas ME , Baranowska KA , Bohnen LMLJ , Schäfer C , McCann A , Sommerfelt K , Helgeland L , Ueland PM , Dahl O , Tronstad KJ ((2016) ) Metabolic profiling indicates impaired pyruvate dehydrogenase function in myalgic encephalopathy/chronic fatigue syndrome. JCI Insight 1: , e89376. |
[93] | Deniaud A , Sharaf el dein O , Maillier E , Poncet D , Kroemer G , Lemaire C , Brenner C ((2008) ) Endoplasmic reticulum stress induces calcium-dependent permeability transition, mitochondrial outer membrane permeabilization and apoptosis. Oncogene 27: , 285–299. |
[94] | Bravo R , Gutierrez T , Paredes F , Gatica D , Rodriguez AE , Pedrozo Z , Chiong M , Parra V , Quest AFG , Rothermel BA , Lavandero S ((2012) ) Endoplasmic reticulum: ER stress regulates mitochondrial bioenergetics. Int J Biochem Cell Biol 44: , 16–20. |
[95] | Szabadkai G , Bianchi K , Várnai P , De Stefani D , Wieckowski MR , Cavagna D , Nagy AI , Balla T , Rizzuto R ((2006) ) Chaperone-mediated coupling of endoplasmic reticulum and mitochondrial Ca2+ channels. J Cell Biol 175: , 901–911. |
[96] | Iwasawa R , Mahul-Mellier AL , Datler C , Pazarentzos E , Grimm S ((2011) ) Fis1 and Bap31 bridge the mitochondria–ER interface to establish a platform for apoptosis induction. EMBO J 30: , 556–568. |
[97] | de Brito OM , Scorrano L ((2008) ) Mitofusin 2 tethers endoplasmic reticulum to mitochondria. Nature 456: , 605–610. |
[98] | Tubbs E , Theurey P , Vial G , Bendridi N , Bravard A , Chauvin M-A , Ji-Cao J , Zoulim F , Bartosch B , Ovize M , Vidal H , Rieusset J ((2014) ) Mitochondria-associated endoplasmic reticulum membrane (MAM) integrity is required for insulin signaling and is implicated in hepatic insulin resistance. Diabetes 63: , 3279–3294. |
[99] | Rowland AA , Voeltz GK ((2012) ) Endoplasmic reticulum–mitochondria contacts: Function of the junction. Nat Rev Mol Cell Biol 13: , 607–625. |
[100] | Phillips MJ , Voeltz GK ((2016) ) Structure and function of ER membrane contact sites with other organelles. Nat Rev Mol Cell Biol 17: , 69–82. |
[101] | Rieusset J ((2018) ) The role of endoplasmic reticulum-mitochondria contact sites in the control of glucose homeostasis: An update. Cell Death Dis 9: , 388. |
[102] | Naon D , Scorrano L ((2014) ) At the right distance: ER-mitochondria juxtaposition in cell life and death. Biochim Biophys Acta 1843: , 2184–2194. |
[103] | Schon EA , Area-Gomez E ((2013) ) Mitochondria-associated ER membranes in Alzheimer disease. Mol Cell Neurosci 55: , 26–36. |
[104] | Tambini MD , Pera M , Kanter E , Yang H , Guardia-Laguarta C , Holtzman D , Sulzer D , Area-Gomez E , Schon EA ((2016) ) ApoE4 upregulates the activity of mitochondria-associated ER membranes. EMBO Rep 17: , 27–36. |
[105] | Youle RJ , van der Bliek AM ((2012) ) Mitochondrial fission, fusion, and stress. Science 337: , 1062–1065. |
[106] | Wiedemann N , Frazier AE , Pfanner N ((2004) ) The protein import machinery of mitochondria. J Biol Chem 279: , 14473–14476. |
[107] | Koppen M , Langer T ((2007) ) Protein degradation within mitochondria: Versatile activities of AAA proteases and other peptidases. Crit Rev Biochem Mol Biol 42: , 221–242. |
[108] | Friedman JR , Mourier A , Yamada J , McCaffery JM , Nunnari J ((2015) ) MICOS coordinates with respiratory complexes and lipids to establish mitochondrial inner membrane architecture. eLife 4: , e07739. |
[109] | Sylvester JE , Fischel-Ghodsian N , Mougey EB , O’Brien TW ((2004) ) Mitochondrial ribosomal proteins: Candidate genes for mitochondrial disease. Genet Med 6: , 73–80. |
[110] | Scarpulla RC ((2005) ) Nuclear control of respiratory gene expression in mammalian cells. J Cell Biochem 97: , 673–683. |
[111] | Ohtsuji M , Katsuoka F , Kobayashi A , Aburatani H , Hayes JD , Yamamoto M ((2008) ) Nrf1 and Nrf2 play distinct roles in activation of antioxidant response element-dependent genes. J Biol Chem 283: , 33554–33562. |
[112] | Yang Z-F , Drumea K , Mott S , Wang J , Rosmarin AG ((2014) ) GABP transcription factor (nuclear respiratory factor 2) is required for mitochondrial biogenesis. Mol Cell Biol 34: , 3194–3201. |
[113] | Holmström KM , Kostov RV , Dinkova-Kostova AT ((2016) ) The multifaceted role of Nrf2 in mitochondrial function. Curr Opin Toxicol 1: , 80–91. |
[114] | Dinkova-Kostova AT , Abramov AY ((2015) ) The emerging role of Nrf2 in mitochondrial function. Free Radic Biol Med 88: , 179–188. |
[115] | Dhar SS , Ongwijitwat S , Wong-Riley MTT ((2008) ) Nuclear respiratory factor 1 regulates all ten nuclear-encoded subunits of cytochrome c oxidase in neurons. J Biol Chem 283: , 3120–3129. |
[116] | Johar K , Priya A , Dhar S , Liu Q , Wong-Riley MTT ((2013) ) Neuron-specific specificity protein 4 bigenomically regulates the transcription of all mitochondria- and nucleus-encoded cytochrome c oxidase subunit genes in neurons. J Neurochem 127: , 496–508. |
[117] | Taherzadeh-Fard E , Saft C , Akkad DA , Wieczorek S , Haghikia A , Chan A , Epplen JT , Arning L ((2011) ) PGC-1alpha downstream transcription factors NRF-1 and TFAM are genetic modifiers of Huntington disease. Mol Neurodegener 6: , 32. |
[118] | Urfer-Buchwalder A , Urfer R ((2017) ) Identification of a nuclear respiratory factor 1 recognition motif in the apolipoprotein E variant APOE4 linked to Alzheimer’s disease. Sci Rep 7: , 40668. |
[119] | Besnard A , Galan-Rodriguez B , Vanhoutte P , Caboche J ((2011) ) Elk-1 a transcription factor with multiple facets in the brain. Front Neurosci 5: , 35. |
[120] | Wezyk M , Spólnicka M , Pośpiech E , Pepłońska B , Zbieć-Piekarska R , Ilkowski J , Styczyńska M , Barczak A , Zboch M , Filipek-Gliszczynska A , Skrzypczak M , Ginalski K , Kabza M , Makałowska I , Barcikowska-Kotowicz M , Branicki W , Żekanowski C ((2018) ) Hypermethylation ofandinfluences cell death signaling in familial Alzheimer’s disease. Oxid Med Cell Longev 2018: , 11. |
[121] | Boutillier S , Lannes B , Buée L , Delacourte A , Rouaux C , Mohr M , Bellocq J-P , Sellal F , Larmet Y , Boutillier A-L , Loeffler J-P ((2007) ) Sp3 and Sp4 transcription factor levels are increased in brains of patients with Alzheimer’s disease. Neurodegener Dis 4: , 413–423. |

