
Modulation of Proteome Profile in AβPP/PS1 Mice Hippocampus, Medial Prefrontal Cortex, and Striatum by Palm Oil Derived Tocotrienol-Rich Fraction
Abstract
Tocotrienol-rich fraction (TRF) is a mixture of vitamin E analogs derived from palm oil. We previously demonstrated that supplementation with TRF improved cognitive function and modulated amyloid pathology in AβPP/PS1 mice brains. The current study was designed to examine proteomic profiles underlying the therapeutic effect of TRF in the brain. Proteomic analyses were performed on samples of hippocampus, medial prefrontal cortex (mPFC), and striatum using liquid chromatography coupled to Q Exactive HF Orbitrap mass spectrometry. From these analyses, we profiled a total of 5,847 proteins of which 155 proteins were differentially expressed between AβPP/PS1 and wild-type mice. TRF supplementation of these mice altered the expression of 255 proteins in the hippocampus, mPFC, and striatum. TRF also negatively modulated the expression of amyloid beta A4 protein and receptor-type tyrosine-protein phosphatase alpha protein in the hippocampus. The expression of proteins in metabolic pathways, oxidative phosphorylation, and those involved in Alzheimer’s disease were altered in the brains of AβPP/PS1 mice that received TRF supplementation.
INTRODUCTION
Alzheimer’s disease (AD) is the most common form of dementia, which is characterized by a progressive decline in memory and cognitive capabilities, accompanied by neuropathological hallmarks, such as aggregates of amyloid-β (Aβ) in plaques and neurofibrillary tangles [1]. Aβ is generated from sequential proteolytic processing of amyloid-β protein precursor (AβPP) by β- and γ-secretases [2]. The progression of AD can be influenced by genetic, environment, and lifestyle factors [3]. AD commonly occurs with advanced age, but it may also have an early-onset, as observed with familial AD through the enhanced generation and accumulation of Aβ caused by mutations in APP or presenilins-1 and 2 (PSEN1 and PSEN2) [4, 5]. Overall, it is important to find a cure for AD at an early preclinical stage, and various natural-source compounds are one possible therapeutic approach.
Vitamin E, a lipid soluble vitamin, has been shown to preserve cognitive function and general well-being in the elderly [6–8]. However, a previous randomized controlled trial has reported that vitamin E in the form of α-tocopherol showed no significant effects on AD progression compared to the placebo group [9], while Dysken et al. showed that α-tocopherol was effective in slowing the progression of mild to moderate AD [6]. Vitamin E in the form of tocotrienols exhibits a significantly greater neuroprotective effect than α-tocopherol as it has been shown to protect against glutamate-induced neuronal death by suppressing inducible pp60 c-Src kinase activation at a nanomolar concentration [10]. Vitamin E is composed of tocopherols and tocotrienols. Tocopherols and tocotrienols have isomers, designated as α-, β-, γ-, and δ-, which differ by the number and position of methyl groups on the chromanol ring [11]. Tocotrienols differ from tocopherols by the presence of three double bonds in their isoprenoid side chain, which contributes to easier penetration into saturated fatty acid layers around the brain, thereby providing higher efficacy and potency as antioxidants [12, 13]. The combination of tocotrienols and tocopherols has been shown to be neuroprotective and to reduce AD risk at an advanced age [14].
A major source of vitamin E containing nearly 70% tocotrienols and 30% tocopherols is palm oil from Elais guineensis (African oil palm tree) [15, 16]. Tocotrienol-rich fraction (TRF), a mixture of vitamin E analogs derived from palm oil, has garnered attention recently. Several reports have shown the potential of TRF in modulating Aβ metabolism [17], brain metabolites [18, 19], antioxidant defense mechanisms [19, 20], and cancer prevention [21]. Previously we have demonstrated that long-term supplementation (ten months) of TRF on APPswe/PS1dE9 double transgenic (Tg) mice (AβPP/PS1), a mouse model of AD, reduced amyloid pathology in the brain [17]. Long-term supplementation of TRF has also been shown to enhance spatial memory, working memory, and locomotor activity of AβPP/PS1 mice [18]. Our recent metabolomics study showed that TRF exerts its neuroprotective effect in the AβPP/PS1 mice brain possibly by modulating metabolic pathways involved in bioenergetics, neurotransmission, membrane lipid metabolism, and oxidative stress defense [18]. However, the effect of TRF on AβPP/PS1 mice has not yet been investigated at the proteome level. This is essential to further understand the progression of AD-like pathogenesis in AβPP/PS1 mice, and how TRF might be altering the onset and progression of the disease.
Hence, the present study examined the proteome profile of AβPP/PS1 mice hippocampus, medial prefrontal cortex (mPFC), and striatum, compared to wild-type (WT) mice. In addition, we also analyzed the effect of TRF supplementation on these brain regions of AβPP/PS1 mice, by comparing them with its vehicle control group, Tg-PO mice, which received palm oil stripped of vitamin E. To our knowledge, this is the first study analyzing the effect of TRF on untargeted proteome profile of AβPP/PS1 mice brain regions (hippocampus, mPFC, and striatum) by using ultrahigh-performance liquid chromatography (UHPLC) coupled to Q Exactive HF Orbitrap mass spectrometry.
MATERIALS AND METHODS
Animals
APPswe/PS1dE9 double transgenic (Tg) mice (AβPP/PS1) line 85, expressing a chimeric mouse/human amyloid precursor protein (Mo/HuAPP695swe) and a mutant human presenilin 1 with deletion at exon-9 (PS1-dE9), were obtained from Jackson Laboratory (Bar Harbor, ME, USA) [22]. Mice were maintained by breeding heterozygous females with WT males. The offspring were genotyped by polymerase chain reaction (PCR) using the APP primers:
forward-GACTGACCACTCGACCAGGTTCTG
/reverse-CTTGTAAGTTGGATTCTCATATCCG,
and the following two presenilins 1 sequences:
forward-CTCTTTGTGACTATGTGGACTGATGTCGG
/reverse- GTGGATAACCCCTCCCCCAGCCTAGACC
and forward- ATTAGAGAACGGCAGGAGCA
/reverse-GCCATGAGGGCACTAATCAT.
Only heterozygous and WT male mice were used in this study. All mice were housed in a controlled environment (23°C, 12 h/12 h light/dark cycle (lights on from 8:00–20:00)) with ad libitum access to food and water. All animal protocols were approved by the Animal Care and Use Committee of the Shiga University of Medical Science (Ethical committee approval number: 2013-6-12H).
TRF supplementation
The TRF used in this study (Sime Darby, Selangor, Malaysia) consisted of a mixture of α-tocopherol (168.0 mg/g), α-tocotrienol (196.0 mg/g), β-tocotrienol (24.0 mg/g), γ-tocotrienol (255.0 mg/g), and δ-tocotrienol (75.0 mg/g). Palm oil stripped of vitamin E (PO) was purchased from the Malaysian Palm Oil Board (Selangor, Malaysia). TRF was dissolved at 12 mg/mL in PO as previously described [17]. Five-month-old mice were divided into four groups (n = 3 per group): two groups received water (WT-ctrl and Tg-ctrl, 5 mL/kg body weight), one group received PO as a vehicle (Tg-PO, 5 mL/kg body weight), and the other received TRF (60 mg/kg body weight). All mice received daily supplementation of TRF (Tg-TRF), PO (Tg-PO), or water (Tg-ctrl and WT-ctrl) by oral gavage for a duration of 10 months. The mice used in the study were subjected to behavioral tests (open field, novel object recognition, and Morris water maze) as reported in our previous study [18].
Proteome analysis in mice brain
Brain tissue preparation
The mice were sacrificed by cervical dislocation. Each brain was rapidly removed and rinsed in ice-cold 10 mM phosphate buffered saline. The brain was sectioned into 1.0 mm coronal slices using a Mouse Brain Slicer Matrix (Zivic Instruments Inc., Pittsburgh, PA, USA), and further dissected into three different regions, hippocampus, mPFC, and striatum, on an ice-cold plate. Each sample was transferred into individual tubes, immediately weighed, frozen on dry ice, and stored at –80°C until analysis.
Protein extraction, protein separation, and in-gel digestion
Protein extraction, protein separation, and in-gel digestion were conducted according to our previously described method [23]. For the protein extraction procedure, the mice hippocampus, mPFC, and striatum were homogenized using an ultrasonicator (QSonica, Newtown, CT, USA). Next, the brain homogenates were centrifuged (20,600×g, 4°C, 15 min) and the supernatants were collected. Thiourea rehydration buffer was added to the remaining pellets. The mixture was centrifuged (20,600×g, 4°C, 15 min). The resulting supernatants were then pooled with the earlier collected supernatants. The protein concentration in each sample was quantified using a Bio-Rad Bradford protein assay kit (Bio-Rad, CA, USA). Each sample containing 50μg of extracted protein was separated by gel electrophoresis at 120 V constant current. The gel was stained with Simply Blue Safe Stain (Invitrogen, USA) and washed thoroughly to remove excess stain. For in-gel digestion procedure, the gel was cut into six fractions, and further sliced into 1 to 2 mm pieces. Next, the gel pieces were transferred into a tube containing 50% acetonitrile/50 mM ammonium bicarbonate solution and shaken for 15 min. The solution was removed and the process was repeated until no visible stain was observed in the gel pieces. The gel pieces were reduced with 10 mM dithiothreitol/100 mM ammonium bicarbonate solution, alkylated with 55 mM iodoacetamide/100 mM ammonium bicarbonate solution, dehydrated with acetonitrile solution, and dried in a vacuum concentrator. The gel pieces were then incubated overnight with 6 ng of trypsin/50 mM ammonium bicarbonate solution at 37°C. After overnight digestion, the gel pieces were agitated constantly for 15 min in acetonitrile solution. The solution was then transferred into a new tube. The gel pieces were extracted again with 50% acetonitrile/50 mM ammonium bicarbonate solution. The solutions collected from both tubes were pooled into one tube and then dried for about 3 h using a vacuum concentrator at 30°C. The dried peptides from each tissue sample were reconstituted in 0.1% formic acid solution before analysis on the liquid chromatography-tandem mass spectrometry (LC-MS/MS) system.
Liquid chromatography and MS/MS analysis
Proteomics analysis was carried out using LC-MS/MS according to the methods described previously [23]. Upon injection of 6μL of 50μg extracted sample into the LC-MS/MS system, the sample underwent chromatographic separation in the Dionex Ultimate 3000 UHPLC instrument (Thermo Fisher Scientific, Waltham, MA, USA) through reversed phase PepMap-C18 pre-column with 300μm inner diameter×5 mm length, packed with 5μm particles, and chromatographed on a PepMap RSLC C18 2μm, 100 Å, 75μm×25 cm column (Thermo Fisher Scientific), at 35°C. The sample was separated using a binary gradient mobile phase system with a total running time of 135 min and a constant flow of 300 nL/min as described previously [23]. A Q Exactive HF (Thermo Scientific) quadrupole-Orbitrap hybrid instrument was used to acquire mass spectra and tandem mass spectra under the control of the manufacturer’s XCalibur version 4.0 software. Electrospray ionization was set at positive mode whereas capillary temperature and spray voltage were applied at 275°C and 1.6 kV, respectively. Full-scan mass spectra were acquired from m/z 350 to 1800 with resolution, automatic gain control (AGC) threshold and maximum injection time set to 120000, 3×10⁶ and 100 ms, respectively. For data dependent acquisition, the following settings were applied. Only precursors with an assigned monoisotopic m/z and a charge state of 2 to 7 were included for the MS/MS scans. From survey scans, the software chose in real time maximum 20 precursor ions based on intensity and assigned charge state to trigger subsequent MS/MS acquisitions. Maximum injection time was set at 65 ms and isolation window of 0.7 m/z. Higher energy collisional dissociation (HCD) with a normalized collision energy (NCE) was set to 28%. Minimum AGC threshold was set at 5×10³, intensity threshold was kept at 7.7×10⁴ and apex-triggered MS/MS scan was set at 2 to 15 s. Dynamic exclusion duration used was 20 s to avoid repeating MS/MS scan for the same precursor ion.
Data analysis
Protein identification and quantification
The mass spectra data were analyzed by using MaxQuant version 1.5.3.30 (http://www.maxquant.org) using a similar setting as described previously [23]. The data were searched by the built-in Andromeda search engine [24, 25] against Mus musculus sequences obtained from the UniProt database (http://www.uniprot.org) accessed on September 2016. Protein identification was filtered using a target-decoy approach with a false discovery rate (FDR) of 1%. Trypsin was set as the digestive enzyme, while missed cleavage by the enzymatic digestion was set at two sites for the protein sequence. Methionine oxidation and protein N-terminal acetylation were selected as the variable modifications, while cysteine carbamidomethylation was chosen as the constant modification. Minimum peptide length and maximum peptide mass were set to seven amino acid residues and 4,600 Da, respectively (to avoid matching too short and too long tryptic peptides to protein sequences). Label-free quantification (LFQ) approach was applied to quantify the protein. The mass spectrometry proteomics data have been deposited to the ProteomeXchange Consortium via the PRIDE [26] partner repository with the dataset identifier PXD011068.
Bioinformatics and statistical analysis
The data acquired from the MaxQuant was further processed using Perseus software (version 1.5.4.1, Max Planck Institute of Biochemistry, Martinsried, Germany) [27]. The analysis was carried out according to our previously described method with some modifications [23]. First, the data were uploaded into the Perseus software, followed by screening of the proteins by removing potential contaminants, identification of protein based on sites only, and identifications from reversed sequences. The protein abundances from LFQ quantifications were log-transformed. If the calculated values were presented as “NaN” (Non-Assigned Number) values, the values were considered as missing values. The log-transformed LFQ intensity values of the proteins were filtered based on the minimum number of valid values in one experimental group. In the present study, the minimum number of valid values was set at 2, which accepted the proteins showing at least two valid values out of three samples in at least one experimental group out of four experimental groups (either Tg-ctrl, WT-ctrl, Tg-TRF, or Tg-PO groups) to be considered for the analysis. The missing values imputation was applied by considering the estimated intensity distribution. Multi-scatter plot and principal component analysis were carried out in order to estimate the variabilities between biological replicates of the brain sample.
To identify the proteins altered in AβPP/PS1 mice, the Tg-ctrl group was compared to the WT-ctrl group using a two-tailed, t-test. Similarly, a t-test was also used to test the effect of TRF supplementation on AβPP/PS1 mice by comparing Tg-TRF with its vehicle control group, Tg-PO. A protein was considered to be differentially expressed when the difference between groups had a p-value of less than 0.05 (p < 0.05). Benjamini-Hochberg test was used for the FDR correction method at a cut off value 0.05. However, since a mild change in the expression of the proteins was observed after performing a Benjamini-Hochberg test, we considered the proteins with p < 0.05 as significantly altered in this study. Both p-value and q-value of each protein are listed in the Supplementary Tables 1–4.
Next, in order to identify overlapped proteins between the differentially expressed proteins (p < 0.05) in Tg-ctrl versus WT-ctrl groups and Tg-TRF versus Tg-PO groups, we constructed Venn diagrams online at http://bioinfogp.cnb.csic.es/tools/venny/index.html [28]. Each significantly altered protein (p < 0.05) was subjected to pathway search against Kyoto Encyclopedia of Genes and Genomes (KEGG) databases (http://www.genome.jp/kegg/pathway.html) using a pathway enrichment tool, KEGG orthology-based annotation system (KOBAS) version 3.0 (http://kobas.cbi.pku.edu.cn/) [29, 30]. We selected Mus musculus library and KEGG database for the pathway search. The hypergeometric test and Fisher’s exact test were used for statistical testing in the pathway enrichment analysis and Benjamini-Hochberg was used for the FDR correction method. For each KEGG pathway, a p-value was calculated using a hypergeometric test, and a cutoff of 0.05 was applied to identify enriched KEGG pathways. Only the top five pathways with p-values less than 0.05 are listed in Tables 2 and 3.
RESULTS
Profiling of differentially expressed proteins in AβPP/PS1 mice brain
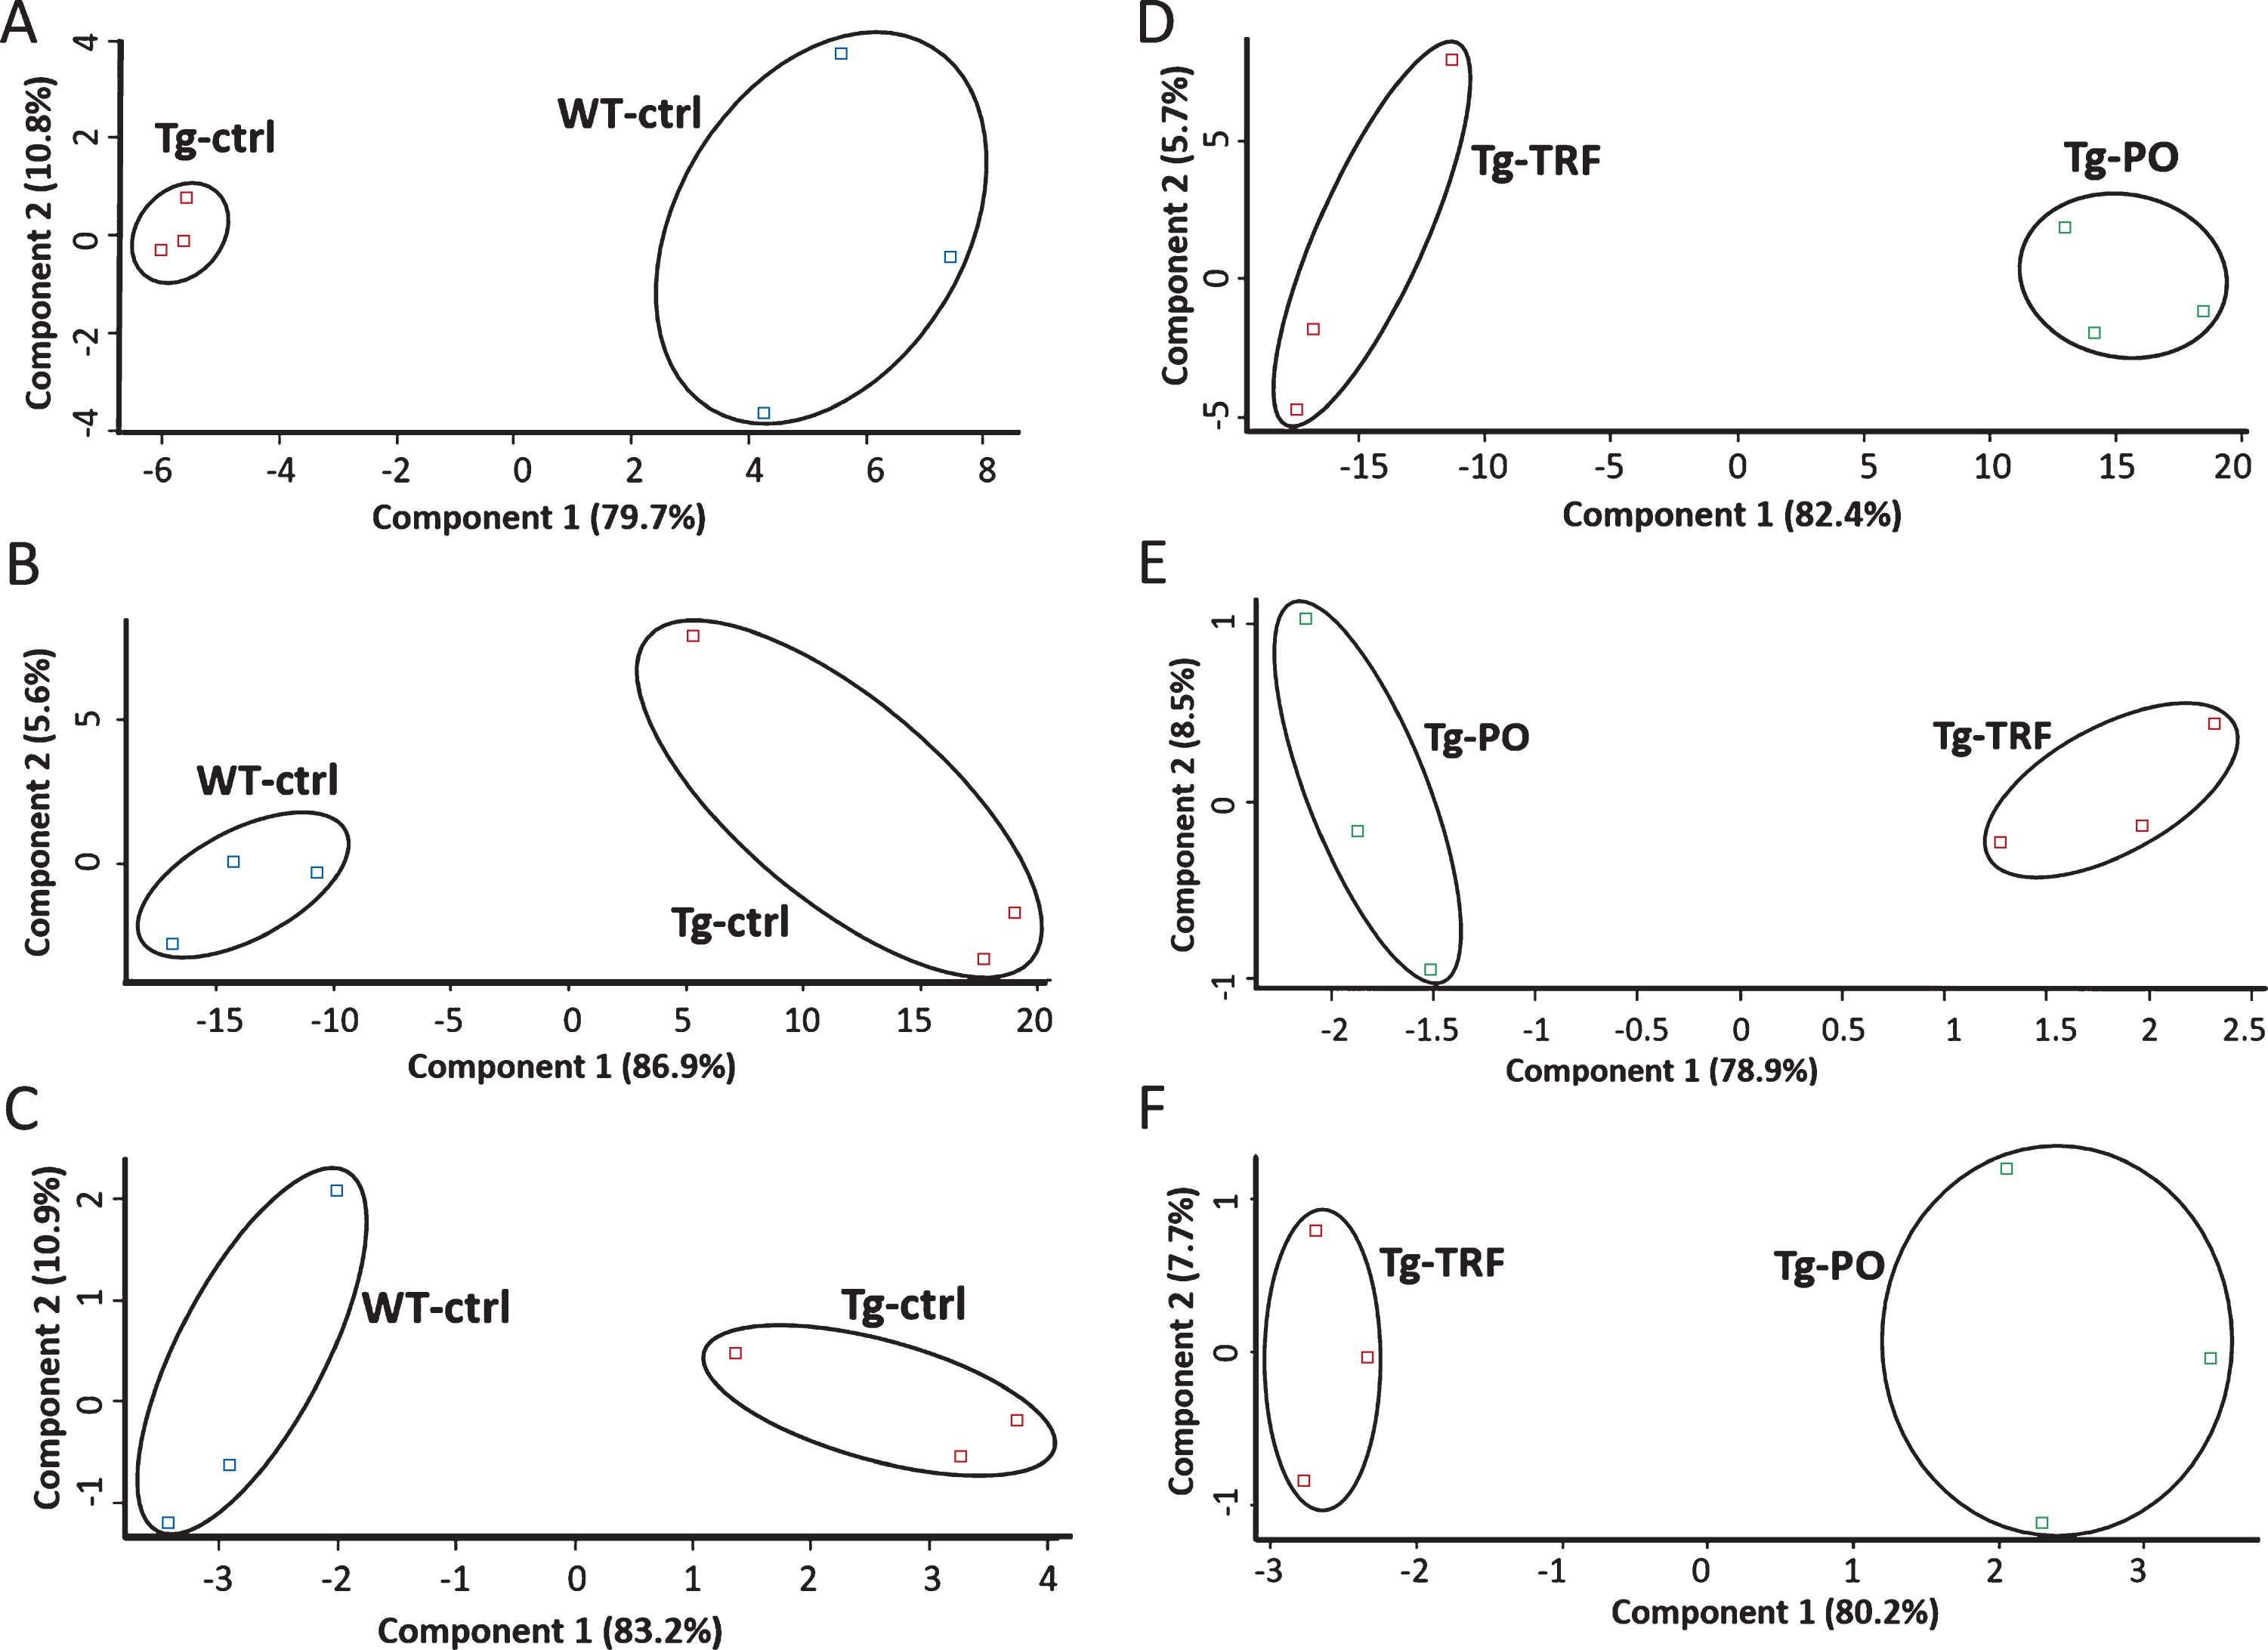
We conducted a bioinformatic analysis of the LC-MS/MS data using MaxQuant and Perseus software to investigate alterations in the proteome profile of AβPP/PS1 mice brain supplemented with TRF extracted from palm oil. From these analyses, we identified 5,847 proteins in the hippocampus, mPFC, and striatum of the AβPP/PS1 mice control and WT mice groups (Supplementary Table 1). Meanwhile, 6,047 proteins were identified in the AβPP/PS1 mice in the TRF and PO groups (Supplementary Table 2). Next, we assessed the proteome data quality by comparing the relative protein quantification among the three biological replicates of each group. Multi-scatter plots with Pearson’s correlation coefficients were about 0.5–1.0, demonstrating good reproducibility between the biological replicates in each experimental group: Tg-ctrl and WT-ctrl (Fig. 1A–C), as well as Tg-TRF and Tg-PO (Fig. 1D–F). Principal component analysis also showed that the biological replicates in each group were closely clustered, as visualized by the separation trends between Tg-ctrl and WT-ctrl (Fig. 2A–C), and also between Tg-TRF and Tg-PO (Fig. 2D–F).
Fig.1
Multi-scatter plots with Pearson correlation values of 0.5–1.0 suggest a good correlation between data obtained from the different experimental groups and biological replicates in the AβPP/PS1 mice without supplementation (Tg-ctrl) and wild-type mice (WT-ctrl) in the (A) hippocampus, (B) medial prefrontal cortex, and (C) striatum, as well as in the AβPP/PS1 mice received tocotrienol-rich fraction (Tg-TRF) and AβPP/PS1 mice received palm oil stripped of vitamin E (Tg-PO) groups in the (D) hippocampus, (E) medial prefrontal cortex, and (F) striatum.
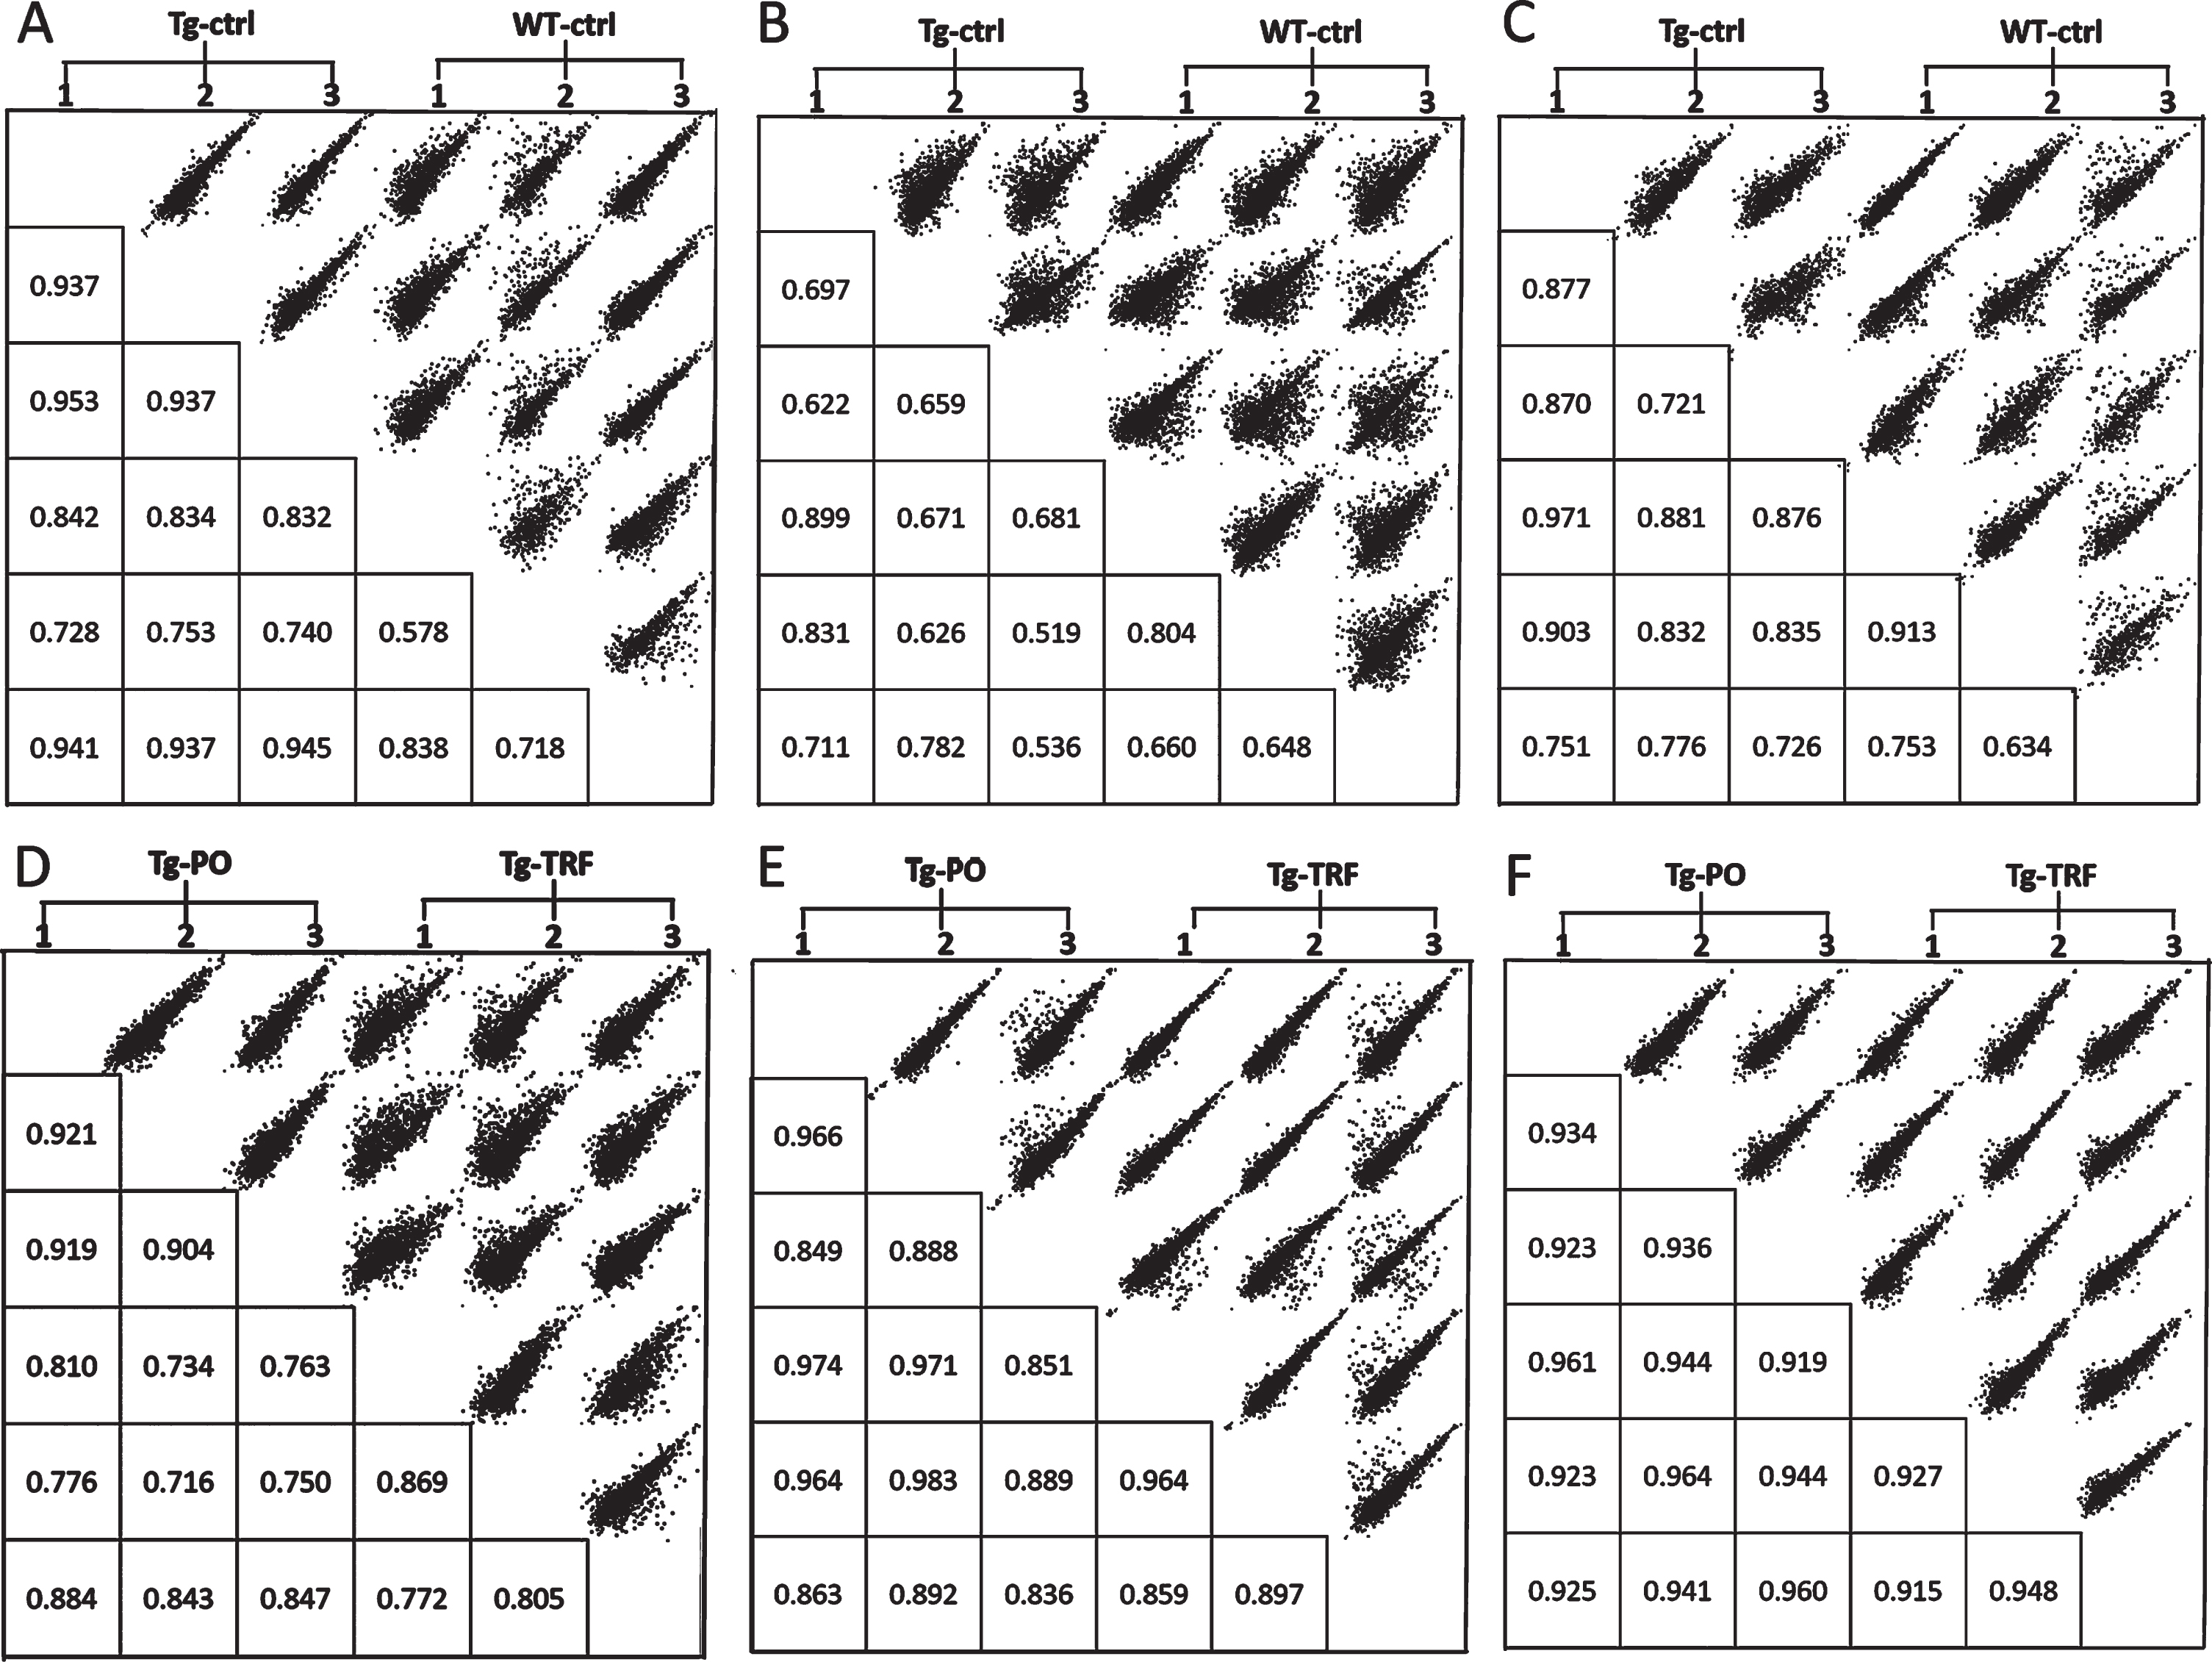
Fig.2
Principal component analysis (PCA) plots of the proteomics data reveals replicates for each of the experimental group are closely clustered, suggesting high consistency between replicates in the AβPP/PS1 mice without supplementation (Tg-ctrl) and wild-type mice (WT-ctrl) in the (A) hippocampus, (B) medial prefrontal cortex, and (C) striatum, as well as in the AβPP/PS1 mice received tocotrienol-rich fraction (Tg-TRF) and AβPP/PS1 mice received palm oil stripped of vitamin E (Tg-PO) groups in the (D) hippocampus, (E) medial prefrontal cortex, and (F) striatum.
To investigate alterations in the proteome profile of AβPP/PS1 mice brains, a comparison was made between the Tg-ctrl versus WT-ctrl groups (Table 1, Supplementary Table 3). A total of 155 proteins were significantly altered (p < 0.05) in Tg-ctrl compared with WT-ctrl mice hippocampus, mPFC, and striatum. Analyses of proteome data in these mice groups showed that the levels of 43 proteins were altered (p < 0.05) in the hippocampus (26 upregulated and 17 downregulated). The levels of 99 proteins were altered (p < 0.05) in mPFC (16 upregulated and 83 downregulated). In the striatum, the levels of 13 proteins were altered (p < 0.05), with 12 of them upregulated and 1 downregulated.
Table 1
Number of altered proteins between AβPP/PS1 transgenic mice control (Tg-ctrl) compared with wild type mice (WT-ctrl) (Tg-ctrl versus WT-ctrl) and between AβPP/PS1 transgenic mice treated with tocotrienol-rich fraction (Tg-TRF) compared with the vehicle control group, AβPP/PS1 transgenic mice treated with palm oil stripped of vitamin E (Tg-PO) (Tg-TRF versusTg-PO) in mice hippocampus, medial prefrontal cortex, and striatum
| Brain region | Hippocampus | Medial prefrontal cortex | Striatum | |||
| Groups | Tg-ctrl versus WT-ctrl | Tg-TRF versus Tg-PO | Tg-ctrl versus WT-ctrl | Tg-TRF versus Tg-PO | Tg-ctrl versus WT-ctrl | Tg-TRF versus Tg-PO |
| Upregulated | 26 | 65 | 16 | 14 | 12 | 18 |
| Downregulated | 17 | 138 | 83 | 15 | 1 | 5 |
| Total | 43 | 203 | 99 | 29 | 13 | 23 |
Next, we compared the protein levels in Tg-TRF and Tg-PO groups to test the effect of TRF on the AβPP/PS1 mice brain proteome (Table 1, Supplementary Table 4). We found that the levels of 255 proteins were significantly altered (p < 0.05) in Tg-TRF compared to Tg-PO mice in all brain regions studied. Of these, 203 proteins levels were altered (p < 0.05) in the hippocampus (65 upregulated and 138 downregulated). In the mPFC, a total of 29 proteins levels were altered (p < 0.05) with 14 upregulated and 15 downregulated proteins. The levels of 23 proteins were altered (p < 0.05) in the striatum of Tg-TRF group compared with Tg-PO with 18 and 5 proteins being upregulated or downregulated, respectively.
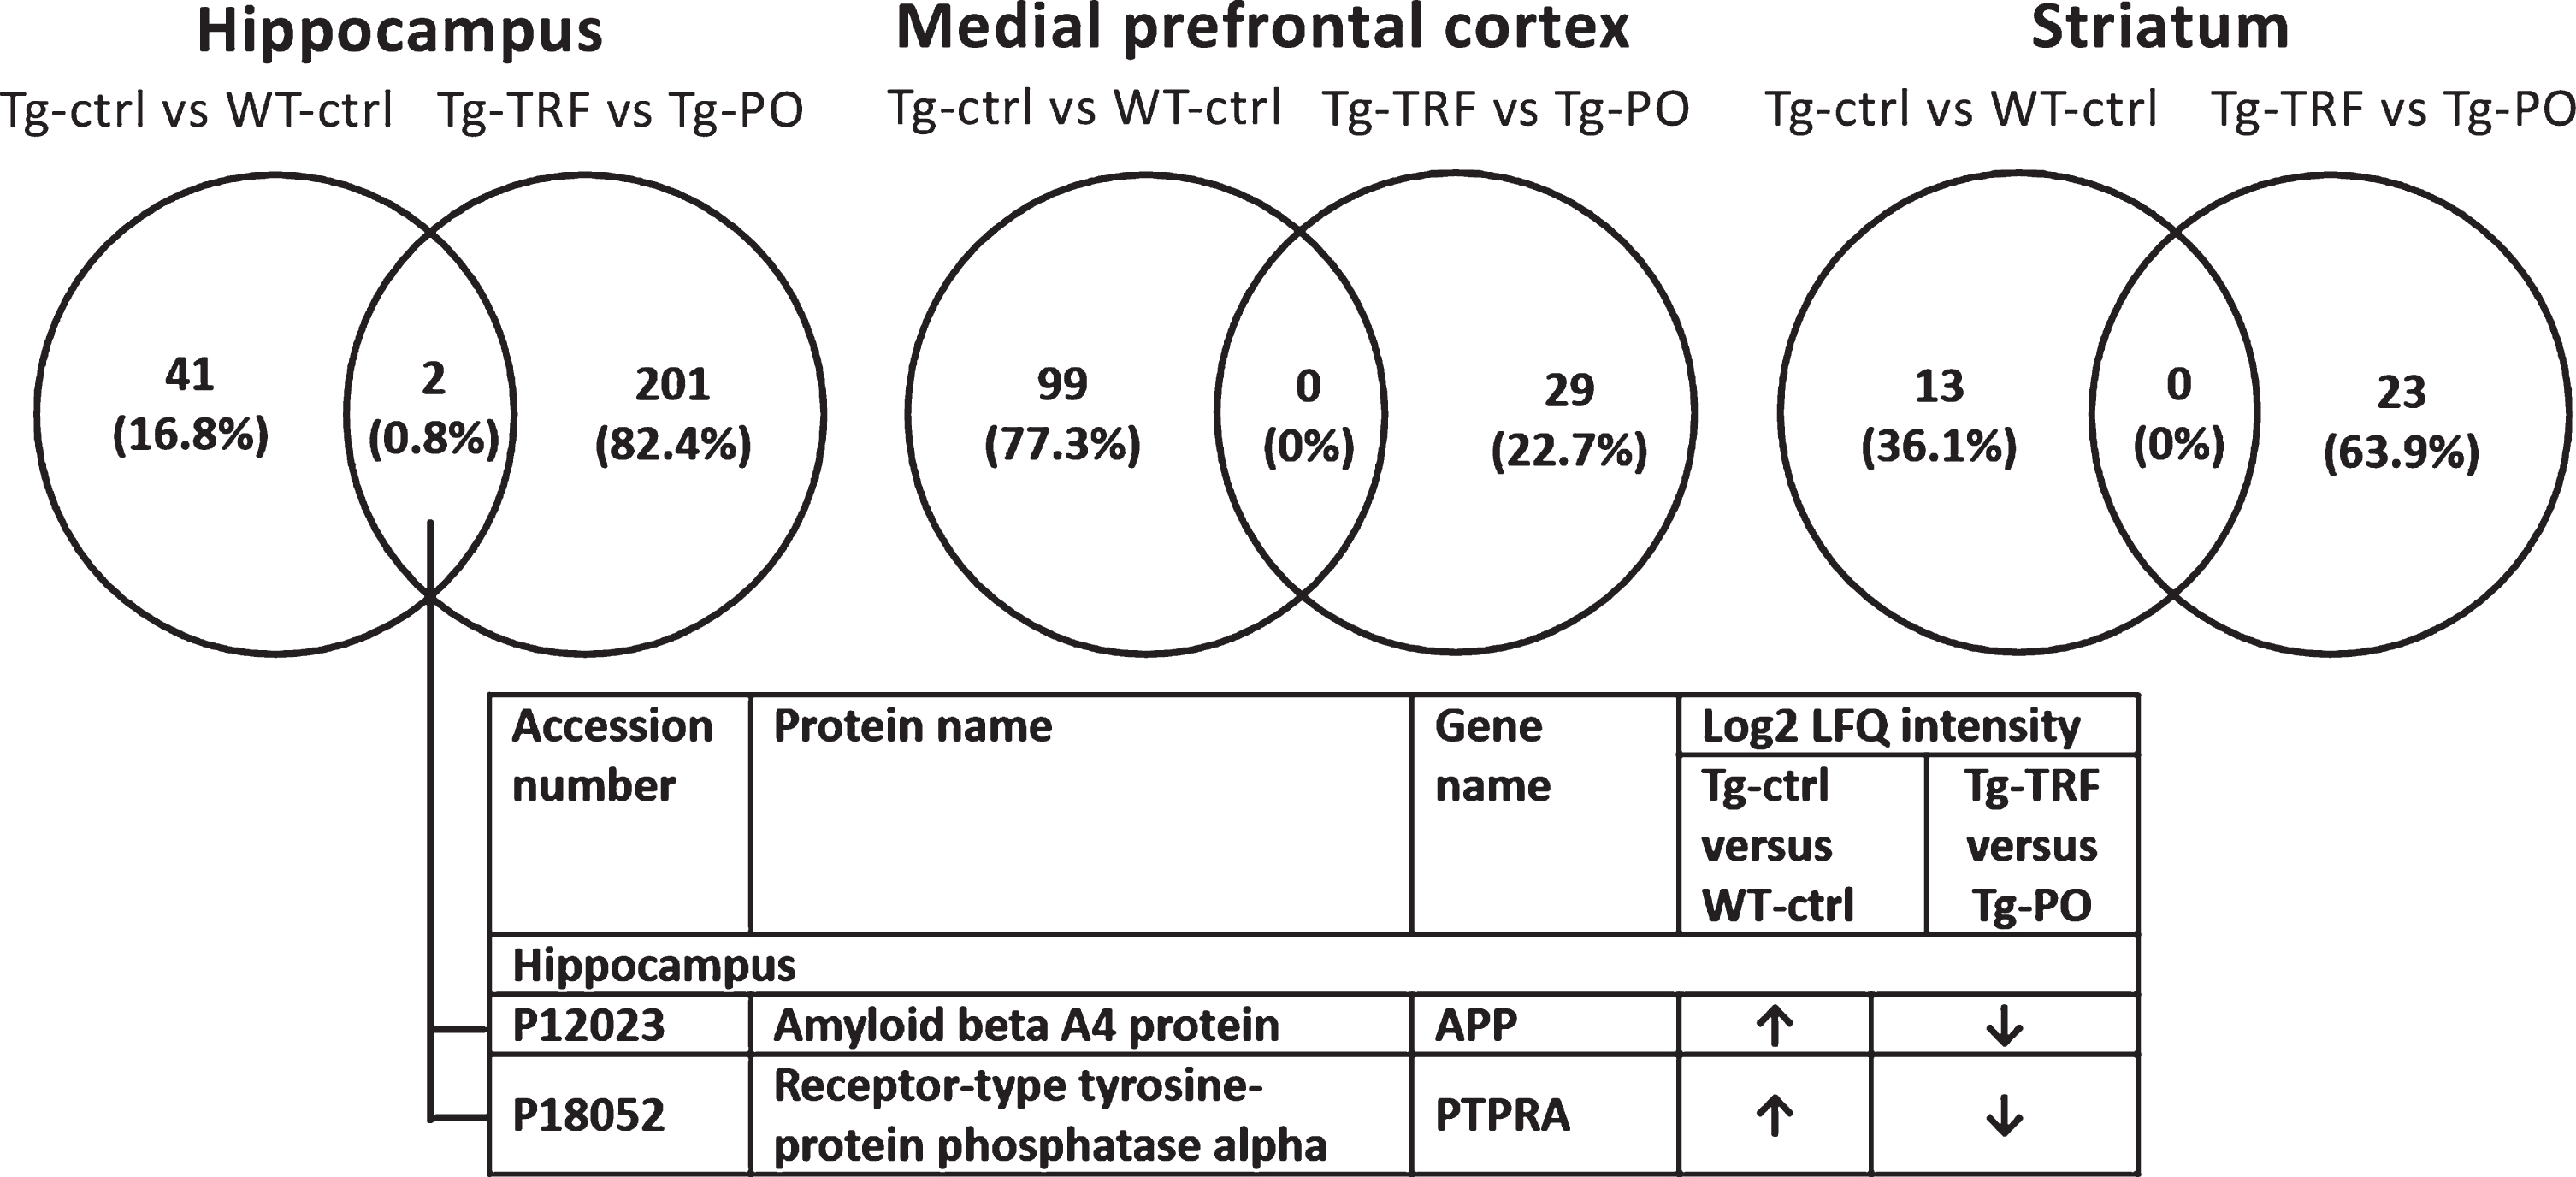
Pairwise comparison of the differentially expressed proteins (p < 0.05) between Tg-ctrl versus WT-ctrl and Tg-TRF versus Tg-PO was made to investigate the overlapped proteins between these groups for each brain region (Fig. 3). In the hippocampus, two proteins (0.8%) overlapped between Tg-ctrl versus WT-ctrl and Tg-TRF versus Tg-PO groups: amyloid beta A4 protein (APP) and receptor-type tyrosine-protein phosphatase alpha (PTPRA). There was no overlap in mPFC and striatum. APP and PTPRA proteins were significantly increased (p < 0.05) in Tg-ctrl group compared with WT-ctrl (Fig. 3). In contrast, these proteins were significantly decreased (p < 0.05) in Tg-TRF group compared with Tg-PO (Fig. 3).
Fig.3
Venn diagram for differentially expressed proteins between groups in AβPP/PS1 mice without supplementation (Tg-ctrl) versus wild-type mice (WT-ctrl) and AβPP/PS1 mice received tocotrienol-rich fraction (Tg-TRF) versus AβPP/PS1 mice received palm oil stripped of vitamin E (Tg-PO) groups in hippocampus, medial prefrontal cortex, and striatum. The overlapped proteins between the groups were listed in the table below the diagram.
Pathway analysis
Pathway analysis based on the KEGG reference pathway databases (http://www.genome.jp/kegg/pathway.html) revealed that most of the significantly altered proteins between Tg-ctrl versus WT-ctrl mice hippocampus (Table 2) were involved in AD, oxidative phosphorylation, glutamatergic, cholinergic, and serotonergic synapse pathways. In mPFC (Table 2), the altered proteins between Tg-ctrl versus WT-ctrl participated in metabolic pathways, Parkinson’s disease, ribosome, AD, and biosynthesis of amino acids. Meanwhile, in the striatum (Table 2), the altered proteins between Tg-ctrl versus WT-ctrl groups were engaged in metabolic pathways, AD, oxidative phosphorylation, Parkinson’s disease, and Huntington’s disease.
Table 2
Kyoto Encyclopedia of Genes and Genomes (KEGG) pathway enrichment for the differentially expressed proteins from AβPP/PS1 transgenic mice control (Tg-ctrl) compared with wild type mice (WT-ctrl) using KOBAS. The pathways are arranged according to the number of differentially expressed proteins in each pathway. Only the top five enriched pathways (p < 0.05) are listed. ↓ represents significantly downregulated (p < 0.05) protein. ↑ represents significantly upregulated (p < 0.05) protein
| Pathway | Proteins number | p | Corrected p | Accession number | Protein names | Gene names | Proteins expression |
| Hippocampus | |||||||
| Alzheimer’s disease | 3 | 0.0073 | 0.2502 | P12023 | Amyloid beta A4 protein | APP | ↑ |
| Q63810 | Calcineurin subunit B type 1 | PPP3R1 | ↑ | ||||
| Q9D0M3 | Cytochrome c1 | CYC1 | ↓ | ||||
| Glutamatergic synapse | 3 | 0.003 | 0.2064 | Q63810 | Calcineurin subunit B type 1 | PPP3R1 | ↑ |
| Q99MK8 | Beta-adrenergic receptor kinase 1 | ADRBK1 | ↑ | ||||
| Q61011 | Guanine nucleotide-binding protein G(I)/G(S)/G(T) subunit beta-3 | GNB3 | ↓ | ||||
| Oxidative phosphorylation | 2 | 0.035 | 0.3776 | Q9D819 | Inorganic pyrophosphatase | PPA1 | ↓ |
| Q9D0M3 | Cytochrome c1 | CYC1 | ↓ | ||||
| Cholinergic synapse | 2 | 0.0317 | 0.3776 | P21278 | Guanine nucleotide-binding protein subunit alpha-11 | GNA11 | ↓ |
| Q61011 | Guanine nucleotide-binding protein G(I)/G(S)/G(T) subunit beta-3 | GNB3 | ↓ | ||||
| Serotonergic synapse | 2 | 0.0413 | 0.3776 | P12023 | Amyloid beta A4 protein | APP | ↑ |
| Q61011 | Guanine nucleotide-binding protein G(I)/G(S)/G(T) subunit beta-3 | GNB3 | ↓ | ||||
| Medial prefrontal cortex | |||||||
| Metabolic pathways | 11 | 0.0284 | 0.2045 | P56382 | ATP synthase subunit epsilon | ATP5E | ↑ |
| P12787 | Cytochrome c oxidase subunit 5A | COX5A | ↑ | ||||
| P48758 | Carbonyl reductase [NADPH] 1 | CBR1 | ↓ | ||||
| Q922Q4 | Pyrroline-5-carboxylate reductase 2 | PYCR2 | ↓ | ||||
| Q99LB2 | Dehydrogenase/reductase SDR family member 4 | DHRS4 | ↓ | ||||
| Q91VR2 | ATP synthase subunit gamma | ATP5C1 | ↓ | ||||
| O70250 | Phosphoglycerate mutase 2 | PGAM2 | ↓ | ||||
| Q91XF0 | Pyridoxine-5-phosphate oxidase | PNPO | ↓ | ||||
| Q80XN0 | D-beta-hydroxybutyrate dehydrogenase | BDH1 | ↓ | ||||
| Q99LS3 | Phosphoserine phosphatase | PSPH | ↓ | ||||
| Q9DCC4 | Pyrroline-5-carboxylate reductase 3 | PYCRL | ↓ | ||||
| Parkinson’s disease | 5 | 0.0005 | 0.0164 | Q8CGK7 | Guanine nucleotide-binding protein G(olf) subunit alpha | GNAL | ↑ |
| P56382 | ATP synthase subunit epsilon | ATP5E | ↑ | ||||
| P12787 | Cytochrome c oxidase subunit 5A | COX5A | ↑ | ||||
| Q60930 | Voltage-dependent anion-selective channel protein 2 | VDAC2 | ↓ | ||||
| Q91VR2 | ATP synthase subunit gamma | ATP5C1 | ↓ | ||||
| Ribosome | 5 | 0.0007 | 0.0164 | Q9D1P0 | 39S ribosomal protein L13 | MRPL13 | ↑ |
| P62908 | 40S ribosomal protein S3 | RPS3 | ↓ | ||||
| P62754 | 40S ribosomal protein S6 | RPS6 | ↓ | ||||
| P12970 | 60S ribosomal protein L7a | RPL7A | ↓ | ||||
| P84099 | 60S ribosomal protein L19 | RPL19 | ↓ | ||||
| Alzheimer’s disease | 4 | 0.009 | 0.1298 | P56382 | ATP synthase subunit epsilon | ATP5E | ↑ |
| P12787 | Cytochrome c oxidase subunit 5A | COX5A | ↑ | ||||
| Q91VR2 | ATP synthase subunit gamma | ATP5C1 | ↓ | ||||
| P49615 | Cyclin-dependent-like kinase 5 | CDK5 | ↓ | ||||
| Biosynthesis of amino acids | 4 | 0.0005 | 0.0164 | O70250 | Phosphoglycerate mutase 2 | PGAM2 | ↓ |
| Q922Q4 | Pyrroline-5-carboxylate reductase 2 | PYCR2 | ↓ | ||||
| Q99LS3 | Phosphoserine phosphatase | PSPH | ↓ | ||||
| Q9DCC4 | Pyrroline-5-carboxylate reductase 3 | PYCRL | ↓ | ||||
| Striatum | |||||||
| Metabolic pathways | 5 | 0.0004 | 0.0067 | P12787 | Cytochrome c oxidase subunit 5A | COX5A | ↑ |
| P99028 | Cytochrome b-c1 complex subunit 6 | UQCRH | ↑ | ||||
| Q91XF0 | Pyridoxine-5-phosphate oxidase | PNPO | ↑ | ||||
| P10518 | Delta-aminolevulinic acid dehydratase | ALAD | ↑ | ||||
| Q9D020 | Cytosolic 5-nucleotidase 3A | NT5C3A | ↓ | ||||
| Alzheimer’s disease | 2 | 0.0044 | 0.0122 | P12787 | Cytochrome c oxidase subunit 5A | COX5A | ↑ |
| P99028 | Cytochrome b-c1 complex subunit 6 | UQCRH | ↑ | ||||
| Oxidative phosphorylation | 2 | 0.0025 | 0.0121 | P12787 | Cytochrome c oxidase subunit 5A | COX5A | ↑ |
| P99028 | Cytochrome b-c1 complex subunit 6 | UQCRH | ↑ | ||||
| Parkinson’s disease | 2 | 0.0028 | 0.0121 | P12787 | Cytochrome c oxidase subunit 5A | COX5A | ↑ |
| P99028 | Cytochrome b-c1 complex subunit 6 | UQCRH | ↑ | ||||
| Huntington’s disease | 2 | 0.005 | 0.0122 | P12787 | Cytochrome c oxidase subunit 5A | COX5A | ↑ |
| P99028 | Cytochrome b-c1 complex subunit 6 | UQCRH | ↑ |
Pathway analysis of the altered proteins between Tg-TRF versus Tg-PO mice hippocampus (Table 3) showed that TRF modulated proteins were involved in metabolic pathways, Huntington’s disease, AD, oxidative phosphorylation, and Parkinson’s disease. In the mPFC (Table 3), the altered proteins between Tg-TRF and Tg-PO were engaged in metabolic pathways, biosynthesis of amino acids, carbon metabolism, AD, and arginine and proline metabolism. Most of the significantly altered proteins between Tg-TRF and Tg-PO in the striatum (Table 3) participated in glycerolipid metabolism, glycolysis/gluconeogenesis, proteasome, valine, leucine and isoleucine degradation, and pentose and glucuronate interconversions.
Table 3
Kyoto Encyclopedia of Genes and Genomes (KEGG) pathway enrichment for the differentially expressed proteins from AβPP/PS1 transgenic mice treated with tocotrienol-rich fraction (Tg-TRF) compared with the vehicle control group, AβPP/PS1 transgenic mice treated with palm oil stripped of vitamin E (Tg-PO) using KOBAS. The pathways are arranged according to the number of differentially expressed proteins in each pathway. Only the top five enriched pathways (p < 0.05) are listed. ↓ represents significantly downregulated (p < 0.05) protein. ↑ represents significantly upregulated (p < 0.05) protein
| Pathway | Proteins number | p | Corrected p | Accession number | Protein names | Gene names | Proteins expression |
| Hippocampus | |||||||
| Metabolic pathways | 25 | 0.0004 | 0.0099 | P05064 | Fructose-bisphosphate aldolase | ALDOA | ↓ |
| P03911 | NADH-ubiquinone oxidoreductase chain 4 | MTND4 | ↓ | ||||
| Q9Z0J4 | Nitric oxide synthase, brain | NOS1 | ↓ | ||||
| Q91YT0 | NADH dehydrogenase [ubiquinone] flavoprotein 1 | NDUFV1 | ↑ | ||||
| Q8CGC7 | Bifunctional glutamate/proline—tRNA ligase | EPRS | ↓ | ||||
| Q80UP3 | Diacylglycerol kinase zeta | DGKZ | ↓ | ||||
| P62814 | V-type proton ATPase subunit B, brain isoform | ATP6V1B2 | ↑ | ||||
| Q61753 | D-3-phosphoglycerate dehydrogenase | PHGDH | ↑ | ||||
| Q9Z1B3 | 1-phosphatidylinositol 4,5-bisphosphate phosphodiesterase beta-1 | PLCB1 | ↓ | ||||
| Q9CZS1 | Aldehyde dehydrogenase X | ALDH1B1 | ↑ | ||||
| Q91WD5 | NADH dehydrogenase [ubiquinone] iron-sulfur protein 2 | NDUFS2 | ↑ | ||||
| Q7TMF3 | NADH dehydrogenase [ubiquinone] 1 alpha subcomplex subunit 12 | NDUFA12 | ↑ | ||||
| Q91YQ5 | Dolichyl-diphosphooligosaccharide—protein glycosyltransferase subunit 1 | RPN1 | ↓ | ||||
| P00397 | Cytochrome c oxidase subunit 1 | MTCO1 | ↓ | ||||
| Q5SUR0 | Phosphoribosylformylglycinamidine synthase | PFAS | ↓ | ||||
| Q91V92 | ATP-citrate synthase | ACLY | ↓ | ||||
| Q920P5 | Adenylate kinase isoenzyme 5 | AK5 | ↑ | ||||
| P56480 | ATP synthase subunit beta | ATP5B | ↑ | ||||
| Q9CQ60 | 6-phosphogluconolactonase | PGLS | ↑ | ||||
| Q9DCS9 | NADH dehydrogenase [ubiquinone] 1 beta subcomplex subunit 10 | NDUFB10 | ↑ | ||||
| Q924M7 | Mannose-6-phosphate isomerase | MPI | ↑ | ||||
| P24549 | Retinal dehydrogenase 1 | ALDH1A1 | ↑ | ||||
| P61922 | 4-aminobutyrate aminotransferase | ABAT | ↑ | ||||
| P26443 | Glutamate dehydrogenase 1 | GLUD1 | ↑ | ||||
| Q4KWH5 | 1-phosphatidylinositol 4,5-bisphosphate phosphodiesterase eta-2 | PLCH2 | ↓ | ||||
| Huntington’s disease | 12 | 3.99E-07 | 6.26E-05 | P00397 | Cytochrome c oxidase subunit 1 | MTCO1 | ↓ |
| Q9DCS9 | NADH dehydrogenase [ubiquinone] 1 beta subcomplex subunit 10 | NDUFB10 | ↑ | ||||
| Q9Z1B3 | 1-phosphatidylinositol 4,5-bisphosphate phosphodiesterase beta-1 | PLCB1 | ↓ | ||||
| Q91WD5 | NADH dehydrogenase [ubiquinone] iron-sulfur protein 2 | NDUFS2 | ↑ | ||||
| Q91YT0 | NADH dehydrogenase [ubiquinone] flavoprotein 1 | NDUFV1 | ↑ | ||||
| P11352 | Glutathione peroxidase 1 | GPX1 | ↓ | ||||
| Q7TMF3 | NADH dehydrogenase [ubiquinone] 1 alpha subcomplex subunit 12 | NDUFA12 | ↑ | ||||
| Q62108 | Disks large homolog 4 | DLG4 | ↓ | ||||
| P56480 | ATP synthase subunit beta | ATP5B | ↑ | ||||
| Q3UVX5 | Metabotropic glutamate receptor 5 | GRM5 | ↓ | ||||
| O08788 | Dynactin subunit 1 | DCTN1 | ↓ | ||||
| Q60931 | Voltage-dependent anion-selective channel protein 3 | VDAC3 | ↑ | ||||
| Alzheimer’s disease | 9 | 5.88E-05 | 0.0023 | P12023 | Amyloid beta A4 protein | APP | ↓ |
| P00397 | Cytochrome c oxidase subunit 1 | MTCO1 | ↓ | ||||
| Q9DCS9 | NADH dehydrogenase [ubiquinone] 1 beta subcomplex subunit 10 | NDUFB10 | ↑ | ||||
| Q9Z0J4 | Nitric oxide synthase, brain | NOS1 | ↓ | ||||
| Q9Z1B3 | 1-phosphatidylinositol 4,5-bisphosphate phosphodiesterase beta-1 | PLCB1 | ↓ | ||||
| Q91WD5 | NADH dehydrogenase [ubiquinone] iron-sulfur protein 2 | NDUFS2 | ↑ | ||||
| Q91YT0 | NADH dehydrogenase [ubiquinone] flavoprotein 1 | NDUFV1 | ↑ | ||||
| Q7TMF3 | NADH dehydrogenase [ubiquinone] 1 alpha subcomplex subunit 12 | NDUFA12 | ↑ | ||||
| P56480 | ATP synthase subunit beta | ATP5B | ↑ | ||||
| Oxidative phosphorylation | 8 | 4.62E-05 | 0.0023 | P00397 | Cytochrome c oxidase subunit 1 | MTCO1 | ↓ |
| Q9DCS9 | NADH dehydrogenase [ubiquinone] 1 beta subcomplex subunit 10 | NDUFB10 | ↑ | ||||
| P03911 | NADH-ubiquinone oxidoreductase chain 4 | MTND4 | ↓ | ||||
| Q91WD5 | NADH dehydrogenase [ubiquinone] iron-sulfur protein 2 | NDUFS2 | ↑ | ||||
| Q91YT0 | NADH dehydrogenase [ubiquinone] flavoprotein 1 | NDUFV1 | ↑ | ||||
| Q7TMF3 | NADH dehydrogenase [ubiquinone] 1 alpha subcomplex subunit 12 | NDUFA12 | ↑ | ||||
| P56480 | ATP synthase subunit beta | ATP5B | ↑ | ||||
| P62814 | V-type proton ATPase subunit B, brain isoform | ATP6V1B2 | ↑ | ||||
| Parkinson’s disease | 8 | 7.53E-05 | 0.0024 | P00397 | Cytochrome c oxidase subunit 1 | MTCO1 | ↓ |
| Q9DCS9 | NADH dehydrogenase [ubiquinone] 1 beta subcomplex subunit 10 | NDUFB10 | ↑ | ||||
| P03911 | NADH-ubiquinone oxidoreductase chain 4 | MTND4 | ↓ | ||||
| Q60931 | Voltage-dependent anion-selective channel protein 3 | VDAC3 | ↑ | ||||
| Q91WD5 | NADH dehydrogenase [ubiquinone] iron-sulfur protein 2 | NDUFS2 | ↑ | ||||
| Q91YT0 | NADH dehydrogenase [ubiquinone] flavoprotein 1 | NDUFV1 | ↑ | ||||
| Q7TMF3 | NADH dehydrogenase [ubiquinone] 1 alpha subcomplex subunit 12 | NDUFA12 | ↑ | ||||
| P56480 | ATP synthase subunit beta | ATP5B | ↑ | ||||
| Medial prefrontal cortex | |||||||
| Metabolic pathways | 7 | 0.0018 | 0.0315 | P30275 | Creatine kinase U-type | CKMT1 | ↑ |
| Q9CQZ6 | NADH dehydrogenase [ubiquinone] 1 beta subcomplex subunit 3 | NDUFB3 | ↑ | ||||
| Q8K183 | Pyridoxal kinase | PDXK | ↑ | ||||
| P54071 | Isocitrate dehydrogenase [NADP] | IDH2 | ↑ | ||||
| P05202 | Aspartate aminotransferase | GOT2 | ↑ | ||||
| O35435 | Dihydroorotate dehydrogenase (quinone) | DHODH | ↓ | ||||
| P16858 | Glyceraldehyde-3-phosphate dehydrogenase | GAPDH | ↓ | ||||
| Biosynthesis of amino acids | 3 | 0.0002 | 0.0132 | P05202 | Aspartate aminotransferase | GOT2 | ↑ |
| P54071 | Isocitrate dehydrogenase [NADP] | IDH2 | ↑ | ||||
| P16858 | Glyceraldehyde-3-phosphate dehydrogenase | GAPDH | ↓ | ||||
| Carbon metabolism | 3 | 0.0006 | 0.0138 | P05202 | Aspartate aminotransferase | GOT2 | ↑ |
| P54071 | Isocitrate dehydrogenase [NADP] | IDH2 | ↑ | ||||
| P16858 | Glyceraldehyde-3-phosphate dehydrogenase | GAPDH | ↓ | ||||
| Alzheimer’s disease | 2 | 0.0271 | 0.1603 | Q9CQZ6 | NADH dehydrogenase [ubiquinone] 1 beta subcomplex subunit 3 | NDUFB3 | ↑ |
| P16858 | Glyceraldehyde-3-phosphate dehydrogenase | GAPDH | ↓ | ||||
| Arginine and proline metabolism | 2 | 0.0029 | 0.0407 | P05202 | Aspartate aminotransferase | GOT2 | ↑ |
| P30275 | Creatine kinase U-type | CKMT1 | ↑ | ||||
| Striatum | |||||||
| Glycerolipid metabolism | 2 | 0.0027 | 0.0275 | Q9JII6 | Alcohol dehydrogenase [NADP(+)] | AKR1A1 | ↑ |
| Q9CZS1 | Aldehyde dehydrogenase X | ALDH1B1 | ↑ | ||||
| Glycolysis/Gluconeogenesis | 2 | 0.0035 | 0.0290 | Q9JII6 | Alcohol dehydrogenase [NADP(+)] | AKR1A1 | ↑ |
| Q9CZS1 | Aldehyde dehydrogenase X | ALDH1B1 | ↑ | ||||
| Proteasome | 2 | 0.0016 | 0.0265 | Q9WVJ2 | 26S proteasome non-ATPase regulatory subunit 13 | PSMD13 | ↑ |
| O55234 | Proteasome subunit beta type-5 | PSMB5 | ↑ | ||||
| Valine, leucine and isoleucine degradation | 2 | 0.0019 | 0.0265 | Q9CZS1 | Aldehyde dehydrogenase X | ALDH1B1 | ↑ |
| P38060 | Hydroxymethylglutaryl-CoA lyase | HMGCL | ↑ | ||||
| Pentose and glucuronate interconversions | 2 | 0.0008 | 0.0265 | Q9JII6 | Alcohol dehydrogenase [NADP(+)] | AKR1A1 | ↑ |
| Q9CZS1 | Aldehyde dehydrogenase X | ALDH1B1 | ↑ |
DISCUSSION
The aim of the present study was to assess the effect of natural-source antioxidant treatment with tocotrienol-rich fraction (TRF) on the proteome profiles of AβPP/PS1 mice brains, by analyzing hippocampus, mPFC, and striatum. These regions were selected to represent areas of the brain known to be severely affected (hippocampus and mPFC) and moderately affected (striatum) in AD. According to the amyloid cascade hypothesis, abnormal aggregation of Aβ, including the formation of soluble oligomers and insoluble fibrils, leading to the formation of senile plaques, is an initial pathological alteration that leads to AD [31]. Previous studies have suggested that modulating Aβ aggregation and reducing brain Aβ aggregates would be beneficial as therapeutic targets against AD [32, 33]. However, amyloid burden and cognitive decline poorly correlate. There have been failures of recent clinical trials aimed at preventing cognitive decline by removing amyloid burden [34–36]. Proteomics studies still have a place for unravelling molecular mechanisms contributing to AD pathogenesis, and possibly finding new therapeutic strategies to combat the disease.
In this study, by comparing the proteome profiles of AβPP/PS1 mice (Tg-ctrl) with wild type (WT-ctrl) mice, we demonstrated alterations in levels of 43, 99, and 13 proteins in the AβPP/PS1 mice hippocampus, mPFC, and striatum, respectively (Table 1; Supplementary Table 3). Comparisons between the AβPP/PS1 mice that received TRF (Tg-TRF) with the vehicle control group that received palm oil stripped of vitamin E (Tg-PO) showed 203, 29, and 23 proteins were altered in the hippocampus, mPFC, and striatum, separately (Table 1; Supplementary Table 4). The altered proteins in both comparisons were visualized in a Venn diagram to identify the overlapping proteins between groups in each studied brain region. We found that only two proteins: amyloid beta A4 protein (APP) and receptor-type tyrosine-protein phosphatase alpha (PTPRA), overlapped between both comparisons and showed a higher expression in AβPP/PS1 mice hippocampus compared with the WT mice (Fig. 3). The current study used double transgenic mice APP/PS1dE9, which expressed a chimeric mouse/human AβPP isoform 695 (line C3-3) driven by the mouse prion promoter, with a Swedish mutation in the AβPP sequence, that leads to increased total Aβ generation [22, 37]. These mice also expressed human PSEN1 lacking of exon 9 (line S-9), which represented the AD-associated mutation with exon 9 deletion [38]. Therefore, it is expected to find an increased level of APP protein in the AβPP/PS1 mice hippocampus. Notably, the expression of these proteins was decreased in the AβPP/PS1 mice supplemented with TRF (Fig. 3). This finding concurred with our previous study which demonstrated that TRF modulated amyloid pathology by inhibiting Aβ fibril and oligomer formation in vitro, and also reduced Aβ deposition in AβPP/PS1 mice brain, particularly in the hippocampus and cortex [17]. Unfortunately, we cannot explain in detail how TRF was able to modulate this protein in the current untargeted proteomics analysis. Whether TRF is affecting APP levels, or APP metabolism to Aβ, or affecting steady-state levels of Aβ warrants further investigation. In our earlier study, we performed enzyme-linked immunosorbent assay (ELISA) and found that the levels of both Aβ40 and Aβ42 in hippocampus and cortex of AβPP/PS1 mice were not affected by TRF [17]. We also conducted metabolomics analysis to understand the possible molecular mechanisms underlying this process and found that TRF was able to exhibit its potential therapeutic effects by modulating several metabolic pathways such as bioenergetics, neurotransmission, membrane lipid metabolism, and oxidative stress defense [18].
Other than APP protein, PTPRA level was also increased (p < 0.05) in the AβPP/PS1 mice hippocampus, and decreased with TRF supplementation (Fig. 3). Several studies have reported the importance of PTPRA in learning and memory, and this protein has been considered as a key mediator of neuronal migration and synaptic plasticity [39, 40]. The potential therapeutic target of tyrosine-protein phosphatase in various diseases including neuroinflammatory diseases has been reported [41–43]. PTPRA plays a central role as an activator of Src family kinases [44]. Src family kinases are a group of genes that encode for nonreceptor protein kinases involved in cell growth regulation. c-Src, a product of Src family kinases is highly expressed in the brain [45]. However, overexpressed or highly activated c-Src causes uncontrolled cell proliferation, leading to various cancers in human [46, 47]. In addition, c-Src activation has also considered a key contributor to glutamate-induced neurodegeneration [48]. Thus, TRF may exert its neuroprotective effect by reducing the increased level of PTPRA in AβPP/PS1 mice hippocampus. Even though the exact mechanism is currently unclear, a previous study has demonstrated the neuroprotective mechanism of tocotrienol by suppressing glutamate-induced early activation of the c-Src kinase at nanomolar concentrations, thereby, preventing neuronal cell death [10]. Consistent with this, it was found in another study that tocotrienol inhibited the activation of c-Src and extracellular signal-regulated protein kinase (ERK) in the mitogen-activated protein kinase (MAPK) cell signaling pathway for neuronal death, resulting in improved cognitive impairment in aged rats [49].
Aβ may not be the only player driving the cognitive decline in AD. Microtubule associated protein tau (MAPT) has also been considered a contributor to the onset of AD, leading to neuropathological conditions such as selective neuronal death, synaptic loss, and deposition of abnormal proteins including Aβ plaques and neurofibrillary tangles. MAPT was identified in these mice brains in the present study, yet the expression of this protein was unchanged. The AβPP/PS1 mouse is a transgenic mouse model that only develops amyloid deposits. It is a model system and fails to meet all criteria of AD human neuropathology such as formation of phosphorylated tau enriched neurofibrillary tangles [50, 51]. In order to understand the effect of TRF on both amyloid and tau pathologies in the mouse brain, a further study is necessary by using different mouse models such as triple transgenic mouse (3×TgAD) which carries APP, PSEN, and MAPT mutations [52].
Neuroinflammation, an innate immunological response of the nervous system is also considered a hallmark of neurodegenerative diseases [53]. Microglia and astrocytes are the major types of glial cells and predominant mediators of inflammation within the central nervous system (CNS). The microglial function is regulated by apolipoprotein E (APOE) among other factors. APOE protein level was not significantly different in the AβPP/PS1 mice control compared to WT mice (Supplementary Table 1). Furthermore, microglial activation and the release of inflammatory mediators such as nitric oxide, chemokines, interleukins, and cytokines are also among the pathological mechanisms underlying the progression of neurodegenerative diseases [54, 55]. In this study, we found increased glial fibrillary acidic protein (GFAP) and decreased interleukin enhancer-binding protein 2 (ILF2) levels in the AβPP/PS1 mice hippocampus (Supplementary Table 3). TRF supplementation was, however, unable to modulate these proteins. This finding was in line with our previous study using an immunohistochemistry approach, which reported that AβPP/PS1 mice exhibited higher Iba1-immunoreactivity in the hippocampus and cortex compared with WT mice, but no difference was observed in the TRF treated group [17]. It seems that TRF supplementation on these mice has no effect on microglial activity.
Recently, proteome profiling in human AD brain has reported AD-related alterations in the expression of over 5,000 proteins across six different brain regions [56]. The study also highlighted four candidate genes, syntaxin binding protein 1 (STXBP1), collapsin response-mediator protein 1 (CRMP1), actin-related protein 10 homologue (ACTR10), and amphiphysin (AMPH), which might be key mediators of the protein expression response to AD [56]. STXBP1, CRMP1, and AMPH proteins were identified in all selected brain regions of mice used in our study, but were not significantly altered (Supplementary Tables 1 and 2). However, ACTR10 protein level was significantly decreased in the AβPP/PS1 mice hippocampus treated with TRF compared with Tg-PO group, which may be a positive effect (Supplementary Table 4). ACTR10 plays a central role in the prion propagation and clearance process, thereby, affecting prion susceptibility [57]. This protein has also been identified in the aging mouse hippocampus [58] and AD human brain [56].
Genome-wide association studies (GWAS) have reported a number of genes related to AD, including clusterin (CLU), ephrin type-A receptor 1 (EPHA1), phosphatidylinositol-binding clathrin assembly protein (PICALM), myc box-dependent-interacting protein 1 (BIN1), ATP binding cassette subfamily A member 7 (ABCA7), membrane-spanning 4-domains subfamily A (MS4A), complement receptor type 1 (CR1), myeloid cell surface antigen CD33 (CD33), and CD2-associated protein (CD2AP) [59–61]. We identified three proteins with these gene names from our analysis (CLU, PICALM, and BIN1), but these proteins were not significantly altered in any of the mice groups. We found decreased expression of ephrin type-A receptor 4 (EPHA4) in Tg-TRF group, which could be neuroprotective. This is supported by a previous study which demonstrated EPHA4 as a mediator for synaptic plasticity impairment induced by Aβ, and the blockade of EPHA4 activity through targeting its ligand-binding domain reversed the synaptic deficits in AβPP/PS1 mice [62].
Aβ accumulation is considered a key early event in AD pathophysiology. However, several pathophysiological events may occur earlier than Aβ peptides in AD pathogenesis, including alterations in oxidative stress, nitrosative stress, metabolism, mitochondria, and inflammation [63–67]. Thus, supplementation with a natural antioxidant (i.e., vitamin E) could be essential to protect the brain against these events. Vitamin E plays a central role in scavenging peroxyl radical, preventing lipid peroxidation, and protecting polyunsaturated fatty acids (PUFAs) and other cell membranes components and lipoproteins from oxidation by free radicals [68]. Tocotrienols in particular have been shown previously to exert antioxidative effect in in vitro and in vivo studies [69–71]. For instance, up to 100μmol/L of γ-tocotrienol concentration protected against hydrogen peroxide (H2O2)-induced cell death and apoptosis in primary astrocyte cultures [69]. In addition, α-tocotrienol has been shown to protect neuronal cell from glutamate-induced toxicity primarily by a direct antioxidant action [70]. In an in vivo study, three months supplementation of TRF (200 mg/kg) has been reported to markedly reduce lipid peroxidation, modulate antioxidant enzymes activity and brain arginine metabolism, and also improve memory in aged rats [19, 71]. Tocotrienols supplementation has also been reported to improve lipid profiles in chronic hemodialysis patients [72]. In line with the previous findings, we also observed possible antioxidative mechanism of TRF in AβPP/PS1 mice brain, particularly hippocampus. The present study demonstrated decreased (p < 0.05) expression of proteins involved in oxidative phosphorylation such as inorganic pyrophosphatase (PPA1) and cytochrome c1 (CYC1) in the AβPP/PS1 mice hippocampus (Table 2). In contrast, six proteins involved in this pathway (Table 3) were increased (p < 0.05) with TRF supplementation in these mice hippocampus: NADH dehydrogenase [ubiquinone] 1 beta subcomplex subunit 10 (NDUFB10), NADH dehydrogenase [ubiquinone] iron-sulfur protein 2 (NDUFS2), NADH dehydrogenase [ubiquinone] flavoprotein 1 (NDUFV1), NADH dehydrogenase [ubiquinone] 1 alpha subcomplex subunit 12 (NDUFA12), ATP synthase subunit beta (ATP5B), and V-type proton ATPase subunit B, brain isoform (ATP6V1B2). Oxidative stress and mitochondrial dysfunction have been recognized as among the most prominent features implicated in AD pathophysiology [73]. Previous studies have shown a correlation between the decreased expression of nuclear or mitochondrial genes in the neocortex of AD patients with progressive reductions in brain glucose metabolism [74, 75]. Deregulation of oxidative phosphorylation proteins was also observed in a triple transgenic mouse of AD [76]. Thus, the modulations of proteins expression involved in this pathway may be due to an antioxidative mechanism of TRF reducing oxidative stress in the AβPP/PS1 mice brain.
Overall, the present study provides insights into understanding the proteome changes in the hippocampus, mPFC, and striatum of AβPP/PS1 transgenic mice supplemented with TRF. Our proteomics analysis using liquid chromatography coupled to Q Exactive HF Orbitrap mass spectrometry demonstrated that the modulation of proteome profile by TRF could be due to its effect on Aβ, or independent of this, as illustrated in Fig. 4. For instance, the decreased level of APP in the AβPP/PS1 mice receiving TRF may be key to the reduced Aβ deposits and improved cognitive function [17]. In addition, the reduced level of PTPRA is possibly involved in the decreased activation of c-Src kinase, preventing glutamate-induced neurodegeneration and also contributes to the improved memory in the AβPP/PS1 mice. The mechanism of TRF in improving cognitive function may also possibly occur by modulating other proteins in metabolic pathways, AD, and oxidative phosphorylation. Altered metabolic pathways related to bioenergetics, neurotransmission, membrane lipid metabolism, and oxidative stress defense as reported in our previous metabolomics analysis may also lead to the improved memory in AβPP/PS1 mice [18] (Fig. 4).
Fig.4
Proposed mechanisms of TRF action in improving cognitive function in AβPP/PS1 mice. Aβ deposits, altered metabolites, and proteins expression cause neuronal dysfunction leading to cognitive impairment. A) TRF reduces Aβ deposition and improves cognitive function (black arrow) [17]. B) TRF modulates metabolic pathways, reducing neuronal dysfunction, and improves cognitive function (blue arrow) [18]. C) TRF modulates amyloid beta A4 protein (APP) leading to reduced Aβ deposits and improved cognitive function. TRF also modulates receptor-type tyrosine-protein phosphatase alpha (PTPRA), reducing neuronal dysfunction, and improves memory. TRF may also improve memory by modulating other proteins involved in metabolic pathways, Alzheimer’s disease pathway, and oxidative phosphorylation (purple arrow). Figure modified from Durani et al. [18].
![Proposed mechanisms of TRF action in improving cognitive function in AβPP/PS1 mice. Aβ deposits, altered metabolites, and proteins expression cause neuronal dysfunction leading to cognitive impairment. A) TRF reduces Aβ deposition and improves cognitive function (black arrow) [17]. B) TRF modulates metabolic pathways, reducing neuronal dysfunction, and improves cognitive function (blue arrow) [18]. C) TRF modulates amyloid beta A4 protein (APP) leading to reduced Aβ deposits and improved cognitive function. TRF also modulates receptor-type tyrosine-protein phosphatase alpha (PTPRA), reducing neuronal dysfunction, and improves memory. TRF may also improve memory by modulating other proteins involved in metabolic pathways, Alzheimer’s disease pathway, and oxidative phosphorylation (purple arrow). Figure modified from Durani et al. [18].](https://content.iospress.com:443/media/jad/2019/72-1/jad-72-1-jad181171/jad-72-jad181171-g004.jpg)
Even though our proposed mechanism of TRF as illustrated in Fig. 4 is speculative at this moment, hopefully it can at least provide a general overview to understand the possible molecular mechanisms of TRF in ameliorating the cognitive deficits in AβPP/PS1 mice. In future, further studies such as multi-omics integration approach or targeted proteomics and metabolomics can be implemented to understand the relationship between metabolites and proteins changes, and the exact molecular mechanisms for TRF to slow down AD progression. In addition, a study using AβPP/PS1 mice may open avenues to understand the mechanism of TRF in modulating amyloid pathology, but it is important to note that this animal model does not represent overall AD pathogenesis. Thus, the use of other transgenic mouse models such as triple transgenic mouse which carries APP, PSEN, and MAPT mutations, or 5×FAD mouse may be useful to confirm and enhance our understanding of AD pathogenesis.
In summary, TRF potentially exerts its neuroprotective effects in AβPP/PS1 mice brain by modulating proteins involved in various biochemical pathways including metabolic pathways, AD, and oxidative phosphorylation. Our current findings demonstrated that TRF supplementation altered proteins in the AβPP/PS1 mice brain in a region-specific manner. TRF also modulated APP and PTPRA protein expression in AβPP/PS1 mice hippocampus. However, whether the improved cognitive performance upon TRF treatment is associated with the changes in APP and PTPRA levels warrants further investigation.
ACKNOWLEDGMENTS
This work was supported by the Japan Society for Promotion of Science (grant numbers JSPS KAKENHI 17H03560 to I.T. and 17K01355 to D.Y.) and the Ministry of Education Malaysia (grant number LRGS/BU/2012/UKM-UKM/K/04). The authors thank Dr. Douglas Walker for helpful comments and English corrections of the manuscript. We also thank Dr. Benjamin Lau from Malaysian Palm Oil Board (MPOB) for his constructive feedback on the mass spectrometry settings.
Authors’ disclosures available online (https://www.j-alz.com/manuscript-disclosures/18-1171r2).
SUPPLEMENTARY MATERIAL
[1] The supplementary material is available in the electronic version of this article: http://dx.doi.org/10.3233/JAD-181171.
REFERENCES
[1] | Selkoe DJ , Schenk D ((2003) ) Alzheimer’s disease: Molecular understanding predicts amyloid-based therapeutics. Annu Rev Pharmacol Toxicol 43: , 545–584. |
[2] | Chami L , Checler F ((2012) ) BACE1 is at the crossroad of a toxic vicious cycle involving cellular stress and β-amyloid production in Alzheimer’s disease. Mol Neurodegener 7: , 52. |
[3] | Povova J , Ambroz P , Bar M , Pavukova V , Sery O , Tomaskova H , Janout V ((2012) ) Epidemiological of and risk factors for Alzheimer’s disease: A review. Biomed Pap Med Fac Univ Palacky Olomouc Czech Repub 156: , 108–114. |
[4] | Cacace R , Sleegers K , Van Broeckhoven C ((2016) ) Molecular genetics of early-onset Alzheimer’s disease revisited. Alzheimers Dement 12: , 733–748. |
[5] | Lin MT , Beal MF ((2006) ) Mitochondrial dysfunction and oxidative stress in neurodegenerative diseases. Nature 443: , 787–795. |
[6] | Dysken MW , Sano M , Asthana S , Vertrees JE , Pallaki M , Llorente M , Love S , Schellenberg GD , McCarten JR , Malphurs J , Prieto S , Chen P , Loreck DJ , Trapp G , Bakshi RS , Mintzer JE , Heidebrink JL , Vidal-Cardona A , Arroyo LM , Cruz AR , Zachariah S , Kowall NW , Chopra MP , Craft S , Thielke S , Turvey CL , Woodman C , Monnell KA , Gordon K , Tomaska J , Segal Y , Peduzzi PN , Guarino PD ((2014) ) Effect of vitamin E and memantine on functional decline in Alzheimer disease: The TEAM-AD VA cooperative randomized trial. JAMA 311: , 33–44. |
[7] | Morris MC , Evans DA , Tangney CC , Bienias JL , Wilson RS , Aggarwal NT , Scherr PA ((2005) ) Relation of the tocopherol forms to incident Alzheimer disease and to cognitive change. Am J Clin Nutr 81: , 508–514. |
[8] | Morris MC , Evans DA , Bienias JL , Tangney CC , Wilson RS ((2002) ) Vitamin E and cognitive decline in older persons. Arch Neurol 59: , 1125–1132. |
[9] | Petersen RC , Thomas RG , Grundman M , Bennett D , Doody R , Ferris S , Galasko D , Jin S , Kaye J , Levey A , Pfeiffer E , Sano M , van Dyck CH , Thal LJ ((2005) ) Vitamin E and donepezil for the treatment of mild cognitive impairment. N Engl J Med 352: , 2379–2388. |
[10] | Sen CK , Khanna S , Roy S , Packer L ((2000) ) Molecular basis of vitamin E action. Tocotrienol potently inhibits glutamate-induced pp60(c-Src) kinase activation and death of HT4 neuronal cells. J Biol Chem 275: , 13049–13055. |
[11] | Kamal-Eldin A , Appelqvist LA ((1996) ) The chemistry and antioxidant properties of tocopherols and tocotrienols. Lipids 31: , 671–701. |
[12] | Aggarwal BB , Sundaram C , Prasad S , Kannappan R ((2010) ) Tocotrienols, the vitamin E of the 21st century: Its potential against cancer and other chronic diseases. Biochem Pharmacol 80: , 1613–1631. |
[13] | Suzuki YJ , Tsuchiya M , Wassall SR , Choo YM , Govil G , Kagan VE , Packer L ((1993) ) Structural and dynamic membrane properties of alpha-tocopherol and alpha-tocotrienol: Implication to the molecular mechanism of their antioxidant potency. Biochemistry 32: , 10692–10699. |
[14] | Mangialasche F , Kivipelto M , Mecocci P , Rizzuto D , Palmer K , Winblad B , Fratiglioni L ((2010) ) High plasma levels of vitamin E forms and reduced Alzheimer’s disease risk in advanced age. J Alzheimers Dis 20: , 1029–1037. |
[15] | Sundram K , Sambanthamurthi R , Tan YA ((2003) ) Palm fruit chemistry and nutrition. Asia Pac J Clin Nutr 12: , 355–362. |
[16] | Sen CK , Rink C , Khanna S ((2010) ) Palm oil–derived natural vitamin E α-tocotrienol in brain health and disease. J Am Coll Nutr 29: , 314S–323S. |
[17] | Ibrahim NF , Yanagisawa D , Durani LW , Hamezah HS , Damanhuri HA , Wan Ngah WZ , Tsuji M , Kiuchi Y , Ono K , Tooyama I ((2017) ) Tocotrienol-rich fraction modulates amyloid pathology and improves cognitive function in AβPP/PS1 mice. J Alzheimers Dis 55: , 597–612. |
[18] | Durani LW , Hamezah HS , Ibrahim NF , Yanagisawa D , Nasaruddin ML , Mori M , Azizan KA , Damanhuri HA , Makpol S , Wan Ngah WZ , Tooyama I ((2018) ) Tocotrienol-rich fraction of palm oil improves behavioral impairments and regulates metabolic pathways in AβPP/PS1 mice. J Alzheimers Dis 64: , 249–267. |
[19] | Mazlan M , Hamezah HS , Taridi NM , Jing Y , Liu P , Zhang H , Wan Ngah WZ , Damanhuri HA ((2017) ) Effects of aging and tocotrienol-rich fraction supplementation on brain arginine metabolism in rats. Oxid Med Cell Longev 2017: , 6019796. |
[20] | Khor SC , Wan Ngah WZ , Mohd Yusof YA , Abdul Karim N , Makpol S ((2017) ) Tocotrienol-rich fraction ameliorates antioxidant defense mechanisms and improves replicative senescence-associated oxidative stress in human myoblasts. Oxid Med Cell Longev 2017: , 3868305. |
[21] | Rahman AA , Makpol S , Jamal R , Harun R , Mokhtar N , Ngah WZW ((2014) ) Tocotrienol-rich fraction, [6]-gingerol and epigallocatechin gallate inhibit proliferation and induce apoptosis of glioma cancer cells. Molecules 19: , 14528–14541. |
[22] | Borchelt DR , Ratovitski T , Lare J Van , Lee MK , Gonzales V , Jenkins NA , Copeland NG , Price DL , Sisodia SS ((1997) ) Accelerated amyloid deposition in the brains of transgenic mice coexpressing mutant presenilin 1 and amyloid precursor proteins. Neuron 19: , 939–945. |
[23] | Hamezah HS , Durani LW , Yanagisawa D , Ibrahim NF , Aizat WM , Bellier JP , Makpol S , Ngah WZW , Damanhuri HA , Tooyama I ((2018) ) Proteome profiling in the hippocampus, medial prefrontal cortex, and striatum of aging rat. Exp Gerontol 111: , 53–64. |
[24] | Iovinella I , Caputo B , Michelucci E , Dani FR , della Torre A ((2015) ) Candidate biomarkers for mosquito age-grading identified by label-free quantitative analysis of protein expression in Aedes albopictus females. J Proteomics 128: , 272–279. |
[25] | Tyanova S , Temu T , Cox J ((2016) ) The MaxQuant computational platform for mass spectrometry-based shotgun proteomics. Nat Protoc 11: , 2301–2319. |
[26] | Vizcaíno JA , Côté RG , Csordas A , Dianes JA , Fabregat A , Foster JM , Griss J , Alpi E , Birim M , Contell J , O’Kelly G , Schoenegger A , Ovelleiro D , Pérez-Riverol Y , Reisinger F , Ríos D , Wang R , Hermjakob H ((2013) ) The Proteomics Identifications (PRIDE) database and associated tools: Status in 2013. Nucleic Acids Res 41: , 1063–1069. |
[27] | Tyanova S , Temu T , Sinitcyn P , Carlson A , Hein MY , Geiger T , Mann M , Cox J ((2016) ) The Perseus computational platform for comprehensive analysis of (prote)omics data. Nat Methods 13: , 731–740. |
[28] | Oliveros JC ((2007) ) VENNY. An interactive tool for comparing lists with Venn diagrams. BioinfoGP, CNB-CSIC. |
[29] | Wu J , Mao X , Cai T , Luo J , Wei L ((2006) ) KOBAS server: A web-based platform for automated annotation and pathway identification. Nucleic Acids Res 34: , W720–724. |
[30] | Xie C , Mao X , Huang J , Ding Y , Wu J , Dong S , Kong L , Gao G , Li C-Y , Wei L ((2011) ) KOBAS 2.0: A web server for annotation and identification of enriched pathways and diseases. Nucleic Acids Res 39: , 316–322. |
[31] | Hardy J , Selkoe DJ ((2002) ) The amyloid hypothesis of Alzheimer’s disease: Progress and problems on the road to therapeutics. Science 297: , 353–356. |
[32] | Citron M ((2010) ) Alzheimer’s disease: Strategies for disease modification. Nat Rev Drug Discov 9: , 387–398. |
[33] | Haass C , Selkoe DJ ((2007) ) Soluble protein oligomers in neurodegeneration: Lessons from the Alzheimer’s amyloid beta-peptide. Nat Rev Mol Cell Biol 8: , 101–112. |
[34] | Selkoe DJ , Hardy J ((2016) ) The amyloid hypothesis of Alzheimer’s disease at 25 years. EMBO Mol Med 8: , 595–608. |
[35] | Becker RE , Greig NH ((2008) ) Alzheimer’s disease drug development in 2008 and beyond: Problems and opportunities. Curr Alzheimer Res 5: , 346–357. |
[36] | Giacobini E , Becker RE ((2007) ) One hundred years after the discovery of Alzheimer’s disease. A turning point for therapy? J Alzheimers Dis 12: , 37–52. |
[37] | Savonenko AV , Xu GM , Price DL , Borchelt DR , Markowska AL ((2003) ) Normal cognitive behavior in two distinct congenic lines of transgenic mice hyperexpressing mutant APP SWE. Neurobiol Dis 12: , 194–211. |
[38] | Lee MK , Borchelt DR , Kim G , Thinakaran G , Slunt HH , Ratovitski T , Martin LJ , Kittur A , Gandy S , Levey AI , Jenkins N , Copeland N , Price DL , Sisodia SS ((1997) ) Hyperaccumulation of FAD-linked presenilin 1 variants in vivo. Nat Med 3: , 756–760. |
[39] | Petrone A , Battaglia F , Wang C , Dusa A , Su J , Zagzag D , Bianchi R , Casaccia-Bonnefil P , Arancio O , Sap J ((2003) ) Receptor protein tyrosine phosphatase alpha is essential for hippocampal neuronal migration and long-term potentiation. EMBO J 22: , 4121–4131. |
[40] | Lei G , Xue S , Che Á , Liu Q , Xu J , Kwan CL , Fu Y , Lu Y , Liu M , Harder KW , Yu X ((2002) ) Gain control of N-methyl-D-aspartate receptor activity by receptor-like protein tyrosine phosphatase alpha. EMBO J 21: , 2977–2989. |
[41] | Verma S , Sharma S ((2018) ) Protein tyrosine phosphatase as potential therapeutic target in various disorders. Curr Mol Pharmacol 11: , 191–202. |
[42] | Song GJ , Jung M , Kim J-H , Park H , Rahman MH , Zhang S , Zhang Z-Y , Park DH , Kook H , Lee I-K , Suk K ((2016) ) A novel role for protein tyrosine phosphatase 1B as a positive regulator of neuroinflammation. J Neuroinflammation 13: , 86. |
[43] | He R , Yu Z , Zhang R , Zhang Z ((2014) ) Protein tyrosine phosphatases as potential therapeutic targets. Acta Pharmacol Sin 35: , 1227–1246. |
[44] | Pallen CJ ((2003) ) Protein tyrosine phosphatase alpha (PTPalpha): A Src family kinase activator and mediator of multiple biological effects. Curr Top Med Chem 3: , 821–835. |
[45] | Soriano P , Montgomery C , Geske R , Bradley A ((1991) ) Targeted disruption of the c-src proto-oncogene leads to osteopetrosis in mice. Cell 64: , 693–702. |
[46] | Sen B , Johnson FM ((2011) ) Regulation of Src family kinases in human cancers. J Signal Transduct 2011: , 865819. |
[47] | Ishizawar R , Parsons SJ ((2004) ) c-Src and cooperating partners in human cancer. Cancer Cell 6: , 209–214. |
[48] | Khanna S , Roy S , Park H-A , Sen CK ((2007) ) Regulation of c-Src activity in glutamate-induced neurodegeneration. J Biol Chem 282: , 23482–23490. |
[49] | Kaneai N , Sumitani K , Fukui K , Koike T , Takatsu H , Urano S ((2016) ) Tocotrienol improves learning and memory deficit of aged rats. J Clin Biochem Nutr 58: , 114–121. |
[50] | Jankowsky JL , Zheng H ((2017) ) Practical considerations for choosing a mouse model of Alzheimer’s disease. Mol Neurodegener 12: , 89. |
[51] | Duyckaerts C , Potier M-C , Delatour B ((2008) ) Alzheimer disease models and human neuropathology: Similarities and differences. Acta Neuropathol 115: , 5–38. |
[52] | Oddo S , Caccamo A , Shepherd JD , Murphy MP , Golde TE , Kayed R , Metherate R , Mattson MP , Akbari Y , LaFerla FM ((2003) ) Triple-transgenic model of Alzheimer’s disease with plaques and tangles: Intracellular Abeta and synaptic dysfunction. Neuron 39: , 409–421. |
[53] | Heneka MT , Carson MJ , Khoury J El , Gary E , Brosseron F , Feinstein DL , Jacobs AH , Wyss-coray T , Vitorica J , Ransohoff RM ((2018) ) Neuroinflammation in Alzheimer’s disease. Lancet Neurol 14: , 388–405. |
[54] | Frank-Cannon TC , Alto LT , McAlpine FE , Tansey MG ((2009) ) Does neuroinflammation fan the flame in neurodegenerative diseases? Mol Neurodegener 4: , 47. |
[55] | Morales I , Guzmán-Martínez L , Cerda-Troncoso C , Farías GA , Maccioni RB ((2014) ) Neuroinflammation in the pathogenesis of Alzheimer’s disease. A rational framework for the search of novel therapeutic approaches. Front Cell Neurosci 8: , 112. |
[56] | Xu J , Patassini S , Rustogi N , Riba-Garcia I , Hale BD , Phillips AM , Waldvogel H , Haines R , Bradbury P , Stevens A , Faull RLM , Dowsey AW , Cooper GJS , Unwin RD ((2019) ) Regional protein expression in human Alzheimer’s brain correlates with disease severity. Commun Biol 2: , 43. |
[57] | Brown CA , Schmidt C , Poulter M , Hummerich H , Klohn P , Jat P , Mead S , Collinge J , Lloyd SE ((2014) ) In vitro screen of prion disease susceptibility genes using the scrapie cell assay. Hum Mol Genet 23: , 5102–5108. |
[58] | Dempsey KM , Ali HH ((2014) ) Identifying aging-related genes in mouse hippocampus using gateway nodes. BMC Syst Biol 8: , 1–16. |
[59] | Bettens K , Sleegers K , Van Broeckhoven C ((2013) ) Genetic insights in Alzheimer’s disease. Lancet Neurol 12: , 92–104. |
[60] | Karch CM , Goate AM ((2015) ) Alzheimer’s disease risk genes and mechanisms of disease pathogenesis. Biol Psychiatry 77: , 43–51. |
[61] | Morgan K ((2011) ) The three new pathways leading to Alzheimer’s disease. Neuropathol Appl Neurobiol 37: , 353–357. |
[62] | Fu AKY , Hung K-W , Huang H , Gu S , Shen Y , Cheng EYL , Ip FCF , Huang X , Fu W-Y , Ip NY ((2014) ) Blockade of EphA4 signaling ameliorates hippocampal synaptic dysfunctions in mouse models of Alzheimer’s disease. Proc Natl Acad Sci U S A 111: , 9959–9964. |
[63] | Sperling RA , Aisen PS , Beckett LA , Bennett DA , Craft S , Fagan AM , Iwatsubo T , Jack CRJ , Kaye J , Montine TJ , Park DC , Reiman EM , Rowe CC , Siemers E , Stern Y , Yaffe K , Carrillo MC , Thies B , Morrison-Bogorad M , Wagster M V , Phelps CH ((2011) ) Toward defining the preclinical stages of Alzheimer’s disease: Recommendations from the National Institute on Aging-Alzheimer’s Association workgroups on diagnostic guidelines for Alzheimer’s disease. Alzheimers Dement 7: , 280–292. |
[64] | Pimplikar SW , Nixon RA , Robakis NK , Shen J , Tsai L-H ((2010) ) Amyloid-independent mechanisms in Alzheimer’s disease pathogenesis. J Neurosci 30: , 14946–14954. |
[65] | Mangialasche F , Polidori MC , Monastero R , Ercolani S , Camarda C , Cecchetti R , Mecocci P ((2009) ) Biomarkers of oxidative and nitrosative damage in Alzheimer’s disease and mild cognitive impairment. Ageing Res Rev 8: , 285–305. |
[66] | Sayre LM , Perry G , Smith MA ((2008) ) Oxidative stress and neurotoxicity. Chem Res Toxicol 21: , 172–188. |
[67] | Wyss-Coray T ((2006) ) Inflammation in Alzheimer disease: Driving force, bystander or beneficial response? Nat Med 12: , 1005–1015. |
[68] | Galli F , Azzi A , Birringer M , Cook-Mills JM , Eggersdorfer M , Frank J , Cruciani G , Lorkowski S , Ozer NK ((2017) ) Vitamin E: Emerging aspects and new directions. Free Radic Biol Med 102: , 16–36. |
[69] | Mazlan M , Sue Mian T , Mat Top G , Zurinah Wan Ngah W ((2006) ) Comparative effects of alpha-tocopherol and gamma-tocotrienol against hydrogen peroxide induced apoptosis on primary-cultured astrocytes. J Neurol Sci 243: , 5–12. |
[70] | Saito Y , Nishio K , Akazawa YO , Yamanaka K , Miyama A , Yoshida Y , Noguchi N , Niki E ((2010) ) Cytoprotective effects of vitamin E homologues against glutamate-induced cell death in immature primary cortical neuron cultures: Tocopherols and tocotrienols exert similar effects by antioxidant function. Free Radic Biol Med 49: , 1542–1549. |
[71] | Taridi NM , Abd Rani N , Abd Latiff A , Ngah WZW , Mazlan M ((2014) ) Tocotrienol rich fraction reverses age-related deficits in spatial learning and memory in aged rats. Lipids 49: , 855–869. |
[72] | Daud ZAM , Tubie B , Sheyman M , Osia R , Adams J , Tubie S , Khosla P ((2013) ) Vitamin E tocotrienol supplementation improves lipid profiles in chronic hemodialysis patients. Vasc Health Risk Manag 9: , 747–761. |
[73] | Wang X , Wang W , Li L , Perry G , Lee H , Zhu X ((2014) ) Oxidative stress and mitochondrial dysfunction in Alzheimer’s disease. Biochim Biophys Acta 1842: , 1240–1247. |
[74] | Chandrasekaran K , Hatanpaa K , Brady DR , Rapoport SI ((1996) ) Evidence for physiological down-regulation of brain oxidative phosphorylation in Alzheimer’s disease. Exp Neurol 142: , 80–88. |
[75] | Chandrasekaran K , Hatanpaa K , Rapoport SI , Brady DR ((1997) ) Decreased expression of nuclear and mitochondrial DNA-encoded genes of oxidative phosphorylation in association neocortex in Alzheimer disease. Brain Res Mol Brain Res 44: , 99–104. |
[76] | Rhein V, Song X, Wiesner A, Ittner LM, Baysang G, Meier F, Ozmen L, Bluethmann H, Drose S, Brandt U, Savaskan E, Czech C, Gotz J, Eckert A ((2009) ) Amyloid-beta and tau synergistically impair the oxidative phosphorylation system in triple transgenic Alzheimer’s disease mice. Proc Natl Acad Sci U S A 106: , 20057–20062. |


