
Amyloidogenic Nanoplaques in Blood Serum of Patients with Alzheimer’s Disease Revealed by Time-Resolved Thioflavin T Fluorescence Intensity Fluctuation Analysis
Abstract
Background:
Biomarkers are central to current research on molecular mechanisms underlying Alzheimer’s disease (AD). Their further development is of paramount importance for understanding pathophysiological processes that eventually lead to disease onset. Biomarkers are also crucial for early disease detection, before clinical manifestation, and for development of new disease modifying therapies.
Objective:
The overall aim of this work is to develop a minimally invasive method for fast, ultra-sensitive and cost-effective detection of structurally modified peptide/protein self-assemblies in the peripheral blood and in other biological fluids. Specifically, we focus here on using this method to detect structured amyloidogenic oligomeric aggregates in the blood serum of apparently healthy individuals and patients in early AD stage, and measure their concentration and size.
Methods:
Time-resolved detection of Thioflavin T (ThT) fluorescence intensity fluctuations in a sub-femtoliter observation volume element was used to identify in blood serum ThT-active structured amyloidogenic oligomeric aggregates, hereafter called nanoplaques, and measure with single-particle sensitivity their concentration and size.
Results:
The concentration and size of structured amyloidogenic nanoplaques are significantly higher in the blood serum of individuals diagnosed with AD than in control subjects.
Conclusion:
A new method with the ultimate, single-particle sensitivity was successfully developed. The proposed approach neither relies on the use of immune-based probes, nor on the use of radiotracers, signal-amplification or protein separation techniques, and provides a minimally invasive test for fast and cost-effective early determination of structurally modified peptides/proteins in the peripheral blood, as shown here, but also in other biological fluids.
INTRODUCTION
Alzheimer’s disease (AD) is a devastating neurodegenerative ailment and the most common cause of dementia worldwide [1, 2]. Unfortunately, despite intensive research and a great societal need, biomarkers for reliable and cost-effective early diagnosis of AD are still in their infancy. This also presents an impediment for the development of new drugs, and there is presently no cure for AD.
The main obstacle for further progress is the lack of important basic knowledge about the complex dynamic processes that lead to AD development. While detailed molecular mechanisms are not yet fully understood, it is well established that an imbalance in the production and clearance of amyloid-β (Aβ) peptides, accompanied by their self-assembly into structured aggregates and accumulation in so-called senile plaques in the central nervous system (CNS) of affected individuals, is a characteristic of AD. The Amyloid Cascade Hypothesis proposes that misfolding, aggregation, and deposition of Aβ peptides is a major cause of AD [3]. Aβ peptides are 39–42 amino acids long peptides derived from the amyloid-β protein precursor (AβPP) via proteolytic processing. The most common forms of Aβ peptides are Aβ40 and Aβ42 (reviewed in [4]).
The aggregation mechanisms have been investigated using a variety of different analytical techniques, including fluorescence spectroscopy and fluorescence correlation spectroscopy ([5] and references therein). Early on a fluorescence assay with the benzothiazole salt Thioflavin T (ThT) became a standard method for amyloid detection by fluorescence spectroscopy and microscopy [6, 7]. As more recent studies have shown, amyloidogenic aggregates enriched with pleated β-sheet secondary structure readily bind ThT and significantly alter its spectral properties, shifting the absorption spectrum towards longer wavelengths and significantly increasing the fluorescence quantum yield (Fig. 1, inset) [8–12].
Fig.1
Schematic presentation of the instrumental setup for fluorescence correlation spectroscopy (FCS). A) Schematic drawing of the optical arrangement in an inverted confocal microscope. Incident laser light (blue) is reflected by the main dichroic beam splitter and sharply focused by the objective into the sample, generating a double-conus-like illumination volume. Molecules in the illumination volume that can absorb the incident laser light become excited, but unbound ThT molecules (yellow) and small amyloidogenic oligomers and peptide/protein monomers (grey) do not emit fluorescence, whereas the ThT-active structured amyloidogenic oligomers do (green). The elastically scattered incident light (blue) and the spectrally distinct fluorescence (green) are collected back by the objective, and separated by the main dichroic beam splitter that reflects the elastically scattered light and allows the fluorescence light, which is of a longer wavelength than the incident/elastically scattered laser light, to pass through the pinhole to the detector. B) Magnified image of the double-cones-like illumination volume generated in the sample by focusing the incident laser light with a microscope objective (blue) and the idealized observation volume element (OVE) in the form of a prolate ellipsoid from which fluorescence is being detected (green). C) Photons emitted by fluorescent molecules/particles passing through the OVE are detected by an avalanche photodiode (APD) detector, which responds with an electrical pulse to each detected photon. The number of electrical pulses originating from photons detected during a specific time interval, so-called binning time, corresponds to the measured light intensity at a given point of time. Exemplified here is a fluorescence intensity fluctuations time series recorded in a diluted suspension of quantum dots in blood serum using the same optical setting as described above. D) The electrical signal is transferred to a digital signal correlation unit and the corresponding normalized autocorrelation function G(τ) is calculated on-line to yield an experimentally derived temporal autocorrelation curve (tACC). The tACC shown here is derived from the time trace shown in C. Inset: Thioflavin T (ThT) chemical formula (top). Bottom: Fluorescence emission spectrum of ThT in water (dotted blue line) and in an aqueous solution containing structured amyloidogenic oligomers of insulin (solid red line). Normalized ground state absorption spectra of ThT in water (dotted blue line) and in an aqueous solution of insulin amyloid fibrils (dashed red line) are shown in the small inset. Image reproduced from [10] with permission by the Royal Society of Chemistry.
![Schematic presentation of the instrumental setup for fluorescence correlation spectroscopy (FCS). A) Schematic drawing of the optical arrangement in an inverted confocal microscope. Incident laser light (blue) is reflected by the main dichroic beam splitter and sharply focused by the objective into the sample, generating a double-conus-like illumination volume. Molecules in the illumination volume that can absorb the incident laser light become excited, but unbound ThT molecules (yellow) and small amyloidogenic oligomers and peptide/protein monomers (grey) do not emit fluorescence, whereas the ThT-active structured amyloidogenic oligomers do (green). The elastically scattered incident light (blue) and the spectrally distinct fluorescence (green) are collected back by the objective, and separated by the main dichroic beam splitter that reflects the elastically scattered light and allows the fluorescence light, which is of a longer wavelength than the incident/elastically scattered laser light, to pass through the pinhole to the detector. B) Magnified image of the double-cones-like illumination volume generated in the sample by focusing the incident laser light with a microscope objective (blue) and the idealized observation volume element (OVE) in the form of a prolate ellipsoid from which fluorescence is being detected (green). C) Photons emitted by fluorescent molecules/particles passing through the OVE are detected by an avalanche photodiode (APD) detector, which responds with an electrical pulse to each detected photon. The number of electrical pulses originating from photons detected during a specific time interval, so-called binning time, corresponds to the measured light intensity at a given point of time. Exemplified here is a fluorescence intensity fluctuations time series recorded in a diluted suspension of quantum dots in blood serum using the same optical setting as described above. D) The electrical signal is transferred to a digital signal correlation unit and the corresponding normalized autocorrelation function G(τ) is calculated on-line to yield an experimentally derived temporal autocorrelation curve (tACC). The tACC shown here is derived from the time trace shown in C. Inset: Thioflavin T (ThT) chemical formula (top). Bottom: Fluorescence emission spectrum of ThT in water (dotted blue line) and in an aqueous solution containing structured amyloidogenic oligomers of insulin (solid red line). Normalized ground state absorption spectra of ThT in water (dotted blue line) and in an aqueous solution of insulin amyloid fibrils (dashed red line) are shown in the small inset. Image reproduced from [10] with permission by the Royal Society of Chemistry.](https://content.iospress.com:443/media/jad/2019/68-2/jad-68-2-jad181144/jad-68-jad181144-g001.jpg)
Diagnostic methods for early AD detection are still under heavy discussion [13–16]. For diagnosis of prodromal patients, before mental decline is noticeable, it is required that reliable biomarkers are available [17]. Serum and cerebrospinal fluid (CSF) autoantibodies against Aβ have shown promise and warrant further investigations [18, 19], but the predictive power has not been particularly encouraging so far. Brain imaging using positron emission tomography (PET) and radiotracers will reliably reflect on fibrillar deposits of amyloid in the brain that are >1 mm in size [20–22]. Measuring the content of Aβ peptides (and tau protein) in the CSF using immunochemical techniques is also considered reliable [23–25]. However, PET is expensive and CSF sampling is invasive. In topical reviews [13, 14], the authors list drawbacks of simply measuring Aβ in blood plasma as a diagnostic method, and show that attempts to correlate blood studies and PET or CSF results are not convincing so far. The heterogeneous and different structural states of Aβ measured by the two technologies are one probable reason for the experimental difficulties: the immunochemical methods measure the soluble forms of the Aβ peptide(s), whereas the PET method measures the precipitated insoluble peptide aggregates in the brain. There is no clear direct connection between the two types of measurements, even if both relate back to the presence and behavior of the Aβ peptide. There is obviously a strong need for a novel, non-invasive, and reliable method for early AD diagnostics. The lack of such methods also presents an impediment for the development of new therapies aiming to reduce the amyloid burden in the brain, which critically depends on the possibility to routinely identify and characterize the levels of structured amyloidogenic aggregates in the same individual repeatedly over time.
Here we present a fluorescence-based assay on blood serum labelled with the amyloid-sensitive dye ThT. The method is based on observations using a time-resolved and highly sensitive single-molecule fluorescence technology called fluorescence correlation spectroscopy (FCS). We have earlier used the ThT based FCS assay (ThT-FCS) to study the heterogeneity and turnover of Aβ peptide aggregates during their fibril formation process in vitro [5]. In the present study, we show that the passage of ThT-active structured amyloidogenic oligomeric aggregates, hereafter called nanoplaques, through an extremely small (< femtoliter) focal volume can be recorded in real time, the number of passages can be counted and the passage time can be measured. We show that the number of passages and the passage time are related to the concentration and size of the nanoplaques, respectively, and that there is a significant difference in the number and the size of nanoplaques in the blood serum from diagnosed AD patients and control individuals.
MATERIALS AND METHODS
Blood samples were obtained upon informed consent from apparently healthy blood donors (control group) and from individuals who were, after examination in primary care settings, referred to the Memory Clinic, Karolinska University Hospital, Huddinge (patient cohort). Collection and handling of blood samples was approved by a regional ethics committee in Stockholm, permit nr. 2012/1019-31/1. Detailed description of patient cohort and ethics, blood collection, and blood sample preparation is given in Supplementary Material 1 (Supplementary Table 1).
Time-resolved ThT fluorescence intensity fluctuation measurement on blood serum
Fluorescence intensity fluctuations in the blood serum with ThT were recorded in a series of 300 measurements, each measurement lasting 10 s, yielding a total run time of 3000 s. All measurements were performed at 20°C in an air-conditioned room using a ConfoCor 2 system (Carl Zeiss, Jena, Germany), as described in Supplementary Material 2. FCS measurements were validated using the individually modified ConfoCor3 system (Carl Zeiss, Jena, Germany) available in our laboratory [26]. No significant differences between measurements’ outcomes obtained using one or the other system were observed.
Short background on fluorescence correlation spectroscopy
FCS is a quantitative analytical method with the ultimate, single-molecule sensitivity for the detection of bright fluorescent molecules in dilute aqueous solutions [27–33]. FCS achieves single-molecule sensitivity by observing with high temporal resolution the time course of spontaneous fluorescence intensity fluctuations in a very small volume that is in conventional instrumental setups about (2 – 10) × 10–16 l. In such a tiny volume, the background noise originating from molecules present in large excess, such as the solvent molecules, is significantly reduced by observing a small number of molecules at a time. Hence, the passage of a bright fluorescent molecule through the small observation volume gives rise to a prominent change in fluorescence intensity that can be readily detected.
To generate the tiny observation volume, the instrumentation for FCS takes advantage of the specific arrangement of optical elements in a confocal microscope. In particular, a high numerical aperture (NA) objective is used to sharply focus the incident laser light into the sample. The volume from which fluorescence is being detected is further reduced by placing a pinhole in the optically conjugate plane in front of the detector to eliminate out-of-focus light (Fig. 1A). In this way, a miniature observation volume element (OVE) is generated in the sample (Fig. 1B) that is sufficiently small to allow the observation of fluorescence intensity fluctuations that arise around a(n) (non)equilibrium steady state due to spontaneous, thermally driven microscopic fluctuations in the positions of molecules through the OVE (Fig. 1C). These fluctuations are recorded over time and analyzed to extract information about the average number of molecules in the OVE, which is representative of the sample concentration, and the average transition time, i.e., the time needed for a molecule to pass through the OVE, the so-called translation diffusion time (τD), which is defined by the diffusion coefficient (D) of the molecule of interest, i.e., by its size and shape in a medium of given viscosity (Fig. 1D). Measurement of fluorescence intensity fluctuations and instrument calibration are described in detail in Supplementary Material 2 and Supplementary Material 3 (Supplementary Figure 1).
FCS data analysis
Different methods can be used to analyze the fluorescence intensity fluctuations recorded in an FCS experiment [29, 31]. Typically, temporal autocorrelation analysis is applied to derive a temporal autocorrelation curve (tACC) and to read out the average number of molecules in the OVE from the amplitude of the tACC and the diffusion time from the characteristic decay time of the tACC [27, 28, 31]. Details of temporal autocorrelation analysis and how to derive the average number of molecules in the OVE and the translational diffusion coefficient of the investigated particles is given in Supplementary Material 3.
In this study, temporal autocorrelation analysis, as described in Supplementary Material 3, was used for instrument calibration (Supplementary Figure 1).
For the analysis of FCS data on blood samples, the evaluation is performed by characterizing the frequency of single event occurrence as described in Supplementary Material 4. This method is validated using standard series of dilute aqueous suspension of fluospheres (d = 100 nm), described in detail in Supplementary Material 4, as shown in Supplementary Figures 2 and 3.
Masking and statistical analysis
Double-blind (i.e., double-masking) was applied. To this aim, researchers performing the FCS measurement and time-resolved ThT serum FIFA were blinded as to the individual diagnoses until the data analysis was completed. Likewise, the diagnosis was established using standard clinical tests and results of the time-resolved ThT serum FIFA were not known by the clinicians until the study was completed and the code was revealed.
In order to assess whether the mean fSEO values in the control and the patient cohorts are significantly different, unpaired t-test analysis was performed using the online available GraphPad Software tool (http://www.graphpad.com/quickcalcs/ttest1.cfm?Format=SD).
RESULTS
Serum autofluorescence and serum ThT fluorescence
Blood serum is a complex aqueous mixture of different classes of chemical compounds, of which lipids (in the form of triglycerides) and proteins (albumin and immunoglobulins) are the most abundant. Many of the compounds in blood serum are natively fluorescent and absorb light at 458 nm, such as flavin (FAD) and pyridinic (NADH) coenzymes and lipopigments. As a consequence, blood serum exhibits autofluorescence and also gives rise to a distinct tACC with an amplitude Aserum = (0.003±0.002) and a single characteristic decay time τserum = (55±15)μs (Fig. 2A, black). The simplest theoretical model that could fit these experimental data was the autocorrelation function for free 3D diffusion without a triplet (AF1 in [28]). Holding the structure parameter fixed to its value determined by the instrument calibration, Sp = 5, the parameter values derived by fitting are: N = 300 and τD = 55μs.
Fig.2
FCS analysis of serum autofluorescence and serum ThT fluorescence. A) Experimental tACC recorded in the blood serum without ThT (black dots) and with ThT (red circles), and the corresponding best fit using a theoretical autocorrelation function (AFt; solid lines). For measurements in the serum without ThT, the simplest theoretical model that could fit the experimental data was AF for free 3D diffusion without a triplet. The parameter values derived by fitting are: N = 300 and τD = 55 μm. The structure parameter was fixed at the value determined in calibration experiments, Sp = 5. For measurements in the serum with ThT, the simplest theoretical model that could fit the experimental data was AFt for free 3D diffusion of two components without triplet. The parameter values derived by fitting are: N = 750, τD1 = 40μs, τD2 = 100 ms, y1 = 0.94 and y2 = 0.06. The structure parameter was fixed at the value determined in calibration experiments, Sp = 5. B) Temporal autocorrelation curves shown in A. normalized to the same amplitude, G(τ) = 1 at τ= 10μs. Of note, the tACCs shown here are average of 10 consecutive 10 s measurements during which passage of individual nanoplaques was not observed, i.e., single event was not observed in any of the time series.
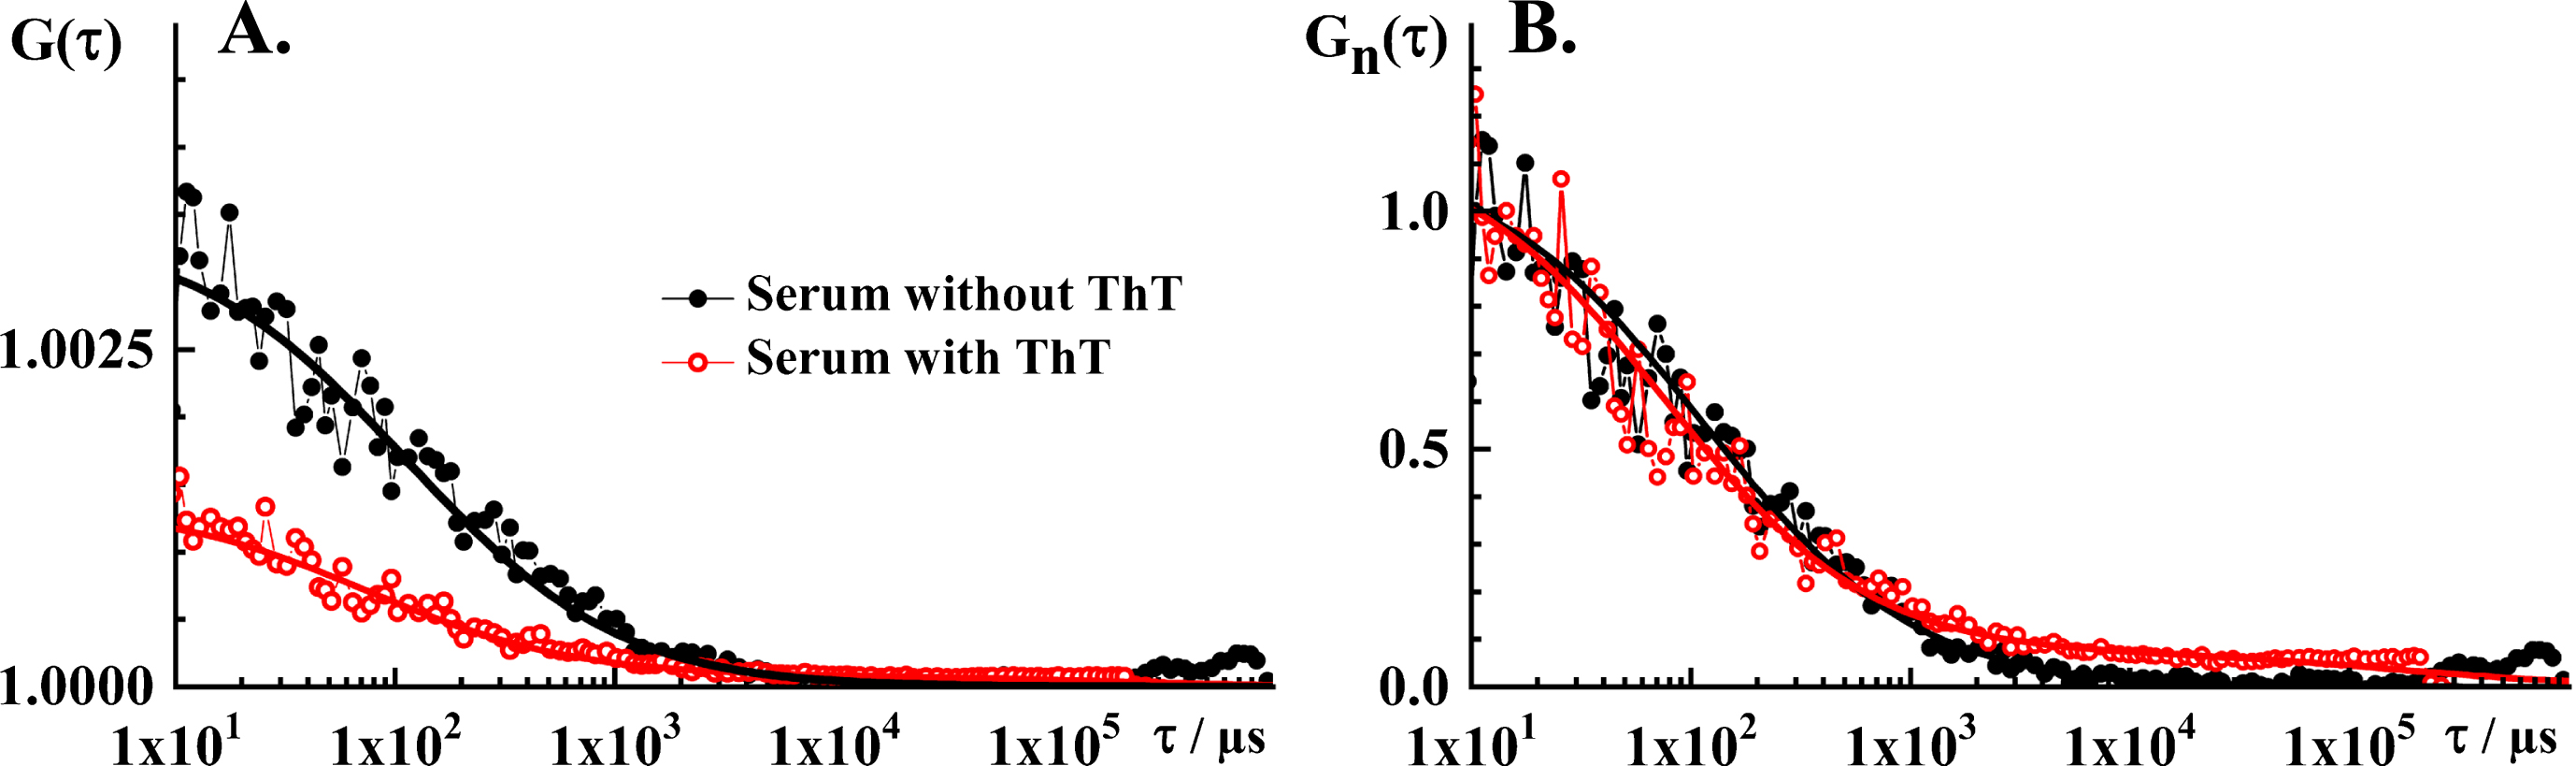
When ThT is added to blood serum, several important differences are observed. Most notably, the amplitude of the tACC decreases markedly (AThT = (0.0014±0.0007)) and a small but discernible contribution of one or more components with long characteristic decay time is observed (Fig. 2A, red). Hence, the simplest theoretical model that could fit these experimental data was an autocorrelation function for free 3D diffusion of two components without a triplet (AF3 in [28]). The parameter values derived from the best fitting autocorrelation function are: N = 750, τD1 = 40μs, τD2 = 100 ms, y1 = 0.94, and y2 = 0.06. The structure parameter was fixed at the value determined in calibration experiments, Sp = 5. The characteristic decay time of the first component, τD1 = 40μs, derived by fitting is very similar to the characteristic decay time in the serum without ThT, τD = 55μs; in agreement with experimental findings showing a close overlap of tACCs normalized to the same amplitude, G(τ) = 1 at τ= 10μs (Fig. 2B).
Decrease in the amplitude of the tACC, which indicates that the average number of observable molecules increases in the OVE upon ThT addition, is consistent with making otherwise invisible ThT-active entities visible. ThT fluorescence in blood serum was in detail characterized by bulk fluorescence spectroscopy by Chauhan et al. [34] and Griffin et al. [35]. Using flotation fractionation, Griffin et al. were able to show that about 94 % of ThT reactivity in blood serum is associated with the non-apoB containing fraction of blood serum and identified water-soluble glycated and other chemical adducts of serum albumin as the main contributors to the baseline ThT serum fluorescence [35]. The observed appearance of a second component with significantly longer diffusion time is consistent with making visible large ThT-active entities that are present at very low levels, hence the small relative amplitude.
As expected based on previously published results [34, 35], the mean serum ThT fluorescence intensities showed considerable variation between individuals (Supplementary Table 1). However, in contrast to previous observations by bulk ThT fluorescence spectroscopy, the mean count rate values between the patient, CRp = (202±92) kHz, and the control groups, CRc = (155±43) kHz, differed significantly, as evident from the two-tailed p value, p = 0.0126.
Time-resolved detection of fluctuations in ThT fluorescence intensity reveals passage of ThT-active amyloidogenic structured nanoplaques through the OVE
Time-resolved detection of ThT serum fluorescence reveals the infrequent occurrence of very well identifiable peaks in fluorescence intensity that differ from the mean fluorescence intensity by a value that is more than five times larger than the standard deviation (SD) of the time series, (F(t) – 〈F(t)〉) > 5 × SD (Fig. 3). As already indicated, we call these peaks “single events”.
Fig.3
Time-resolved fluorescence intensity fluctuations in serum ThT recorded over time. The clearly visible peaks in fluorescence intensity reflect the rare passage of bright ThT-active structured amyloidogenic oligomers, i.e., nanoplaques.
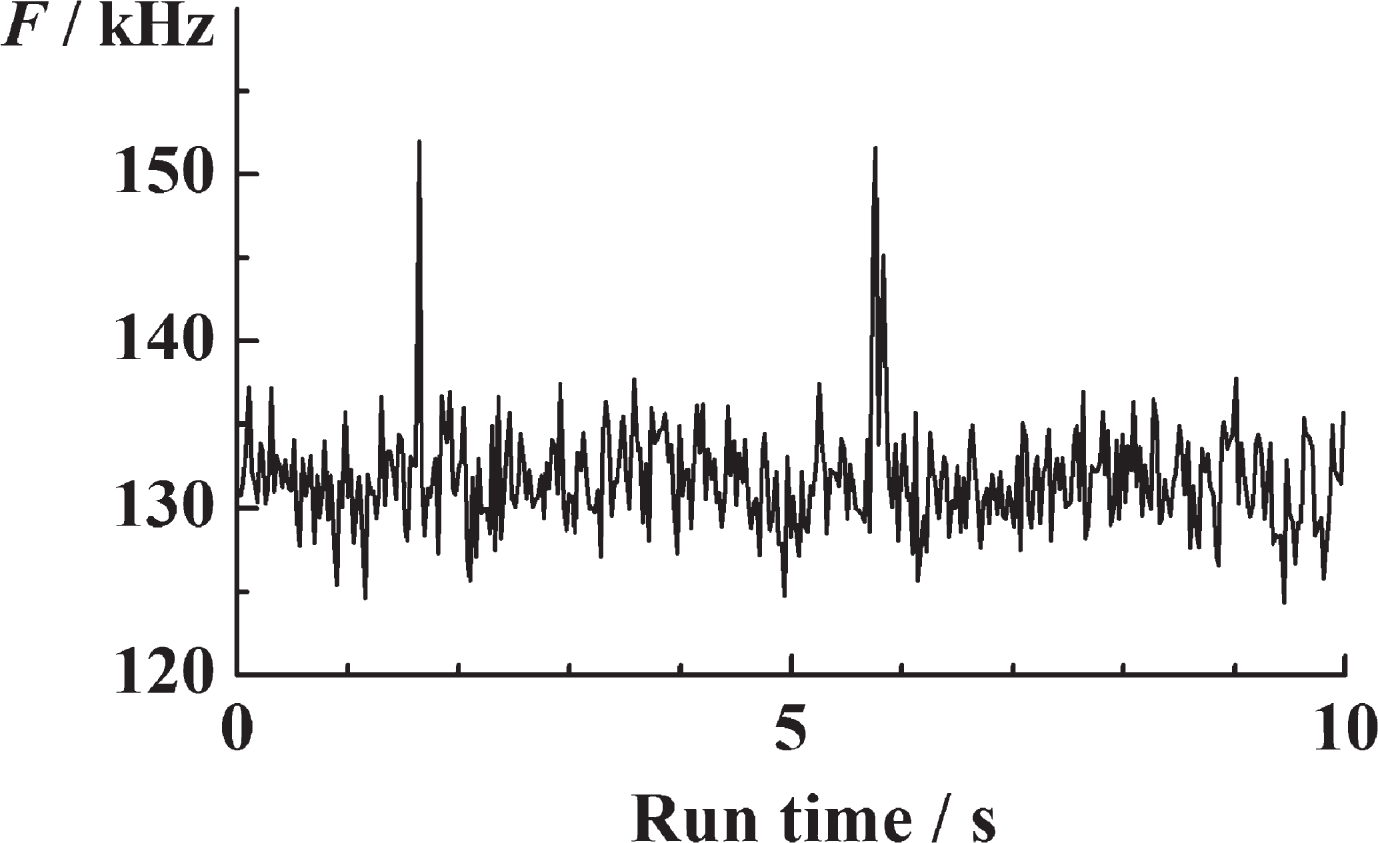
In order to ascertain that these outbursts do not reflect electrical disturbances or occasional passage of small air bubbles or dust particles through the OVE, but rather reflect the passage of ThT-active amyloidogenic structured nanoplaques, control measurements were performed in the serum without ThT. As can be seen (Supplementary Figure 4 in Supplementary Material 5), while fluorescence intensity peaks are occasionally detected in the serum before ThT is added, the mean frequency of their occurrence is significantly lower than in the serum with ThT; there is no difference in the frequency at which these peaks occur in the control and the patient’s samples; and the standard deviation is larger than the mean, suggesting that the mean value of random disturbances is not significantly different from zero.
We have also verified that the effect of age-related differences between the control and patient cohorts are negligible, as established by the adjusted R-squared value,
We therefore present the occurrence of fluorescence intensity bursts, i.e., the occurrence of single events and the frequency of their appearance, termed “frequency of single event occurrence” (fSEO), as our direct measure of the concentration of structured amyloidogenic nanoplaques in the blood serum.
The frequency of single event occurrence in the blood serum of AD patients is higher than in the blood serum of apparently healthy controls
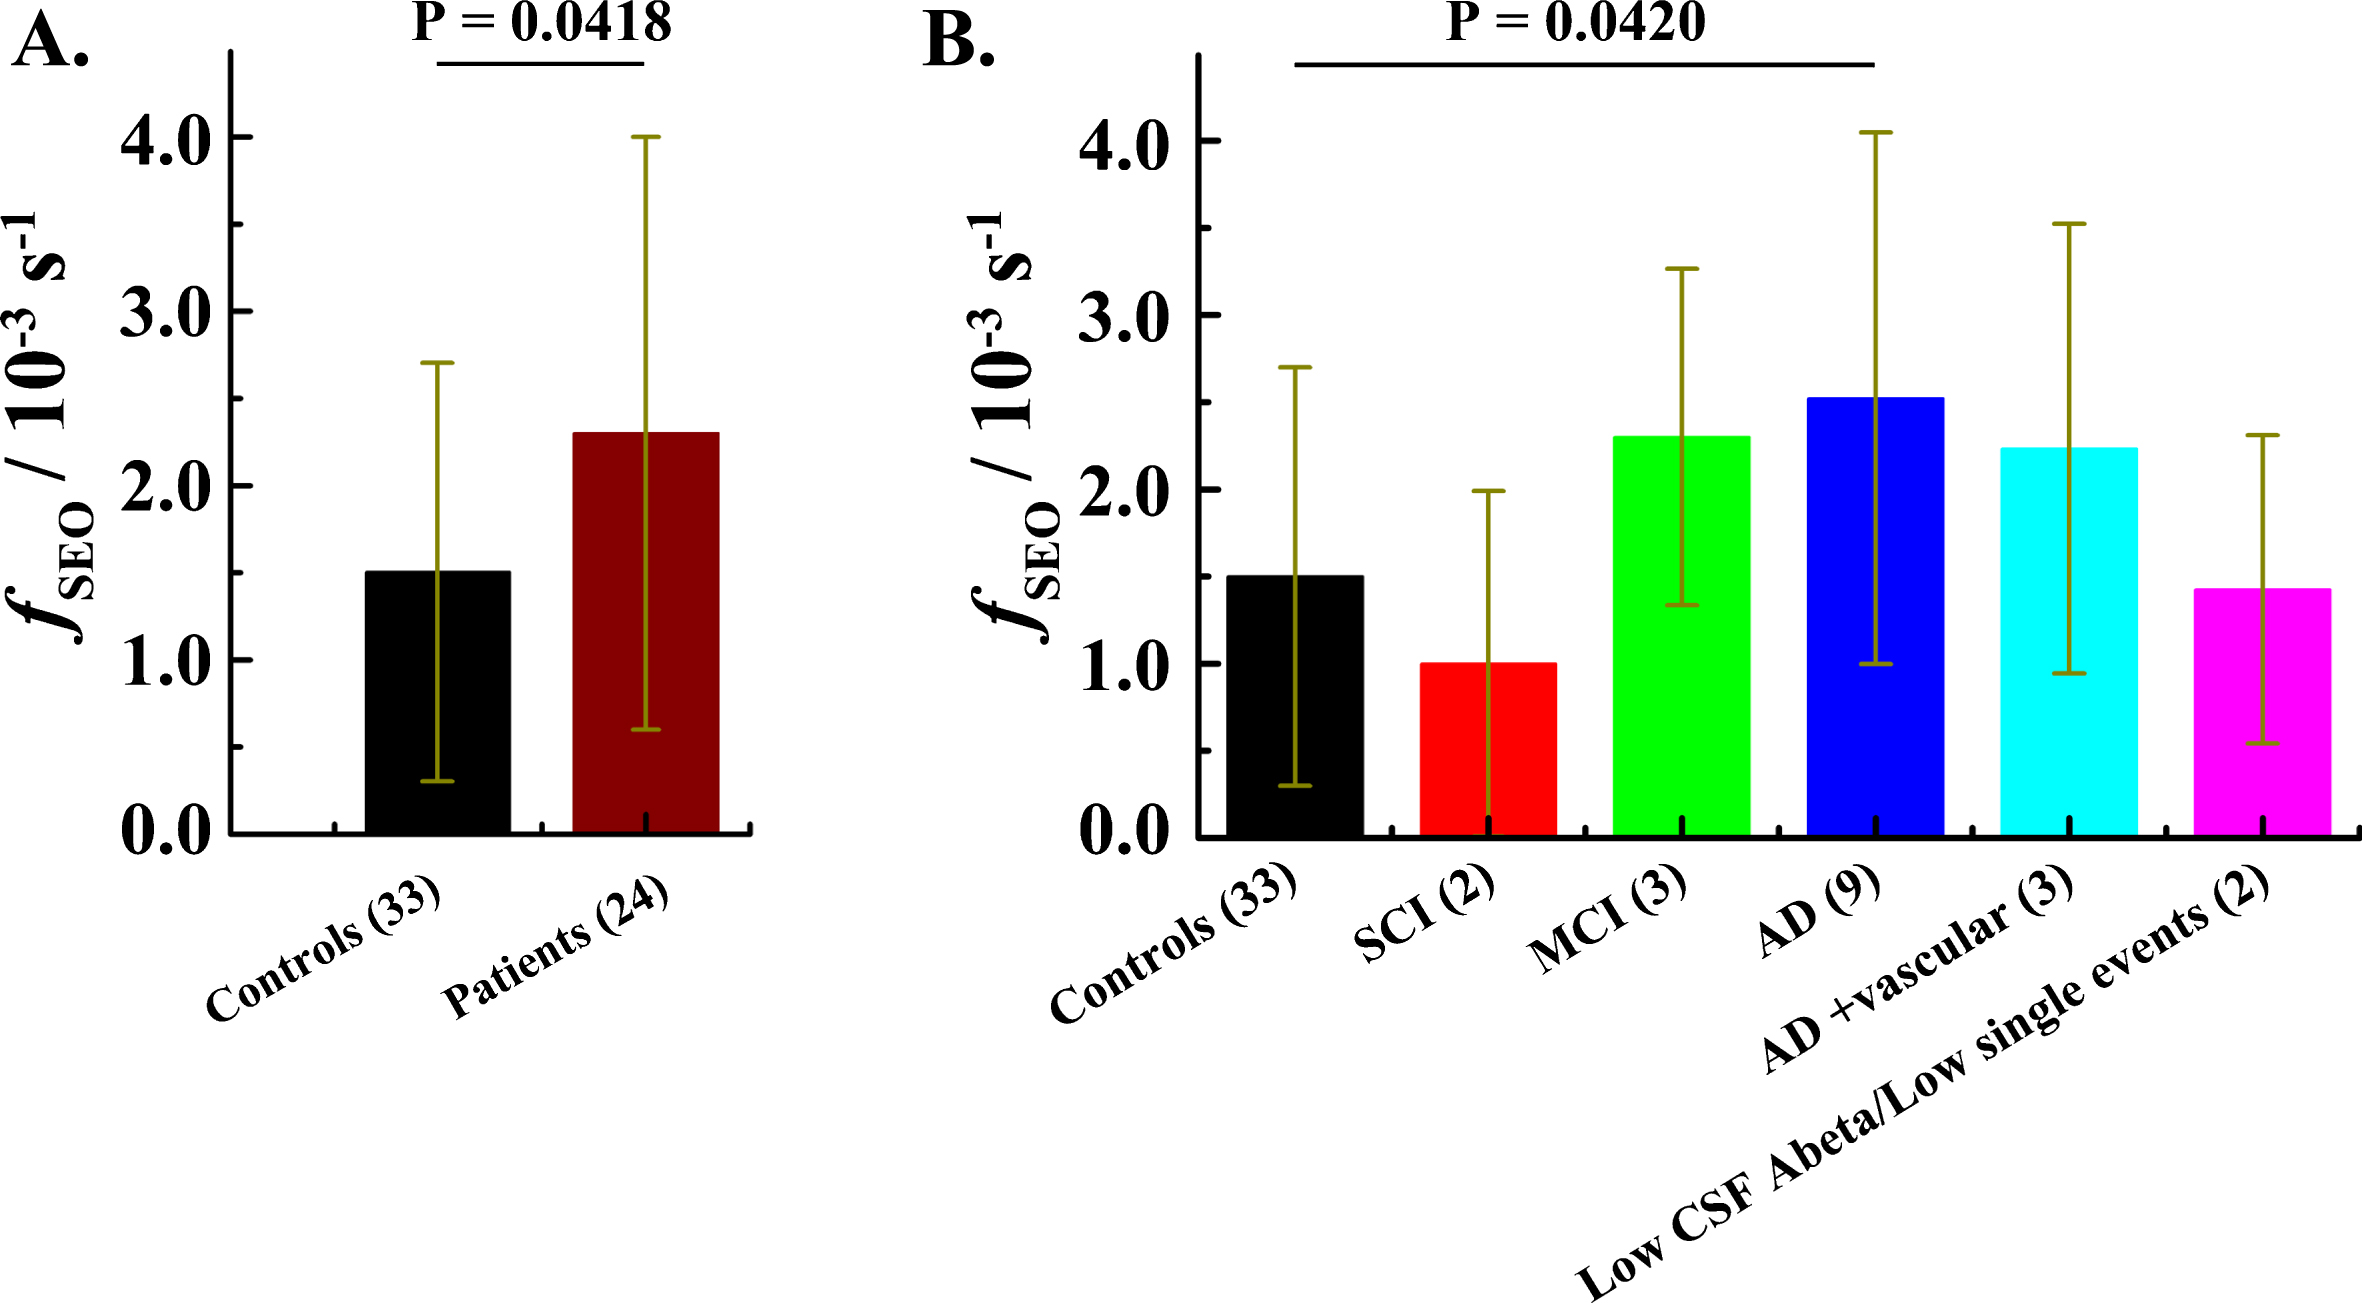
The frequency of single event occurrence (fSEO), calculated as described in the Materials and Methods: Data analysis subsection, differs between the patient group, fSEOp = (2.3±1.7)×10–3 s–1, and the control group, fSEOc = (1.5±1.2)×10–3 s–1. A two-tailed p value, p = 0.0418, determined by unpaired t-test analysis suggests that the difference in the fSEO between the patient group and the control group is statistically significant (Fig. 4A). After revealing the code and separating the patients into subgroups based on the clinical diagnosis, the difference between the AD patients, fADSEOp = (2.5±1.5)×10–3 s–1, and the control group, fSEOc = (1.5±1.2)×10–3 s–1, remains statistically significant, p = 0.0420 (Fig. 4B).
Fig.4
The frequency of ThT-active structured amyloidogenic oligomeric aggregates occurrence in the patient and in the control group. A) Mean fSEO in the control group (black) and the patient group (wine). Error bars indicate standard deviations (± SD). B) Mean frequency of single event occurrence in different diagnostic groups. N.B. For four patients the diagnosis was not established. Data for the patient that has undergone a gastric bypass operation were not included in this analysis (see Supplementary Table 1). SCI – Subjective Cognitive Impairment. MCI – Mild Cognitive Impairment.
The size of the ThT-active amyloidogenic structured nanoplaques in the blood serum of AD patients is larger than in the blood serum of apparently healthy controls
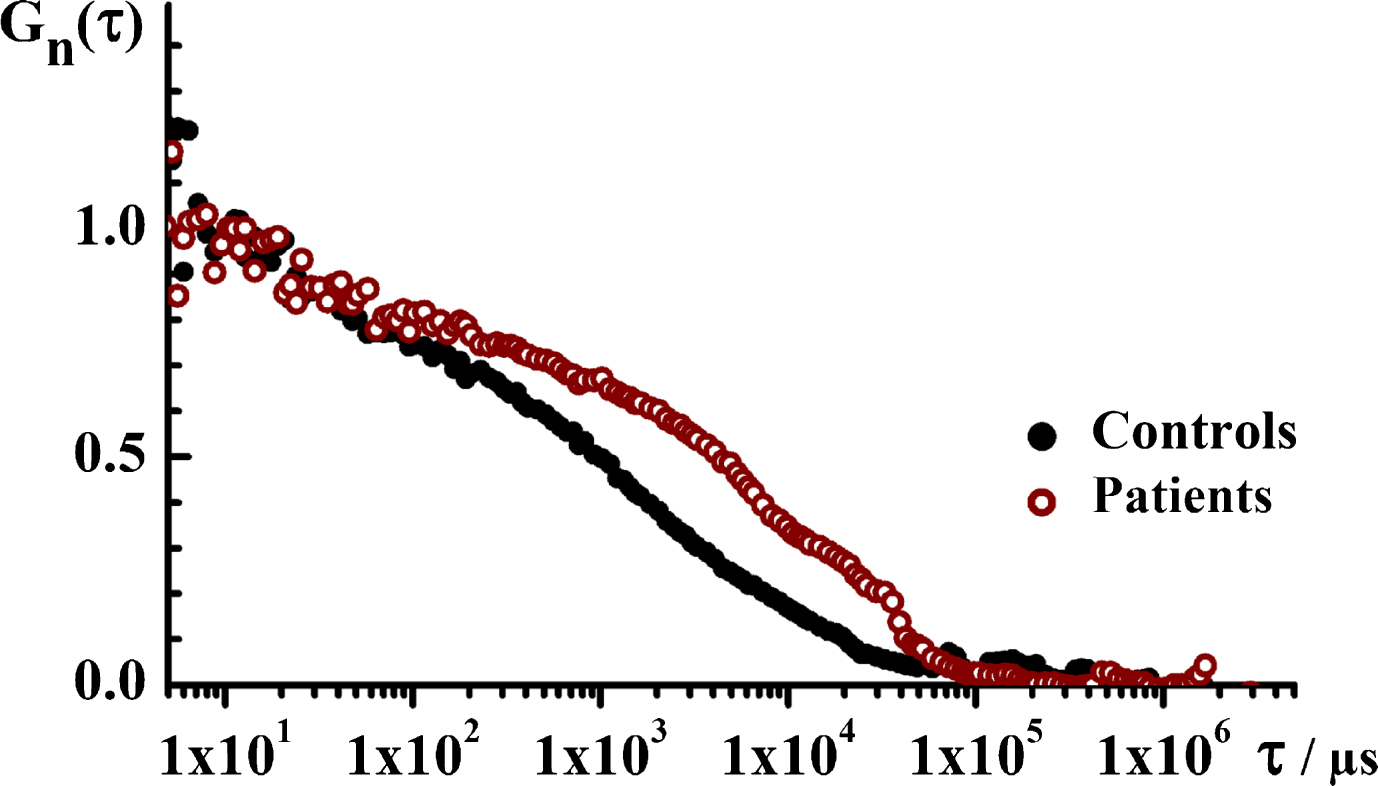
Temporal autocorrelation analysis, performed as described in Materials and Methods, shows an obvious difference in the characteristic decay time between the tACCs recorded for the two groups, with a markedly longer decay time for the patient group (Fig. 5). Evaluation of the normalized tACCs shows that the analyzed system is complex and does not contain particles that are uniform in size, but rather contains a mixture of particles of very different sizes. The average diffusion time for the ThT-active particles in the control group is about 5 ms, and the average diffusion time for particles in the patient group is about 15 ms. Assuming they are spherical molecules, the molecular weight difference is about 27 times between the two groups. Thus, in addition to the larger number of nanoplaques the patient group carries also larger ThT-active structured amyloidogenic oligomeric aggregates in the serum.
Fig.5
The translational diffusion time, i.e., the size of ThT-active structured amyloidogenic oligomeric aggregates in the patient and in the control group. Temporal autocorrelation curves (tACCs) for the control (black) and the patient (wine) groups showing that the characteristic decay time is longer for the patient group, indicating that the structured aggregates observed in this group are larger. Of note, only time series where single events were observed are analyzed.
Clinical output in CSF versus time resolved ThT fluorescence intensity fluctuation analysis in blood serum
We have compared the results obtained by time-resolved ThT FIFA in blood serum with the results obtained using established biochemical biomarkers in the CSF, including CSF levels of the 42 amino acid form of the amyloid-β peptide (Aβ42) and the total CSF levels of the tau protein (t-Tau). The comparison shows that the results obtained by time-resolved ThT blood serum FIFA match the results obtained by CSF biochemical analysis (Fig. 6). The generally accepted limit for an AD diagnosis based on Aβ42 level in CSF is < 550 ng l–1 [36]. Based on the data presented in (Fig. 6), we suggest that a limit of fSEO > 1.5×10⁻³ s–1 in blood serum is indicative of AD.
Fig.6
Correlation between clinical CSF parameters and the fSEO in blood serum. A) The ratio of the total Tau level over Aβ42 level in the CSF as a function of the Aβ42 level in the CSF. Pink dots with a blue rim designate data from individuals diagnosed with AD. B) The fSEO in the blood serum as a function of the Aβ42 level in the CSF. Blue-lined wine dots designate data from individuals diagnosed with AD, whereas wine dots indicate data from individuals in the patient cohort that were not diagnosed with AD. C) Comparison between CSF and blood serum measurements. Pink axes and symbols relate to measurements in the CSF, showing the ratio of the total Tau level over Aβ42 level in the CSF as a function of the Aβ42 level in the CSF. Wine ordinate and symbols relate to measurements in the blood serum. Wine symbols present the fSEO in the blood serum as a function of the Aβ42 level in the CSF. Data from individuals diagnosed with AD based on a multimodal clinical assessment are represented by the blue-lined wine dots. The green-lined point indicates the value from a patient with gastric bypass. In all graphs, the vertical dashed line indicates the generally accepted limit for an AD diagnosis based on Aβ42 level in CSF, [Aβ42] < 550 ng l–1. The horizontal dashed line indicates the limit of fSEO > 1.5×10⁻³ s–1 in blood serum that is indicative of AD.
![Correlation between clinical CSF parameters and the fSEO in blood serum. A) The ratio of the total Tau level over Aβ42 level in the CSF as a function of the Aβ42 level in the CSF. Pink dots with a blue rim designate data from individuals diagnosed with AD. B) The fSEO in the blood serum as a function of the Aβ42 level in the CSF. Blue-lined wine dots designate data from individuals diagnosed with AD, whereas wine dots indicate data from individuals in the patient cohort that were not diagnosed with AD. C) Comparison between CSF and blood serum measurements. Pink axes and symbols relate to measurements in the CSF, showing the ratio of the total Tau level over Aβ42 level in the CSF as a function of the Aβ42 level in the CSF. Wine ordinate and symbols relate to measurements in the blood serum. Wine symbols present the fSEO in the blood serum as a function of the Aβ42 level in the CSF. Data from individuals diagnosed with AD based on a multimodal clinical assessment are represented by the blue-lined wine dots. The green-lined point indicates the value from a patient with gastric bypass. In all graphs, the vertical dashed line indicates the generally accepted limit for an AD diagnosis based on Aβ42 level in CSF, [Aβ42] < 550 ng l–1. The horizontal dashed line indicates the limit of fSEO > 1.5×10⁻³ s–1 in blood serum that is indicative of AD.](https://content.iospress.com:443/media/jad/2019/68-2/jad-68-2-jad181144/jad-68-jad181144-g006.jpg)
DISCUSSION
We present here a new quantitative method for the detection of structured amyloidogenic aggregates in blood serum that is based on the analysis of time-resolved ThT fluorescence intensity fluctuations. In the presence of amyloid fibrils and structured amyloidogenic oligomers ThT acquires fluorescence excitation and emission spectra that are markedly distinct from those of the free dye (Fig. 1, inset) [8–12]. This change in fluorescence is generally considered to be specific for ThT interactions with amyloidogenic structures, and is not induced upon binding to native protein monomers or amorphous aggregates [6, 7]. Due to this property, ThT has been widely used to visualize tissue amyloid deposits by fluorescence microscopy [37–39]; ThT congeners are also the bases for in vivo imaging using PET and single photon emission computed tomography [40–42]; and ThT is indispensable in basic studies of protein aggregation by classical, bulk fluorescence spectroscopy to monitor the time course of amyloid fibril formation from purified proteins and peptides in vitro [5, 43, 44].
While classical bulk ThT fluorescence spectroscopy is very important for basic studies of Aβ aggregation kinetics [43], this method also has serious limitations. Most notably, bulk ThT fluorescence spectroscopy involves signal integration time that is typically of the order of 1–10 s, averaging ThT fluorescence over all Aβ aggregation states that are present in the sample [43]. When such measurements are performed in blood serum, fluorescence originates from autofluorescence and from dim fluorescence arising from ThT-active compounds present in a large excess, such as lipids, proteins (disordered or acquiring other types of secondary structure than β-pleated sheet), organic heterocyclic molecules and their derivatives. The contribution of rare and short-lasting (0.2–100 ms) fluorescence intensity peaks that arise when sparse, yet bright ThT-active structured amyloidogenic aggregates pass through the OVE, is averaged out over the long signal integration time and the contribution from autofluorescent and ThT-active molecules, while dim in comparison, prevails as the molecules that give raise to it outnumber by far the bright ThT-active structured amyloidogenic nanoplaques. Hence, the mean ThT fluorescence of blood serum depends on its specific biochemical composition, individual differences in mean ThT serum fluorescence intensity are large (Supplementary Table 1) and the usefulness of bulk ThT fluorescence spectroscopy in biomedical diagnostics of amyloid-featuring diseases has been shown to be limited [34, 35].
In contrast to bulk ThT fluorescence spectroscopy, time-resolved detection of fluctuations in ThT fluorescence in a sub-femtoliter OVE does not involve such averaging [5]. Here, the signal is recorded with a sub-microsecond temporal resolution and the passage of bright ThT-active structured amyloidogenic nanoplaques through the OVE can be readily discerned (Fig. 3). In our analysis, we are counting the numbers of fluorescence intensity peaks that differ from the mean fluorescence intensity by a value that is five times larger than the SD of the whole time series. We are counting the number of fluorescence peaks, i.e., determine the frequency of their encounter (fSEO) to measure the concentration of amyloidogenic aggregates, and we analyze the average duration of fluorescence intensity peaks to determine the diffusion time, i.e. the size of the amyloidogenic aggregates. When the background is low, the signal-to-background ratio is high, and the peaks are easily discernible. However, even if the background is high, our analysis is, within certain limits, possible because of the following reason – the more autofluorescent and ThT-active molecules in the blood serum, the larger the mean fluorescence intensity, but the smaller the SD of the time series. Given that the peaks are identified through an increase in fluorescence intensity that is five times larger than the SD of the whole time series, the fluorescence peaks are, within certain limits, discernible even though the background signal is high.
In conclusion, we report here the detection of structured amyloidogenic aggregates in the blood serum using time-resolved ThT serum fluorescence intensity fluctuations. Moreover, we demonstrate that there is a positive correlation between AD diagnosis and the mean frequency at which ThT-active structured amyloidogenic aggregates occur in the blood serum of AD patients (Figs. 4 and 6); and that there is a pronounced difference in the translational diffusion of ThT-active structured amyloidogenic nanoplaques in the blood serum of AD patients (Fig. 5), which indicates that the ThT-active structured amyloidogenic nanoplaques are significantly larger in AD patients.
While the capacity of this method for the early identification of individuals at risk to develop AD remains to be confirmed in large clinical trials, our results clearly show that this new method with single-particle sensitivity, which neither relies on the use of immune-based probes, nor on the use of radiotracers, signal-amplification or protein separation techniques, may provide a minimally invasive test for a fast and cost-effective early determination of structurally modified proteins in the peripheral blood circulation, CSF, but also in other, more easily accessible biological fluids, such as saliva and urine.
However, we also need to caution about the limitations of the current method. One problem associated with ThT-based fluorescence assays for the detection of structured amyloidogenic forms of Aβ in biological fluids is that only relatively large oligomeric states (>40 monomers) appear to have attained structures which give rise to observable ThT fluorescence [5]. The smaller oligomeric states, which are more abundant at an early kinetic stage of the aggregation process and which are considered to be among the most cell toxic species, seem not to be made fluorescent by ThT binding [5, 45]. However, the presence of ThT-fluorescence at later kinetic stages of peptide aggregation is generally considered to indicate that the toxic forms of oligomers are still present or have been present earlier (“on pathway”). In addition, in vitro studies show that the initial step in Aβ peptide aggregation is slow, but once the reaction has commenced, the turnover of small oligomers is fast [5]. Thus, while our method cannot detect the smallest oligomers, such as dimers, trimers, tetramers, etc., the smallest ThT-active structured amyloidogenic oligomeric aggregates will form very quickly after the inception of the aggregation process, enabling early AD diagnosis.
In addition, the ThT assay is a structure-based assay that efficiently identifies structurally modified proteins enriched in β-pleated sheet secondary structure and does not discriminate between aggregated protein targets of different chemical composition. Moreover, the nanoplaques may be composed of several different amyloid-forming peptides/proteins that cross-react with one another [46]. Hence, additional methods, such as immune-based and/or proteomic assays are needed to determine the chemical composition of the small structured amyloidogenic nanoplaques identified by ThT. This, however, is not a trivial task. Immune-based assays, such as the most frequently used enzyme-linked immunosorbent assay (ELISA), digital ELISA [47, 48], sandwich ELISA [49], and associated methods recently reviewed by Andreasson et al. [50], immunoprecipitation–mass spectrometry (IP–MS) [51] and immuno-infrared-sensor [52–54] all have common inherent limitations that are related to the specificity and the sensitivity of the antibody-antigen reaction [55–57]. In the case of Aβ immune-based assays, the following difficulties, to name but a few, are typically encountered: monomeric Aβ that is present in excess can occupy binding sites on the antibody, thereby interfering with the detection of Aβ oligomers [58]; interference from the p3 peptide and Aβ-catabolic peptides derived from the non-amyloidogenic pathway of AβPP processing may introduce uncertainty in the interpretation of results [59]; substrates for signal amplification and detection are inherently unstable and may produce signal even in the absence of enzyme [50]. Proteomic approaches using sodium dodecyl sulfate-polyacrylamide gel electrophoresis (SDS-PAGE), 2D-PAGE, liquid chromatography, mass spectrometry, matrix assisted laser desorption/ionization-time of flight (MALDI-TOF) mass spectrometry, electrospray ionization mass spectrometry, liquid chromatography-tandem mass spectrometry, and related techniques, characterize directly the molecule of interest with high sensitivity and specificity, thereby providing invaluable information [60]. However, these techniques are constrained by the difficulty to detect low-abundance proteins in complex mixtures such as biological fluids due to limitations in the dynamic range; inability to measure intact larger proteins and involved sample preparation procedures [61]. As a consequence, there is to date no CSF biomarker discovered in proteomic studies that has reached the clinic [62].
In summary, we would like to underline that currently available immune-based methods clinically used for CSF and blood plasma biochemical analysis show that the concentration of Aβ42 decreases in the CSF and blood plasma of AD patients [23, 36, 63–65]. This is very likely due to the fact that the antibodies largely recognize monomeric Aβ peptides, whereas aggregation renders Aβ peptides into states that are not easily recognized by immunochemistry as discussed by Klaver et al. [58] and references cited therein. In contrast, our method measures the ThT reactive states in the blood serum that correspond to the actual amyloid states present in the fibrils seen in the brain. Obviously, the two types of observations both correlate with the AD pathology in the patient, as can be seen from the data presented in Fig. 6, but our method relies on a simple blood test to derive the information. The limit of quantification of the proposed method is unparalleled, reaching the ultimate single-particle sensitivity for structured aggregates comprising more than 40 Aβ monomers. Moreover, the proposed method allows us also to determine the distribution of structured aggregates size, which may be a valuable indicator of disease stage (early vs late) and a reliable predictor of disease progression [66, 67].
ACKNOWLEDGMENTS
Financial support from The Knut and Alice Wallenberg Foundation (KAW 2011.0218), the Swedish Research Council (2016-01922), the Foundation for Strategic Research (SBE13-0115), The Olav Thon Foundation and the Magnus Bergvall’s Foundation (2016-01615) is gratefully acknowledged.
Authors’ disclosures available online (https://www.j-alz.com/manuscript-disclosures/18-1144r1).
SUPPLEMENTARY MATERIAL
[1] The supplementary material is available in the electronic version of this article: http://dx.doi.org/10.3233/JAD-181144.
REFERENCES
[1] | Prince M , Comas-Herrera A , Knapp M , Guerchet M , Karagiannidou M ((2016) ) World Alzheimer Report 2016. Improving healthcare for people living with dementia: Coverage, quality and costs now and in the future. Alzheimer’s Disease International, London, UK. |
[2] | Alzheimer’s Association ((2017) ) 2017 Alzheimer’s disease facts and figures. Alzheimers Dement 13: , 325–373. |
[3] | Selkoe DJ , Hardy J ((2016) ) The amyloid hypothesis of Alzheimer’s disease at 25 years. EMBO Mol Med 8: , 595–608. |
[4] | Wallin C , Luo J , Jarvet J , Wärmländer KTS , Gräslund A ((2017) ) The amyloid-β peptide in amyloid formation processes: Interactions with blood proteins and naturally occurring metal ions. Israel J Chem 57: , 674–685. |
[5] | Tiiman A , Jarvet J , Graslund A , Vukojevic V ((2015) ) Heterogeneity and turnover of intermediates during amyloid-beta (Abeta) peptide aggregation studied by fluorescence correlation spectroscopy. Biochemistry 54: , 7203–7211. |
[6] | Naiki H , Higuchi K , Hosokawa M , Takeda T ((1989) ) Fluorometric determination of amyloid fibrils in vitro using the fluorescent dye, thioflavin T1. Anal Biochem 177: , 244–249. |
[7] | LeVine H 3rd ((1999) ) Quantification of beta-sheet amyloid fibril structures with thioflavin T. Methods Enzymol 309: , 274–284. |
[8] | Biancalana M , Koide S ((2010) ) Molecular mechanism of Thioflavin-T binding to amyloid fibrils. Biochim Biophys Acta 1804: , 1405–1412. |
[9] | Freire S , de Araujo MH , Al-Soufi W , Novo M ((2014) ) Photophysical study of Thioflavin T as a fluorescence marker of amyloid fibrils. Dyes Pigm 110: , 97–105. |
[10] | Singh PK , Mora AK , Nath S ((2015) ) Ultrafast fluorescence spectroscopy reveals a dominant weakly-emissive population of fibril bound thioflavin-T. Chem Commun (Camb) 51: , 14042–14045. |
[11] | Kuznetsova IM , Sulatskaya AI , Maskevich AA , Uversky VN , Turoverov KK ((2016) ) High fluorescence anisotropy of Thioflavin T in aqueous solution resulting from its molecular rotor nature. Anal Chem 88: , 718–724. |
[12] | Wolfe LS , Calabrese MF , Nath A , Blaho DV , Miranker AD , Xiong Y ((2010) ) Protein-induced photophysical changes to the amyloid indicator dye thioflavin T. Proc Natl Acad Sci U S A 107: , 16863–16868. |
[13] | Oh ES , Troncoso JC , Fangmark Tucker SM ((2008) ) Maximizing the potential of plasma amyloid-beta as a diagnostic biomarker for Alzheimer’s disease. Neuromolecular Med 10: , 195–207. |
[14] | Toledo JB , Shaw LM , Trojanowski JQ ((2013) ) Plasma amyloid beta measurements - a desired but elusive Alzheimer’s disease biomarker. Alzheimers Res Ther 5: , 8. |
[15] | O’Bryant SE , Mielke MM , Rissman RA , Lista S , Vanderstichele H , Zetterberg H , Lewczuk P , Posner H , Hall J , Johnson L , Fong YL , Luthman J , Jeromin A , Batrla-Utermann R , Villarreal A , Britton G , Snyder PJ , Henriksen K , Grammas P , Gupta V , Martins R , Hampel H ; Biofluid Based Biomarker Professional Interest Area ((2017) ) Blood-based biomarkers in Alzheimer disease: Current state of the science and a novel collaborative paradigm for advancing from discovery to clinic. Alzheimers Dement 13: , 45–58. |
[16] | Blennow K ((2017) ) A review of fluid biomarkers for Alzheimer’s disease: Moving from CSF to blood. Neurol Ther 6: , 15–24. |
[17] | Counts SE , Ikonomovic MD , Mercado N , Vega IE , Mufson EJ ((2017) ) Biomarkers for the early detection and progression of Alzheimer’s disease. Neurotherapeutics 14: , 35–53. |
[18] | DeMarshall CA , Nagele EP , Sarkar A , Acharya NK , Godsey G , Goldwaser EL , Kosciuk M , Thayasivam U , Han M , Belinka B , Nagele RG , Alzheimer’s Disease Neuroimaging Initiative ((2016) ) Detection of Alzheimer’s disease at mild cognitive impairment and disease progression using autoantibodies as blood-based biomarkers. Alzheimers Dement (Amst) 3: , 51–62. |
[19] | Wu J , Li L ((2016) ) Autoantibodies in Alzheimer’s disease: Potential biomarkers, pathogenic roles, and therapeutic implications. J Biomed Res 30: , 361–372. |
[20] | Saint-Aubert L , Lemoine L , Chiotis K , Leuzy A , Rodriguez-Vieitez E , Nordberg A ((2017) ) Tau PET imaging: Present and future directions. Mol Neurodegener 12: , 19. |
[21] | Garibotto V , Herholz K , Boccardi M , Picco A , Varrone A , Nordberg A , Nobili F , Ratib O , Geneva Task Force for the Roadmap of Alzheimer’s Biomarkers ((2017) ) Clinical validity of brain fluorodeoxyglucose positron emission tomography as a biomarker for Alzheimer’s disease in the context of a structured 5-phase development framework. Neurobiol Aging 52: , 183–195. |
[22] | Chiotis K , Saint-Aubert L , Boccardi M , Gietl A , Picco A , Varrone A , Garibotto V , Herholz K , Nobili F , Nordberg A , Geneva Task Force for the Roadmap of Alzheimer’s Biomarkers ((2017) ) Clinical validity of increased cortical uptake of amyloid ligands on PET as a biomarker for Alzheimer’s disease in the context of a structured 5-phase development framework. Neurobiol Aging 52: , 214–227. |
[23] | Andreasen N , Sjogren M , Blennow K ((2003) ) CSF markers for Alzheimer’s disease: Total tau, phospho-tau and Abeta42. World J Biol Psychiatry 4: , 147–155. |
[24] | Hu WT , Watts KD , Shaw LM , Howell JC , Trojanowski JQ , Basra S , Glass JD , Lah JJ , Levey AI ((2015) ) CSF beta-amyloid 1-42 - what are we measuring in Alzheimer’s disease? Ann Clin Transl Neurol 2: , 131–139. |
[25] | Lewczuk P , Lelental N , Spitzer P , Maler JM , Kornhuber J ((2015) ) Amyloid-beta 42/40 cerebrospinal fluid concentration ratio in the diagnostics of Alzheimer’s disease: Validation of two novel assays. J Alzheimers Dis 43: , 183–191. |
[26] | Vukojevic V , Heidkamp M , Ming Y , Johansson B , Terenius L , Rigler R ((2008) ) Quantitative single-molecule imaging by confocal laser scanning microscopy. Proc Natl Acad Sci U S A 105: , 18176–18181. |
[27] | Elson EL ((2001) ) Fluorescence correlation spectroscopy measures molecular transport in cells. Traffic 2: , 789–796. |
[28] | Vukojevic V , Pramanik A , Yakovleva T , Rigler R , Terenius L , Bakalkin G ((2005) ) Study of molecular events in cells by fluorescence correlation spectroscopy. Cell Mol Life Sci 62: , 535–550. |
[29] | Rigler R ((2010) ) Fluorescence and single molecule analysis in cell biology. Biochem Biophys Res Commun 396: , 170–175. |
[30] | Elson EL ((2011) ) Fluorescence correlation spectroscopy: Past, present, future. Biophys J 101: , 2855–2870. |
[31] | Elson EL ((2013) ) Brief introduction to fluorescence correlation spectroscopy. Methods Enzymol 518: , 11–41. |
[32] | Rigler R , Widengren J ((2018) ) Fluorescence-based monitoring of electronic state and ion exchange kinetics with FCS and related techniques: From T-jump measurements to fluorescence fluctuations. Eur Biophys J 47: , 479–492. |
[33] | Elson EL ((2018) ) Introduction to fluorescence correlation spectroscopy-Brief and simple. Methods 140-141: , 3–9. |
[34] | Chauhan A , Pirttila T , Chauhan VP , Mehta P , Wisniewski HM ((1998) ) Aggregation of amyloid beta-protein as function of age and apolipoprotein E in normal and Alzheimer’s serum. J Neurol Sci 154: , 159–163. |
[35] | Griffin MD , Wilson LM , Mok YF , Januszewski AS , Wilson AM , Karschimkus CS , Romas E , Lee AB , Godfrey T , Wong M , Clemens L , Jenkins AJ , Howlett GJ ((2010) ) Thioflavin T fluorescence in human serum: Correlations with vascular health and cardiovascular risk factors. Clin Biochem 43: , 278–286. |
[36] | Tapiola T , Alafuzoff I , Herukka SK , Parkkinen L , Hartikainen P , Soininen H , Pirttila T ((2009) ) Cerebrospinal fluid beta-amyloid 42 and tau proteins as biomarkers of Alzheimer-type pathologic changes in the brain. Arch Neurol 66: , 382–389. |
[37] | Sole-Domenech S , Sjovall P , Vukojevic V , Fernando R , Codita A , Salve S , Bogdanovic N , Mohammed AH , Hammarstrom P , Nilsson KP , LaFerla FM , Jacob S , Berggren PO , Gimenez-Llort L , Schalling M , Terenius L , Johansson B ((2013) ) Localization of cholesterol, amyloid and glia in Alzheimer’s disease transgenic mouse brain tissue using time-of-flight secondary ion mass spectrometry (ToF-SIMS) and immunofluorescence imaging. Acta Neuropathol 125: , 145–157. |
[38] | Horrocks MH , Lee SF , Gandhi S , Magdalinou NK , Chen SW , Devine MJ , Tosatto L , Kjaergaard M , Beckwith JS , Zetterberg H , Iljina M , Cremades N , Dobson CM , Wood NW , Klenerman D ((2016) ) Single-molecule imaging of individual amyloid protein aggregates in human biofluids. ACS Chem Neurosci 7: , 399–406. |
[39] | Groenning M ((2010) ) Binding mode of Thioflavin T and other molecular probes in the context of amyloid fibrils-current status. J Chem Biol 3: , 1–18. |
[40] | Mathis CA , Mason NS , Lopresti BJ , Klunk WE ((2012) ) Development of positron emission tomography beta-amyloid plaque imaging agents. Semin Nucl Med 42: , 423–432. |
[41] | Svedberg MM , Rahman O , Hall H ((2012) ) Preclinical studies of potential amyloid binding PET/SPECT ligands in Alzheimer’s disease. Nucl Med Biol 39: , 484–501. |
[42] | Svedberg MM , Hellström-Lindahl E , Rahman O , Hall H ((2012) ) Amyloid imaging PET ligands as biomarkers for Alzheimer’s disease: Preclinical evaluation. In Positron Emission Tomography: Current Clinical and Research Aspects, Hsieh C-H, ed. InTech, Rijeka, Croatia, pp. 255–274. |
[43] | Cohen SI , Linse S , Luheshi LM , Hellstrand E , White DA , Rajah L , Otzen DE , Vendruscolo M , Dobson CM , Knowles TP ((2013) ) Proliferation of amyloid-beta42 aggregates occurs through a secondary nucleation mechanism. Proc Natl Acad Sci U S A 110: , 9758–9763. |
[44] | Lindgren M , Hammarstrom P ((2010) ) Amyloid oligomers: Spectroscopic characterization of amyloidogenic protein states. FEBS J 277: , 1380–1388. |
[45] | Luo J , Warmlander SK , Graslund A , Abrahams JP ((2014) ) Alzheimer peptides aggregate into transient nanoglobules that nucleate fibrils. Biochemistry 53: , 6302–6308. |
[46] | Luo J , Warmlander SK , Graslund A , Abrahams JP ((2017) ) Cross-interactions between the Alzheimer disease amyloid-beta peptide and other amyloid proteins. A further aspect of the amyloid cascade hypothesis. J Biol Chem 292: , 2046. |
[47] | Chang L , Rissin DM , Fournier DR , Piech T , Patel PP , Wilson DH , Duffy DC ((2012) ) Single molecule enzyme-linked immunosorbent assays: Theoretical considerations. J Immunol Methods 378: , 102–115. |
[48] | Rissin DM , Kan CW , Campbell TG , Howes SC , Fournier DR , Song L , Piech T , Patel PP , Chang L , Rivnak AJ , Ferrell EP , Randall JD , Provuncher GK , Walt DR , Duffy DC ((2010) ) Single-molecule enzyme-linked immunosorbent assay detects serum proteins at subfemtomolar concentrations. Nat Biotechnol 28: , 595–599. |
[49] | Holtta M , Hansson O , Andreasson U , Hertze J , Minthon L , Nagga K , Andreasen N , Zetterberg H , Blennow K ((2013) ) Evaluating amyloid-beta oligomers in cerebrospinal fluid as a biomarker for Alzheimer’s disease. PLoS One 8: , e66381. |
[50] | Andreasson U , Blennow K , Zetterberg H ((2016) ) Update on ultrasensitive technologies to facilitate research on blood biomarkers for central nervous system disorders. Alzheimers Dement (Amst) 3: , 98–102. |
[51] | Nakamura A , Kaneko N , Villemagne VL , Kato T , Doecke J , Dore V , Fowler C , Li QX , Martins R , Rowe C , Tomita T , Matsuzaki K , Ishii K , Ishii K , Arahata Y , Iwamoto S , Ito K , Tanaka K , Masters CL , Yanagisawa K ((2018) ) High performance plasma amyloid-beta biomarkers for Alzheimer’s disease. Nature 554: , 249–254. |
[52] | Nabers A , Ollesch J , Schartner J , Kotting C , Genius J , Haussmann U , Klafki H , Wiltfang J , Gerwert K ((2016) ) An infrared sensor analysing label-free the secondary structure of the Abeta peptide in presence of complex fluids. J Biophotonics 9: , 224–234. |
[53] | Nabers A , Ollesch J , Schartner J , Kotting C , Genius J , Hafermann H , Klafki H , Gerwert K , Wiltfang J ((2016) ) Amyloid-beta-secondary structure distribution in cerebrospinal fluid and blood measured by an immuno-infrared-sensor: A biomarker candidate for Alzheimer’s disease. Anal Chem 88: , 2755–2762. |
[54] | Nabers A , Perna L , Lange J , Mons U , Schartner J , Guldenhaupt J , Saum KU , Janelidze S , Holleczek B , Rujescu D , Hansson O , Gerwert K , Brenner H ((2018) ) Amyloid blood biomarker detects Alzheimer’s disease. EMBO Mol Med 10: , e8763. |
[55] | Reverberi R , Reverberi L ((2007) ) Factors affecting the antigen-antibody reaction. Blood Transfus 5: , 227–240. |
[56] | Schiettecatte J , Anckaert E , Smitz J ((2012) ) Interferences in immunoassays. In Advances in Immunoassay Technology, Chiu NHL, Christopoulos TK, eds. InTech, Rijeka, Croatia, pp. 45–62. |
[57] | Saiki H ((2012) ) Detection curb. In Trends in Immunolabelled and Related Techniques, Abuelzein E, ed. InTech, Rijeka, Croatia, pp. 299–310. |
[58] | Klaver AC , Patrias LM , Finke JM , Loeffler DA ((2011) ) Specificity and sensitivity of the Abeta oligomer ELISA. J Neurosci Methods 195: , 249–254. |
[59] | Hunter S , Brayne C ((2017) ) Do anti-amyloid beta protein antibody cross reactivities confound Alzheimer disease research? J Negat Results Biomed 16: , 1. |
[60] | Lundstrom SL , Zhang B , Rutishauser D , Aarsland D , Zubarev RA ((2017) ) SpotLight Proteomics: Uncovering the hidden blood proteome improves diagnostic power of proteomics. Sci Rep 7: , 41929. |
[61] | Hirsch J , Hansen KC , Burlingame AL , Matthay MA ((2004) ) Proteomics: Current techniques and potential applications to lung disease. Am J Physiol Lung Cell Mol Physiol 287: , L1–23. |
[62] | Portelius E , Brinkmalm G , Pannee J , Zetterberg H , Blennow K , Dahlen R , Brinkmalm A , Gobom J ((2017) ) Proteomic studies of cerebrospinal fluid biomarkers of Alzheimer’s disease: An update. Expert Rev Proteomics 14: , 1007–1020. |
[63] | Nitsch RM , Rebeck GW , Deng M , Richardson UI , Tennis M , Schenk DB , Vigo-Pelfrey C , Lieberburg I , Wurtman RJ , Hyman BT , Growdon JH ((1995) ) Cerebrospinal fluid levels of amyloid beta-protein in Alzheimer’s disease: Inverse correlation with severity of dementia and effect of apolipoprotein E genotype. Ann Neurol 37: , 512–518. |
[64] | Lin YT , Cheng JT , Yao YC , Juo , Lo YK , Lin CH , Ger LP , Lu PJ ((2009) ) Increased total tau but not amyloid-beta(42) in cerebrospinal fluid correlates with short-term memory impairment in Alzheimer’s disease. J Alzheimers Dis 18: , 907–918. |
[65] | Janelidze S , Stomrud E , Palmqvist S , Zetterberg H , van Westen D , Jeromin A , Song L , Hanlon D , Tan Hehir CA , Baker D , Blennow K , Hansson O ((2016) ) Plasma beta-amyloid in Alzheimer’s disease and vascular disease. Sci Rep 6: , 26801. |
[66] | Brookmeyer R , Abdalla N ((2018) ) Estimation of lifetime risks of Alzheimer’s disease dementia using biomarkers for preclinical disease. Alzheimers Dement 14: , 981–988. |
[67] | Jack CR Jr , Knopman DS , Jagust WJ , Petersen RC , Weiner MW , Aisen PS , Shaw LM , Vemuri P , Wiste HJ , Weigand SD , Lesnick TG , Pankratz VS , Donohue MC , Trojanowski JQ ((2013) ) Tracking pathophysiological processes in Alzheimer’s disease: An updated hypothetical model of dynamic biomarkers. Lancet Neurol 12: , 207–216. |


