
Modulation of SPARC/Hevin Proteins in Alzheimer’s Disease Brain Injury
Abstract
Alzheimer’s disease (AD) is an age-related progressive form of dementia that features neuronal loss, intracellular tau, and extracellular amyloid-β (Aβ) protein deposition. Neurodegeneration is accompanied by neuroinflammation mainly involving microglia, the resident innate immune cell population of the brain. During AD progression, microglia shift their phenotype, and it has been suggested that they express matricellular proteins such as secreted protein acidic and rich in cysteine (SPARC) and Hevin protein, which facilitate the migration of other immune cells, such as blood-derived dendritic cells. We have detected both SPARC and Hevin in postmortem AD brain tissues and confirmed significant alterations in transcript expression using real-time qPCR. We suggest that an infiltration of myeloid-derived immune cells occurs in the areas of diseased tissue. SPARC is highly expressed in AD brain and collocates to Aβ protein deposits, thus contributing actively to cerebral inflammation and subsequent tissue repair, and Hevin may be downregulated in the diseased state. However, further research is needed to reveal the exact roles of SPARC and Hevin proteins and associated signaling pathways in AD-related neuroinflammation. Nevertheless, normalizing SPARC/Hevin protein expression such as interdicting heightened SPARC protein expression may confer a novel therapeutic opportunity for modulating AD progression.
INTRODUCTION
Alzheimer’s disease (AD) is the most common type of senile dementia characterized by progressive neurodegeneration and concomitant cognitive impairment. The pathological hallmarks of the AD brain are intracellular neurofibrillary tangles (NFTs) of hyperphosphorylated tau proteins and extracellular amyloid-β (Aβ) protein deposits (senile plaques) caused by aggregates of Aβ proteins [1, 2]. Furthermore, cerebral inflammation is also a salient feature of AD pathology. Aβ accumulation constitutes activation of resident immune cells that initiate and orchestrate the inflammatory response, triggered by mediators such as cytokines or chemokines [2, 3]. Microglia are the resident macrophage population in the brain [4] with multiple functions, including: immune surveillance, cytokine secretion, scavenging, and phagocytosis [5–8]. In their activated state, microglia possess characteristics similar to other blood-derived cells, such as macrophages or dendritic cells (DCs), which have been suggested to contribute to neuroinflammation [9–11]. There is indication that microglia shift to DC-like cells [12], potentially having a pivotal role in antigen-presentation and initiation of the immune response. Alternatively, DCs could extravasate from the blood and infiltrate the brain tissue [13]. Due to compromises of the blood-brain barrier (BBB) in AD, not only DCs but also systemic macrophages may invade the diseased brain tissue [14].
In the present study, we propose SPARC and Hevin/SPARC-like 1 as key players for recognition of cell defects associated with AD and modulators for the initiation of cerebral inflammation in the AD brain. Both SPARC and Hevin belong to the matricellular protein family SPARC [15, 16]. These extracellular matrix (ECM) proteins possess modulating functions rather than structural ones [17, 18]. In animal studies, SPARC and Hevin were demonstrated to interact with each other in healthy brain tissue by regulating synapse stability [19, 20], as well as signal events that are necessary for tissue remodeling [21–24]. In AD brain, this interaction is impaired. SPARC induces ECM remodeling for cell adhesion, migration, and proliferation [5, 25–27], thus facilitating a potentiation of inflammation and consequential tissue repair [5, 25]. SPARC expression was shown to be restricted to microglia and some subcortical astrocytes in the adult brain [5, 28], suggesting that upregulation of SPARC might be triggering the neuroimmune response in AD. In this study we examined the expression of SPARC and Hevin in both human AD and control cases, and aimed to determine the cell types that express the respective proteins. Intriguingly, we came to different conclusions for the human AD brain as opposed to the controls. We are interested in investigating postmortem brain tissue with respect to altered protein expression, and examining whether microglia and/or DCs potentiate inflammation via expression of SPARC and Hevin. We suggest that protein expression by DC-like microglia, infiltrated DCs, and macrophages demonstrates a regulating role of SPARC in regards to the clearance of AD-specific hallmarks.
MATERIALS AND METHODS
Subjects: Case selection and neuropathologic assessment
Tissue samples from AD and control cases were obtained from the Massachusetts Alzheimer’s Disease Research Center (MADRC) at Massachusetts General Hospital. Brain tissues from selected donor autopsies performed at Massachusetts General Hospital are accompanied by the reports generated by the Neuropathology Core of the MADRC. These reports include neuropathology diagnosis of AD-associated changes and descriptive clinical information on the severity of neurological signs and symptoms of AD-associated cognitive decline. The study subjects and their next of kin gave written informed consent for the brain donation, and the Massachusetts General Hospital Institutional Review Board approved the study protocol. The subjects fulfilled the National Institute of Neurological and Communicative Disorders and Stroke, Alzheimer’s Disease and Related Disorders Association criteria for probable AD and the National Institute on Aging-Reagan criteria for high likelihood of AD. For this study, only AD brains with Braak stage 6 were chosen from the brain bank. Sections were collected from frozen, non-fixed tissue blocks of temporal cortex and were selected according to tissue quality. AD status was assessed using immunohistochemistry and immunofluorescence (detection of senile plaques and NFTs). In total, 12 AD and 12 control cases were investigated, both of which included 6 female brains and 6 male brains. For AD, the ages ranged between 39–77 years old and mean age of death was 62 (Table 1). Despite the broad age range, the selected patients were not considered early onset cases as Braak staging and histopathological assessment showed clear signs of progressed diseased and protein deposits in isocortical areas. Likewise, the control samples were chosen in the same region and had to be from cases where death was caused by non-neurological and non-systemic diseases (Table 1). The mean age at death for the control cases was 72 years (age range 47–95). Variation in age at death in AD and the control cases was determined by the Mann-Whitney U test, showing no significant differences.
Table 1
Selection of AD and control cases
| AD cases | Control cases | ||||
| Case no. | Age at death | Gender | Case no. | Age at death | Gender |
| 1 | 56 | M | 13 | 85 | M |
| 2 | 60 | M | 14 | 95 | F |
| 3 | 63 | M | 15 | 93 | M |
| 4 | 64 | M | 16 | 56 | F |
| 5 | 58 | F | 17 | 57 | M |
| 6 | 69 | F | 18 | 60 | M |
| 7 | 72 | F | 19 | 82 | M |
| 8 | 39 | M | 20 | 86 | F |
| 9 | 57 | M | 21 | 92 | F |
| 10 | 77 | F | 22 | 47 | M |
| 11 | 62 | F | 23 | 42 | F |
| 12 | 65 | F | 24 | 55 | F |
Confocal microscopy and double-immunofluorescence staining (for SPARC/Hevin and neurons, astrocytes, microglia/macrophages/dendritic cells)
Frozen tissue blocks from the temporal cortex were sectioned at 8–10 micron thickness using a cryostat microtome. Tissue slides were fixed in 75% ethanol and blocked with 3% BSA and 5% normal goat serum at 37°C for 15 min. Immunofluorescence staining was achieved by incubating the sections with primary antibodies against intracellular and extracellular SPARC (Santa Cruz Biotechnology) or Hevin (Santa Cruz Biotechnology), followed by labeling these proteins using secondary Alexa Fluor antibodies (Life Technologies). After washing the slides with PBS, sections were co-stained for neuronal and inflammatory cells using markers against NeuN, GFAP, Iba-1, CD11b, and CD83 (primary and secondary antibody combination cf. Table 2). Eventually, slides were mounted using Vectashield mounting medium (Vector Laboratories). Tissue slides were imaged on the Olympus BX51 microscope (Olympus) and/or the Leica True Confocal Scanner (Leica Microsystems). Lipofuscin autofluorescence, which is typically seen in immunofluorescence images of brain tissue from elderly individuals, is visible in both the control and AD tissue. Lipofuscin is highly autofluorescent and difficult to avoid during image acquisition due to its broad emission spectrum (360–647 nm). To ensure that positive signal from protein staining is specific and not lipofuscin autofluorescence, images were also taken under UV excitation. Ultimately, overlaying all channels allowed to discern true positive staining signal from lipofuscin-induced autofluorescence. Through the Olympus microscope, lipofuscin appeared in red, whereas through the confocal scanner it was visible in yellow.
Table 2
Antibody overview
| Target | Species | Antibodies | Host | Source |
| SPARC, C-term. | Human | Polyclonal | Goat | Santa Cruz, sc-13324 |
| SPARC, N-term. | Human | Polyclonal | Mouse | Santa Cruz, sc-74295 |
| Hevin | Human | Monoclonal | Mouse | Santa Cruz, sc-390199 |
| GFAP | Human, Cow | Polyclonal | Rabbit | DAKO, Z0334 |
| NeuN | Human, Mouse, Rat | Polyclonal | Rabbit | Abcam Inc., ab104225 |
| Iba-1 | Human, Mouse, Rat | Polyclonal | Rabbit | Wako, 019-19741 |
| CD11b | Human, Monkey | Monoclonal | Mouse | Abcam Inc., ab34216 |
| CD83 | Human | Monoclonal | Mouse | Bio-Rad, MCA1582 |
| Tau protein | Human, Mouse, Cow | Polyclonal | Rabbit | Abcam Inc., ab64193 |
| Alexa Fluor 488 | Goat | Polyclonal | Rabbit | Life Tech., A21222 |
| Alexa Fluor 488 | Mouse | Polyclonal | Goat | Life Tech., A11001 |
| Alexa Fluor 568 | Rabbit | Polyclonal | Goat | Life Tech., A21069 |
Confocal microscopy and immunofluorescence staining (for Aβ and SPARC/Hevin protein)
Tissue sections were prepared and incubated with primary antibodies (dilution 1:50) against either SPARC or Hevin and secondary antibodies (Alexa Fluor 488, dilution 1:200). After incubation with the Alexa Fluor 488 antibody, the tissue was counterstained with 0.1% -filtered thioflavin-S (Sigma-Aldrich) and incubated at room temperature for 2-3 min. Thioflavin S was dissolved in distilled water and filtered via a 0.22 micron sterile filter. Finally, slides were mounted using Vectashield mounting medium (Vector Laboratories) and imaged on the Olympus BX51 microscope at 60X magnification. SPARC and Hevin (appearing in green), and thioflavin-S staining (blue in the UV channel) were imaged to verify whether SPARC or Hevin expression occurred near Aβ plaques.
Immunofluorescence/-peroxidase staining (for Aβ, SPARC and Iba-1)
Frozen tissue sections were fixed and blocked before the primary mouse anti-human SPARC antibody (Santa Cruz Biotechnology) was applied at 1:50 and incubated for 60 min at 37°C. Likewise, after washing with PBS, the secondary goat anti-mouse Alexa Fluor 488 (Life Technologies) antibody was added 1:200 and incubated for 45 min. Following mounting with PBS, images were taken with a dual filter using the Olympus microscope. Thereafter, Aβ plaques were stained with thioflavin S. After treatment with 80% ethanol and distilled water, slides were mounted with PBS and microscopically examined using a UV filter. After removal of the coverslips, 1% H2O2 was added to the sections for 5 min. Following a rinse with PBS, slides were incubated with rabbit anti-Iba-1 antibody at 1:50 at 37°C for 45 min. Subsequent to wash steps with PBS, goat anti-rabbit secondary antibodies (Life Technologies) were applied and slides were incubated likewise. Slides were then washed in distilled water and calorimetrically developed using a DAB staining kit solution (Vector Laboratories). Afterward, slides were dehydrated and cleared through a graded ethanol series (50%–100%) into xylene before they were mounted using Vectashield mounting medium (Vector Laboratories). Eventually, Iba-1 positive microglia were located in the sections and white-light photographed (Olympus BX51).
Laser capture microdissection (LCM)
Frozen tissue sections were lightly fixed in 70% ethanol for 40 seconds. Next, the sections were incubated in 95% and 70% ethanol (each for 2 min), followed by a quick rinse in distilled water before being stained with 0.1% -filtered thioflavin T (Sigma-Aldrich) for 5 min. After brief washes in 80% ethanol and water, the sections were incubated in a toluidine blue solution (Applied Biosystems) for 1 min, followed by dehydration in increasingly concentrated ethanol and xylene solutions prior to microdissection. All incubations were carried out at room temperature. Pre-selected control and plaques-bearing tissue were sectioned onto glass microscope slides (by LCM) and stained via the described methods. Following dehydration through the graded ethanol series, slides were placed in xylene for 5 min, air-dried, and placed into a desiccation chamber prior to LCM. Complete dehydration is a prerequisite for LCM using the Arcturus Pixcell IIe platform. For LCM, the Arcturus Pixcell IIe system was set to deliver a 750 ms duration laser pulse of 65 mW so that a 15-micron diameter spot was produced on macro collecting caps (Arcturus CapSure, Applied Biosystems). Each cap was used to collect small plaques-bearing areas from diseased tissue and small plaques-free areas from control tissue. For qPCR, total RNA was extracted and isolated using the PicoPure RNA Isolation Kit (Arcturus, Applied Biosystems) and reverse transcribed using SuperScript III RT (Invitrogen).
Real-time qPCR
Initially, qPCR analysis of the cDNA product was carried out using a standard panel of housekeeping gene primers including β-actin, tubulin, GAPDH, and 18 S ribosomal RNA. For purposes of assuring the integrity of LCM RNA preparations, we compared newly acquired, plaque regional LCM samples to the PCR activity (cycle number, primer-dimer formation, melt curve analysis) of a standardized control brain cDNA library isolated via LCM. We utilized a real time PCR system (Bio-Rad iCycler) and employed SYBR green mastermix (Bio-Rad Laboratories, Inc.) and 25μl reaction volumes. Real-time qPCR amplification was for 42 cycles: 30 s at 95°C, 60 s at 55°C, and 90 s at 72°C.
For analysis, triplicate samples of cDNA from each LCM sample were probed with human sequence primer sets directed against SPARC (forward: 5-AGCACCCCATT-GACGGGTA-3; reverse: 5-GGTCACAGGTCTCGAAAAAGC-3) and Hevin (forward: 5-GACCAACAGGGAAAACCTCA-3; reverse: 5-TGCAGGCTCCAAAATAATCC-3). Resulting values were normalized to the GAPDH gene (forward: 5-GAGTCAACGGATTTGGTCGT-3; reverse: 5-TGGAAGATGGTGATGGGATT-3). Fold change values were calculated by using control cortex values as reference calibrators and by using the Livak method. A serial dilution experiment resulted in average PCR efficiencies of 94% (R2 value: 0.99) for SPARC primers and 91% (R2 value: 0.99) for Hevin primers.
RESULTS
SPARC and Hevin expression in astrocytes and neurons
Animal studies on the expression of SPARC and Hevin contributed to a better understanding of the protein function and helped determine the protein-expressing cell type. As for SPARC, astrocytes and microglia have been suggested as expressers [28, 29], but neuronal expression was excluded [30]. In contrast, Hevin expression was attributed to astrocytes and neurons, but not to microglia [28, 31]. Based on the aforementioned findings, we double-stained tissue sections for SPARC/Hevin and the astrocytic marker GFAP. Figure 1a shows SPARC (green) and astrocytes (red) in AD Braak 6 and control cases. Generally, we did not observe any noticeable variances in gene and protein expression related to differences in age, or sex within the groups. Despite the presence of an activated astrocyte (arrowhead Fig. 1a B) in AD tissue (image series A–C), SPARC expression was not associated with astrocytes. When scanning the entire tissue section under the microscope, SPARC appeared only at certain loci of the cortex samples and showed elevated amounts when compared to the controls. Similar results were found for Hevin (Fig. 1b A–C), with the notable exceptions that the amount of protein decreased and that expression was detected throughout the tissue. Hevin is localized in blood vessels and in close proximity to neurons, and is detectable by the presence of lipofuscin, which is secreted by neurons (arrowheads in Fig. 1b C). The open arrowhead in Fig. 1b C gives proof that astrocytes are not Hevin positive. Control tissue did not feature any association of SPARC (Fig. 1a D–F) or Hevin (Fig. 1b D–F) with astrocytes. Interestingly, by only studying the AD tissue, Hevin levels were lower than in control cases, suggesting a downregulation during disease. Regarding expression by neurons (marked with anti-NeuN), neither SPARC nor Hevin showed any association. Hence, as was presented for mice, we confirmed the incapability of neurons to express SPARC in human tissue (data not shown). Against expectations, Hevin immunoreactivity (arrowheads) with neurons was disproved for both AD (Fig. 2A–C) and control tissue (Fig. 2D–F). In summary, both SPARC and Hevin are not expressed by astrocytes or neurons. SPARC is found elevated only in AD cases and there is indication that Hevin may be downregulated in the diseased state. This altered SPARC/Hevin protein expression may contribute to synaptic dysfunction in AD brain as SPARC and Hevin are negative and positive regulators of synaptogenesis, respectively [19, 20].
Fig.1
a) Immunostaining of SPARC and astrocytes in AD (images A–C) and control tissue (images D–F). Series A–C depicts increased AD-associated SPARC expression as compared to control tissue. The extracellular distribution of SPARC (arrowheads in A) is not associated with reactive AD astrocytic GFAP expression (arrowhead in B). Images D–F show that extracellular SPARC (arrowhead in D) is not associated with quiescent control astrocytes (arrowheads in E). Lipofuscin fluoresces in both the red and green channels and appears yellow in the merged images (arrowhead in G and F). b) Immunostaining of Hevin and astrocytes in AD (images A–C) and control tissue (images D–F). Hevin is expressed to a lesser extent in AD samples and is clearly not associated with astrocytic activity, cf. arrowheads in image C. Instead, astrocytes seem to gather around neurons (arrowhead, image C) and blood vessels (open arrowhead, image C). Control tissue has distinct Hevin positive cells that are likely to be neurons (arrowhead, image F) and other cell types (open arrowhead, image F). Yellow structures in C and F are lipofuscin in degenerate neurons or extracellular deposits.
Fig.2
Immunostaining of Hevin and neurons in AD (images A–C) and control tissue (images D–F). Despite the proposal that Hevin is expressed by neurons, all of the images show cell types (arrowheads) other than neurons.
SPARC and Hevin expression in immune cells
Microglia are the resident immune cell population of the brain and were thought to be the exclusive population of the local innate immune system. Today, there is increasing evidence that other blood-derived immune cells, such as macrophages and DCs might extravasate into diseased or injured tissue. Microglia are Iba-1- and CD11b-positive. Although CD11b (or type 3 complement receptor, CR3) is present on activated microglia [32], it is in addition a marker for myeloid-derived macrophages and migrating DCs [33]. High-level expression of CD11b facilitates increased cellular adhesiveness to vascular endothelium, thus initiating the extravasation of myeloid cells into the inflamed tissue. To detect activated mature DCs with the ability of priming naive T-cells, a suitable marker is CD83 [34]. This surface molecule helps differentiate between immature DCs (iDCs) and mature DCs (mDCs). As CD83 + cells are also CCR7 + (a chemotactic receptor), there is indication that mDCs travel to the lymphatic system where they induce a primary immune response by antigen-presentation to T- and B-cells. Figure 3a A demonstrates SPARC+/CD11b + immunoreactivity in AD tissue, adumbrating activated hypertrophied microglia or activated macrophages expressing SPARC and taking care of damaged neurons. The detection of lipofuscin is indicative of the presence of (former) neurons or neuronal debris. SPARC+/CD83 + cells (Fig. 3a B) were found in AD tissues where they were distributed to a lower amount as compared to CD11b + cells. SPARC was positively colocalized to CD83, indicating that mDCs possess the property of SPARC expression (Fig. 3b). In control cases (not shown), CD83 + cells were restricted to expression in vasculature, suggesting an intact BBB function. Moreover, only the resting microglia showed CD11b positivity in controls, which is an indication of their regular tissue-scavenging function.
Fig.3
a) Immunostaining of SPARC positive cells in AD tissue. A: CD11b positive macrophages colocalized and associated with SPARC expression. B: CD83 positive cell expressing SPARC. b) Colocalization of SPARC and CD83, demonstrating the ability of dendritic cells to induce SPARC expression. This image shows the diseased state. Controls (not shown) do not exhibit such expression patterns.
Double staining against Hevin and CD11b/CD83 resulted in images that showed a clear association of Hevin with immune cells. Hevin+/CD11b + cells were detected throughout AD tissue; however, they were detected in a much lower abundance than SPARC+/CD11b+. In accordance with published data, microglia lacked the ability to produce Hevin [28, 31]. Based on the relatively big cell size observed in our studies, Hevin+/CD11b + cells are proposed to be activated macrophages (Fig. 4a). Moreover, there are lipofuscin vesicles in close proximity, indicating a pre-existence of neurons. Arrowheads in Fig. 4b A highlight the densely distributed Hevin that is associated with the CD11b immunoreactivity and may be involved in tissue remodeling processes. This finding was further confirmed in Fig. 4b B that features lipofuscin vesicles (from pre-existing neurons) in close proximity to Hevin+/CD11b + cells (arrowheads). Figure 4b B shows CD11b+cells (indicated by asterisks) that actively express Hevin around pathologic areas (arrowhead), and this expression confirms the tissue remodeling characteristics. Compared to AD tissue, the control tissue featured only slightly increased amounts of Hevin, which, was mainly expressed in the grey but not the white matter. Interestingly, Hevin expression was not limited to diseased areas but was also detected in oddly shaped patterns, as demonstrated in Fig. 4c. Hevin+/CD11b + cells were located within those same structures and expressed Hevin extensively, which was highlighted by the arrowheads. As mentioned, UV exposure helped to differentiate lipofuscin from a positive signal, as presented in Fig. 4c B. When comparing the images of CD11b and UV/lipofuscin it becomes clear that the yellow color in Fig. 4c A is a result of overlapping Hevin and CD11b signal. Control cases did not have those staining patterns. In addition, AD tissue revealed the presence of paired immunoreactive cells, one being Hevin+, and the other being CD11b + (Fig. 4d A, B). Intriguingly, these cells seemed to interact strongly, as the cell-to-cell interactions appeared in yellow color (Fig. 4d B). Lipofuscin was detected around the cells but without association to either CD11b or Hevin expression. As for DCs, Hevin showed very little immunoreactivity with CD83 (Fig. 4e) and reacted in only a few AD cases. Since most AD samples were free of CD83 + cells, we concluded, despite the indication of positive Hevin expression by CD83 + cells, that mDCs are not the major cell population expressing Hevin.
Fig.4
a) CD11b positive cell expressing Hevin in AD tissue. Colocalization is indicated by color overlay, highlighted here by white arrowheads. Based on the cell-size this cell could be a macrophage. b) Hevin expression in AD tissue. A: Hevin is expressed in areas where lipofuscin is detectable – an indication of active macrophages taking care of dying neurons and neuronal debris. B: But Hevin is also detected around plaques (arrowhead). CD11b positive microglia (asterisks) are located in pathological areas. We suggest that Hevin induces alternative activation of microglia for tissue repair. c) A: Hevin positive structures contain CD11b positive cells that, at the same time, are strongly Hevin positive, indicated by arrowheads. B: Lipofuscin is not associated with Hevin positivity. Arrowheads highlight a Hevin+/CD11b + cell that is free of lipofuscin as the yellow signal disappears upon UV exposure. d) Cells that show different expression of specific cell markers. C demonstrates Hevin immunoreactivity, whereas D is positive for CD11b. B is an enlarged view at the cells from A. The yellow-appearing color suggests a strong interaction of both cells. e) Activated dendritic cell in AD tissue. CD83 immunoreactivity gave proof of the presence of DCs in the brain. Hevin expression as shown in B, however, cannot be correlated to DCs. Hevin positivity in respect to CD83 was neglected although image A appears to show Hevin positivity in the overlay. Overlooking the brain sections, there was hardly any Hevin immunoreactivity.
As mentioned before, Hevin expression is decreased in AD patients compared to the controls. However, when expressed, Hevin is found around pathologic areas. Here, Hevin is proposed to be expressed mainly by macrophages and to possess immune-modulating properties, especially in the conception of injury repair and tissue remodeling. SPARC, by contrast, is expressed by microglia and macrophages, but is not restricted to either cell type. mDCs can also express SPARC, suggesting that its role is in acute inflammation and modulation of the immune response. The high protein levels during disease confirm the results from the immunostaining. It could be possible that there are distinct interactions between SPARC and Hevin; however, it remains difficult to interpret interactions only based on co-localization found in micrographs.
SPARC is colocalized to pathologic hallmarks of AD
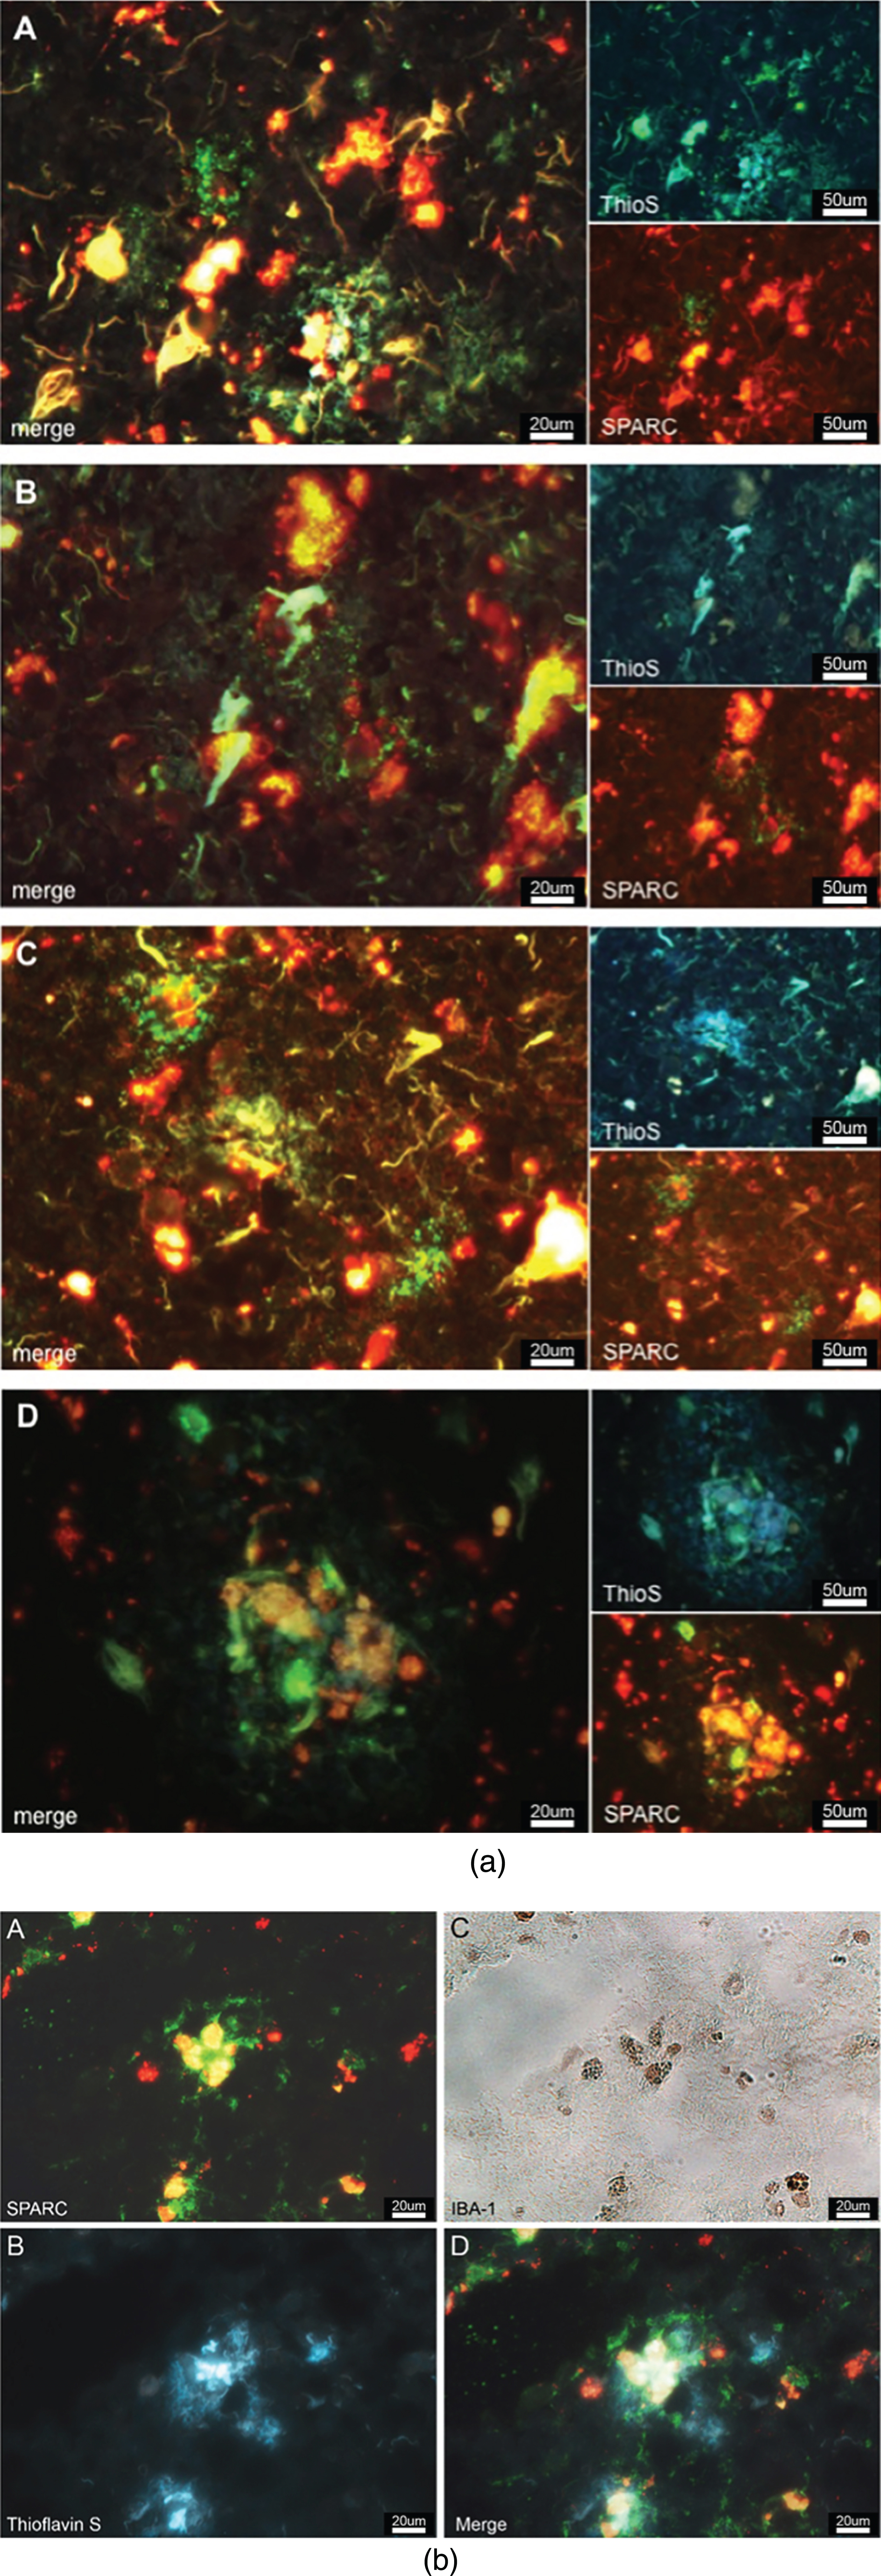
Believing that SPARC regulates microgliosis and modulates the immune response, we were interested to examine if SPARC was colocalized to the hallmarks of AD. We stained for SPARC and AD-specific plaques (using thioflavin S) and discovered that SPARC expression occurred in close proximity to AD-related protein aggregates (Fig. 5a). SPARC signal was detected next to or surrounding the plaques (Fig. 5a A–C), or right in the middle of the plaques (Fig. 5a D), suggesting that SPARC + cells are able to locate the protein deposits and modulate the immune response. The immunostainings we have performed (cf. Fig. 3a, b) showed CD11b and CD83 positivity, suggesting that SPARC expression may stem from microglia/macrophages, or mDCs, respectively. Here, we propose microglia as a key population for SPARC expression. We believe that the expression of SPARC follows a temporal manner and that other activated immune cells follow with expression upon respective stimulus. In order to corroborate SPARC’s contribution to inflammation, we applied immunofluorescence/-peroxidase staining. Figure 5b shows immunoreactive SPARC (Fig. 5b A) around microglia (confirmed in Fig. 5b C) that are in the middle of AD-related senile plaques (visualized by thioflavin S via UV-filter, Fig. 5b B).
Fig.5
a) SPARC is colocalized to amyloid plaques. SPARC expression (green) is increased around pathological protein deposits (ThioS positive structures) (A–D). To differentiate between true ThioS signal and lipofuscin autofluorescence, the SPARC channel (appearing in green) has been overlaid with the red channel (unstained, but lipofuscin autofluorescence). Image B shows dying neurons covered in plaques and surrounded by SPARC. Image D depicts immune cells accumulating in the plaques area. b) SPARC is expressed by microglia found in close proximity to pathological protein aggregates. A: Positive SPARC staining, shown in green and auto-fluorescent lipofuscin in red. B: White-light image of Iba-1 positive microglia, immunoperoxidase stain. C: Thioflavin S staining against amyloid plaques. D: Merged image of A and C at the exact same location as in B, allowing for the conclusion that microglia express SPARC and that there is an association between SPARC expression and the pathological hallmarks of Alzheimer’s disease.
Gene expression differences using real-time qPCR
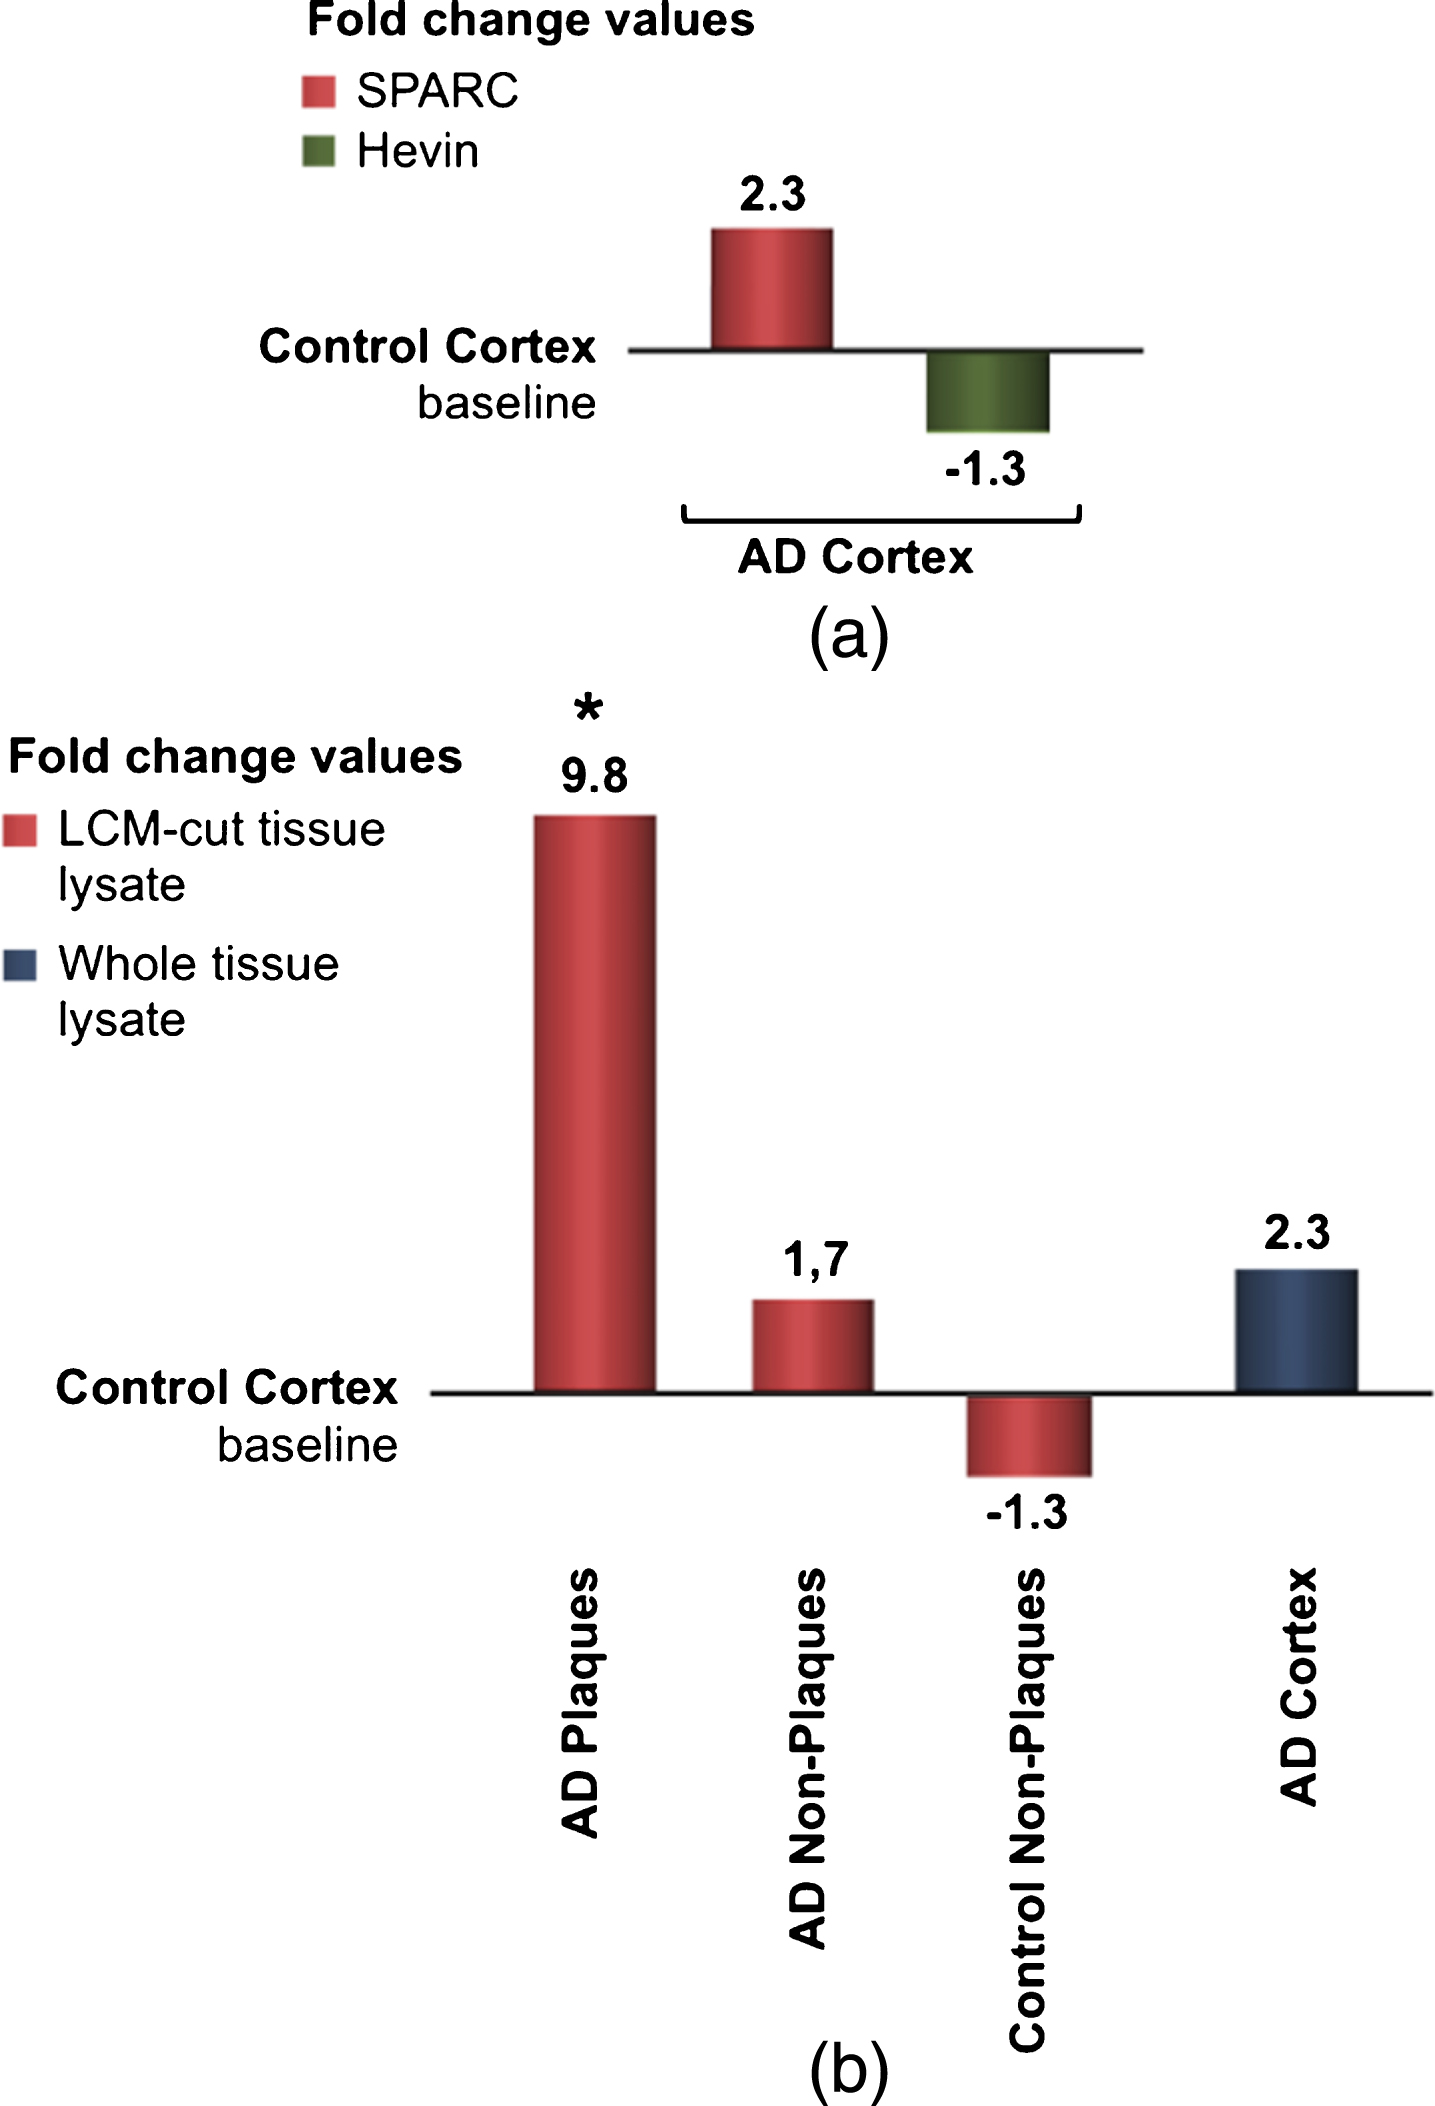
To examine the differences in gene expression during AD, real-time qPCR was applied. Figure 6a shows the results obtained from four identical experiments based on eight patients. Although statistically not significant, this data confirmed previous findings that SPARC expression is increased during AD. Since Hevin is downregulated in AD, the fold change was presented as a negative bar. Because we were interested in SPARC’s contribution to neuroinflammation, we analyzed the expression changes by microdissecting tissue from different loci of the grey matter. Presented in fold change, Fig. 6b shows the alteration in gene expression. The results were juxtaposed to the same control group as from whole tissue lysates. Control tissue is considered free of plaques, i.e., non-plaques, and should ideally be identical to the baseline. However, LCM and subsequent RNA extraction can lead to a loss of RNA integrity and quality. Comparing AD plaques-containing tissue with AD plaques-free tissue, a significant alteration in SPARC expression was detected. The real-time qPCR results confirmed the colocalization of SPARC to senile plaques and its pivotal role in the immunological changes that are present in AD brain.
Fig.6
a) qPCR results for fold-change SPARC and fold change Hevin, resulted from whole lysate tissue of AD patients. AD-specific values were normalized to endogenous genes and control values. Although statistically insignificant, SPARC appears to be up- regulated and Hevin downregulated in AD. b) SPARC is upregulated and colocalized to pathological plaques in AD patients. After microdissection (via LCM) and RNA isolation, plaques areas reveal the most potent changes. qPCR results from LCM-cut tissue is compared to values from whole lysate treatment (right bars).
DISCUSSION
SPARC and Hevin are matricellular proteins with a plethora of functions. Within the central nervous system (CNS), SPARC and Hevin contribute to the regulation of synaptogenesis [19, 20] and tissue remodeling processes after the occurrence of injury or disease [21–24, 35]. One recent study suggests that SPARC promotes the health of neurons when the CNS is damaged [36]. It is necessary to understand the protein distribution throughout the human brain in both diseased and healthy states. In this study, we demonstrated a differential expression of both SPARC and Hevin during AD. Contrary to findings in mice, neither SPARC nor Hevin expression was attributed to astrocytic activity. SPARC expression was reported in reactive human astrocytes proximal to brain tumors [37, 38] and in epilepsy [39]. This suggests that there must be another triggering mechanism or signaling event during AD.
However, it cannot be concluded that astrocytes lack the ability to produce the proteins. Research has shown that astrocytes may produce proteins that promote the production of Aβ [40]. In rats, Hevin expression was shown in the cell bodies of reactive astrocytes [41], which cannot be confirmed for AD. Since early onset of AD is characterized by changes in the midbrain, studying the protein expression in the midbrain and hindbrain regions would prove interesting.
Neuronal expression of SPARC and Hevin has mostly been studied during development [42]. Based on our investigations, we found that SPARC and Hevin are not expressed by neurons. However, our findings rely on microscopic assessment only and further experiments are necessary to certainly conclude that neurons are not expressing SPARC. But we hypothesize that due to neuronal cell loss in the course of the disease, and the increased amount of SPARC in AD cases it is most likely not the neurons expressing SPARC but immune cells. In concordance, it has been shown that SPARC and Hevin play a role in immunity and inflammation by increasing the presence and expression of macrophages [43, 44]. We hypothesized that SPARC regulated the local immune response in the brain. Therefore, microglia, macrophages, and DCs were investigated. Both resident and blood-derived macrophages have crucial functions in enabling drainage of waste and undesired products from the brain. However, resident microglia have been reported to have deficits in efficient removal of Aβ plaques [10, 45–47]. We suggest that SPARC acts as a mediator between microglia and blood-derived immune cells (thus initiating inflammation), whereas Hevin might be secreted for the alternate activation of microglia for tissue repair. Additionally, BBB breakdown is a common feature in AD patients and could potentially increase and facilitate infiltration of perivascular macrophages and DCs via the circumventricular organs. Microglia were found in hypertrophied, phagocytic state, and also in ramified shape. Ramified microglia scavenge the brain with their processes. In AD brain tissue, the degree of ramification was altered and cell processes appeared in a more shortened and thickened state. This suggests that not all microglia share the ability to fulfill phagocytic functions. This could be due to a chronic inflammatory state, microglial dysfunction [48], or the changes from an inactivated to an activated state. SPARC immunoreactivity is associated with both hypertrophied and ramified cells, but exact differences and why SPARC is increased by microglia remains obscure. It has been proposed that SPARC could act in its regular ECM-modulating function until a stimulus, e.g. induced by disease, passes the threshold of SPARC’s regular action [5]. This shift might engender microglial transformations from resting to hypertrophic/reactive microglia [5].
SPARC and Hevin are subject to enzymatic degradation once secreted into the extracellular space. In AD brain tissue, Aβ catabolic pathways involve certain enzymes, including neprilysin, beta-amyloid-converting enzyme 1 (BACE1), plasmin and matrix metalloproteinases (MMPs) [49–53]. Systemic inflammation processes could support Aβ degradation by increasing SPARC expression via microglia, macrophages and DCs. MMPs are among the major SPARC inducing factors [5, 17]. Perivascular macrophages have a supportive function in the BBB and encompass vasculature with their processes [54, 55]. During neuroinflammation, macrophages accumulate and execute phagocytosis and surveillance functions [56]. In this investigation, macrophages were CD11b positive, suggesting a phagocytic role that is enhanced by the presence of CD11b on myeloid cells. CD11b presence has been shown to be upregulated on macrophages at inflammation sites [57]. CD11b is responsible for chemotaxis of leukocytes and is a good marker for activated immune cells, including macrophages and DCs.
Besides DCs, microglia have been proposed to function as antigen-presenting cells [58, 59]. However, antigen presentation to T cells involves cytokine secretion such as interferon-γ (IFN-γ) and interleukin-2 [58]. It was suggested that the initiation of naive T cell priming is performed by DCs [58], as classical activation of microglia is triggered by IFN-γ, which is rapidly produced by DCs [56]. Plus, DCs are the more potent stimulators for naive T cell proliferation [58]. Thus, upon disease onset, microglial activation, DC maturation, and activation could be correlated. Microglia possesses a high potential of transformation [60] and can generate a number of reactive phenotypes upon specific stimuli [6]. It has been suggested that microglia can even convert to DCs [58], hinting at a new mechanism for brain-intrinsic immune reactions.
Despite all of the knowledge and recent findings, it remains unclear as to if microglial transformation to DCs is really feasible in the human brain. It is hypothesized that the capacity to remove Aβ plaques occurs via SPARC upregulation. qRT-PCR validated the increase of SPARC in AD patients and revealed a concomitant downregulation of Hevin. Interestingly, although Hevin is expressed to a much lower extent (as compared to control tissue), its function appears to be more pivotal than expected. As aforementioned, altered SPARC/Hevin protein expression may contribute to synaptic dysfunction in AD brain due to their opposite roles in regulating synaptogenesis.
This investigation was aimed primarily at uncovering the role of the matricellular proteins SPARC and Hevin in the AD brain. Further experiments will be necessary to actually confirm in what ways SPARC contributes to neuroinflammation in AD brain. It remains unclear if SPARC regulates inflammatory processes in an active or passive manner (e.g., by its byproducts after enzymatic cleavage). To remove ambiguity, more knowledge about the molecular signaling is crucial. The upregulation of SPARC seems likely to be associated with the innate immune response triggered by the neuropathological features of AD, which is consistent with the colocalization of SPARC to the Aβ protein deposits. Further, there are several issues that must still be addressed, such as the downregulation of Hevin upon onset of AD. Future research is imperative in order to unravel the role of SPARC and Hevin during neuroinflammation. Nevertheless, modulating SPARC/Hevin protein expression such as interdicting heightened SPARC protein expression may be a feasible therapeutic approach for AD.
ACKNOWLEDGMENTS
MS’ stay at Massachusetts General Hospital was funded through the German-American Trainee Program (‘Deutsch Amerikanisches Praktikantenprogramm’), supported by the German Society for International Collaboration GmbH (‘Deutsche Gesellschaft für Internationale Zusammenarbeit (GIZ) GmbH’). CRV received research funding (ATRC201458) from the Harvard NeuroDiscovery Center. XH is supported by a grant from NIH National Institute on Aging (R01AG546614).
Authors’ disclosures available online (https://www.j-alz.com/manuscript-disclosures/18-1032r1).
REFERENCES
[1] | Gotz J , Ittner LM ((2008) ) Animal models of Alzheimer’s disease and frontotemporal dementia. Nat Rev Neurosci 9: , 532–544. |
[2] | Azizi G , Khannazer N , Mirshafiey A ((2014) ) The potential role of chemokines in Alzheimer’s disease pathogenesis. Am J Alzheimers Dis Other Demen 29: , 415–425. |
[3] | Wood LB , Winslow AR , Proctor EA , McGuone D , Mordes DA , Frosch MP , Hyman BT , Lauffenburger DA , Haigis KM ((2015) ) Identification of neurotoxic cytokines by profiling Alzheimer’s disease tissues and neuron culture viability screening. Sci Rep 5: , 16622. |
[4] | Hanisch UK , Kettenmann H ((2007) ) Microglia: Active sensor and versatile effector cells in the normal and pathologic brain. Nat Neurosci 10: , 1387–1394. |
[5] | Lloyd-Burton SM , York EM , Anwar MA , Vincent AJ , Roskams AJ ((2013) ) SPARC regulates microgliosis and functional recovery following cortical ischemia. J Neurosci 33: , 4468–4481. |
[6] | Kofler J , Wiley CA ((2011) ) Microglia: Key innate immune cells of the brain. Toxicol Pathol 39: , 103–114. |
[7] | Ransohoff RM , Cardona AE ((2010) ) The myeloid cells of the central nervous system parenchyma. Nature 468: , 253–262. |
[8] | Zhu J , Qu C , Lu X , Zhang S ((2014) ) Activation of microglia by histamine and substance P. Cell Physiol Biochem 34: , 768–780. |
[9] | Wyss-Coray T ((2006) ) Inflammation in Alzheimer disease: Driving force, bystander or beneficial response? Nat Med 12: , 1005–1015. |
[10] | Simard AR , Soulet D , Gowing G , Julien JP , Rivest S ((2006) ) Bone marrow-derived microglia play a critical role in restricting senile plaque formation in Alzheimer’s disease. Neuron 49: , 489–502. |
[11] | Clarkson BD , Walker A , Harris MG , Rayasam A , Hsu M , Sandor M , Fabry Z ((2017) ) CCR7 deficient inflammatory dendritic cells are retained in the central nervous system. Sci Rep 7: , 42856. |
[12] | Pashenkov M , Huang YM , Kostulas V , Haglund M , Soderstrom M , Link H ((2001) ) Two subsets of dendritic cells are present in human cerebrospinal fluid. Brain 124: , 480–492. |
[13] | Greter M , Heppner FL , Lemos MP , Odermatt BM , Goebels N , Laufer T , Noelle RJ , Becher B ((2005) ) Dendritic cells permit immune invasion of the CNS in an animal model of multiple sclerosis. Nat Med 11: , 328–334. |
[14] | Zhang R , Miller RG , Madison C , Jin X , Honrada R , Harris W , Katz J , Forshew DA , McGrath MS ((2013) ) Systemic immune system alterations in early stages of Alzheimer’s disease. J Neuroimmunol 256: , 38–42. |
[15] | Bradshaw AD ((2012) ) Diverse biological functions of the SPARC family of proteins. Int J Biochem Cell Biol 44: , 480–488. |
[16] | Frangogiannis NG ((2012) ) Matricellular proteins in cardiac adaptation and disease. Physiol Rev 92: , 635–688. |
[17] | Jones EV , Bouvier DS ((2014) ) Astrocyte-secreted matricellular proteins in CNS remodelling during development and disease. Neural Plast 2014: , 321209. |
[18] | Bornstein P ((2001) ) Thrombospondins as matricellular modulators of cell function. J Clin Invest 107: , 929–934. |
[19] | Jones EV , Bernardinelli Y , Tse YC , Chierzi S , Wong TP , Murai KK ((2011) ) Astrocytes control glutamate receptor levels at developing synapses through SPARC-beta-integrin interactions. J Neurosci 31: , 4154–4165. |
[20] | Kucukdereli H , Allen NJ , Lee AT , Feng A , Ozlu MI , Conatser LM , Chakraborty C , Workman G , Weaver M , Sage EH , Barres BA , Eroglu C ((2011) ) Control of excitatory CNS synaptogenesis by astrocyte-secreted proteins Hevin and SPARC. Proc Natl Acad Sci U S A 108: , E440–449. |
[21] | Au E , Richter MW , Vincent AJ , Tetzlaff W , Aebersold R , Sage EH , Roskams AJ ((2007) ) SPARC from olfactory ensheathing cells stimulates Schwann cells to promote neurite outgrowth and enhances spinal cord repair. J Neurosci 27: , 7208–7221. |
[22] | Liu X , Ying G , Wang W , Dong J , Wang Y , Ni Z , Zhou C ((2005) ) Entorhinal deafferentation induces upregulation of SPARC in the mouse hippocampus. Brain Res Mol Brain Res 141: , 58–65. |
[23] | Rempel SA , Golembieski WA , Ge S , Lemke N , Elisevich K , Mikkelsen T , Gutierrez JA ((1998) ) SPARC: A signal of astrocytic neoplastic transformation and reactive response in human primary and xenograft gliomas. J Neuropathol Exp Neurol 57: , 1112–1121. |
[24] | Schultz C , Lemke N , Ge S , Golembieski WA , Rempel SA ((2002) ) Secreted protein acidic and rich in cysteine promotes glioma invasion and delays tumor growth in vivo. Cancer Res 62: , 6270–6277. |
[25] | Murphy-Ullrich JE ((2001) ) The de-adhesive activity of matricellular proteins: Is intermediate cell adhesion an adaptive state? J Clin Invest 107: , 785–790. |
[26] | Brekken RA , Sage EH ((2001) ) SPARC, a matricellular protein: At the crossroads of cell-matrix communication. Matrix Biol 19: , 816–827. |
[27] | Melouane A , Carbonell A , Yoshioka M , Puymirat J , St-Amand J ((2018) ) Implication of SPARC in the modulation of the extracellular matrix and mitochondrial function in muscle cells. PLoS One 13: , e0192714. |
[28] | Lloyd-Burton S , Roskams AJ ((2012) ) SPARC-like 1 (SC1) is a diversely expressed and developmentally regulated matricellular protein that does not compensate for the absence of SPARC in the CNS. J Comp Neurol 520: , 2575–2590. |
[29] | Vincent AJ , Lau PW , Roskams AJ ((2008) ) SPARC is expressed by macroglia and microglia in the developing and mature nervous system. Dev Dyn 237: , 1449–1462. |
[30] | Baumann E , Preston E , Slinn J , Stanimirovic D ((2009) ) Post-ischemic hypothermia attenuates loss of the vascular basement membrane proteins, agrin and SPARC, and the blood-brain barrier disruption after global cerebral ischemia. Brain Res 1269: , 185–197. |
[31] | Weaver MS , Workman G , Cardo-Vila M , Arap W , Pasqualini R , Sage EH ((2010) ) Processing of the matricellular protein hevin in mouse brain is dependent on ADAMTS4. J Biol Chem 285: , 5868–5877. |
[32] | Wu HJ , Liu YJ , Li HQ , Chen C , Dou Y , Lou HF , Ho MS , Li XM , Gao Z , Duan S ((2014) ) Analysis of microglial migration by a micropipette assay. Nat Protoc 9: , 491–500. |
[33] | D’Agostino PM , Gottfried-Blackmore A , Anandasabapathy N , Bulloch K ((2012) ) Brain dendritic cells: Biology and pathology. Acta Neuropathol 124: , 599–614. |
[34] | Fujimoto Y , Tedder TF ((2006) ) CD83: A regulatory molecule of the immune system with great potential for therapeutic application. J Med Dent Sci 53: , 85–91. |
[35] | Viloria K , Munasinghe A , Asher S , Bogyere R , Jones L , Hill NJ ((2016) ) A holistic approach to dissecting SPARC family protein complexity reveals FSTL-1 as an inhibitor of pancreatic cancer cell growth. Sci Rep 6: , 37839. |
[36] | Jones EV , Bernardinelli Y , Zarruk JG , Chierzi S , Murai KK ((2018) ) SPARC and GluA1-containing AMPA receptors promote neuronal health following CNS injury. Front Cell Neurosci 12: , 22. |
[37] | Huang H , Colella S , Kurrer M , Yonekawa Y , Kleihues P , Ohgaki H ((2000) ) Gene expression profiling of low-grade diffuse astrocytomas by cDNA arrays. Cancer Res 60: , 6868–6874. |
[38] | Thomas SL , Schultz CR , Mouzon E , Golembieski WA , El Naili R , Radakrishnan A , Lemke N , Poisson LM , Gutierrez JA , Cottingham S , Rempel SA ((2015) ) Loss of Sparc in p53-null astrocytes promotes macrophage activation and phagocytosis resulting in decreased tumor size and tumor cell survival. Brain Pathol 25: , 391–400. |
[39] | Ozbas-Gerceker F , Redeker S , Boer K , Ozguc M , Saygi S , Dalkara T , Soylemezoglu F , Akalan N , Baayen JC , Gorter JA , Aronica E ((2006) ) Serial analysis of gene expression in the hippocampus of patients with mesial temporal lobe epilepsy. Neuroscience 138: , 457–474. |
[40] | Frost GR , Li YM ((2017) ) The role of astrocytes in amyloid production and Alzheimer’s disease. Open Biol 7: , 170228. |
[41] | Lively S , Brown IR ((2007) ) Analysis of the extracellular matrix protein SC1 during reactive gliosis in the rat lithium-pilocarpine seizure model. Brain Res 1163: , 1–9. |
[42] | Eroglu C ((2009) ) The role of astrocyte-secreted matricellular proteins in central nervous system development and function. J Cell Commun Signal 3: , 167–176. |
[43] | Toba H , de Castro Bras LE , Baicu CF , Zile MR , Lindsey ML , Bradshaw AD ((2015) ) Secreted protein acidic and rich in cysteine facilitates age-related cardiac inflammation and macrophage M1 polarization. Am J Physiol Cell Physiol 308: , C972–982. |
[44] | Zhao SJ , Jiang YQ , Xu NW , Li Q , Zhang Q , Wang SY , Li J , Wang YH , Zhang YL , Jiang SH , Wang YJ , Huang YJ , Zhang XX , Tian GA , Zhang CC , Lv YY , Dai M , Liu F , Zhang R , Zhou D , Zhang ZG ((2018) ) SPARCL1 suppresses osteosarcoma metastasis and recruits macrophages by activation of canonical WNT/beta-catenin signaling through stabilization of the WNT-receptor complex. Oncogene 37: , 1049–1061. |
[45] | Fiala M , Liu QN , Sayre J , Pop V , Brahmandam V , Graves MC , Vinters HV ((2002) ) Cyclooxygenase-2-positive macrophages infiltrate the Alzheimer’s disease brain and damage the blood-brain barrier. Eur J Clin Invest 32: , 360–371. |
[46] | Gate D , Rezai-Zadeh K , Jodry D , Rentsendorj A , Town T ((2010) ) Macrophages in Alzheimer’s disease: The blood-borne identity. J Neural Transm (Vienna) 117: , 961–970. |
[47] | Malm TM , Magga J , Kuh GF , Vatanen T , Koistinaho M , Koistinaho J ((2008) ) Minocycline reduces engraftment and activation of bone marrow-derived cells but sustains their phagocytic activity in a mouse model of Alzheimer’s disease. Glia 56: , 1767–1779. |
[48] | Hickman SE , Allison EK , El Khoury J ((2008) ) Microglial dysfunction and defective beta-amyloid clearance pathways in aging Alzheimer’s disease mice. J Neurosci 28: , 8354–8360. |
[49] | Miners JS , Baig S , Palmer J , Palmer LE , Kehoe PG , Love S ((2008) ) Abeta-degrading enzymes in Alzheimer’s disease. Brain Pathol 18: , 240–252. |
[50] | Selkoe DJ ((2001) ) Clearing the brain’s amyloid cobwebs. Neuron 32: , 177–180. |
[51] | Wang YJ , Zhou HD , Zhou XF ((2006) ) Clearance of amyloid-beta in Alzheimer’s disease: Progress, problems and perspectives. Drug Discov Today 11: , 931–938. |
[52] | Hernandez-Guillamon M , Mawhirt S , Blais S , Montaner J , Neubert TA , Rostagno A , Ghiso J ((2015) ) Sequential amyloid-beta degradation by the matrix metalloproteases MMP-2 and MMP-9. J Biol Chem 290: , 15078–15091. |
[53] | Pacheco-Quinto J , Eckman CB , Eckman EA ((2016) ) Major amyloid-beta-degrading enzymes, endothelin-converting enzyme-2 and neprilysin, are expressed by distinct populations of GABAergic interneurons in hippocampus and neocortex. Neurobiol Aging 48: , 83–92. |
[54] | McCarron MO , Nicoll JA ((2004) ) Cerebral amyloid angiopathy and thrombolysis-related intracerebral haemorrhage. Lancet Neurol 3: , 484–492. |
[55] | Eng JA , Frosch MP , Choi K , Rebeck GW , Greenberg SM ((2004) ) Clinical manifestations of cerebral amyloid angiopathy-related inflammation. Ann Neurol 55: , 250–256. |
[56] | Biffi A , Greenberg SM ((2011) ) Cerebral amyloid angiopathy: A systematic review. J Clin Neurol 7: , 1–9. |
[57] | Aziz MH , Cui K , Das M , Brown KE , Ardell CL , Febbraio M , Pluskota E , Han J , Wu H , Ballantyne CM , Smith JD , Cathcart MK , Yakubenko VP ((2017) ) The upregulation of integrin alphaDbeta2 (CD11d/CD18) on inflammatory macrophages promotes macrophage retention in vascular lesions and development of atherosclerosis. J Immunol 198: , 4855–4867. |
[58] | Fischer HG , Reichmann G ((2001) ) Brain dendritic cells and macrophages/microglia in central nervous system inflammation. J Immunol 166: , 2717–2726. |
[59] | Krakowski ML , Owens T ((1997) ) The central nervous system environment controls effector CD4+T cell cytokine profile in experimental allergic encephalomyelitis. Eur J Immunol 27: , 2840–2847. |
[60] | Prinz M , Priller J ((2014) ) Microglia and brain macrophages in the molecular age: From origin to neuropsychiatric disease. Nat Rev Neurosci 15: , 300–312. |


