
A Potential Role for α-Amylase in Amyloid-β-Induced Astrocytic Glycogenolysis and Activation
Abstract
Background:
Astrocytes produce and store the energy reserve glycogen. However, abnormal large glycogen units accumulate if the production or degradation of glycogen is disturbed, a finding often seen in patients with Alzheimer’s disease (AD). We have shown increased activity of glycogen degrading α-amylase in AD patients and α-amylase positive glial cells adjacent to AD characteristic amyloid-β (Aβ) plaques.
Objectives:
Investigate the role of α-amylase in astrocytic glycogenolysis in presence of Aβ.
Methods:
Presence of α-amylase and large glycogen units in postmortem entorhinal cortex from AD patients and non-demented controls were analyzed by immunohistological stainings. Impact of different Aβ42 aggregation forms on enzymatic activity (α-amylase, pyruvate kinase, and lactate dehydrogenase), lactate secretion, and accumulation of large glycogen units in cultured astrocytes were analyzed by activity assays, ELISA, and immunocytochemistry, respectively.
Results:
AD patients showed increased number of α-amylase positive glial cells. The glial cells co-expressed the astrocytic marker glial fibrillary acidic protein, displayed hypertrophic features, and increased amount of large glycogen units. We further found increased load of large glycogen units, α-amylase immunoreactivity and α-amylase activity in cultured astrocytes stimulated with fibril Aβ42, with increased pyruvate kinase activity, but unaltered lactate release as downstream events. The fibril Aβ42-induced α-amylase activity was attenuated by β-adrenergic receptor antagonist propranolol.
Discussion:
We hypothesize that astrocytes respond to fibril Aβ42 in Aβ plaques by increasing their α-amylase production to either liberate energy or regulate functions needed in reactive processes. These findings indicate α-amylase as an important actor involved in AD associated neuroinflammation.
INTRODUCTION
The brain is the most energy demanding organ in our body and brain cells require constant access to glucose in order to function [1]. Particularly neurons are sensitive to energy disruption and low glucose availability can lead to synaptic loss, dendritic alterations, and neuronal death [2, 3]. To prevent the risk of insufficient glucose access in case of hypoglycemia or high energy demand, the brain uses energy back-up in form of multibranched polysaccharides called glycogen. The glycogen is formed and stored foremost in astrocytes, large star-shaped glial cells, but can also be found within neurons and pericytes [4]. The astrocytic glycogen formation (glycogenesis) and degradation (glycogenolysis) is thought to be regulated by cyclic adenosine monophosphate (cAMP), as studies show that activation of the β-adrenergic receptors elevates cAMP [5–7], with enhanced short-term glycogenolysis and long-term glycogenesis as downstream events [8]. When there is an increased energy demand, glycogen is degraded and the liberated glucose is converted, through the different steps of glycolysis, into pyruvate or further down into lactate. The former is used as energy for endogenous processes, whereas the latter is foremost released into the extracellular space [5] where it can be taken up and used as energy by the nearby neurons. This process, termed the astrocyte-neuron lactate shuttle (ANLS), is crucial in case of impaired neuronal glucose metabolism [9] and is thought to be regulated by neuronal activity, where glutamate release enhances astrocytic glycogenolysis and downstream lactate secretion [10]. Since both glutamate excitation and astrocytic lactate transportation are required for long-term potentiation, it has been suggested that ANSL and astrocytic glycogenolysis are important for memory forming processes [11, 12], although criticism to this idea has recently been raised [13]. Nevertheless, the hypothesis has gained attention within the research field of Alzheimer’s disease (AD), a dementia disorder neuropathologically characterized foremost by the presence of amyloid-β (Aβ) plaques and neurofibrillary tangles (NFT) [14]. Interestingly, the disorder is also characterized by an early impaired glucose utilization and hypometabolism [15–17], which is associated with the Aβ42 plaque burden [18]. Moreover, patients with AD commonly show an increased load of large abnormal aggregates of polysaccharides in astrocytes in form of polyglucosan bodies (PGB) or corpora amylacea [19–21]. These aggregates are thought to arise due to an imbalance between glycogenesis and glycogenolysis or an hyperphosphorylation of glycogen, which leads to the formation of poorly branched glycogen units with abnormal size [21–23]. The increased astrocytic PGB accumulation in AD patients thus indicates a disturbed astrocytic glycogenosis/glycogenolysis balance in these patients. This disturbance together with findings demonstrating a shift from neural glucose metabolism into astrocytic metabolism in AD patients [24], indicate a specific role for astrocytes in AD. Indeed, several studies have shown that astrocytes play an important role in neuroinflammatory processes associated with the disease [25]. These versatile cells are recruited to newly formed Aβ42 plaques [26, 27] and at the plaque site they become activated, phagocytose Aβ42, secrete chemokines/cytokines to attract microglial [28], and activate the innate immune system [29]. These activated astrocytes are recognized by their hypertrophic features (i.e. thicken and retracted processes) and enlarged cell bodies as well as a strong upregulation of the astrocytic marker glial fibrillary acidic protein (GFAP) [30]. The association between activated astrocytes and Aβ42 plaques in AD patients indicates that Aβ42 may directly activate astrocytes. This idea is supported by in vitro studies demonstrating increased secretion of pro-inflammatory cytokines after Aβ42 stimulation [28]. The amyloid peptide can also, via the β-adrenergic receptor, elevate cAMP levels [31], which indicates a direct impact of the peptide on glycogenesis and glycogenolysis. This hypothesis needs to be investigated, but since the activation (i.e., phagocytosis, secretion of signal substances, and morphological changes) is an energy demanding process, it may be speculated that the increased astrocytic metabolism seen in AD patients could be a result of increased astrocytic endogenous processes in response to Aβ42 rather than meeting the increased energy demand from nearby neurons.
We have in our previous studies found further support for increased astrocytic glycogenolysis in AD patients, as we detected increased activity of the glycogen degrading enzyme α-amylase in homogenates of hippocampus of AD patients and a strong α-amylase immunoreactivity in astrocytes surrounding Aβ42 plaques [32]. Normally, α-amylase is found in saliva (isotype AMY1A) and in the pancreatic juice (isotype AMY2A) [33, 34], where it degrades glycogen and starch by hydrolyzing the α(1–4) glyosidic bonds into smaller polysaccharides or single glucose molecules [35]. Although glycogen degradation is considered to be the main function of α-amylase, studies also show that the enzyme can interact with other proteins. Such interactions can be found in saliva, where α-amylase forms complexes with for example glycoproteins and antimicrobial proteins [36]. The role for α-amylase in these complexes is not known, but it has been hypothesis that it may serve as a protein carrier which protect and regulate the proteins function [36]. Interestingly, studies indicate that salivary α-amylase activity is regulated by a similar signaling pathway as the one regulating glycogenolysis in astrocytes, i.e., activation of the β-adrenergic receptor, with downstream upregulation of cAMP [37]. The role for α-amylase in astrocytes, particularly Aβ42 activated astrocytes remains, however, to be studied. In the current study, we investigate α-amylase immunoreactivity as well as the load of large glycogen units in entorhinal cortex (a brain area where Aβ42 plaques are commonly found) of AD patients. Moreover, by the use of in vitro studies, we study the direct impact of Aβ42 on astrocytic glycogenolysis, load of large glycogen units, and glycolytic events and investigate whether these events are mediated via the β-adrenergic receptor.
MATERIALS AND METHODS
Brain tissue preparation
The study was performed on samples of entorhinal cortex (EC) from two cohorts. Cohort 1 includes (n = 8) non-demented controls (NC) and (n = 12), clinically and postmortem verified Alzheimer’s disease (AD) patients (Netherlands Brain Bank, NBB). Cohort 2 includes (n = 3) NC and (n = 3) AD patients (NBB). Samples from both cohorts were reported previously, with information regarding neuropathological evaluation, cause of death, and presence of APOE4 [32]. Both cohorts were matched for age and postmortem delay. Written informed consent for the use of brain tissue and clinical data for research purposes was obtained from all patients or their next of kin in accordance with the International Declaration of Helsinki. Medical ethical evaluation committee of VU Medical Centre, Amsterdam has approved the procedures of brain tissue collection and the regional ethical review board in Lund has approved the study. In cohort 1, each hippocampal sample was fresh frozen at autopsy and the frozen samples were later incubated in paraformaldehyde (PFA) (4%) for 4 h, followed by incubation in 30% sucrose for 3 days. In cohort 2, the human brain samples were directly fixed with PFA at autopsy as described in [32]. The tissue was then sectioned in 40 μm free floating sections stored in –20°C in cryoprotectant solution until used.
Immunohistochemical staining and analysis of number of AMY2A positive cells in brain tissue
Sections from cohort 1 were immunohistochemically stained against AMY2A according to standard protocols. Briefly, the tissue sections were quenched in 3% H2O2 and 10% methanol for 30 min and thereafter blocked in Impress reagent kit blocking solution (Vector Laboratories, Burlingame, CA) for 1 h at room temperature (RT). Sections were thereafter incubated with rabbit-anti-AMY2A (rabbit-anti-AMY2A; Thermo Fisher Scientific, Waltham, MA) in blocking solution overnight at 4°C followed by incubation of secondary anti-rabbit Igs Impress reagent kit secondary antibodies (Vector Laboratories, Burlingame, CA) for 2 h and finally peroxidase detection for 3 min (0.25 mg/ml diaminobenzidine and 0.012% H2O2). Pictures (Olympus cellSens Dimension) of two randomly chosen fields (10000 μm2) within the EC of three sections from each individual were captured. The number of AMY2A positive cells were counted and averaged and presented as mean number AMY2A positive cells/10000 μm2.
Immunofluorescent staining and analysis of large glycogen unit in brain tissue
Sections from cohort 2 were stained with antibodies against AMY2A in combination with antibodies against astrocytic marker GFAP (rabbit-anti-GFAP Dako, Glostrup, Denmark), Aβ1–16 (mouse-anti-Aβ1–16, clone 6E10; Covance, Princeton, NJ), or large glycogen units (mouse IgM-anti-glycogen, ESG1A9mAb; kind gift from professor Hitoshi Ashida at Kobe University), where the latter antibody stain large glycogen molecules over smaller glycogen molecules [38]. The AMY2A/GFAP staining was performed in a sequential manner, where the sections were blocked for 1 h in blocking solution (5% goat serum (Jackson Immunoresearch, Westgrove, PA) in KPBS) before antibodies against AMY2A were added and incubated overnight at 4°C. Sections were thereafter incubated with Dylight 594 goat-anti-rabbit (Thermo Fischer Scientific, Waltham, MA) for 2 h at RT, followed by a fixation with 4% PFA for 15 min. The GFAP antibodies were thereafter added and the sections were incubation overnight at 4°C followed by incubation with secondary antibodies Alexa 488 goat-anti-rabbit (Thermo Fischer Scientific, Waltham, MA) for 2 h at RT. The sections stained for AMY2A/glycogen and AMY2A/Aβ1–16 were blocked for 1 h in blocking solution before antibodies against AMY2A together with either antibodies against large glycogen units (ESG1A9) or Aβ1–16 were added and incubated overnight at 4°C. The sections were thereafter incubated with the appropriate secondary antibody (Dylight 594 goat-anti-rabbit, Alexa 488 goat-anti-rabbit, Alexa 647 goat-anti-mouse IgM (Thermo Fischer Scientific, Waltham, MA or Alexa 488 mouse-anti-rabbit (Thermo Fischer Scientific, Waltham, MA) for 2 h in RT. The sections were mounted with Vectashield Set mounting medium containing DAPI (Vector Laboratories, Burlingame, CA). The presence of AMY2A in astrocytes and the localization of AMY2 cells in relation to Aβ42 plaques was observed with a fluorescence microscope. The load of large glycogen units in five AMY2A positive EC cells in three AD patients (in total 15 cells) and three NC (15 cells) was analyzed using confocal microscopy 63X objective (Ziess LSM 800, Ziess, Oberkochen, Germany). The analyzed area was determined by a delineation of the outer boarder of the AMY2A staining and the load of large glycogen units was presented as mean percentage of AMY2A area/individual.
Cell culturing
Human fetal primary astrocytes (HA) (ScienCell, Carlsbad, CA) at passage 2 were grown with astrocyte medium including supplements (5% astrocyte growth supplement and 5% penicillin/streptomycin solutions) and fetal bovine serum (2%) (ScienCell, Carlsbad, CA) in a T-75 flask until 80% confluency was reached. Due to observed contamination of pericytes in the cell culture, MACS cell separation with LS columns loaded with anti-AN2 antibody labelled microbeads (Miltenyi Biotec, Bergisch Gladbach, Germany) was used to remove pericytes. Cell population purity was analyzed by immunocytofluorescence staining using antibodies against GFAP. Cells were fixed for 15 min in 2% PFA, incubated with blocking solution for 1 h and thereafter incubated with the primary antibodies for 2 h at RT. Next the cells were incubated with the Alexa 488-conjugated anti-rabbit or Dylight 594 goat-anti-mouse for 1 h at RT and mounted with Vectashield Set mounting medium. Analysis of the stained cell culture showed that the percentage of DAPI-positive/GFAP positive cells of total DAPI-positive cells (n = 250) was approximately 96%.
Amyloid-β preparation and cell stimulation
Preparations of human synthetic Aβ42 (AlexoTech, Umeå, Sweden) oligomers and fibrils were done according to a previously published protocol [39]. To verify presence of oligomers and fibrils in the Aβ42 preparations, transmission electron microscopy (TEM) was performed by absorbing the samples onto glow-discharged carbon-coated copper grids. The samples were washed with water stained in uranyl acetate solution. Samples were examined using TEM 120 kV JEOL 1400 plus, which verified the presence of oligomers (Supplementary Figure 1A) and fibrils in (Supplementary Figure 1B). Before stimulation, HA were seeded out in Poly-L-Lysine (ScienCell, Carlsbad, CA) coated 6-well and 12 well plates and 8-well chambers with glass bottom slide (Lab Tek II) and grown until 90% (6-well and 12 well plates) and 60% (8-well chambers) confluency. The HA cells were serum starved for 2 h and thereafter stimulated with either 10 μM Aβ42 oligomers, 10r μM Aβ42 fibrils, vehicle control (1 mM NaOH), the β-adrenergic receptor inhibitor propranolol (Sigma-Aldrich, St. Louis, MO) (1r μM+1 mM NaOH), or the α-amylase inhibitor acarbose (Sigma-Aldrich) (5r μM+1 mM NaOH) for 18 h at 37°C with 5% CO2 . Cell death was measured with cytotoxicity LDH assay (Roche, Basel, Switzerland) according to manufacturer’s protocol and the absorbance at 490 nm was measured on EonTM (Biotek, Winooski, VT).
Immunocytofluorescence analysis of the load of large glycogen units and AMY2A in stimulated HA cells
HA cells grown in chamber wells were stimulated with oligomer and fibril Aβ42 and vehicle control for 18 h. They were thereafter fixed for 15 min in 2% PFA, blocked with 1% BSA diluted in PBS for 1 h, and incubated with anti-AMY2A and anti-glycogen for 2 h at RT. The cells were then incubated for 1 h with Alexa 488 goat-anti rabbit and Alexa 647 goat anti-mouse IgM and mounted with Vectashield Set mounting medium containing DAPI. The experiment was performed three times and 3–4 cells from each experiment and condition (in total 10 per condition) were analyzed using confocal microscopy 63X objective (Zeiss LSM 510, Zeiss, Oberkochen, Germany). The analyzed area was determined by a delineation of the outer boarder of the AMY2A staining and the load of large glycogen units and AMY2A intensity was presented as the percentage of AMY2A area. Glycogen granule size was analyzed with Zen 2009 software and minimum number of granules exceeding 1r μm2 were counted.
Gene expression analysis
The Aβ42 stimulated HA cells grown in 6-well plates (three individual experiment in two replicates) were lysed on ice using qiazol lysis reagent (Qiagen, Venlo, the Netherlands) and transferred to microcentrifuge tubes. The total RNA from the lysed cells was purified using RNeasy Plus Universal Mini Kit (Qiagen, Venlo, the Netherlands), according to the manufacturer’s instructions. RNA Purity and concentration were quantified using Take 3™ and Eon™ (Biotek, Winooski, VT) and the concentration was adjusted with RNase free water. Preparation of cDNA was performed using Maxima first strand cDNA synthesis kit (Life Tech, Carlsbad, CA) according to manufacturer’s instructions and thereafter mixed with Maxima probe/ROX QPCR mastermix (Life Tech, Carlsbad, CA) together with probes for α-amylase (HS00420710_g1) (capturing AMY2A, AMY1A, AMY1C, AMY1B and AMY2B), housekeeping genes ribosomal protein L13A (RPL13A) (HS04194366_g1) and hydroxymethylbilane synthase (HMBS) (Hs00609296_g1) (Applied Biosystems, Foster City, CA). The RT-qPCR reactions were carried out using Viia™ 7 system (Applied Biosystems, Foster City, CA) and the relative expression in mRNA level was calculated using the 2-ΔCt method [40] and normalized against the geometric mean of RPL13A and HMBS.
Analysis of α-amylase and pyruvate kinase activity
Analyses of enzymatic activities of α-amylase and pyruvate kinase (PKM) and lactate dehydrogenase (LDH) in samples from Aβ42 and vehicle stimulated HA cells were performed using alpha amylase colorimetric activity kit (Abcam, Cambridge, UK) and pyruvate kinase activity assay (Abcam, Cambridge, UK) according to the manufacturer’s protocol. The stimulated and vehicle control HA cells in 6 and 12 wells were homogenized on ice with 500r μl α-amylase buffer provided by α-amylase activity kit and centrifuged at 10,000 rpm for 10 min at 4°C, whereby two third of the supernatant was removed. Thereafter the activity analyses were performed on the remaining supernatant/pellet. The kinetic measurements were done using spectrophotometer Eon™ (Biotek, Winooski, VT) at 405 nm (Abs405nm) over 20 min (ΔT20) for the α-amylase and at 570 nm (Abs570nm) over ΔT20 for PKM assay and the enzyme activity (mU/ml) was calculated according to the equation in manufactures protocol. Every experiment was performed three times in two replicates.
Analysis of lactate
Analysis of released lactate from cells stimulated with Aβ42 fibril and vehicle control for 18 h (three individual experiment in two replicates) were performed by the use of L-lactate assay (Abcam, Cambridge, UK) on cell medium according to manufacturer’s protocol and measured with on Eon™ (Biotek, Winooski, VT) at Abs570nm. Cell stimulation with the α-amylase inhibitor acarbose for 24 h was use as negative control.
Analysis of cell localization of AMY2A
The presence of AMY2A in lysosomes was analyzed by adding Lysotracker RED DND-99 (a dye that becomes fluorescent in acidic compartments) to the medium the last 2 h of the stimulation with Aβ42 fibril and vehicle. The cells were then washed, fixed with 2% PFA, immunostained against AMY2A and examined using an Olympic fluorescent microscope with a 40×objective. Co-localization between Lysotracker Red DND-99 and AMY2A was analyzed using confocal microscopy equipped with a 63×objective and Zen 2009 software. Overlap percentage (Mander’s coefficient) of Lysotracker Red DND-99 and AMY2A was calculated using Zen 2009 software. Lysosomal size in HAs analyzed by confocal was examined using Olympus cellSens Dimension. Lysosomes with a diameter larger than 3r μm (more than twice the average size of a regular lysosome) were considered as enlarged.
Statistical analysis
Statistical analysis was performed using SPSS software (version 24 for Mac, SPSS Inc., Chicago, IL). Analysis using Kolmogorov–Smirnov test showed normal distribution of values within all analysis. Differences between AD and NC were analyzed by the use of independent-samples t-test and correlations between neuropathological evaluation (Aβ plaques and NFT) and number of AMY2A positive cells was performed by Spearman correlation test. Differences between vehicle control and oligomer- and fibril Aβ42 in the in vitro study were analyzed using one-way analysis of variance (ANOVA), followed by Tukey post hoc correction (comparisons for n = 3), whereas the comparisons between vehicle control and fibril Aβ42 were analyzed using Student’s t-test. Results are presented as means±standard deviations, and a value of p < 0.05 level was considered statistically significant.
RESULTS
Increased astrocytic α-amylase immunoreactivity and load of large glycogen units in AD patients
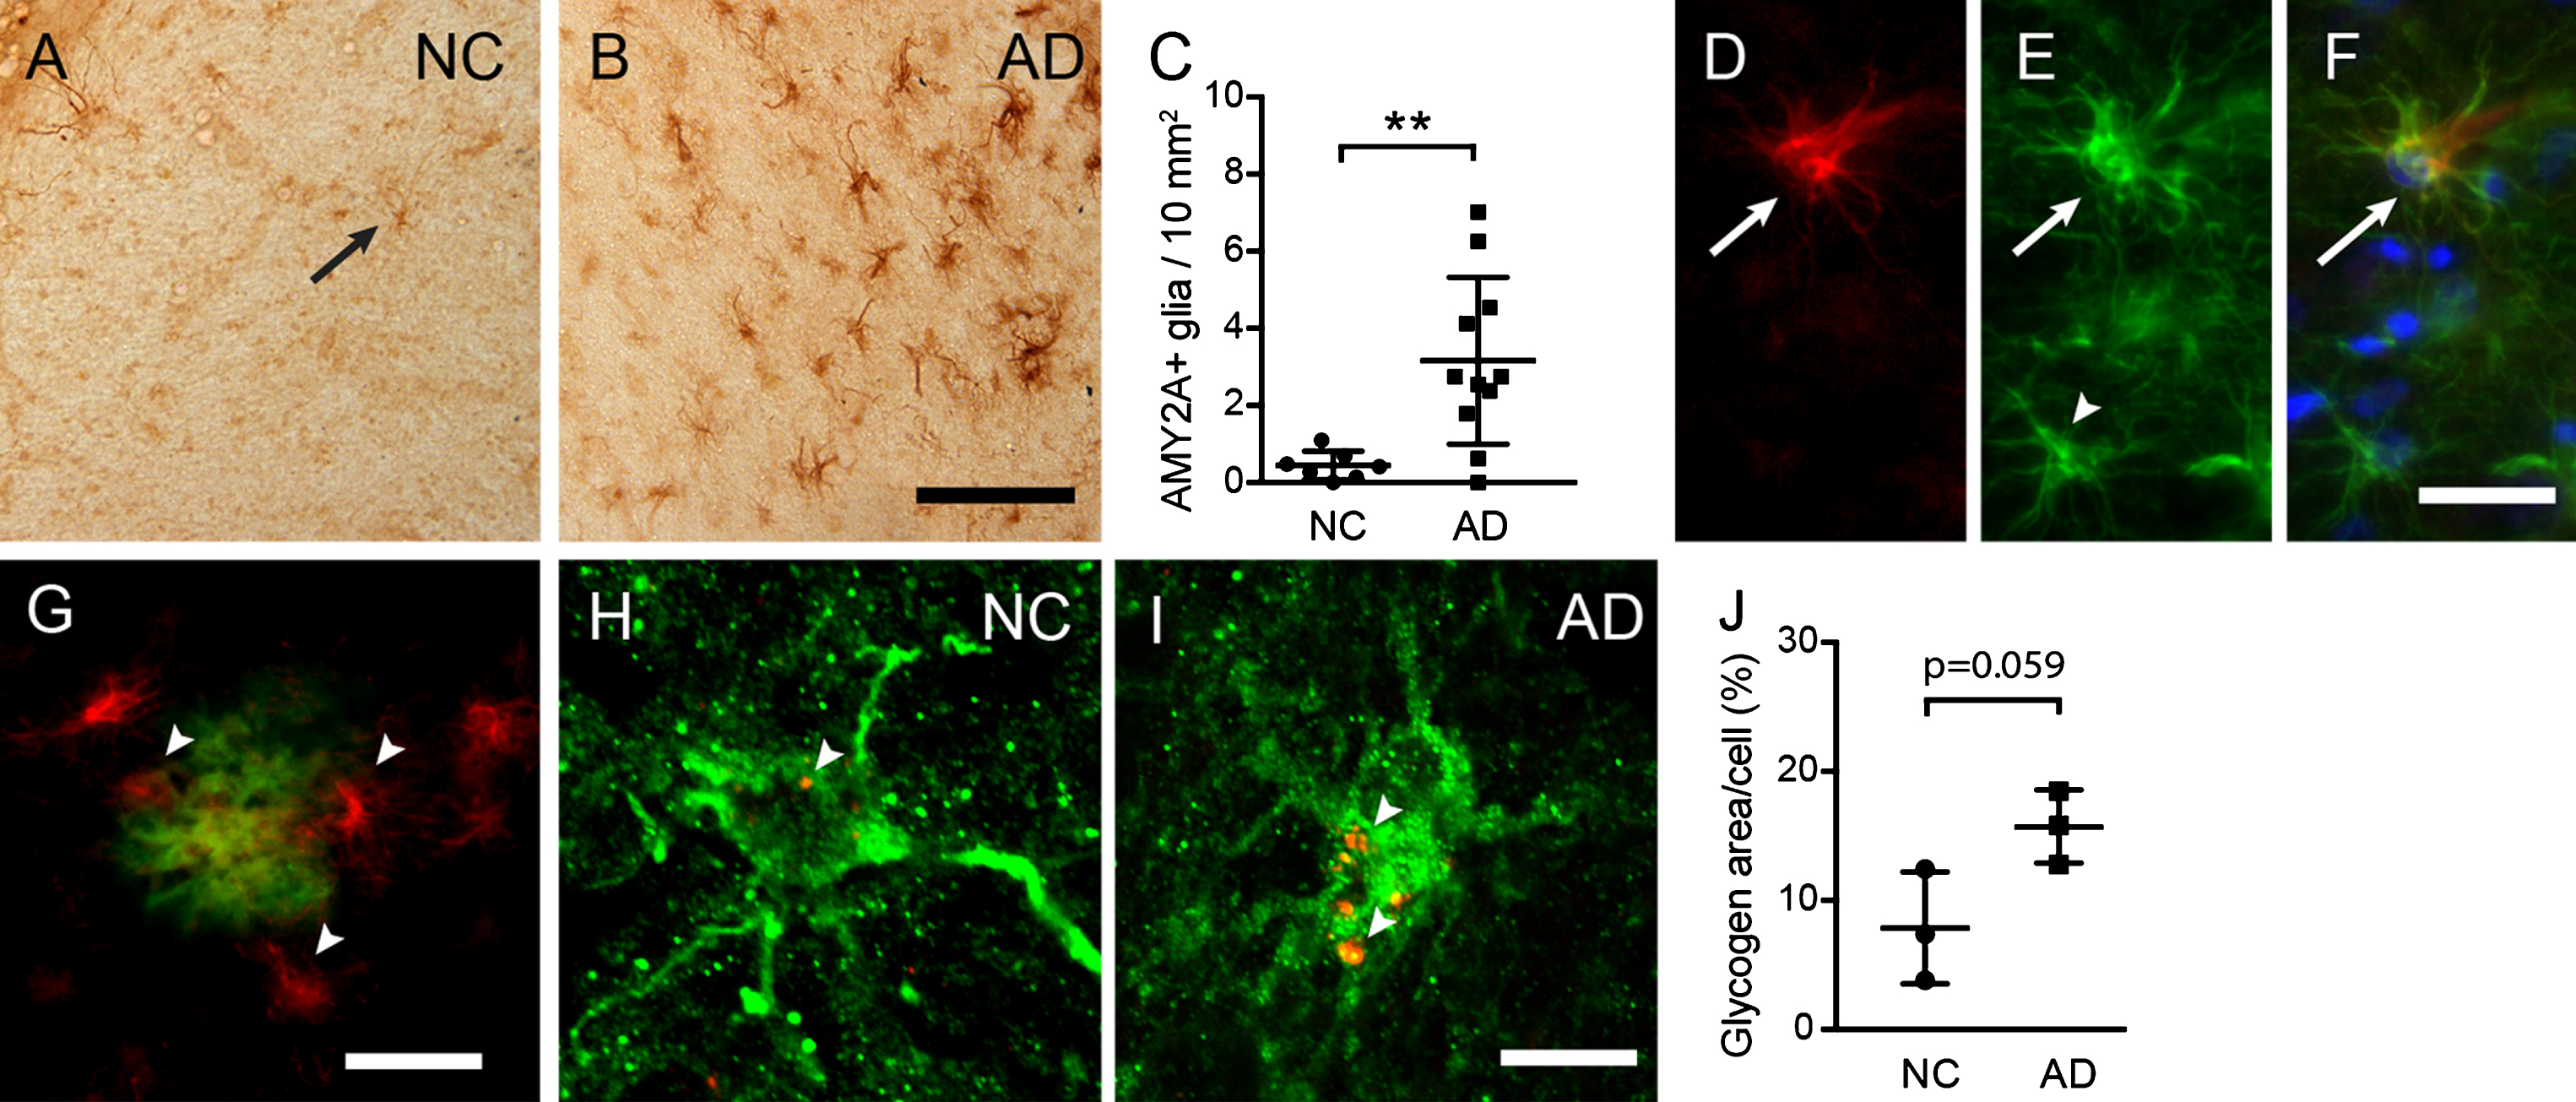
To investigate astrocytic α-amylase in presence of AD pathology, we analyzed EC sections from three AD patients and three NC (Cohort 1) using immunostaining against AMY2A. As described earlier [32], scattered cells with glial morphology were found throughout EC of both AD patients and NC (Fig. 1A), but the current analysis showed that the number of AMY2A+glial cells were significantly higher in AD patients compared to NC (Fig. 1A–C). This increase correlated significantly with neuropathological evaluation of Aβ plaque load (r = 0.556 p = 0.017) and NFTs (r = 0.609, p = 0.007) (Supplementary Figure 2). Moreover, in line with our previous studies, double immunostainings showed that all AMY2A+glial cells co-expressed GFAP, suggesting that the vast majority of AMY2A + glial cells are astrocytes. Interestingly, the strong AMY2A immunoreactivity was primarily found in GFAP + astrocytes with hypertrophic morphology (thicken processes and swollen cell bodies) (Fig. 1A–C), indicating an upregulation of AMY2A in foremost activated astrocytes. The AMY2A glial cells were in similarity to AMY2A in hippocampus [32] found foremost adjacent to Aβ plaques. Confocal analysis of immunostainings of a second cohort (Cohort 2) further showed that AMY2A + glial cells in AD contained on the boarder significantly more amount of large glycogen units per cell compared to AMY2A + glial cells in NC (p = 0.059) (Fig. 1H–J).
Fig.1
Increased astrocytic α-amylase immunoreactivity and glycogen load in AD patients. Image in (A) illustrates an AMY2A immunostaining of entorhinal cortex (EC) in a representative NC (arrow indicates an AMY2A positive glial cell). The number of strongly AMY2A+glial cells was significantly higher in AD (n = 12) compared to NC (n = 8), which is illustrated in image (B) and the column scatter plot in (C). The AMY2A glial cells (red in D) co-expressed GFAP (green in E) (D merged with E and blue DAPI staining in F) and were found primarily in astrocytes with a hypertrophic morphology (arrow in D–F), and less in astrocytes with a resting morphology (arrowhead in E). The AMY2A+glial cells (red indicated with arrowheads in G) were commonly seen adjacent to Aβ plaques (green in G). Confocal images in (H-I) demonstrate a double staining against AMY2A (in green) and glycogen (in red indicate with arrowheads in H and I), where the glycogen load in NC (H) is less pronounced compared to AD (I). The column scatter plot in (J) shows an on boarder significant increase of glycogen area/cell percentage in AMY2A+cells (n = 5) of AD patients (n = 3) (in total 15 cells) compared to glycogen area/cell in AMY2A+cells (n = 5) of NC (n = 3) (in total 15 cells). Data was analyzed using student t-test and presented as mean±SD. **p > 0.01. Scalebar A and B = 40, D–F = 15, G = 25, H and I = 5r μm.
Increased α-amylase immunoreactivity and glycogen load in cultured astrocytes after Aβ42 stimulation
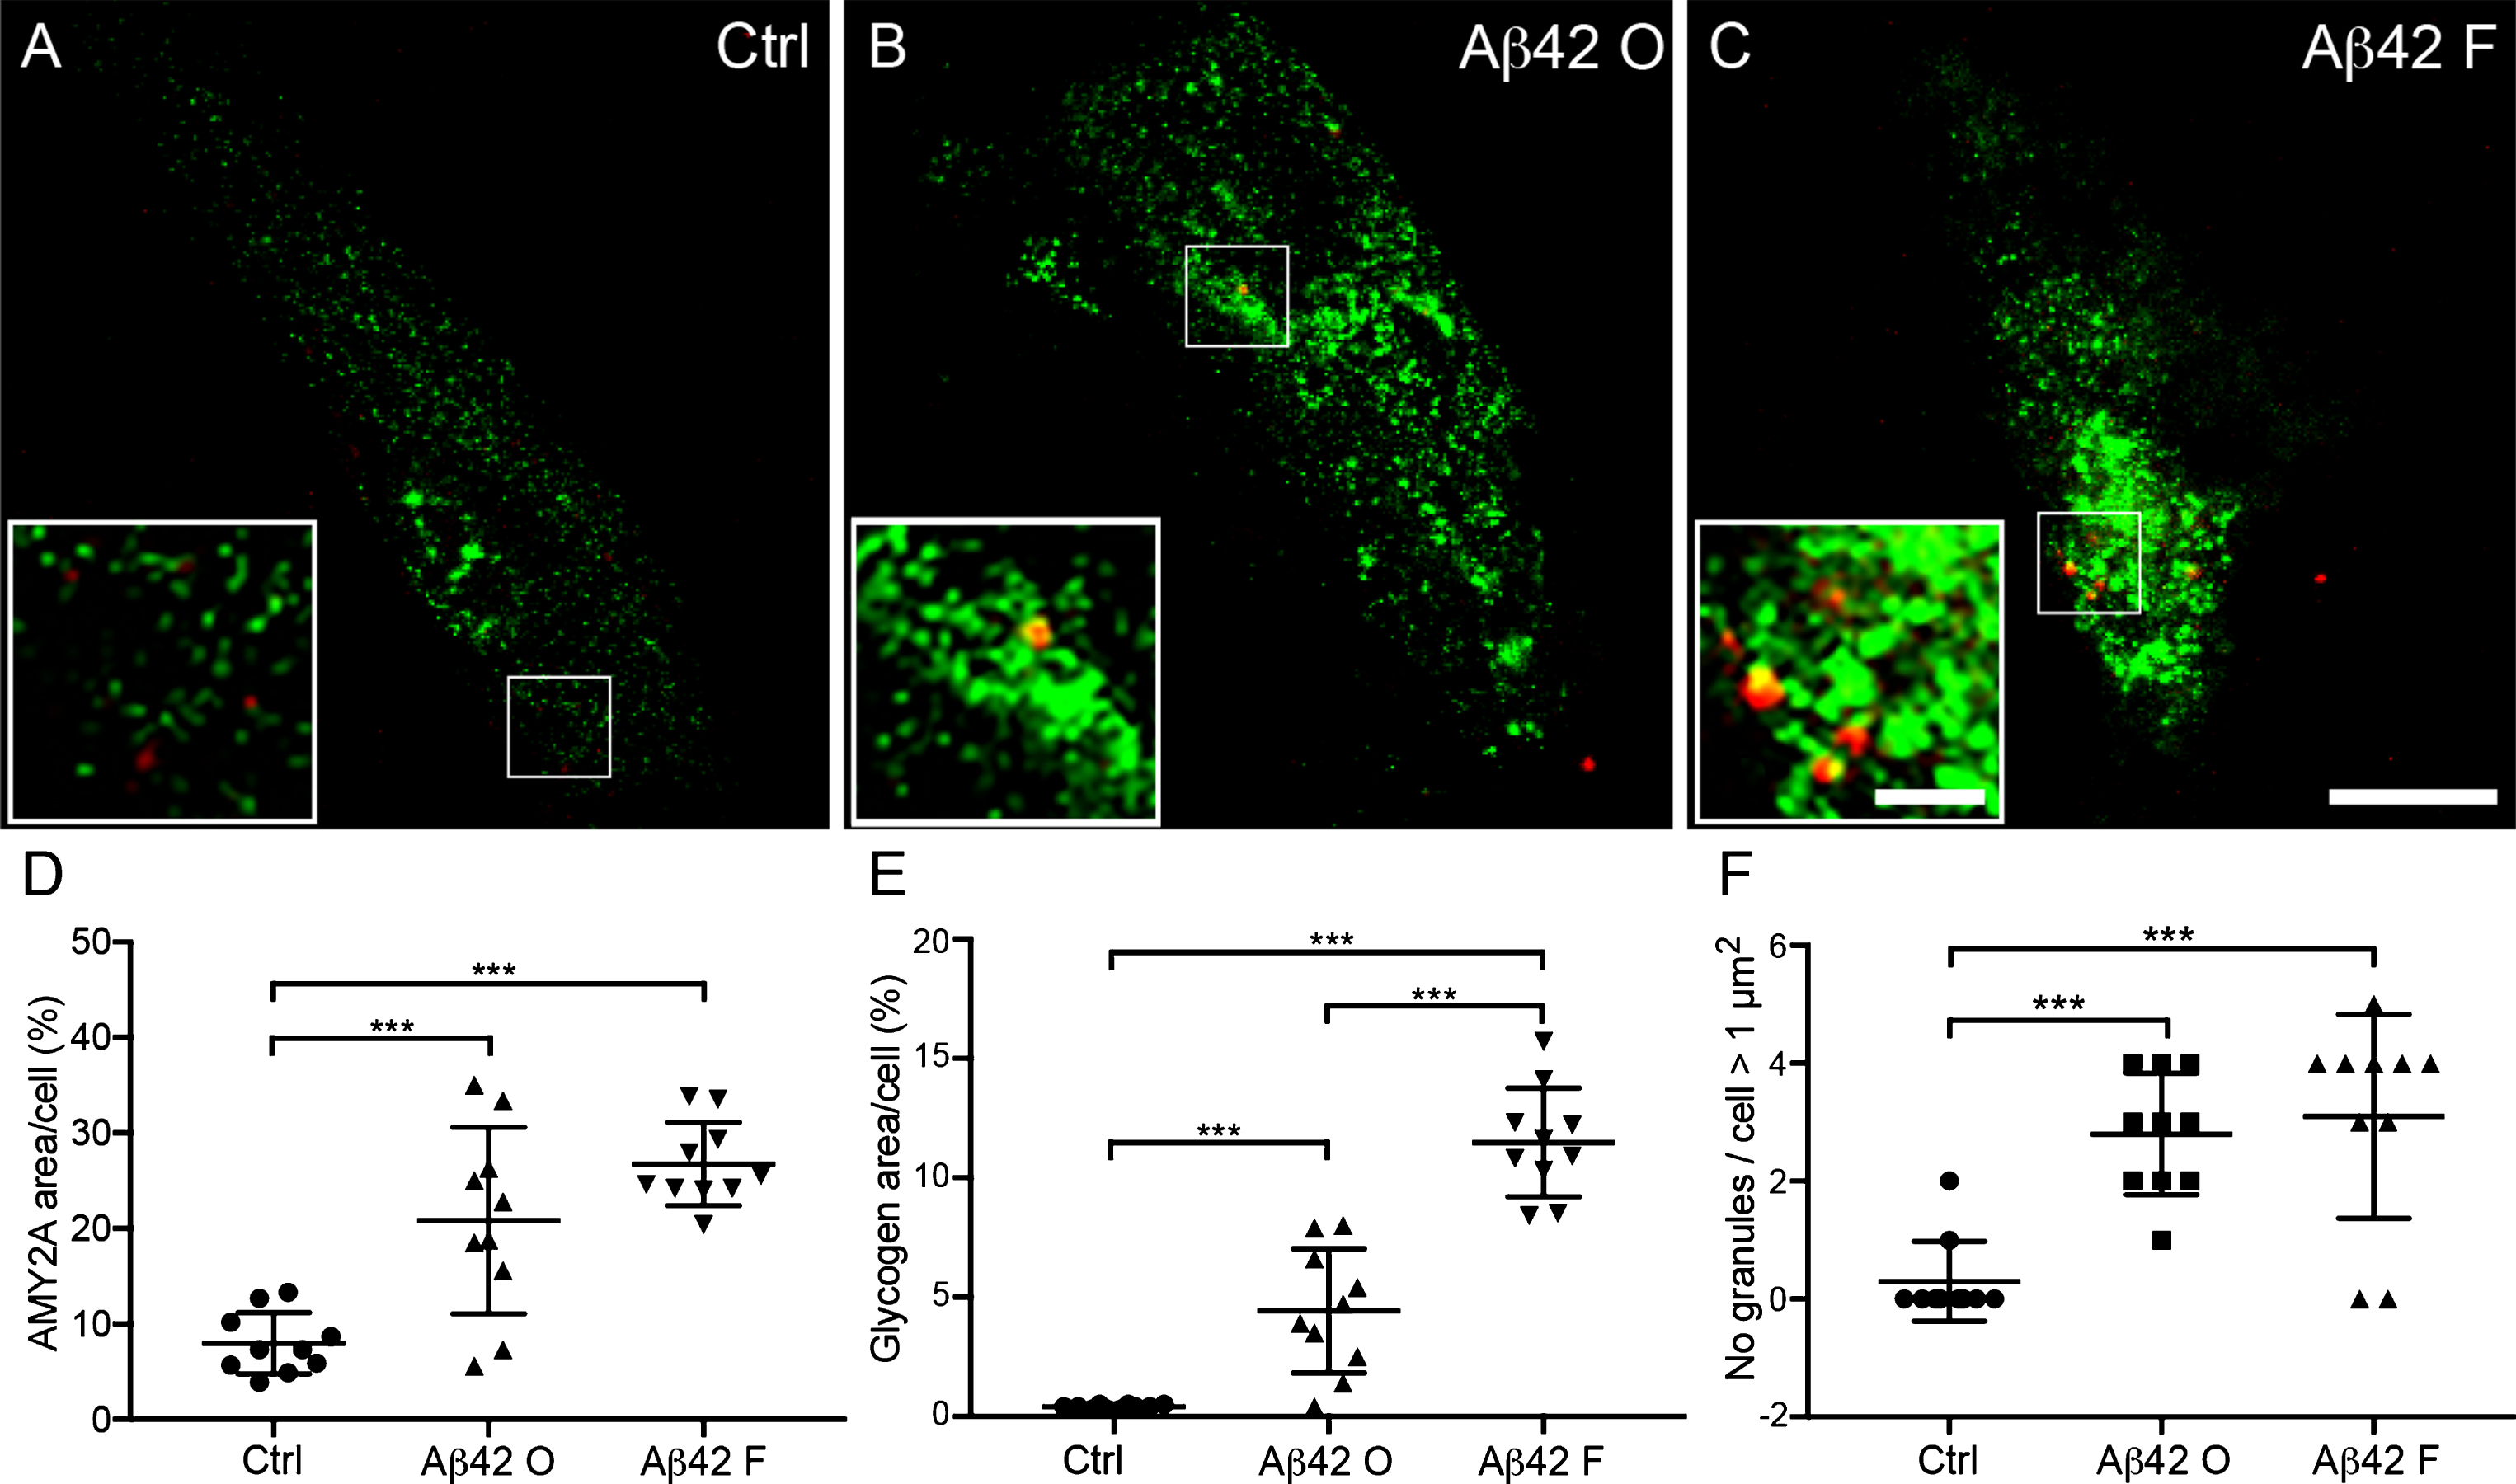
The increased load of large glycogen units and number of AMY2A + glial cells in AD patients as well as the association between Aβ42 plaques and AMY2A + glial cells, inevitably raises the question whether these events are related to Aβ42. Thus, to investigate the direct impact of Aβ42 on astrocytic α-amylase, we stimulated primary human fetal astrocytes (HA) cells with Aβ42 fibrils and oligomers for 18 h and analyzed alterations in α-amylase and load of large glycogen units. While the stimulation of 18 h did not increase cell death (data not shown), confocal analysis showed significantly higher percentage of both AMY2A and glycogen immunoreactivity per analyzed HA after Aβ42 oligomer and fibril stimulation compared to control HA (Ctrl). The increase of both parameters was however more pronounced after Aβ42 fibril stimulation (Fig. 2A–E). Finally, the number of large glycogen granules (>1 μm2) was significantly higher in HA stimulated with Aβ42 fibrils and Aβ42 oligomers (ranging from 1.9–17.9 μm2 and 1.3–12.3 μm2, respectively) compared to Ctrl (ranging from 1.6–4.5 μm2). (Fig. 2A, B, F).
Fig.2
Increased α-amylase immunoreactivity and glycogen load in cultured astrocytes after Aβ42 stimulation. Confocal images in (A–C) show double immunofluorescent AMY2A/glycogen staining of cells treated with vehicle control (Ctrl), 10 μM Aβ oligomers (Aβ42 O), and 10 μM Aβ42 fibrils (Aβ42 F). Scale bar = 40 μm. The small square marks an area shown at higher magnification (bottom left), where increased glycogen granules (red indicated with arrowheads in A–C) and AMY2A immunoreactivity (green in A–C) can be visualized to a higher degree after Aβ42 fibril stimulation (C) compared to Ctrl (A). Scale bar = 8 μm. Column scatter plots in (D-E) show area percentage of AMY2A and glycogen immunoreactivity in the stimulated cells. Significant higher area percentage of AMY2A (D) and glycogen (E) was seen in Aβ42 O stimulated cells compared with Ctrl and an even more pronounced increase of AMY2A area percentage after Aβ42 F stimulation compared with Ctrl. Column scatter plots in (F) show the number of glycogen granules exceeding 1 μm2 /stimulated HA cells. HA cells stimulated with Aβ42 O or Aβ42 F showed greater number of glycogen granules exceeding 1 μm2 compared to controls. The experiment was independently performed three times and 3-4 cells from each experiment and condition (in total 10 per condition) was analyzed. Data was analyzed using one-way ANOVA with Tukey post-test and presented as mean ± SD. **p < 0.01, ***p < 0.001.
Astrocytic α-amylase can be found within the cytosol, in lysosomes, and in the cell nucleus
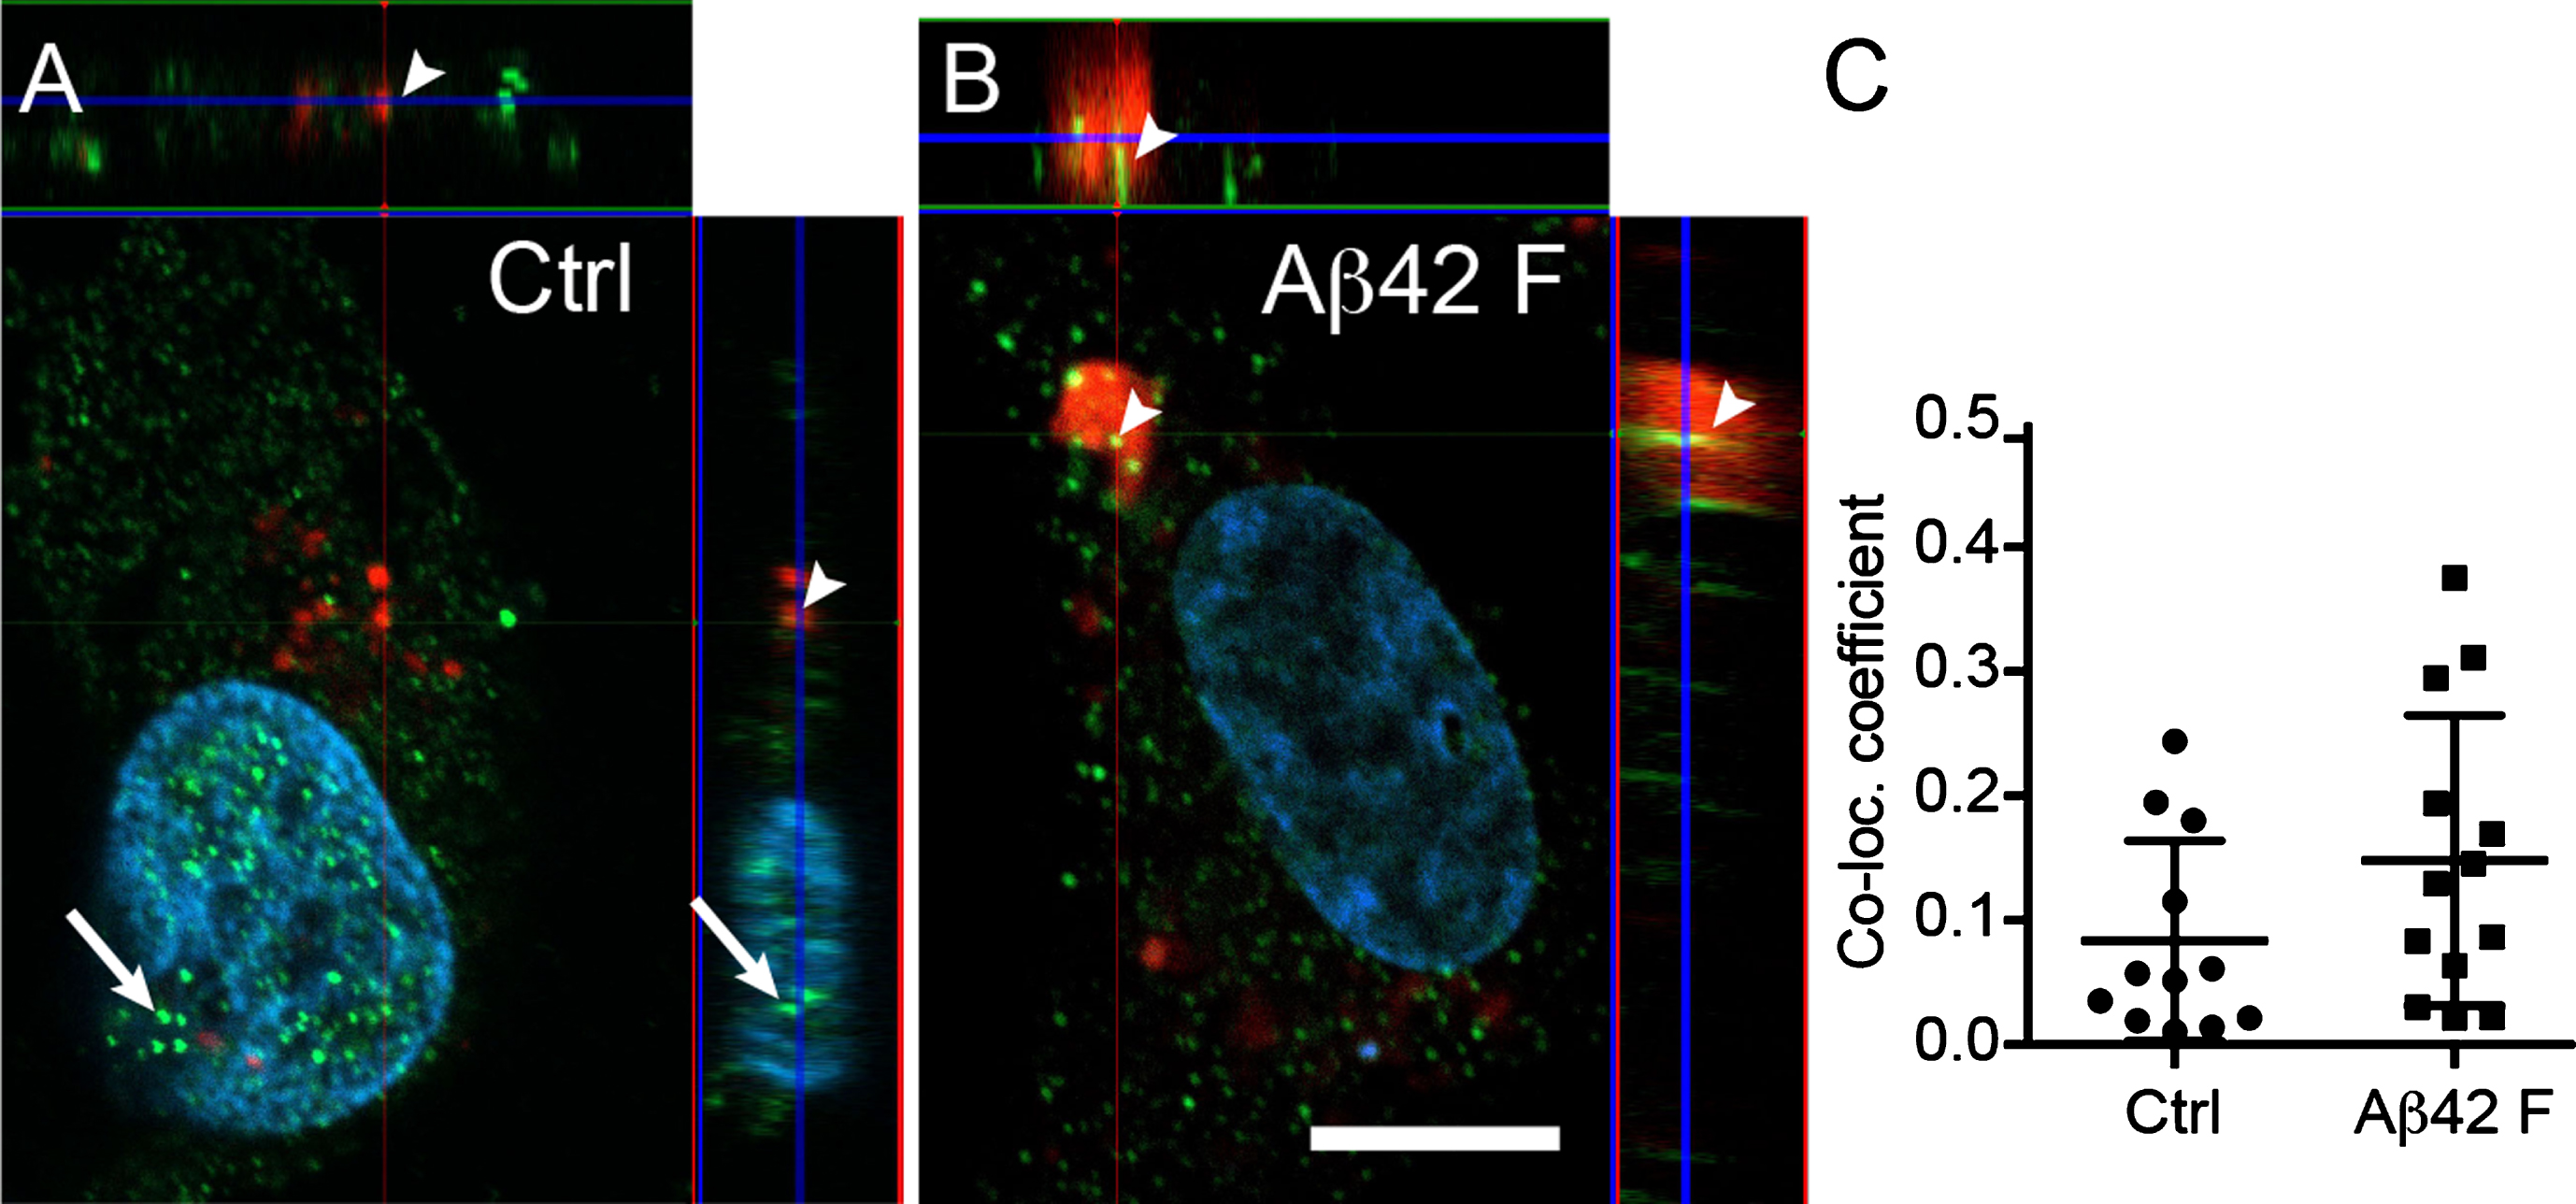
Confocal analysis of the cellular localization of α-amylase in HA indicated that, while most of the α-amylase appeared to be cytosolic, a fraction of the enzyme was found within the nucleus (Fig. 3A, B). In addition, some of the AMY2A co-localized with lysosomes (Fig. 3A–C). Although the co-localization increased after stimulation with Aβ42 fibrils, the increase was not statistically significant (Fig. 3C). Finally, we observed enlarged lysosomes in all Aβ42 fibrils stimulated HA (more than 2 enlarged lysosomes in 10 out of 10 analyzed cells), whereas none of Ctrl HA (n = 10) had enlarged lysosomes (Fig. 3B).
Fig.3
Astrocytic α-amylase can be found within the cytosol, in lysosomes and in the cell nucleus. Confocal images in (A and B) show an AMY2A immunostaining of HA exposed to Lysotracker RED DND-99 (in red indicated with arrowheads in A and B), vehicle control (Ctrl) and 10 μM Aβ42 fibrils (Aβ42 F). The AMY2A (in green in A and B) was found within the cytosol but some AMY2A (indicated with arrows in A) was also found within the DAPI stained cell nucleus (in blue). The AMY2A (arrowheads in A and B) was also found within lysosomes (red in A and B) and some of the lysosomes were enlarged in the Aβ42 F stimulated HA cells (B). Scale bar = 5 μm. Column scatter plots in (C) show the co-localization coefficient AMY2A within lysosomes in the stimulated HA. No significant change in co-localization between Aβ42 F and Ctrl stimulated HA cells was detected. The experiment was independently performed three times and 3-4 cells from each experiment and condition (in total 10 per condition) was analyzed. Data was analyzed using one-way ANOVA with Tukey post-test and presented as mean±SD.
Unchanged gene expression but increased activity of α-amylase and downstream glycolytic changes in cultured astrocytes after Aβ42 stimulation
To further investigate if the Aβ42-induced increase in α-amylase immunoreactivity is reflected on a mRNA level or by enzyme activity, we analyzed the α-amylase gene expression and activity in Aβ42 stimulated HA. We found no significant difference in α-amylase gene expression between Aβ42 oligomer and fibril stimulated HA and Ctrl (Fig. 4A), but a significant increase in α-amylase activity was noted in Aβ42 fibril stimulated HA compared with Ctrl (Fig. 4B). Stimulation with Aβ42 oligomer also yielded a tendency toward increased α-amylase activity but the increase was not statistically significant. To further analyze whether the increased α-amylase activity seen after Aβ42 fibril stimulation is associated with glycolytic activity (i.e., glucose metabolism), we measured the activity of pyruvate kinase (PKM), an enzyme which in the final step of the glycolysis produces pyruvate. We found significantly increased PKM activity in HA cells stimulated with both Aβ42 oligomer and fibrils, but only the increase after Aβ42 fibril stimulation reached significance (Fig. 4C). To further investigate whether the Aβ42 fibril-induced increase in glycolytic activity leads to increased lactate secretion, we measured lactate levels in cell culture medium from stimulated HA cells. Cells stimulated with the α-amylase/α-glucosidase inhibitor acarbose (negative control) showed, as expected, lower lactate levels; however, no changes were seen after Aβ42 fibrils stimulation compared to Ctrl (Fig. 4D).
Fig.4
Unchanged gene expression but increased activity of α-amylase and glycolytic changes in cultured astrocytes after Aβ42 stimulation. Column scatter plot in (A) shows relative expression of α-amylase normalized against values of housekeeping genes ribosomal protein L13A (RPL13A) and hydroxymethylbilane synthase (HMBS) in HA stimulated with control (Ctrl), 10 μM Aβ oligomers (Aβ42 O), and 10 μM Aβ42 fibrils (Aβ42 F). No significant difference was seen between the stimulations. Column scatter plot in (B) shows the change in α-amylase activity seen in stimulated HA cells. Aβ42 F stimulated HA showed significantly higher α-amylase activity compared with Ctrl. Column scatter plot in (C) shows the change in pyruvate kinase (PKM) activity seen in stimulated HA cells. Aβ42 F significantly increased PKM activity in HA stimulated with Aβ42 F compared with Ctrl. Column scatter plot in (D) shows the unaltered lactate levels in cell culture medium after stimulation with Aβ42 F, but reduced lactate levels after stimulation with the negative control 5 μM acarbose. Column scatter plot in (E) shows the inhibiting impact of 1 μM propranolol (Prop.) on Aβ42 F induced α-amylase activity, were propranolol counteracted the Aβ42 F- induced α-amylase activity. Column scatter plot in (F) shows the PKM activity in HA after stimulation with propranolol and Aβ42 F. The experiments were performed independently three times with two replicates. Data was analyzed using one-way ANOVA with Tukey post-test and presented as mean±SD. *p < 0.05, **p < 0.01, ***p < 0.001.
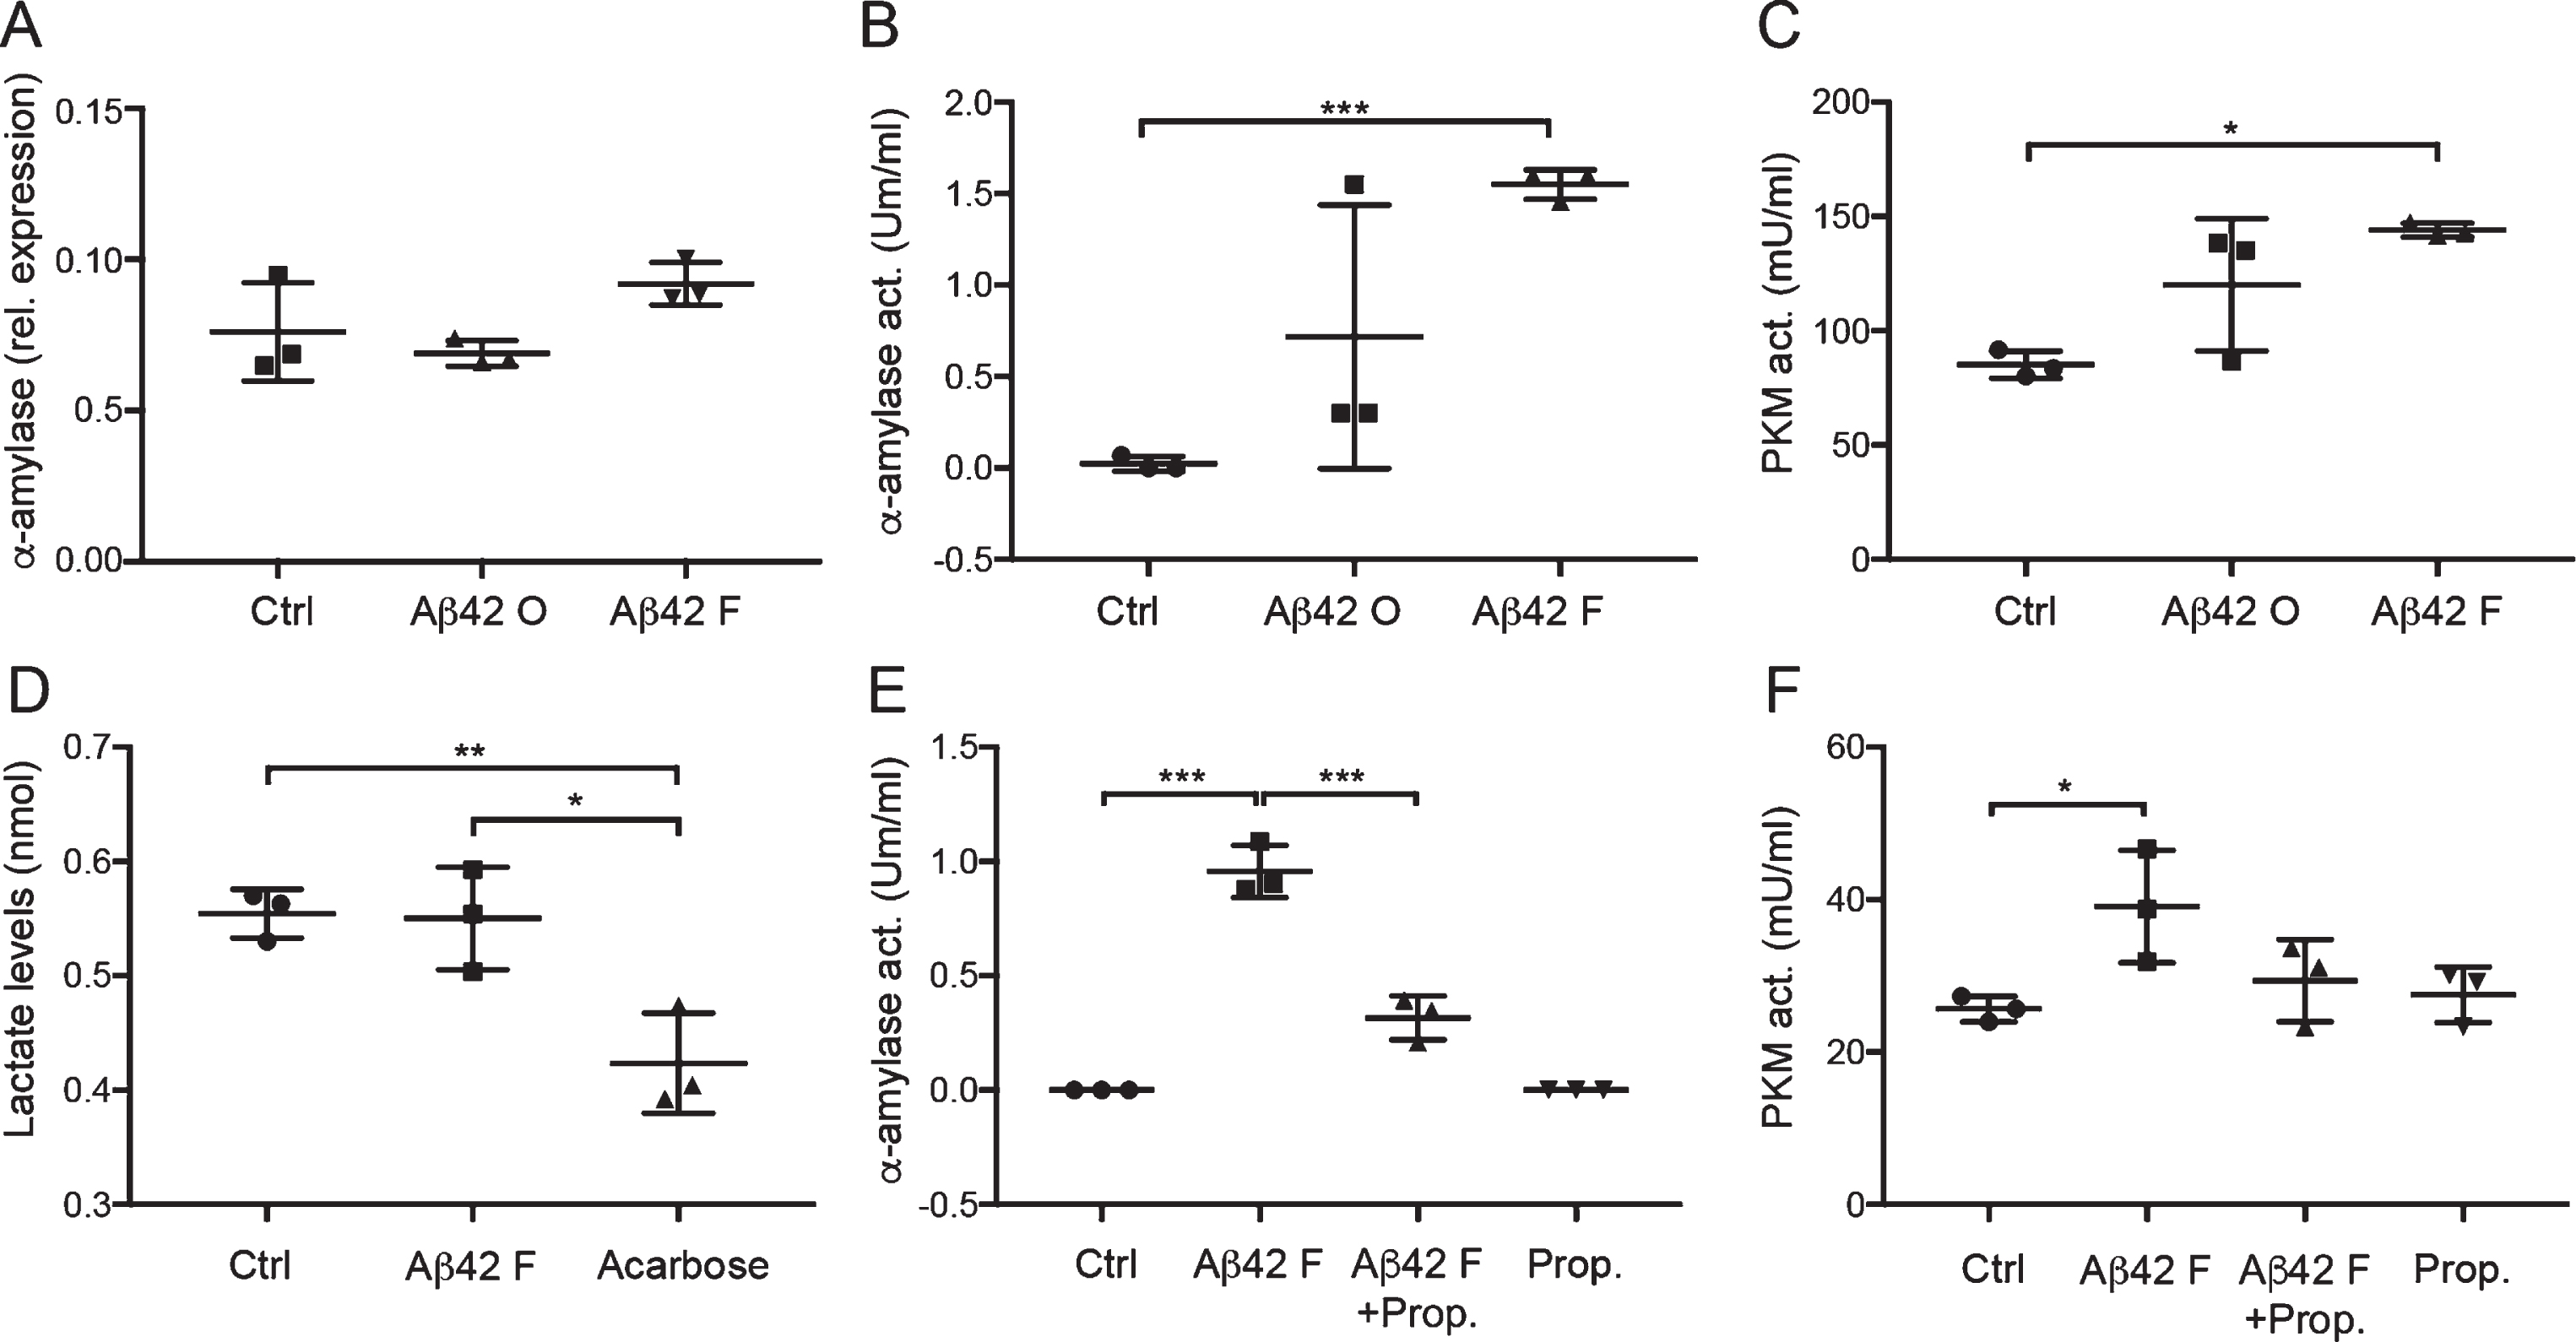
Aβ42-induced α-amylase activity is mediated by the β-adrenergic receptor
Since previous studies suggest an association between cAMP and α-amylase activity, and since cAMP levels in astrocytes are known to be regulated by the β-adrenergic receptor, we investigated whether the β-adrenergic receptor antagonist propranolol can influence the Aβ42 fibril-induced α-amylase activity. Indeed, while propranolol itself did not alter α-amylase activity compared with Ctrl, it significantly inhibited the increase in α-amylase activity induced by Aβ42 fibril (Fig. 4E), indicating a role for the β-adrenergic receptor in Aβ42 fibril induced α-amylase activity. To further study if the counteracting impact of propranolol on Aβ42 fibril-induced α-amylase activity is reflected in the downstream glycolytic pathway, we analyzed the PKM activity after the different stimulations. We found elevated PKM activity in HA stimulated with Aβ42 fibril compared to HA stimulated with Aβ42 fibril + propranolol; however, the increase was not significant. Furthermore, no changes were found when the activity in Ctrl, Aβ42 fibril + propranolol stimulated HA, and propranolol stimulated HA was compared (Fig. 4F).
DISCUSSION
The aim of this study was to investigate how astrocytic α-amylase is implicated in AD pathology and if the enzyme is associated with downstream glycolytic events in response to Aβ42. Our study was initiated by investigating the presence of AMY2A + glial cells in the entorhinal cortex, a brain area exposed to AD pathology in the earliest stages of the disease. In line with our previous studies, we noted that the AMY2A + glial cells were frequently found adjacent to Aβ42 plaques and were additionally found in significantly greater numbers in AD patients. The vast majority of AMY2A + glial cells co-expressed GFAP, whereas not all GFAP+cells expressed AMY2A and since the GFAP+/AMY2A+cells also showed hypertrophic features, we conclude that α-amylase is upregulated in activated astrocyte in presence of Aβ42. Since the activities of activated astrocytes requires large amount of energy, and given the glycogen degrading property of α-amylase, it is tempting to speculate that the increased presence of glycogen degrading α-amylase reflects an increased demand of energy. However, since α-amylase also could play an important role in transportation, functional modulation, and protection of interacting proteins/enzymes [36], it is also theoretically possible that the upregulation of α-amylase reflects an increased demand of such events in activated astrocytes.
The link between Aβ42 and increased astrocytic α-amylase activity was further shown in our cell culture studies demonstrating significantly increased α-amylase immunoreactivity in HA cells after both oligomers and fibril Aβ42 . The effect, however, was greater after fibril stimulation and α-amylase activity was only significantly increased after fibril Aβ42 stimulation. These finding may explain why astrocytes close to Aβ42 plaques, showed particularly strongly AMY2A immunoreactivity, as fibril Aβ42 is the major component of these plaques.
Our results demonstrating unaltered α-amylase gene expression, but increased α-amylase activity after fibril Aβ42 stimulation, further suggest that fibril Aβ42 rather influence post-translational modifications of α-amylase, than gene expression. This idea is supported by reports stating that up to 60% of all enzymes in the body are regulated with post-translational modifications [41]. Since such modifications are commonly induced by either phosphorylation or glycosylation and since AMY2A display several potential phosphorylation and glycosylation sites [42], one might speculate that fibril Aβ42 alters the α-amylase activity in astrocytes by inducing either event.
Our studies further showed that the increased α-amylase activation in response to fibril Aβ42 was inhibited by propranolol, a β-adrenergic receptor antagonist. The fibril Aβ42-induced increase in PKM activity was also lowered by propranolol, but this change did not reach significance (which could potentially be strengthen by the use of additional replicates in each experiment). The inhibiting impact of propranolol should be viewed from the perspective that salivary α-amylase is known to be upregulated by activation of the β-adrenergic receptor and downstream elevation of cAMP [37]. Interestingly, levels of cAMP increase after Aβ42 activation of the β-adrenergic receptor [31]. It may thus be hypothesized that fibril Aβ42 enhances α-amylase via the same signaling pathway and that inhibition of β-adrenergic receptor could reduce astrocytic glycogenolysis/protein interactions and thereby astrocytic activation. If this holds true, it is intriguing to note that patients with hypertension chronically treated with β-adrenergic receptor antagonists have a reduced risk for AD [43], and it is tempting to speculate that this reduced risk may in part be due to reduced damaging neuroinflammatory actions involving activation of astrocytes.
Although studies implicate the involvement of β-adrenergic receptor and cAMP in short-term glycogenolysis, studies also show that the same signaling pathways are involved in long-term glycogenesis (i.e., the formation of glycogen) [8]. We detected increased load of glycogen units in AMY2A + glial cells in entorhinal cortex of AD patients and in HA cells stimulated with oligomer and fibril Aβ42. The increase could reflect an Aβ42-induced long-term storage of glycogen, which intends to serve as an energy reserve in a compromised brain area. However, since the glycogen granules are enlarged, it is more likely that the Aβ42 induced glycogen load instead is associated with the formation of polysaccharides bodies and corpora amylacea (both containing undegradable polysaccharides) commonly seen in AD patients [19, 20]. It is furthermore important to point out that investigation of glycogen in postmortem tissue are complicated as normal glycogen reserves in the brain are usually degraded within 10 min after death [44]. Since the postmortem delay of individuals included in the study is between 4–7 h and given that the used glycogen antibody foremost captures larger glycogen units, we find it likely that our stainings capture foremost large undegradable glycogen units such as PGB rather than glycogen accessible for glycogenolysis. Hence, we are unable to clearly described the potential link between Aβ42 and glycogen formation in astrocytes ex vivo, but our in vitro studies indicate that glycogen load is indeed enhanced in cultured astrocytes after stimulation with fibril Aβ42. This finding is in line with a previous in vitro study demonstrating increased glycogen levels in human stem cell-derived astrocytes after 24 h exposure to oligomeric Aβ42 [45].
Since α-amylase is a glycogen degrading enzyme, is it plausible that an increase in α-amylase activity, as seen in our ex vivo and in vitro study, indicate an increase in glycogenolysis and downstream glycolytic activity. We therefore measured the PKM activity in the stimulated HA cells, as this activity is the final and irreversible step in the glycolysis [46]. The PKM activity was indeed increased in HA cells stimulated with fibril, but not oligomer, Aβ42 and we can thus conclude that HA cells increase their production of pyruvate in response to the fibril version of the amyloid peptide. The reversing impact of propranolol on PKM activity in fibril Aβ42 stimulated HA cells (where also the increased α-amylase activity is counteracted), further indicates that α-amylase is involved in the downstream glycolytic activity. However, it should be pointed out that the α-amylase activity was very low in relation to the PKM activity, which raises the question whether α-amylase activity in so low concentration can significantly contributes to glycogenolysis under normal conditions. We therefore hypothesis that α-amylase activity is rather a back-up system, acting foremost under pathological conditions when astrocytic energy is rapidly needed for reactive processes. It can further be speculated that α-amylase, instead of being involved in glycogenolysis, is involved on other activities by its potential ability to interacting with other protein and enzyme. It should further be noted that we know very little about brain α-amylase and it is not unlikely that the enzyme in minor ways diverts structurally from peripheral (pancreatic and salivary) α-amylase. Thus, since the activity assay used in the study is optimized for measuring peripheral α-amylase activity and since our AMY2A stainings as well as gene expression analysis show a robust presence of α-amylase, we cannot exclude the possibility that higher α-amylase activity could be captured using an assay specific for brain α-amylase activity.
As suggested by the ANSL hypothesis, astrocytes increase their glucose metabolism in order to support neurons with energy in form of lactate. It is thus possible that astrocytes increase α-amylase activity to aid dying or dysfunctional neurons in brain areas with AD pathology and neurodegeneration. However, to our surprise, we found no changes in L-lactate levels in the medium from HA cells stimulated with fibril Aβ42 compared to control cells. Similar findings have been reported before, where human stem cell derived astrocytes showed unaltered lactate secretion after stimulation with oligomer Aβ42 [45]. We thus conclude that the increase in α-amylase activity induced by fibril Aβ42 leads to foremost pyruvate, fueling endogenous processes involved in the activation provoked by Aβ42, and less to lactate aiding surrounding cells. Support for this idea can be found in an in vitro study using astrocyte-neuron co-cultures, which showed that although astrocytes increase their glucose uptake and glycolytic activity in response to Aβ, they are unable to rescue adjacent neurons [47]. Notably, stimulation with the negative control acarbose, a compound known to bind reversibly and non-competitively to α-amylase and α-amylase cleavage sites on starch [34, 48], significantly reduced lactate levels in medium of HA cells. This finding suggests that α-amylase glycogenolysis, under normal conditions does contribute to the ANSL process.
Since both the ex vivo and in vitro AMY2A staining yielded a dotted appearance, we hypothesized that astrocytic α-amylase is in part localized within vesicles with enzymatic activity such as lysosomes. Indeed, our confocal analysis of the HA cells revealed a co-localization between a portion of the AMY2A staining and the lysosomal marker Lysotracker RED DND-99. This finding indicates that α-amylase, in similarity to α-glycosidase [49, 50], degrades glycogen in lysosomes. However, we cannot exclude the possibility that α-amylase has other scavenging and protein degrading functions in the lysosomal compartment. From this perspective it is interesting to note that HA cells stimulated with fibril Aβ42 displayed a higher, albeit not significant, portion of AMY2A co-localizing with the lysotracker. Whether this increase corresponds to higher amount of glycogen in lysosomes or increased need for breakdown of potential waste or toxic products (including Aβ42 aggregates) remains to be investigated. Many of the lysosomes in fibril Aβ42 stimulated HA cells were moreover enlarged and swollen, a sign of non-functional lysosomal activity [51]. Similar findings have been reported before, where astrocytes failing to degrading engulfed Aβ42 display enlarged endosomes [52] and the presence of lysosomal abnormalities in neurons in the AD brain [53]. The confocal analysis also revealed the presence of AMY2A within the DAPI positive nuclei. The specific significance of its presence within this cell compartment is not known, but metabolic enzymes have repeatedly been found within the nucleus [54–56]. Since these metabolic enzymes are associated with cell proliferation [57] and epigenetic modulations [58], we hypothesize that α-amylase plays a similar role, which again highlights its role in activation of astrocytes.
To conclude, knowledge on underlying mechanisms and actors in the brain involved in energy supply as well as in what way alterations of the same are implicated in neurodegenerative disease is scarce. Our study, demonstrating a possible role for α-amylase activity in astrocytic glycogenolysis and downstream glycolytic activities in response to Aβ42, highlights α-amylase as a potential regulating actor in AD pathology. Moreover, the inhibiting impact of β-adrenergic receptor antagonists on α-amylase activity and downstream glycolytic activities opens up for new strategies to regulate astrocytic activation and neuroinflammatory processes involved in AD pathology.
ACKNOWLEDGMENTS
The authors thank Camilla Orbjörn and Samia Hamdan for technical support and Hitoshi Ashida for the kind gift of the glycogen antibody. The authors also wish to acknowledge the Swedish Research Council (MW, MF), Petrus and Augusta Hedlund foundation (MW), Swedish Dementia foundation (MW), the Crafoord foundation (MW), the Greta and Johan Kockska foundations (MW), the Åhlén foundation and the Åke Wiberg foundation for financially supporting this study. The work was done using imaging setups financed by the Swedish Research Council, Strategic Research Area Exodiab, Dnr 2009-1039, Swedish Foundation for Strategic Research Dnr IRC15-0067 and Knut and Alice Wallenberg Foundation.
Authors’ disclosures available online (https://www.j-alz.com/manuscript-disclosures/18-0997r2).
SUPPLEMENTARY MATERIAL
[1] The supplementary material is available in the electronic version of this article: http://dx.doi.org/10.3233/JAD-180997.
REFERENCES
[1] | Sofroniew MV , Vinters HV ((2010) ) Astrocytes: Biology and pathology. Acta Neuropathol 119: , 7–35. |
[2] | Gurer G , Gursoy-Ozdemir Y , Erdemli E , Can A , Dalkara T ((2009) ) Astrocytes are more resistant to focal cerebral ischemia than neurons and die by a delayed necrosis. Brain Pathol 19: , 630–641. |
[3] | Bélanger M , Allaman I , Magistretti PJ ((2011) ) Brain energy metabolism: Focus on astrocyte-neuron metabolic cooperation. Cell Metab 14: , 724–738. |
[4] | Cataldo AM , Broadwell RD ((1986) ) Cytochemical identification of cerebral glycogen and glucose-6-phosphatase activity under normal and experimental conditions. II. Choroid plexus and ependymal epithelia, endothelia and pericytes. J Neurocytol 15: , 511–524. |
[5] | Obel LF , Muller MS , Walls AB , Sickmann HM , Bak LK , Waagepetersen HS , Schousboe A ((2012) ) Brain glycogen-new perspectives on its metabolic function and regulation at the subcellular level. Front Neuroenergetics 4: , 3. |
[6] | Subbarao KV , Hertz L ((1990) ) Effect of adrenergic agonists on glycogenolysis in primary cultures of astrocytes. Brain Res 536: , 220–226. |
[7] | Sorg O , Magistretti PJ ((1992) ) Vasoactive intestinal peptide and noradrenaline exert long-term control on glycogen levels in astrocytes: Blockade by protein synthesis inhibition. J Neurosci 12: , 4923–4931. |
[8] | Sorg O , Magistretti PJ ((1991) ) Characterization of the glycogenolysis elicited by vasoactive intestinal peptide, noradrenaline and adenosine in primary cultures of mouse cerebral cortical astrocytes. Brain Res 563: , 227–233. |
[9] | Brown AM , Ransom BR ((2007) ) Astrocyte glycogen and brain energy metabolism. Glia 55: , 1263–1271. |
[10] | Pellerin L , Magistretti PJ ((2003) ) Food for thought: Challenging the dogmas. J Cereb Blood Flow Metab 23: , 1282–1286. |
[11] | Gibbs ME ((2015) ) Role of glycogenolysis in memory and learning: Regulation by noradrenaline, serotonin and ATP. Front Integr Neurosci 9: , 70. |
[12] | Suzuki A , Stern SA , Bozdagi O , Huntley GW , Walker RH , Magistretti PJ , Alberini CM ((2011) ) Astrocyte-neuron lactate transport is required for long-term memory formation. Cell 144: , 810–823. |
[13] | Dienel GA ((2017) ) Lack of appropriate stoichiometry: Strong evidence against an energetically important astrocyte-neuron lactate shuttle in brain. J Neurosci Res 95: , 2103–2125. |
[14] | Braak H , Braak E ((1991) ) Neuropathological stageing of Alzheimer-related changes. Acta Neuropathol 82: , 239–259. |
[15] | Ishibashi K , Kawasaki K , Ishiwata K , Ishii K ((2015) ) Reduced uptake of 18F-FDG and 15O-H2O in Alzheimer’s disease-related regions after glucose loading. J Cereb Blood Flow Metab 35: , 1380–1385. |
[16] | Kljajevic V , Grothe MJ , Ewers M , Teipel S , Alzheimer’s Disease Neuroimaging Initiative ((2014) ) Distinct pattern of hypometabolism and atrophy in preclinical and predementia Alzheimer’s disease. Neurobiol Aging 35: , 1973–1981. |
[17] | Mosconi L , Berti V , Glodzik L , Pupi A , De Santi S , de Leon MJ ((2010) ) Pre-clinical detection of Alzheimer’s disease using FDG-PET, with or without amyloid imaging. J Alzheimers Dis 20: , 843–854. |
[18] | Carbonell F , Zijdenbos AP , McLaren DG , Iturria-Medina Y , Bedell BJ , Alzheimer’s Disease Neuroimaging Inititative ((2016) ) Modulation of glucose metabolism and metabolic connectivity by beta-amyloid. J Cereb Blood Flow Metab 36: , 2058–2071. |
[19] | Rohn TT ((2015) ) Corpora amylacea in neurodegenerative diseases: Cause or effect? Int J Neurol Neurother 2: , 031. |
[20] | Huang L , Hollingsworth RI , Castellani R , Zipser B ((2004) ) Accumulation of high-molecular-weight amylose in Alzheimer’s disease brains. Glycobiology 14: , 409–416. |
[21] | Cavanagh JB ((1999) ) Corpora-amylacea and the family of polyglucosan diseases. Brain Res Brain Res Rev 29: , 265–295. |
[22] | Auge E , Pelegri C , Manich G , Cabezon I , Guinovart JJ , Duran J , Vilaplana J ((2018) ) Astrocytes and neurons produce distinct types of polyglucosan bodies in Lafora disease. Glia 66: , 2094–2107. |
[23] | Turnbull J , Wang P , Girard JM , Ruggieri A , Wang TJ , Draginov AG , Kameka AP , Pencea N , Zhao X , Ackerley CA , Minassian BA ((2010) ) Glycogen hyperphosphorylation underlies Lafora body formation. Ann Neurol 68: , 925–933. |
[24] | Bigl M , Bruckner MK , Arendt T , Bigl V , Eschrich K ((1999) ) Activities of key glycolytic enzymes in the brains of patients with Alzheimer’s disease. J Neural Transm (Vienna) 106: , 499–511. |
[25] | Osborn LM , Kamphuis W , Wadman WJ , Hol EM ((2016) ) Astrogliosis: An integral player in the pathogenesis of Alzheimer’s disease. Prog Neurobiol 144: , 121–141. |
[26] | Wisniewski HM , Wegiel J ((1991) ) Spatial relationships between astrocytes and classical plaque components. Neurobiol Aging 12: , 593–600. |
[27] | Pike CJ , Cummings BJ , Cotman CW ((1995) ) Early association of reactive astrocytes with senile plaques in Alzheimer’s disease. Exp Neurol 132: , 172–179. |
[28] | Gonzalez-Reyes RE , Nava-Mesa MO , Vargas-Sanchez K , Ariza-Salamanca D , Mora-Munoz L ((2017) ) Involvement of astrocytes in Alzheimer’s disease from a neuroinflammatory and oxidative stress perspective. Front Mol Neurosci 10: , 427. |
[29] | Veerhuis R , Janssen I , Hack CE , Eikelenboom P ((1996) ) Early complement components in Alzheimer’s disease brains. Acta Neuropathol 91: , 53–60. |
[30] | Ben Haim L , Carrillo-de Sauvage MA , Ceyzeriat K , Escartin C ((2015) ) Elusive roles for reactive astrocytes in neurodegenerative diseases. Front Cell Neurosci 9: , 278. |
[31] | Igbavboa U , Johnson-Anuna LN , Rossello X , Butterick TA , Sun GY , Wood WG ((2006) ) Amyloid beta-protein1-42 increases cAMP and apolipoprotein E levels which are inhibited by beta1 and beta2-adrenergic receptor antagonists in mouse primary astrocytes. Neuroscience 142: , 655–660. |
[32] | Byman E , Schultz N , Netherlands Brain B , Fex M , Wennstrom M ((2018) ) Brain alpha-amylase: A novel energy regulator important in Alzheimer disease? Brain Pathol 28: , 920–932. |
[33] | Janeček Š , Svensson B , MacGregor EA ((2014) ) α-Amylase: An enzyme specificity found in various families of glycoside hydrolases. Cell Mol Life Sci 71: , 1149–1170. |
[34] | Ferey-Roux G , Perrier J , Forest E , Marchis-Mouren G , Puigserver A , Santimone M ((1998) ) The human pancreatic alpha-amylase isoforms: Isolation, structural studies and kinetics of inhibition by acarbose. Biochim Biophys Acta 1388: , 10–20. |
[35] | Whitcomb DC , Lowe ME ((2007) ) Human pancreatic digestive enzymes. Dig Dis Sci 52: , 1–17. |
[36] | Crosara KTB , Zuanazzi D , Moffa EB , Xiao Y , Machado M , Siqueira WL ((2018) ) Revealing the amylase interactome in whole saliva using proteomic approaches. Biomed Res Int 2018: , 6346954. |
[37] | Chopra DP , Xue-Hu IC ((1993) ) Secretion of alpha-amylase in human parotid gland epithelial cell culture. J Cell Physiol 155: , 223–233. |
[38] | Nakamura-Tsuruta S , Yasuda M , Nakamura T , Shinoda E , Furuyashiki T , Kakutani R , Takata H , Kato Y , Ashida H ((2012) ) Comparative analysis of carbohydrate-binding specificities of two anti-glycogen monoclonal antibodies using ELISA and surface plasmon resonance. Carbohydr Res 350: , 49–54. |
[39] | Brannstrom K , Ohman A , Nilsson L , Pihl M , Sandblad L , Olofsson A ((2014) ) The N-terminal region of amyloid beta controls the aggregation rate and fibril stability at low pH through a gain of function mechanism. J Am Chem Soc 136: , 10956–10964. |
[40] | Schmittgen TD , Livak KJ ((2008) ) Analyzing real-time PCR data by the comparative C(T) method. Nat Protoc 3: , 1101–1108. |
[41] | Vogel C , Marcotte EM ((2012) ) Insights into the regulation of protein abundance from proteomic and transcriptomic analyses. Nat Rev Genet 13: , 227–232. |
[42] | Mohamed M ((2017) ) Role of Amylase in Ovarian Cancer. Graduate Theses and Dissertations. http://scholarcommons.usf.edu/etd/6907 |
[43] | Luong K , Nguyen LT ((2013) ) The role of Beta-adrenergic receptor blockers in Alzheimer’s disease: Potential genetic and cellular signaling mechanisms. Am J Alzheimers Dis Other Demen 28: , 427–439. |
[44] | Lowry OH , Passonneau JV ((1964) ) The relationships between substrates and enzymes of glycolysis in brain. J Biol Chem 239: , 31–42. |
[45] | Tarczyluk MA , Nagel DA , Rhein Parri H , Tse EH , Brown JE , Coleman MD , Hill EJ ((2015) ) Amyloid beta 1-42 induces hypometabolism in human stem cell-derived neuron and astrocyte networks. J Cereb Blood Flow Metab 35: , 1348–1357. |
[46] | Gray LR , Tompkins SC , Taylor EB ((2014) ) Regulation of pyruvate metabolism and human disease. Cell Mol Life Sci 71: , 2577–2604. |
[47] | Allaman I , Gavillet M , Belanger M , Laroche T , Viertl D , Lashuel HA , Magistretti PJ ((2010) ) Amyloid-beta aggregates cause alterations of astrocytic metabolic phenotype: Impact on neuronal viability. J Neurosci 30: , 3326–3338. |
[48] | Rosak C , Mertes G ((2012) ) Critical evaluation of the role of acarbose in the treatment of diabetes: Patient considerations. Diabetes Metab Syndr Obes 5: , 357–367. |
[49] | McCormick D , Maunoury R , Delpech B ((1980) ) Lysosomal hydrolases in long term cultures of human gliomas: Total enzyme activities and rate of extracellular accumulation. Neuropathol Appl Neurobiol 6: , 133–141. |
[50] | DeRuisseau LR , Fuller DD , Qiu K , DeRuisseau KC , Donnelly WH Jr , Mah C , Reier PJ , Byrne BJ ((2009) ) Neural deficits contribute to respiratory insufficiency in Pompe disease. Proc Natl Acad Sci U S A 106: , 9419–9424. |
[51] | Puri R , Suzuki T , Yamakawa K , Ganesh S ((2012) ) Dysfunctions in endosomal-lysosomal and autophagy pathways underlie neuropathology in a mouse model for Lafora disease. Hum Mol Genet 21: , 175–184. |
[52] | Sollvander S , Nikitidou E , Brolin R , Soderberg L , Sehlin D , Lannfelt L , Erlandsson A ((2016) ) Accumulation of amyloid-beta by astrocytes result in enlarged endosomes and microvesicle-induced apoptosis of neurons. Mol Neurodegener 11: , 38. |
[53] | Cataldo AM , Hamilton DJ , Nixon RA ((1994) ) Lysosomal abnormalities in degenerating neurons link neuronal compromise to senile plaque development in Alzheimer disease. Brain Res 640: , 68–80. |
[54] | Mamczur P , Borsuk B , Paszko J , Sas Z , Mozrzymas J , Wisniewski JR , Gizak A , Rakus D ((2015) ) Astrocyte-neuron crosstalk regulates the expression and subcellular localization of carbohydrate metabolism enzymes. Glia 63: , 328–340. |
[55] | Uno K , Shimada S , Tsuruta J , Matsuzaki H , Tashima S , Ogawa M ((1998) ) Nuclear localization of brain-type glycogen phosphorylase in some gastrointestinal carcinoma. Histochem J 30: , 553–559. |
[56] | Wang W , Wang L , Endoh A , Hummelke G , Hawks CL , Hornsby PJ ((2005) ) Identification of alpha-enolase as a nuclear DNA-binding protein in the zona fasciculata but not the zona reticularis of the human adrenal cortex. J Endocrinol 184: , 85–94. |
[57] | Mamczur P , Gamian A , Kolodziej J , Dziegiel P , Rakus D ((2013) ) Nuclear localization of aldolase A correlates with cell proliferation. Biochim Biophys Acta 1833: , 2812–2822. |
[58] | Boukouris AE , Zervopoulos SD , Michelakis ED ((2016) ) Metabolic enzymes moonlighting in the nucleus: Metabolic regulation of gene transcription. Trends Biochem Sci 41: , 712–730. |


