
Distinctive Neurochemistry in Alzheimer’s Disease via 7 T In Vivo Magnetic Resonance Spectroscopy
Abstract
This study’s objective was to increase understanding of biological mechanisms underlying clinical Alzheimer’s disease (AD) by noninvasively measuring an expanded neurochemical profile and exploring how well this advanced technology distinguishes AD from cognitively normal controls. We measured concentrations of 14 neurochemicals using ultra-high field (7 T) ultra-short echo time (8 ms) magnetic resonance spectroscopy (MRS) in 16 participants with mild to moderate clinical AD and 33 age- and gender-matched control participants. MRS was localized to the posterior cingulate cortex (PCC), a region known to be impacted by AD, and the occipital cortex (OCC), a control region. Participants with AD were recruited from dementia specialty clinics. Concentration of the antioxidant ascorbate was higher (p < 0.0007) in both brain regions. Concentrations of the glial marker myo-inositol and the choline-containing compounds involved in membrane turnover were higher (p≤0.0004) in PCC of participants with AD. Ascorbate and myo-inositol concentrations were strongly associated, especially in the PCC. Random forests, using the 14 neurochemicals in the two regions, distinguished participants with AD from controls: same-sample sensitivity and specificity were 88% and 97%, respectively, though out-of-sample-values would be lower. Ultra-high field ultra-short echo time MRS identified the co-occurrence of elevated ascorbate and myo-inositol in the PCC as markers that distinguish participants with mild to moderate AD from controls. While elevated myo-inositol may be a surrogate marker of neuroinflammation, the unexpected elevation of the antioxidant ascorbate may reflect infiltration of ascorbate-rich leukocytes.
INTRODUCTION
Noninvasive magnetic resonance spectroscopy (MRS) has been used to measure disease-associated neurochemical concentration differences in human Alzheimer’s disease (AD). Most existing reports are focused on four major neurochemicals contributing the strongest signals to in vivo spectra. N-acetylaspartate (NAA), typically reported together with N-acetylaspartylglutamate (NAAG), i.e., tNAA, is a neuronal metabolite [1] associated with neuronal viability [1], density [2], or dysfunction [2–4]. Lower tNAA has been reported in AD [2, 3]. The concentration of creatine-containing compounds (tCr, creatine plus phosphocreatine), markers of energy utilization, has been found to be the same in people with AD and healthy controls [5], and is often used in AD literature as an internal reference. Glycerophosphorylcholine and phosphorylcholine are part of cellular membrane, but contribute to the total choline (tCho) signal when membranes break down, thus tCho is thought of as a membrane marker [6]. Some report increases in tCho in AD while others report no change [3]. Myo-inositol (mIns) is a glial osmolyte [3, 5, 7] traditionally seen as a marker of glial cell content [2] or activation [3, 7], but recently proposed as a surrogate marker of neuroinflammation in AD [1]. In the posterior cingulate cortex (PCC), a brain region impacted by AD and readily studied with MRS, elevated mIns/tCr is present at preclinical stages of AD, whereas low tNAA/tCr and elevated tCho/tCr are not generally detected until diagnosis of mild cognitive impairment (MCI) or later stage AD [1, 5, 8]. The magnitudes of the mIns elevation and tNAA reduction increase as AD progresses [1, 5]. These disease-associated concentration differences in mIns and tNAA are thought to reflect increasing glial activation and neuronal loss. mIns elevation may be related to glial proliferation and microglial activation such as occurs when Aβ plaques are surrounded by microglia and astrocytes in AD.
Concentrations of neurochemicals contributing weaker signals in MRS are more challenging to quantify. There are few reports on their noninvasively measured concentrations in AD. We recently validated an ultra-short echo time, ultra-high field MRS approach to quantify fourteen neurochemicals in the context of aging, and found that the concentration of the antioxidant vitamin C (Asc, ascorbate) was lower in the brains of older adults [9]. In AD, Asc has several potential protective mechanisms associated with its antioxidant capacity in addition to scavenging free radicals directly [10]. Asc modulates amyloid accumulation via a mechanism associated with the oxidative stress pathway and protects the endothelia from reactive oxygen species [10]. Additionally, Asc moderates glia-mediated inflammation which is activated by oxidative stress [11].
The main goal of the present work was to study more extensively the neurochemical profile than has been done previously in clinical AD with particular interest in antioxidant concentrations. In addition to extending the neurochemical profile, the use of ultra-high field (≥7 T) improves sensitivity and reliability for quantifying the entire neurochemical profile [12, 13]. Therefore, a secondary goal of this study was to observe whether scanning at ultra-high field increases sensitivity of the neurochemical profile to AD. The study was designed and powered to compare dichotomous groups, well-characterized participants with mild to moderate AD versus cognitively normal, asymptomatic, neurologically intact age-matched controls.
MATERIALS AND METHODS
Participants and study design
Older adults with clinical AD were identified through an IRB approved database of patients cared for at the Geriatric Research, Education and Clinical Center (GRECC) Memory Loss Clinic at the Minneapolis Veterans Affairs Medical Center. The GRECC clinic employs an interdisciplinary team to rigorously assess patients referred for cognitive evaluation. All patients are reviewed and diagnosed through consensus diagnosis with team members, including a neurologist, internist, geropsychiatrists, and neuropsychologists. Participants enrolled in this study met criteria for a diagnosis of probable or possible AD based on NINCDS-ADRDA criteria [14]. Those with possible AD were not recruited if non-AD medical conditions were felt to potentially affect regions of interest (posterior cingulate and occipital lobe). One participant was recruited from a well-established, interdisciplinary community dementia clinic, Health Partners Center for Memory and Aging (CMA) and the diagnosis of probable AD was confirmed by the study neurologist (JRM), the Medical Director of the Minneapolis GRECC. Participants with AD had mild to moderate dementia, based on the Montreal Cognitive Assessment (MoCA [15]) ≥12/30 or Mini-Mental State Exam (MMSE [16]) ≥17/30 and independence in basic activities of daily living. All participants with AD met the same exclusion criteria as controls (listed below) except for cognitive complaints (allowed), and a neurological diagnosis that could affect cognition (only AD allowed).
Thirty three controls completed a medical history questionnaire validated for recruitment of healthy controls for cognitive aging research [17] and cognitive and psychological screens (MoCA [15] and Beck Depression Inventory-II (BDI-II [18]). For participants who passed screens, the study neurologist reviewed with each their medical history and performed a neurological examination to confirm their status as a neurologically healthy older adult. The controls were prospectively age- and gender-matched with the older adults with AD.
Exclusion criteria for all participants were claustrophobia, non-removable metallic objects of concern for MRI, smoking, weight >113 kg accompanied by BMI >35, and head circumference ≥23.25 inches due to the limited coil size. Medical history on the day of the MRI scan addressed the following exclusion criteria for controls: cognitive complaints, unstable medication regimen, currently symptomatic for a major psychiatric disorder, history of alcohol or substance abuse or dependence within the past two years, serious medical illness (including creatinine clearance <40 mL/min [19]), medical condition or neurological diagnosis that potentially could affect cognition, history of seizure, stroke, traumatic brain injury, or hospital stay related to head injury, or use of investigational drugs that may impact cognition within 30 days or 5 half-lives, whichever is longer. Examination exclusion criteria on the day of the MRI scan included a score <24 on MoCA [15], score ≥20 on BDI-II [18], or any abnormality on the neurological examination that could be due to a lesion or disease of the brain.
Sixteen older adults with clinical AD (15 males, 1 female; age 78±7 (mean±standard deviation) years; age range: 69 to 89 years; MoCA (n = 11) = 16±4; range: 12 to 26; MMSE (n = 5) = 19±2; range: 17 to 21) and thirty three controls (25 males, 8 females; age: 76±6 years; age range: 67 to 88 years; MoCA = 27±2; range: 24 to 29; creatinine = 78±24 mL/min; range: 42 to 128 mL/min) provided informed consent according to procedures approved by the Human Subjects’ Protection Committee at the University of Minnesota, Institutional Review Board, and underwent an MRI exam at 7 T. Six of the thirty three controls underwent two additional retest scans (for a total of three scans at approximately weekly intervals). Sixteen controls have been part of previously published work [9] and seventeen controls were newly recruited (de novo).
MR acquisition
All MR data were acquired using the same methodology as was used in a previous study [9]. Briefly, studies were performed on a 7-T whole-body Siemens MAGNETOM scanner (Siemens, Erlangen, Germany) using a 16-channel transmission line head array radiofrequency coil with
Image processing and analysis
Image processing and analysis were performed using the same methodology as was used in a previous study [9]. Briefly, MPRAGE images acquired at 7 T or 3 T for all participants after processing were segmented into GM, WM, and CSF content using Freesurfer [24]. For all controls except two from the earlier study, 7 T images were used to obtain tissue content. For the remaining two controls from the earlier study, de novo controls and participants with AD, 3 T images were used to obtain tissue content.
Spectral processing and quantification
The acquired spectra were processed in Matlab (MathWorks Inc., Natick, MA). Eddy-current effects were corrected using the phase information from non-suppressed water spectrum. Single-shot spectra were frequency and phase aligned using a cross-correlation algorithm.
All spectra were analyzed using LCModel [25] 6.3-1J (Stephen Provencher, Inc., Oakville, ON, Canada) using the same methodology as was used in a previous study [9]. The following metabolites were included in the basis set: Asc, aspartate (Asp), creatine (Cr), γ-aminobutyric acid (GABA), glucose (Glc), glutamine (Gln), glutamate (Glu), glutathione (GSH), glycerophosphorylcholine (GPC), lactate (Lac), mIns, NAA, NAAG, phosphocreatine (PCr), phosphorylcholine (PCho), phosphorylethanolamine (PE), scyllo-inositol (sIns), and taurine (Tau). Experimentally measured, age-specific macromolecule spectra were also included in the basis set. In addition, standard lipid resonances provided by LCModel were included in the analysis as described previously [9]. A resonance at 3.155 ppm was also included to fit the resonance of methylsulfonylmethane, a dietary supplement [26]. No baseline correction, zero-filling, or line broadening were applied to the in vivo data prior to the analysis. Spectra were fitted between 0.5 and 4.1 ppm using a knot spacing (DKNTMN) of 5 to impose a flat spline baseline [27].
Quantification was performed using the unsuppressed water signal obtained from the same VOI as the neurochemical signals for normalization [28]. This water signal was corrected for GM, WM, and CSF content. The water content for CSF and WM were assumed to be 0.97 [29] and 0.71 [4, 30, 31]. For GM, the water content was assumed to be 0.79 for older women [30] and 0.76 for older men [30]. T1 and T2 relaxation time constants of water used in the calculation of the attenuation factors were taken from published reports [T1(GM) = 2130 ms, T1(WM) = 1220 ms, T1(CSF) = 4425 [32]; T2(GM) = 50 ms, T2(WM) = 55 ms,T2(CSF) = 141 ms [33]] and included a 10% reduction in T2 of tissue water [34] [T2(GM) = 45 ms, T2(WM) = 49.5 ms]. The T1 and T2 relaxation time constants of neurochemicals were not taken into consideration as attenuation factors since their T1 are shorter and their T2 are longer than water, thus the effect would be very small given the use of repetition time of 5 s and echo time of 8 ms.
All neurochemical concentrations were retained for statistical analysis, i.e., no measurements were removed because of their Cramér-Rao lower bounds (CRLB, an estimate of the lower limit of the variance) [35, 36]. If the spectral overlap caused the covariance between two neurochemicals to be high (characterized by strong negative correlation, i.e., correlation coefficient< – 0.7) for all of the participants in both age groups and regions, the sum of the neurochemical concentrations was reported, specifically tCr = Cr + PCr, and tCho = PCho + GPC. Glc and Lac were not quantified because they are present in CSF at concentrations of 2-3 mM, i.e., comparable to tissue [37].
Statistical analyses
Statistical analyses were done with JMP Pro v. 13.1.0 (SAS Institute, Cary, NC). Neurochemical concentrations in the two cohorts (AD and controls) were compared using a mixed linear model with fixed effects group (AD versus control), region (PCC versus OCC), and their interaction, with group being a between-participant effect and region a within-participant effect. The random effects were participant and replication within participant (i.e., retest, for participants who had them). Pre-specified comparisons included comparing AD versus control in each region. The analysis used the restricted likelihood method. The present study’s sample size was chosen to provide adequate power for the dichotomous primary comparison of AD versus control. After the present study’s data were collected, we realized that a previous study had collected identical data on healthy elderly subjects, and included re-test data for some of those subjects, so that these previously collected data could be added to the present study’s control group to increase statistical power at no cost. To check whether the controls from the earlier study differed from the de novo controls, we compared the two groups of controls using the analysis described above (with the two groups of controls in place of AD versus controls). Tests showed that the two groups of healthy older adults were indeed similar, so the analyses presented combine these two groups into one control group. To test the impact of including only one woman with AD in the study, the same analysis was re-done including only males. To control for multiple testing (14 neurochemicals and two brain regions), the threshold of significance was 0.0018 = 0.05/28. To check whether including the controls from the earlier study changed the comparison AD versus controls, we re-did the primary analysis omitting them.
The bootstrap forests method (random forests as implemented in JMP) was used to explore whether the 28 neurochemical-region combinations differentiate participants with AD from controls. The outcome was each person’s group, with the 28 neurochemical-region combinations as predictors. Other random-forests specifications were: bootstrapping by simple random sampling with replacement on the whole dataset; seven predictors randomly selected to be considered for each split; and each split minimizes the p-value among available splits. This analysis rates each neurochemical for its ability to differentiate the groups, using the G2 measure (for which higher is better) and gauges the ensemble’s ability to differentiate the groups using two measures, generalized R2 (higher is better) and root mean squared error (RMSE; lower is better). These performance measures are described in detail below. We also report same-sample sensitivity and specificity of the fitted random forest. This is known to overstate the sensitivity and specificity that would be obtained in an out-of-sample validation.
To explore the importance of Asc in differentiating AD from control, this analysis was repeated without Asc in the dataset. To explore the relative importance of biochemical and structural measures in differentiating AD from control, the random forest analysis was also repeated adding GM, WM and CSF content for each region as predictors.
The G2 measure is used to describe each potential predictor’s predictive power. For each potential predictor, the G2 measure is first computed for each of the 1000 trees in the ensemble then summed across the trees to give the predictor’s G2 measure for the random-forests ensemble. For a single tree, a predictor’s G2 measure is computed first for each node in the tree that splits on that predictor, and then summed across nodes to give the G2 measure for the whole tree. For a single node splitting on the predictor, the contribution to the tree’s G2 is
Two measures, generalized R2, which is closely related to the G2 measure described above, and RMSE, were used to describe the explanatory power of the whole bootstrap forests ensemble fit to these data. Both use the ensemble’s estimated probability that a participant is in the AD group, as a function of the participant’s characteristics. This ensemble probability is estimated by estimating the analogous probability separately for each of the 1000 trees in the bootstrap-forest ensemble, then averaging those 1000 probabilities to give a single estimate for the subject. Generalized R2 is a generalization of the R2 measure used in linear regression, applicable to binary outcomes like AD versus control. It is (1 - [L (0)/L (model)] ∧ [2/n])/(1 - L (0) ∧ [2/n]), where n is the total sample size, L(model) is the sum over participants of -ln(p), p being a participant’s estimated probability of being in the group that they are actually in, and L(0) is -ln(n participant with AD/total n). RMSE is (sum over subjects[y - p]2/n)0.5, where p is the estimated probability of being in the AD group and y is 1 for participants in the AD group and 0 for participants in the control group.
Linear regression analysis in Microsoft Excel v. 14 (Microsoft Corporation, Redmond WA) was used to assess correlations between Asc and the other 13 neurochemical concentrations as well as CSF content in two brain regions.
RESULTS
Neurochemical concentrations from a subset of controls have been reported previously [9]. This subset of controls did not differ significantly from the de novo controls for any neurochemical, even without Bonferroni adjustment of p-value threshold (data not shown). High-quality spectra were consistently measured (Fig. 1) with strong, narrow resonances and flat baseline without evidence of contamination from unsuppressed water or lipids from outside the VOI. The tCr linewidths measured as the full width at half maximum of the resonance at 3.03 ppm were on average (±standard deviation) 11.9±1.4 Hz (range: 8.7 to 15.9 Hz). The signal-to-noise ratios of the highest peak in the spectra reported by LCModel were 47±7 (range: 23 to 60).
Fig.1
Data quality and voxel placement. Representative 1H MR spectra from an older adult with AD (top) and one control (bottom) acquired from volumes of interest (VOIs) positioned in the PCC and the OCC as shown on T1-weighted images. Spectra were acquired from 8 mL VOIs using a STEAM sequence (7 T, TR= 5 s, TE= 8 ms, number of averages = 128 for the PCC and 64 for the OCC). Spectra are shown with no line broadening applied and with vertical scaling reflecting measured NAA concentration.

The VOIs in the PCC contained 42±1.5% GM (mean±standard deviation), 26.7±1.3% WM, and 31.3±1.9% CSF in the older adults with AD, and 46.8±1.0% GM, 23.8±0.9% WM, and 29.4±1.3% CSF in the controls. The VOIs in the OCC contained 35.5±1.5% GM, 35.8±1.3% WM, and 28.9±1.9% CSF in the older adults with AD, and 37.1±1.0% GM, 36.3±0.9% WM, and 26.5±1.3% CSF in the controls.
Asc showed the greatest percent difference in neurochemical concentration between the two groups. CRLB for Asc were 0.20±0.04 mM (mean±SD, range 0.15–0.40 mM). The average CRLB for Asc differed less than 2% between participants with AD and controls for each brain region. There was no strong correlation reported by LCModel between Asc and any other neurochemical (or MM) for any individual or brain region. Table 1 lists all measured neurochemical concentrations by brain region and disease status. Asc, mIns, and tCho concentrations were markedly higher in the PCC (p≤0.004) in participants with AD, as was the concentration of Asc in the OCC in participants with AD (p = 0.0007). Removing the one female with AD and all control females changed the p-value of OCC Asc from 0.0007 to 0.0020, though the two analyses had similar effect sizes. p-values for PCC Asc, mIns, and tCho remained significant. Asc concentration was higher in both brain regions. While differences in mIns and tCho were specific to the PCC, no differences were specific to the OCC. Considering non-significant trends (0.05/28≤p≤0.03), PE concentration was lower in the PCC of participants with AD; Asp, and mIns concentrations were higher in the OCC of participants with AD; and NAAG concentration was lower in the OCC of participants with AD. In analyses comparing participants with AD to the subset of de novo controls, the estimated differences between AD and controls were as large or larger for the neurochemical-region combinations that tested significant in the primary analysis reported above, but due to the reduced control sample size, the p-values for these comparisons increased to slightly above our Bonferroni-adjusted threshold (p = 0.0037, 0.0075, 0.0036, 0.0024 for Asc PCC, Asc OCC, mIns PCC, and tCho PCC, respectively).
Table 1
Neurochemical concentrations measured in older adults with AD and controls, summary statistics
| PCC | OCC | |||||
| Neurochemical | Concentration (mM) | p | Concentration (mM) | p | ||
| AD | Controls | AD | Controls | |||
| Asc | 1.52±0.06 | 1.26±0.04 | 0.0002 | 1.66±0.06 | 1.42±0.04 | 0.0007 |
| Asp | 2.12±0.10 | 1.98±0.06 | 0.23 | 2.01±0.10 | 1.75±0.06 | 0.026 |
| GABA | 0.78±0.07 | 0.87±0.04 | 0.24 | 0.95±0.07 | 1.04±0.04 | 0.29 |
| Gln | 3.52±0.11 | 3.35±0.07 | 0.21 | 3.18±0.11 | 2.97±0.07 | 0.13 |
| Glu | 9.83±0.24 | 10.13±0.16 | 0.30 | 8.95±0.24 | 8.95±0.16 | 0.99 |
| GSH | 1.21±0.03 | 1.14±0.02 | 0.09 | 1.12±0.03 | 1.05±0.02 | 0.09 |
| mIns | 8.93±0.26 | 7.69±0.18 | 0.0003 | 7.84±0.26 | 7.06±0.18 | 0.017 |
| NAA | 10.49±0.28 | 10.84±0.19 | 0.32 | 11.81±0.28 | 11.65±0.19 | 0.65 |
| NAAG | 1.02±0.05 | 0.99±0.03 | 0.57 | 0.93±0.05 | 1.07±0.03 | 0.026 |
| PE | 0.97±0.07 | 1.16±0.04 | 0.014 | 0.75±0.07 | 0.77±0.04 | 0.83 |
| sIns | 0.41±0.06 | 0.45±0.04 | 0.59 | 0.40±0.06 | 0.45±0.04 | 0.50 |
| Tau | 1.71±0.07 | 1.83±0.05 | 0.17 | 1.73±0.07 | 1.80±0.05 | 0.45 |
| tCho | 1.65±0.04 | 1.47±0.03 | 0.0004 | 1.24±0.04 | 1.16±0.03 | 0.16 |
| tCr | 9.86±0.25 | 9.70±0.17 | 0.63 | 9.84±0.25 | 9.62±0.17 | 0.48 |
Concentrations are expressed as mean±standard error of the mean. The p-values for significantly different neurochemical concentrations for a given region are in bold face. To account for testing 14 neurochemicals and 2 brain regions, the threshold of significance was 0.0018 = 0.05/28.
Random forests distinguished participants with AD from controls with same-sample sensitivity and specificity of 88% and 97%, respectively, though out-of-sample values would be lower. Fourteen of 16 participants with AD were classified correctly, as were 32 of 33 controls. Generalized R2 was 0.68, and RMSE was 0.28. The main predictors of clinical AD status were Asc (G2= 4.4) and mIns (G2= 3.8) in the PCC (for 49 persons). Other predictors were tCho in the PCC (G2= 1.6), and Asc (G2= 2.0), NAAG (G2= 1.6), and mIns (G2= 1.4) in the OCC. Adding structural information (i.e., volume of interest GM, WM, and CSF content) did not change the classification, with negligible changes in performance measures (generalized R2= 0.67, RMSE = 0.29), and no structural parameter was a major predictor (G2< 1).
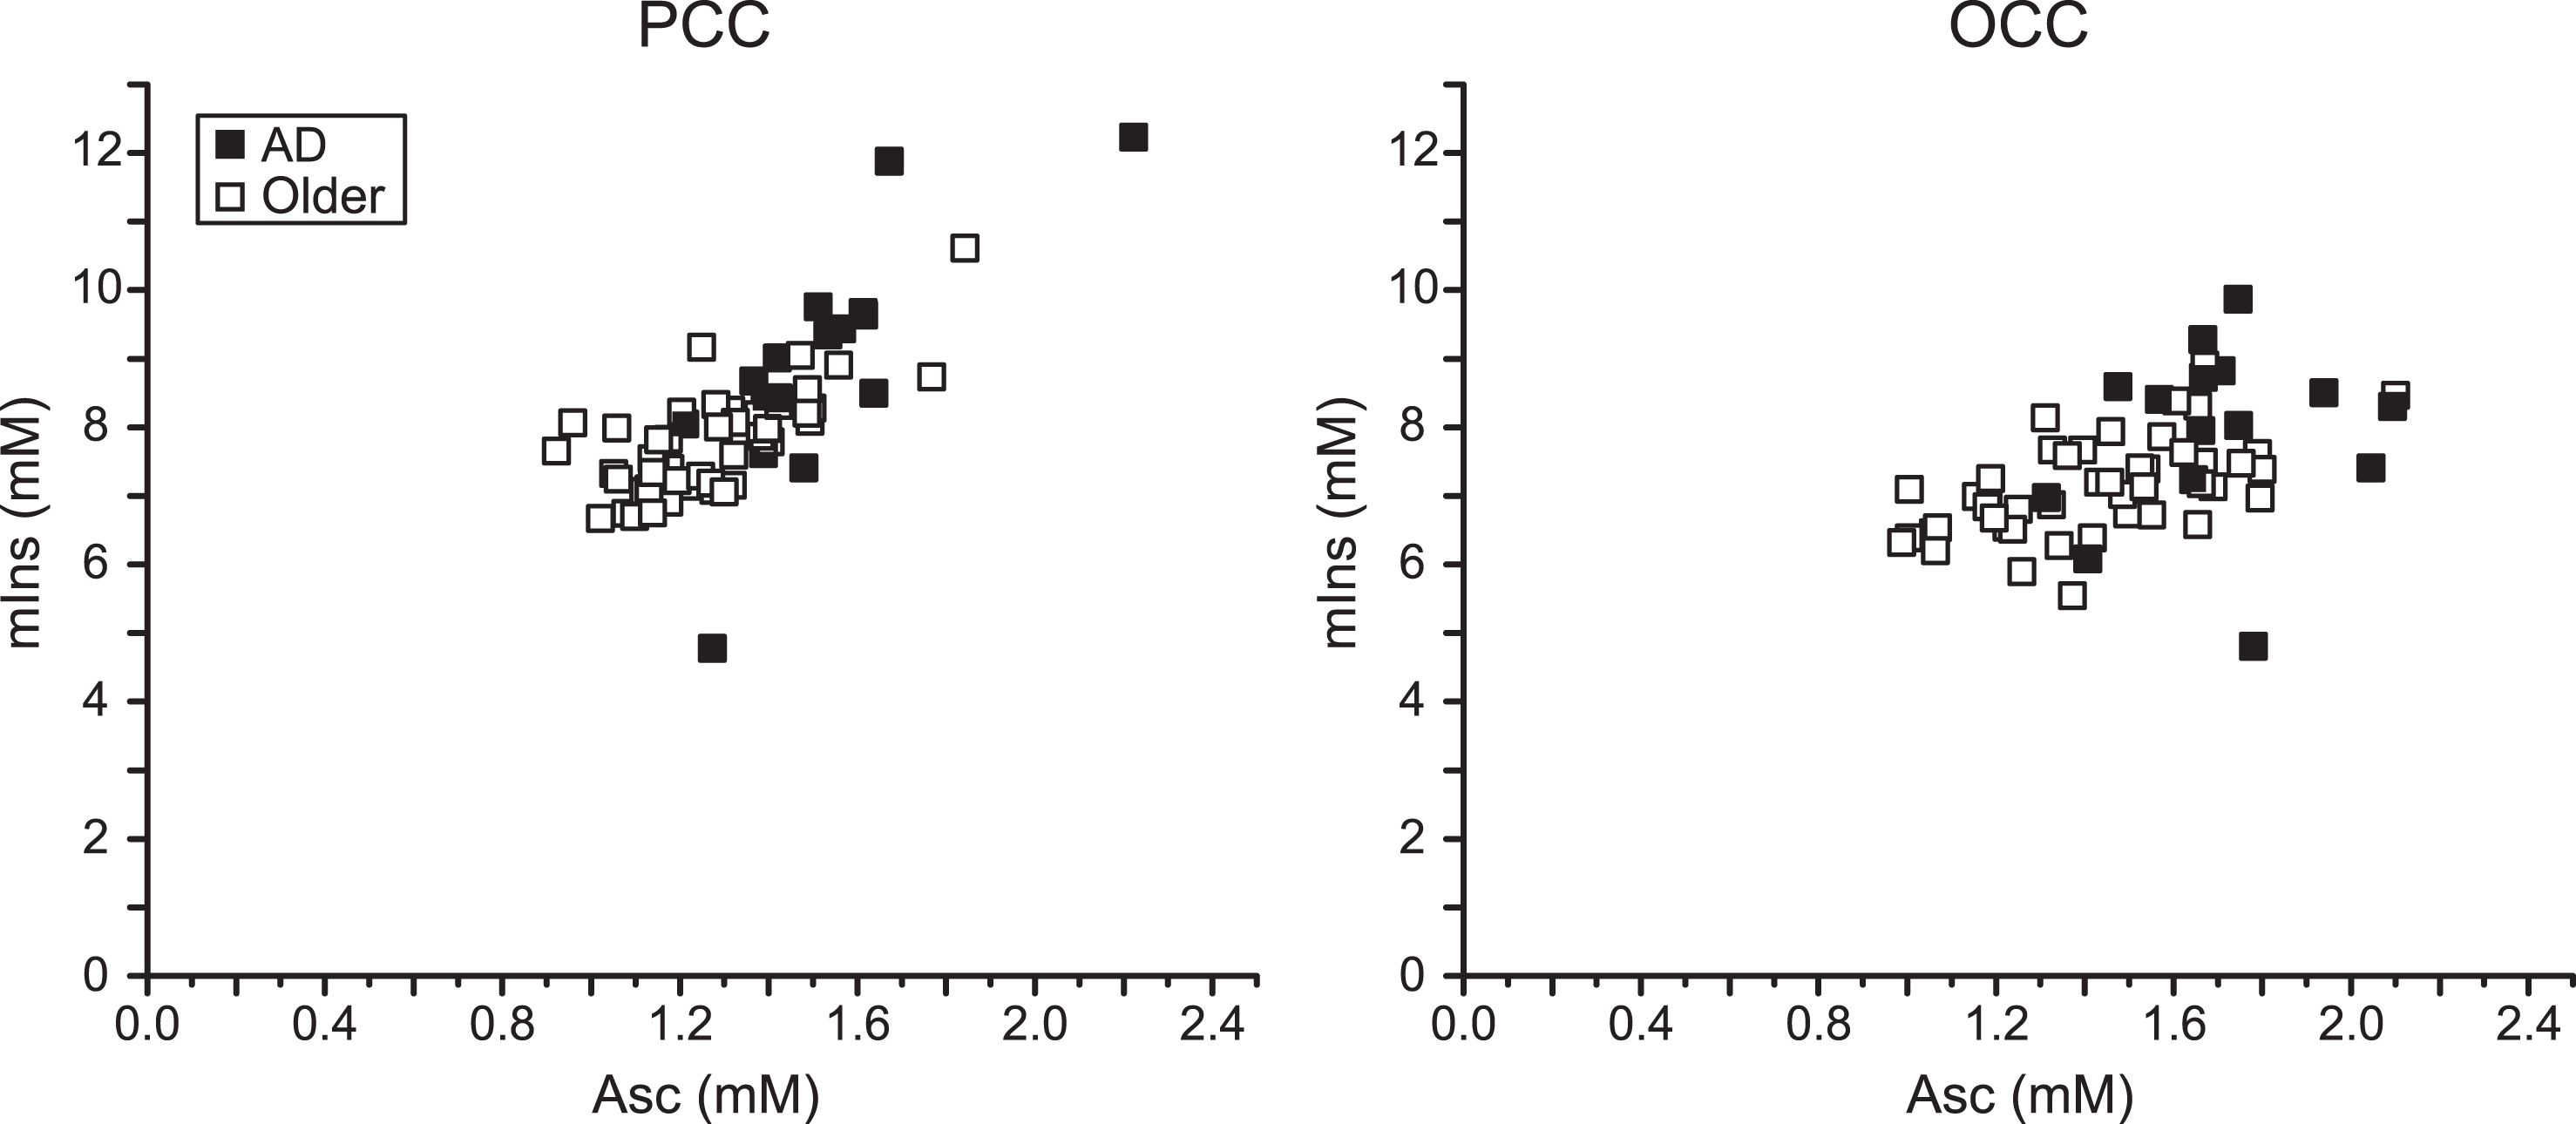
The greatest concentration differences were Asc in the PCC (21%) and the OCC (17%). The next largest was mIns in the PCC (16%). The strongest random forests predictors of clinical AD status were Asc and mIns. Thus, the region-specific associations between Asc and mIns concentrations were examined (Fig. 2). Correlations between Asc and mIns concentrations were 0.76 in the PCC (0.76 in participants with AD and 0.71 in controls) and 0.50 in the OCC (0.30 in participants with AD and 0.55 in controls). The participant with AD who had the lowest mIns concentration in both brain regions was one of the false negatives classified by random forests. The other false negative had the lowest Asc concentration among participants with AD. The control participant who had the highest Asc concentration (and the highest mIns concentration in the PCC) was the false positive classified by random forests. There were no other strong Asc – neurochemical correlations (r≤0.5).
Fig.2
Correlation between Asc and mIns in the PCC and the OCC. Regression plots of Asc concentration with mIns concentration in the studied brain regions of older adults with AD and controls. Significant correlations were observed in both brain regions (PCC: r = 0.76, p = 1×10–12; OCC: r = 0.50, p = 4×10⁻⁵).
DISCUSSION
Asc in AD
Our findings reveal an increase in brain PCC Asc, mIns, and tCho in mild to moderate AD. While the findings on mIns and tCho are consistent with several former reports, difference in Asc concentrations has only been reported once [38]. Given that oxidative stress is part of AD pathology, high concentration of the antioxidant in AD is unexpected and counterintuitive. Rigor of the approach to measure Asc is evidenced by agreement of the neurochemical profile with existing literature.
While the main role of brain Asc in health and AD is protection against oxidative damage, Asc has many roles [10, 39], including as a cofactor and electron donor in the biosynthesis of neurotransmitters and myelin [10, 39–41]. Nevertheless, Asc is oxidized in all of these roles. Brain Asc concentration is under strong homeostatic control via the specific vitamin C transporter (SVCT2) [33, 34]. Therefore, even if there were a diminishment in the Asc-consuming process, which would be unexpected, this homeostasis would prevent accumulation of Asc. If Asc and Glc cotransport into cells were too slow [38], either intracellular Asc concentration would fall, or the SVCT2 would increase Asc transport. Either way, Asc concentration would not increase. Because extracellular concentration of Asc is substantially lower than intracellular concentration, the role that Asc plays in modulating neurotransmission [10, 39, 42] is unlikely to affect the Asc concentration measured in this study. Given that 30% CSF content was measured in this study, the basal Asc concentration in the CSF (0.1–0.4 mM) [43] would have to more than double to cause the 0.2–0.3 mM higher AD-associated concentrations that were measured. Furthermore, Asc concentration did not correlate (r≤0.5) with % CSF. Therefore, a new source of Asc must be introduced to account for the measured higher Asc.
High brain Asc concentrations have been reported under other circumstances. During post-ischemic reperfusion, Asc levels increase as much as 300% [44, 45]. SVCT2 mRNA is found on neurons and in astrocytes [46], and SVCT2 expression has been shown to increase after ischemia-reperfusion [47]. Expression of SVCT2 in brain cells also increases under dietary depletion of Asc [48]. However, there are no reports of increased expression of SVCT2 on neurons in AD, and astrocytes do not change expression of SVCT2 in AD [49]. AD is the only condition under which supply associated increase in expression of SVCT2 is not a known aspect of the pathology yet brain Asc is elevated.
The intrinsic immune response to AD via microglial activation has potential to change brain Asc concentration [37], but is more likely to lower it. Activated microglia increase production of reactive oxygen species, which react with antioxidants, including Asc, thereby tending to lower Asc [50]. Activated microglia may also internalize SVCT2 making them less able to accumulate Asc [51]. Therefore, this aspect of disease pathology fails to provide an explanation for the higher brain Asc concentration measured in older adults with clinical AD in this study.
A possible explanation of high brain Asc concentration in older adults with mild to moderate AD is accumulation of cells rich in Asc. Asc concentration is high in neurons (10 mM) and glia (1 mM) [52], but neurons are unlikely to be accumulating in AD (rather, just the opposite), and the glial species most likely to be upregulated—the microglia—are likely to drive down the levels of Asc through their production of oxygen radicals. Leukocytes have Asc concentration as high as neurons and glia (up to 10 mM) [53, 54]. Leukocytes, including neutrophils, macrophages, and lymphocytes, are known to accumulate Asc, particularly when stimulated [53, 54]. Histological stains have demonstrated the presence of neutrophils and T cells (lymphocytes) in brain parenchyma of people with AD [55, 56]. The correlation of Asc with mIns measured in the current study suggests that peripheral leukocytes may be a complement to or an aspect of neuroinflammation.
Distinctive neurochemistry of AD
When the clinical severity of AD is not specified, PCC mIns/tCr and mIns are consistently reported as higher [2, 3], and PCC tNAA/tCr [2, 3] and tNAA [3] as lower in AD relative to controls. This study enrolled older adults with mild to moderate clinical AD, during which disease-associated higher mIns is typically apparent, whereas disease associated lowering in tNAA tends to occur at later stages [1, 5, 8]. Findings on PCC tCho/tCr are disparate, with a few indicating elevation, as was found in this study, and several indicating no difference [2].
In the OCC, one review reported higher mIns and lower tNAA and tNAA/tCr in AD relative to control [2]. A few studies reported no differences in OCC tNAA/tCr, tCho, or tCho/tCr [8, 57, 58] in AD relative to control. The OCC neurochemical concentrations measured in the current study, although not reaching significance, are in agreement with the consistent finding in the literature that mIns is higher in people with AD.
The method used in the current study is unique as spectra were acquired at ultra-short echo time, which reduces vulnerability of quantification to artifacts caused by disease-associated differences in T2 of neurochemicals. The T2 of NAA is substantially shorter in older adults [34]. When spectra are measured at a longer echo time, further shortening of T2 of NAA in AD would artificially cause tNAA concentration to appear lower in AD.
Differing impacts of aging and AD on brain mIns and Asc concentrations may demarcate aging from AD pathology. mIns, which is sensitive to glial activation, is elevated in the PCC in aging [9] and more so in AD. Asc concentration is lower in older than younger cognitively healthy adults, particularly in the OCC [9], but higher in older adults with AD than age-matched controls (PCC and OCC). A pro-inflammatory stage [50] would be consistent with elevated mIns and diminished Asc concentration in aging, whereas a chronic neuroinflammation stage with recruitment of leukocytes from peripheral blood would be consistent with elevated mIns and heightened Asc concentration in AD.
Conclusion
Compensatory upregulation in Asc transport or increased expression of the SVCT2 are ready explanations for the elevated brain Asc concentrations measured in older adults with mild to moderate clinical AD in this study. However, such accumulation of Asc is counterintuitive to the homeostatic mechanism of the SVCT2. The alternative explanation that elevated Asc arose from presence of recruited leukocytes warrants further investigation that includes systemic and histological biomarkers, given the contribution that research on involvement of peripheral immune cells could make toward understanding the underlying mechanisms of AD. A few studies have shown the presence of peripheral leukocytes in the human AD brain, and it has been suggested that such infiltration would be low grade and localized. This project provides in vivo evidence consistent with the presence of peripheral leukocytes in the brains of older adults with clinical AD. High mIns and Asc concentrations measured via ultra-high field, ultra-short echo time MRS may demarcate a transition from an age-associated pro-inflammatory stage to an AD-associated pathological neuroinflammatory response. As such, this method could potentially diagnose the presence of AD prior to neuronal deterioration. In that case, 7 T in vivo MRS may be useful to demarcate a stage when intervention may be effective in arresting or reversing disease progression. 7 T in vivo MRS may also be useful to monitor therapeutic response.
ACKNOWLEDGMENTS
This work was supported by the National Institutes of Health [grant numbers R01AG039396, P41 EB015894, P30 NS076408] and the W.M. Keck Foundation.
The authors would like to thank: Jillian Crocker for study coordination, Emily Kittelson and Andrea Grant, Ph.D., for technical support, Edward J. Auerbach, Ph.D., for implementing the FAST(EST)MAP and STEAM sequences on the Siemens platform, Dinesh K. Deelchand, Ph.D., for helpful discussion, Connor Breidenbach for discussion on ascorbate in Alzheimer’s disease, literature search, and assisting with manuscript preparation, and Terry Barclay for help with recruitment.
Authors’ disclosures available online (https://www.j-alz.com/manuscript-disclosures/18-0861r2).
REFERENCES
[1] | Kantarci K , Goldberg TE ((2016) ) MR spectroscopy, APOE genotype, and evolving beta-amyloid pathology: What is being detected and when. Neurology 86: , 1750–1751. |
[2] | Gao F , Barker PB ((2014) ) Various MRS application tools for Alzheimer disease and mild cognitive impairment. Am J Neuroradiol 35: , S4–S11. |
[3] | Wang H , Tan L , Wang HF , Liu Y , Yin RH , Wang WY , Chang XL , Jiang T , Yu JT ((2015) ) Magnetic resonance spectroscopy in Alzheimer’s disease: Systematic review and meta-analysis. J Alzheimers Dis 46: , 1049–1070. |
[4] | Abbas Z , Gras V , Mollenhoff K , Keil F , Oros-Peusquens AM , Shah NJ ((2014) ) Analysis of proton-density bias corrections based on T1 measurement for robust quantification of water content in the brain at 3 Tesla. Magn Reson Med 72: , 1735–1745. |
[5] | Kantarci K ((2013) ) Proton MRS in mild cognitive impairment. J Magn Reson Imaging 37: , 770–777. |
[6] | Klein J ((2000) ) Membrane breakdown in acute and chronic neurodegeneration: Focus on choline-containing phospholipids. J Neural Transm 107: , 1027–1063. |
[7] | Fisher SK , Novak JE , Agranoff BW ((2002) ) Inositol and higher inositol phosphates in neural tissues: Homeostasis, metabolism and functional significance. J Neurochem 82: , 736–754. |
[8] | Kantarci K , Jack CR Jr. , Xu YC , Campeau NG , O’Brien PC , Smith GE , Ivnik RJ , Boeve BF , Kokmen E , Tangalos EG , Petersen RC ((2000) ) Regional metabolic patterns in mild cognitive impairment and Alzheimer’s disease: A 1H MRS study. Neurology 55: , 210–217. |
[9] | Marjanska M , McCarten JR , Hodges J , Hemmy LS , Grant A , Deelchand DK , Terpstra M ((2017) ) Region-specific aging of the human brain as evidenced by neurochemical profiles measured noninvasively in the posterior cingulate cortex and the occipital lobe using 1H magnetic resonance spectroscopy at 7 T. Neuroscience 354: , 168–177. |
[10] | Monacelli F , Acquarone E , Giannotti C , Borghi R , Nencioni A ((2017) ) Vitamin C, aging and Alzheimer’s disease. Nutrients 9: , 670. |
[11] | Wang JY , Wen LL , Huang YN , Chen YT , Ku MC ((2006) ) Dual effects of antioxidants in neurodegeneration: Direct neuroprotection against oxidative stress and indirect protection via suppression of glia-mediated inflammation. Curr Pharm Design 12: , 3521–3533. |
[12] | Tkac I , Oz G , Adriany G , Ugurbil K , Gruetter R ((2009) ) In vivo 1H NMR spectroscopy of the human brain at high magnetic fields: Metabolite quantification at 4T vs. 7T. Magn Reson Med 62: , 868–879. |
[13] | Terpstra M , Cheong I , Lyu T , Deelchand DK , Emir UE , Bednarik P , Eberly LE , Oz G ((2016) ) Test-retest reproducibility of neurochemical profiles with short-echo, single-voxel MR spectroscopy at 3T and 7T. Magn Reson Med 76: , 1083–1091. |
[14] | McKhann G , Drachman D , Folstein M , Katzman R , Price D , Stadlan EM ((1984) ) Clinical diagnosis of Alzheimer’s disease: Report of the NINCDS-ADRDA Work Group under the auspices of Department of Health and Human Services Task Force on Alzheimer’s Disease. Neurology 34: , 939–944. |
[15] | Nasreddine ZS , Phillips NA , Bedirian V , Charbonneau S , Whitehead V , Collin I , Cummings JL , Chertkow H ((2005) ) The Montreal Cognitive Assessment, MoCA: A brief screening tool for mild cognitive impairment. J Am Geriatr Soc 53: , 695–699. |
[16] | Folstein MF , Folstein SE , McHugh PR ((1975) ) “Mini-mental state”. A practical method for grading the cognitive state of patients for the clinician. J Psychiatr Res 12: , 189–198. |
[17] | Christensen KJ , Moye J , Armson RR , Kern TM ((1992) ) Health screening and random recruitment for cognitive aging research. Psychol Aging 7: , 204–208. |
[18] | Beck AT , Steer RA , Ball R , Ranieri W ((1996) ) Comparison of Beck Depression Inventories -IA and -II in psychiatric outpatients. J Pers Assess 67: , 588–597. |
[19] | Cockcroft DW , Gault MH ((1976) ) Prediction of creatinine clearance from serum creatinine. Nephron 16: , 31–41. |
[20] | Adriany G , De Moortele PFV , Ritter J , Moeller S , Auerbach EJ , Akgun C , Snyder CJ , Vaughan T , Ugurbill K ((2008) ) A geometrically adjustable 16-channel transmit/receive transmission line array for improved RF efficiency and parallel imaging performance at 7 Tesla. Magn Reson Med 59: , 590–597. |
[21] | Van de Moortele PF , Auerbach EJ , Olman C , Yacoub E , Ugurbil K , Moeller S ((2009) ) T1 weighted brain images at 7 Tesla unbiased for proton density, T2* contrast and RF coil receive B1 sensitivity with simultaneous vessel visualization. Neuroimage 46: , 432–446. |
[22] | Tkac I , Andersen P , Adriany G , Merkle H , Ugurbil K , Gruetter R ((2001) ) In vivo 1H NMR spectroscopy of the human brain at 7 T. Magn Reson Med 46: , 451–456. |
[23] | Brant-Zawadzki M , Gillan GD , Nitz WR ((1992) ) MP RAGE: A three-dimensional, T1-weighted, gradient-echo sequence–initial experience in the brain. Radiology 182: , 769–775. |
[24] | Fischl B , Salat DH , Busa E , Albert M , Dieterich M , Haselgrove C , van der Kouwe A , Killiany R , Kennedy D , Klaveness S , Montillo A , Makris N , Rosen B , Dale AM ((2002) ) Whole brain segmentation: Automated labeling of neuroanatomical structures in the human brain. Neuron 33: , 341–355. |
[25] | Provencher SW ((2001) ) Automatic quantitation of localized in vivo 1H spectra with LCModel. NMR Biomed 14: , 260–264. |
[26] | Lin A , Nguy CH , Shic F , Ross BD ((2001) ) Accumulation of methylsulfonylmethane in the human brain: Identification by multinuclear magnetic resonance sectroscopy. Toxicol Lett 123: , 169–177 . |
[27] | Deelchand DK , Marjanska M , Hodges JS , Terpstra M ((2016) ) Sensitivity and specificity of human brain glutathione concentrations measured using short-TE 1H MRS at 7 T. NMR Biomed 29: , 600–606. |
[28] | Gussew A , Erdtel M , Hiepe P , Rzanny R , Reichenbach JR ((2012) ) Absolute quantitation of brain metabolites with respect to heterogeneous tissue compositions in 1H-MR spectroscopic volumes. MAGMA 25: , 321–333. |
[29] | Ernst T , Kreis R , Ross BD ((1993) ) Absolute quantitation of water and metabolites in the human brain.1. Compartments and water. J Magn Reson B 102: , 1–8. |
[30] | Neeb H , Zilles K , Shah NJ ((2006) ) Fully-automated detection of cerebral water content changes: Study of age- and gender-related H2O patterns with quantitative MRI. Neuroimage 29: , 910–922. |
[31] | Reetz K , Abbas Z , Costa AS , Gras V , Tiffin-Richards F , Mirzazade S , Holschbach B , Frank RD , Vassiliadou A , Kruger T , Eitner F , Gross T , Schulz JB , Floege J , Shah NJ ((2015) ) Increased cerebral water content in hemodialysis patients. PLoS One 10: , e0122188. |
[32] | Rooney WD , Johnson G , Li X , Cohen ER , Kim SG , Ugurbil K , Springer CS ((2007) ) Magnetic field and tissue dependencies of human brain longitudinal 1H2O relaxation in vivo. Magn Reson Med 57: , 308–318. |
[33] | Bartha R , Michaeli S , Merkle H , Adriany G , Andersen P , Chen W , Ugurbil K , Garwood M ((2002) ) In vivo 1H2O T2(dagger) measurement in the human occipital lobe at 4T and 7T by Carr-Purcell MRI: Detection of microscopic susceptibility contrast. Magn Reson Med 47: , 742–750. |
[34] | Marjanska M , Emir UE , Deelchand DK , Terpstra M ((2013) ) Faster metabolite 1H transverse relaxation in the elder human brain. PLoS One 8: , e77572. |
[35] | Brooks JC , Roberts N , Kemp GJ , Gosney MA , Lye M , Whitehouse GH ((2001) ) A proton magnetic resonance spectroscopy study of age-related changes in frontal lobe metabolite concentrations. Cereb Cortex 11: , 598–605. |
[36] | Kreis R ((2016) ) The trouble with quality filtering based on relative Cramer-Rao lower bounds. Magn Reson Med 75: , 15–18. |
[37] | Oz G , Hutter D , Tkac I , Clark HB , Gross MD , Jiang H , Eberly LE , Bushara KO , Gomez CM ((2010) ) Neurochemical alterations in spinocerebellar ataxia type 1 and their correlations with clinical status. Mov Disord 25: , 1253–1261. |
[38] | Mullins R , Reiter D , Kapogiannis D ((2018) ) Magnetic resonance spectroscopy reveals abnormalities of glucose metabolism in the Alzheimer’s brain. Ann Clin Transl Neurol 5: , 262–272. |
[39] | Covarrubias-Pinto A , Acuna AI , Beltran FA , Torres-Diaz L , Castro MA ((2015) ) Old things new view: Ascorbic acid protects the brain in neurodegenerative disorders. Int J Mol Sci 16: , 28194–28217. |
[40] | May JM , Qu ZC , Meredith ME ((2012) ) Mechanisms of ascorbic acid stimulation of norepinephrine synthesis in neuronal cells. Biochem Biophys Res Commun 426: , 148–152. |
[41] | Menniti FS , Knoth J , Diliberto EJ Jr. ((1986) ) Role of ascorbic acid in dopamine beta-hydroxylation. The endogenous enzyme cofactor and putative electron donor for cofactor regeneration. J Biol Chem 261: , 16901–16908. |
[42] | Moretti M , Fraga DB , Rodrigues ALS ((2017) ) Ascorbic acid to manage psychiatric disorders. CNS Drugs 31: , 571–583. |
[43] | Terpstra M , Torkelson C , Emir U , Hodges JS , Raatz S ((2011) ) Noninvasive quantification of human brain antioxidant concentrations after an intravenous bolus of vitamin C. NMR Biomed 24: , 521–528. |
[44] | Iwata N , Okazaki M , Xuan M , Kamiuchi S , Matsuzaki H , Hibino Y ((2014) ) Orally administrated ascorbic acid suppresses neuronal damage and modifies expression of SVCT2 and GLUT1 in the brain of diabetic rats with cerebral ischemia-reperfusion. Nutrients 6: , 1554–1577. |
[45] | Cheng HJ , Xiao TF , Wang DL , Hao J , Yu P , Mao LQ ((2016) ) Simultaneous in vivo ascorbate and electrophysiological recordings in rat brain following ischemia/reperfusion. J Electroanal Chem 781: , 90–96. |
[46] | Harrison FE , May JM ((2009) ) Vitamin C function in the brain: Vital role of the ascorbate transorter SVCT2. Free Radic Biol Med 46: , 719–730. |
[47] | Berger UV , Lu XC , Liu W , Tang Z , Slusher BS , Hediger MA ((2003) ) Effect of middle cerebral artery occlusion on mRNA expression for the sodium-coupled vitamin C transporter SVCT2 in rat brain. J Neurochem 86: , 896–906. |
[48] | Meredith ME , Harrison FE , May JM ((2011) ) Differential regulation of the ascorbic acid transporter SVCT2 during development and in response to ascorbic acid depletion. Biochem Biophys Res Commun 414: , 737–742. |
[49] | Salazar K , Martinez F , Perez-Martin M , Cifuentes M , Trigueros L , Ferrada L , Espinoza F , Saldivia N , Bertinat R , Forman K , Oviedo MJ , Lopez-Gambero AJ , Bonansco C , Bongarzone ER , Nualart F ((2018) ) SVCT2 expression and function in reactive astrocytes is a common event in different brain pathologies. Mol Neurobiol 55: , 5439–5452. |
[50] | Jevtic S , Sengar AS , Salter MW , McLaurin J ((2017) ) The role of the immune system in Alzheimer disease: Etiology and treatment. Ageing Res Rev 40: , 84–94. |
[51] | Portugal CC , Socodato R , Canedo T , Silva CM , Martins T , Coreixas VS , Loiola EC , Gess B , Rohr D , Santiago AR , Young P , Minshall RD , Paes-de-Carvalho R , Ambrosio AF , Relvas JB ((2017) ) Caveolin-1-mediated internalization of the vitamin C transporter SVCT2 in microglia triggers an inflammatory phenotype. Sci Signal 10: , eaal2005. |
[52] | Rice ME , Russo-Menna I ((1998) ) Differential compartmentalization of brain ascorbate and glutathione between neurons and glia. Neuroscience 82: , 1213–1223. |
[53] | Carr AC , Maggini S ((2017) ) Vitamin C and immune function. Nutrients 9: , 1211. |
[54] | Chi X , May JM ((2009) ) Oxidized lipoprotein induces the macrophage ascorbate transporter (SVCT2): Protection by intracellular ascorbate against oxidant stress and apoptosis. Arch Biochem Biophys 485: , 174–182. |
[55] | Zenaro E , Pietronigro E , Della Bianca V , Piacentino G , Marongiu L , Budui S , Turano E , Rossi B , Angiari S , Dusi S , Montresor A , Carlucci T , Nani S , Tosadori G , Calciano L , Catalucci D , Berton G , Bonetti B , Constantin G ((2015) ) Neutrophils promote Alzheimer’s disease-like pathology and cognitive decline via LFA-1 integrin. Nat Med 21: , 880–886. |
[56] | Togo T , Akiyama H , Iseki E , Kondo H , Ikeda K , Kato M , Oda T , Tsuchiya K , Kosaka K ((2002) ) Occurrence of T cells in the brain of Alzheimer’s disease and other neurological diseases. J Neuroimmunol 124: , 83–92. |
[57] | Watanabe T , Shiino A , Akiguchi I ((2010) ) Absolute quantification in proton magnetic resonance spectroscopy is useful to differentiate amnesic mild cognitive impairment from Alzheimer’s disease and healthy aging. Dement Geriatr Cogn Disord 30: , 71–77. |
[58] | Block W , Jessen F , Traber F , Flacke S , Manka C , Lamerichs R , Keller E , Heun R , Schild H ((2002) ) Regional N-acetylaspartate reduction in the hippocampus detected with fast proton magnetic resonance spectroscopic imaging in patients with Alzheimer disease. Arch Neurol 59: , 828–834. |


