
Neuropsychological Decline Improves Prediction of Dementia Beyond Alzheimer’s Disease Biomarker and Mild Cognitive Impairment Diagnoses
Abstract
Background:
A clinical diagnosis of cognitive impairment is traditionally based on a single cognitive exam, but serial cognitive testing can be sensitive to subtle cognitive changes in asymptomatic individuals and inform cognitive trajectory.
Objective:
We evaluated the prognostic utility of identifying longitudinal neuropsychological decline along with single cognitive exam and Alzheimer’s disease (AD) cerebrospinal fluid (CSF) biomarkers in predicting dementia. We also examined brain volumetric differences based on decline trajectories.
Method:
Regression models quantified 12-month neuropsychological decline relative to normative expectations among non-demented older adults (N = 1,074). Progression to dementia over follow-up (18-120 months) was diagnosed using independent modes of assessment.
Results:
In Cox regression models controlling for age, sex, education, apolipoprotein E4, and baseline cognitive diagnosis, neuropsychological decline predicted increased dementia risk, χ2 = 69.861, p < 0.001, odds ratio = 2.841, even after correction for CSF biomarkers (amyloid-β, phosphorylated tau, total tau), χ2 = 26.365, p < 0.001, odds ratio = 2.283. Voxel-based morphometry analysis indicated smaller hippocampal and medial temporal volume in participants with neuropsychological decline.
Conclusions:
Longitudinal diagnosis of neuropsychological decline improved prognostic accuracy beyond single cognitive exam diagnoses and AD CSF biomarkers, even in asymptomatic older adults. Older adults with a trajectory of neuropsychological decline exhibit smaller medial temporal and hippocampal brain volume. Longitudinal diagnostic approaches may benefit selection and randomization procedures for AD clinical trials in asymptomatic individuals.
INTRODUCTION
The vast majority of age-related dementias involve insidious cognitive decline that can be difficult to distinguish from normal aging [1]; thus, identification of older adults at risk for dementia presents a challenge to prevention efforts. It is increasingly recognized that these insidious declines may occur even in adults with normal range cognition [2–5]. Single exam diagnosis of mild cognitive impairment (MCI) cannot capture these subtle cognitive changes, and is an inherently unstable diagnosis that is of uncertain prognostic significance [1].
Consistent with recent changes to diagnostic guidelines for research, efforts are currently focused on treating individuals before symptoms emerge, underscoring the need for tools to assess subtle cognitive changes in asymptomatic individuals [6]. Detecting cognitive change within normal range performance requires serial cognitive testing, but there are several factors complicating interpretation of serial cognitive exams. Many tests show substantial practice effects that lead to improved scores on follow-up examinations [7], and regression to the mean causes baseline scores more distal to the mean to trend toward the mean at follow-up [8]. Although normative-referenced scores are commonly employed to aid interpretation of raw neuropsychological scores at baseline, interpretation of serial exam scores is rarely anchored to normative data on expected serial exam performance in healthy individuals. Use of linear regression methods to determine expected change on serial exams in a robustly normal population may aid in efforts to characterize neuropsychological decline (NP decline) relative to expectations [8, 9]. Practice effects and regression to the mean would be reflected in these norm-referenced NP decline scores, making a lack of a practice effect a potential indicator of subtle decline, as suggested by prior research [10, 11].
Numerous studies support the value of decline on neuropsychological testing in the prediction of dementia [3, 12], and prior work has related preclinical cognitive decline to biomarker abnormalities [13–15]. However, the vast majority of studies have focused on how biomarker-based pathological assessments influence preclinical decline [16, 17], or have used methods that cannot operationalize NP decline in asymptomatic individuals who are performing within normal range [3, 12]. To our knowledge no studies have used a norm-referencing approach to examine whether longitudinal NP decline contributes to dementia prognosis beyond single exam cognitive diagnosis and Alzheimer’s disease (AD) biomarkers. We sought to determine whether longitudinal NP decline adds unique prognostic information and to provide a simple tool to identify older adults with and without NP decline on a standard 12-month follow-up examination. We used linear regression in a robustly normal sample to generate norm-referenced NP decline scores representing worse than expected performance at 12-month follow-up [8, 9]. These norm-referenced scores aid in the interpretation of neuropsychological performance over a one-year interval. In order to determine the value of our specific method, we also compared our results to the simpler approach of calculating norm-referenced change scores to quantify decline over 12 months. Finally, we also investigated differences in brain volumes between adults with and without NP decline in order to better understand the neuroanatomical basis for NP decline.
MATERIALS AND METHODS
Participants
Data were obtained from the Alzheimer’s Disease Neuroimaging Initiative (ADNI) database (http://adni.loni.usc.edu). Participants were recruited from more than 50 sites across the United States and Canada. Inclusion criteria include: age 55–91 years, permitted medications stable for 4 weeks, study partner accompanying participant to visits, Geriatric Depression Scale <6, Hachinski Ischemic Score ≤4, adequate visual/auditory acuity, good general health, 6th grade education or work history equivalent, and fluent English or Spanish. Exclusion criteria were any significant neurological disease or head trauma history. This study was conducted according to Good Clinical Practice guidelines, the Declaration of Helsinki, US 21CFR Part 50- Protection of Human Subjects, and Part 56- Institutional Review Boards, and pursuant to state and federal HIPAA regulations. All participants and/or authorized representatives provided written informed consent.
We included 1,074 older adults enrolled in ADNI-1, ADNI-Grand Opportunity, and ADNI-2 who were dementia-free at baseline, remained dementia-free at 12-month follow-up, and underwent variable follow-up with serial neuropsychological and clinical exams (18–120 months from baseline). A subset (n = 755) also underwent baseline lumbar puncture for quantification of cerebrospinal fluid (CSF) AD biomarkers.
AD biomarkers and genetic data
Roche Elecsys immunoassays determined CSF amyloid-β (Aβ1 - 42), phosphorylated tau (P-tau), and total tau (T-tau) in pg/mL, following Roche Study Protocol at the UPenn/ADNI Biomarker Laboratory [18]. Biomarker abnormality was determined by published cutoff values: Aβ1 - 42 (<964 pg/mL) and P-tau (>23.2 pg/mL) [19].
Apolipoprotein E (APOE) ɛ4 carrier status was determined from blood samples and classified by the presence of one or more copies of the APOE ɛ4 allele.
Neuropsychologically-defined MCI diagnosis
Cluster analysis of ADNI neuropsychological measures was used as previously described to obtain empirically-derived groups of baseline cognitively normal and MCI participants for our analysis [20, 21]. Briefly, participants who were ADNI-diagnosed cognitively normal at baseline and 12-month follow-up, and remained normal for all available follow-up (12–120 months), were used as a robust norm-reference group (n = 294). Linear regression calculated age- and education-corrected z-scores for the entire sample based on the norm-reference group. These z-scores were cluster analyzed with Ward’s method using squared Euclidean distance. Consistent with prior studies [20], tests of memory were the Rey Auditory Verbal Learning Test (RAVLT) delayed recall and retention total correct; tests of attention/executive function were Trail Making parts A and B, completion times; and tests of language were Animal Fluency total correct score and the Boston Naming Test (BNT) spontaneously correct score. To replicate previously reported groupings, a 4-cluster solution and the existence of a cluster-derived normal group was confirmed (see Supplementary Figure 1).
Participants from the robust normal group were combined with the cluster-derived normal group to form the cognitively normal (CN) group (n = 651) and all MCI groups were combined as a single cluster-derived MCI group (n = 411). Twelve participants were not diagnosed due to missing data.
Quantification of neuropsychological (NP) decline
Performance at baseline and 12-month follow-up was used to identify NP decline averaged across tests of memory, attention/executive function, and language function. Test scores by domain were as follows: memory, AVLT trials 1-5 total score, AVLT trials 6 and 7 average; attention/executive function, Trails A and Trails B; language function, Animal Fluency and Vegetable Fluency.
Linear regression models were used to calculate NP decline based on the set of robust norm-reference controls described above. Prediction equations were developed using linear regression models with baseline neuropsychological performance as a predictor of future performance at 12-month follow-up. Demographic factors were not used in regression models, but instead were included as covariates in Cox regression models predicting progression to dementia. All normative regression models were visually inspected for linearity. Where outliers were observed, model fit was examined with and without outliers. All data were retained in statistical models, except for one subject in the robustly normal sample who exhibited an influential outlier on Trails A.
We used the linear regression model (Equation 1) assuming that baseline performance (X) can predict future performance (Y) using the intercept (a) and slope (b) of a robust normal sample with a random, normally distributed error term (ɛ). Linear regression models from the robust normal sample yielded equations predicting 12-month performance from baseline performance (Equations 2–7).
Eq. 1 Y = a + bX + ɛ
Eq. 2 Predicted AVLT Trials 1–5 total = 13.214 + (0.720×Baseline AVLT Trials 1–5 total)
Eq. 3 Predicted AVLT Trials 6-7 average = 3.270 + (0.645×Baseline AVLT Trials 6-7 average)
Eq. 4 Predicted Trails A (log) = 0.589 + (0.598×Baseline Trails A (log))
Eq. 5 Predicted Trails B (log) = 0.656 + (0.643×Baseline Trails B (log))
Eq. 6 Predicted Animal Fluency = 8.410 + (0.623×Baseline Animal Fluency)
Eq. 7 Predicted Vegetable Fluency = 4.464 + (0.687×Baseline Vegetable Fluency)
For our measure of NP decline, we calculated the discrepancy between actual performance at 12-month follow up (Yo) and predicted performance based on regression models from the robustly normal sample (
Eq. 8
Diagnosis of AD dementia
Our primary study outcome was progression to AD dementia. In order to avoid circularity, dementia diagnostic criteria did not include any of our predictive NP decline markers described above. We used the ADNI study criteria based on modes of assessment that are independent of our NP decline measure. Specifically, participants diagnosed with dementia had to 1) have memory complaints, 2) score between 20–26 (inclusive) on the Mini-Mental State Examination (MMSE), 2) have a Clinical Dementia Rating (CDR) 0.5 or 1.0, 3) score <8 for 16 or more years of education, <4 for 8–15 years of education, or <2 for 0–7 years of education on the Logical Memory II subscale (Delayed Paragraph Recall) from the Wechsler Memory Scale-Revised (maximum score of 25), and 5) meet the National Institute of Neurological and Communicative Disorders and Stroke-Alzheimer’s Disease and Related Disorders Association (NINCDS/ADRDA) criteria for probable AD [22].
Statistical analyses
Hierarchical Cox regression analyses evaluated the predictive utility of NP decline in identifying those at risk for more rapid progression to dementia over all follow-up, and all findings were confirmed over fixed 48-month follow-up. We also examined progression to MCI or dementia over all follow-up among cognitively normal older adults. The first model included all participants and corrected for age, sex, education, APOE ɛ4 carrier status, and baseline cognitive diagnosis (first step in regression model), before examining incremental model improvement beyond baseline NP performance with the addition of NP decline (second step in regression model). The second model included individuals with biomarker data and corrected for age, sex, education, APOE ɛ4 carrier status, baseline cognitive diagnosis, and CSF Aβ1 - 42, P-tau, and T-tau (first step in regression model), before examining incremental model improvement beyond biomarkers and baseline NP performance with the addition of NP decline (second step in regression model). NP decline and CSF Aβ1 - 42 values were reflected prior to modeling in order to yield unidirectional odds ratios for all markers (higher indicates greater risk).
NP decline was examined as a continuous measure in all Cox regression analyses. To visualize improved prediction of dementia with addition of NP decline, post-hoc receiver operating characteristics (ROC) curve analysis was conducted and a cutoff yielding optimal dementia prediction was used to bisect the sample into those without NP decline (NP-) versus those with NP decline (NP+).
In order to determine whether our NP decline indicator was superior to simple change score calculations, we compared our results to those derived from a simple normalized change score approach. We also conducted additional analyses to ensure study findings were not biased by the inclusion of the robustly normal sample in all models. First, we divided our robustly normal sample into two roughly equal samples using a binary random number generator. Second, we re-calculated NP decline using half of the robustly normal sample. Finally, we replicated our primary analysis of NP decline as an independent predictor of progression to dementia after excluding the half of the robustly normal sample we used to generate the NP decline scores.
All statistical analyses were conducted in SPSS version 24. Significance tests were two-tailed and used a cutoff of p < 0.05. False discovery rate (FDR) cutoff at 0.05 was used to ensure control for multiple comparisons and reduce type 1 error for all a priori tests.
Neuroimaging acquisition, processing, and analyses
A subset of 1,061 participants from the ADNI study underwent 3D T1-weighted brain MRI at baseline. Scans were downloaded from the online ADNI database (http://adni.loni.usc.edu/). Images were acquired across 64 sites on Siemens, GE, and Phillips scanners at 1.5T or 3T magnet strength. T1-weighted sequences were either magnetization prepared rapid acquisition gradient echo (MP-RAGE) or inversion recovery spoiled gradient recalled (IR-SPGR). Specific scanning parameters for each scanner can be viewed online (http://adni.loni.usc.edu/methods/documents/mri-protocols/tocols/). Prior to analyses, images were individually checked for quality and aligned along the anterior and posterior commissures.
For group comparisons of grey matter volumes, voxel-based morphometry (VBM) analyses were conducted in Matlab using SPM12 and the DARTEL toolbox, as previously described [23, 24]. Briefly, T1-weighted images were first segmented into grey and white matter tissue classes using SPM12’s unified segmentation procedure, followed by the creation of a study-specific DARTEL template. Images were then iteratively aligned to the template, spatially normalized, and smoothed with an 8 mm full-width at half-maximum isotropic Gaussian kernel. Voxel-wise t-tests were used to compare participants with and without NP decline, stratified by baseline cognitive diagnosis (CN NP- versus CN NP+and MCI NP- versus MCI NP+). All analyses controlled for age, sex, education, APOE ɛ4 carrier status and total intracranial volume. Resulting grey matter maps were visually inspected in SPM and regions of volumetric difference were identified via labels from the built-in Neuromorphometric atlas (http://www.oasis-brains.org and http://neuromorphometrics.com). The cluster level significance threshold was set at p < 0.05 with family-wise error (FWE) rate correction for multiple comparisons.
RESULTS
Participants
Table 1 displays the ADNI sample demographic and clinical characteristics for all non-demented participants at baseline and 12-month follow-up exam.
Table 1
Demographics and clinical characteristics
| Demographics | Mean± SD or n, % | |
| N | 1074 | |
| Age (y) | 73.6±7.0 | 55-90 year range |
| Sex (# of men, %) | 471, 43.7% | |
| Education (y) | 16.2±2.7 | 6-20 year range |
| APOE ɛ4 carriers (n, %) | 436, 59.5% | |
| Cluster-derived MCI diagnosis | 411, 38.7% | |
| CSF Biomarkers (n = 755) | ||
| Aβ-Ptau- (n, %) | 276, 36.4% | |
| Aβ+Ptau- (n, %) | 148, 13.7% | |
| Aβ-Ptau+(n, %) | 120, 11.1% | |
| Aβ+Ptau+(n, %) | 214, 19.9% | |
| Neuropsychological Markers | ||
| Memory | Baseline | 12-month Follow-up |
| AVLT Trials 1-5 (words recalled) | 38.9±11.3 | 38.7±12.4 |
| AVLT Trials 6 &7 avg (words recalled) | 6.1±3.9 | 6.1±4.4 |
| Executive Function | ||
| Trails A (log-transformed seconds) | 1.55±0.16 | 1.54±0.16 |
| Trails B (log-transformed seconds) | 1.95±0.20 | 1.95±0.21 |
| Language | ||
| Animals (# correctly named) | 18.8±5.4 | 18.7±5.7 |
| Vegetables (# correctly named) (n = 495) | 12.7±4.1 | 12.4±4.5 |
NP decline predicting dementia risk beyond baseline cognitive diagnosis
There were 221 patients who progressed to dementia (see Supplementary Table 1 for all events by month of follow-up and cognitive diagnosis). NP decline significantly improved the model and was linked to approximately 2.8-fold increased risk for future dementia after controlling for age, sex, education, APOE ɛ4 carrier status, and cognitive diagnosis (change from first step in the regression model: χ2 = 69.861, p < 0.001, odds ratio = 2.841; Table 2 displays the model; Supplementary Table 2 provides MMSE, CDR, and Logical Memory Story A delayed free recall scores for all 4 participant groups).
Table 2
Cox regression model for neuropsychological (NP) decline predicting future dementia beyond baseline diagnosis
| Wald | p | Odds Ratio | 95% Confidence Interval | ||
| Lower | Upper | ||||
| Age | 7.351 | 0.007 | 1.029 | 1.008 | 1.051 |
| Sex | 1.077 | 0.299 | 0.862 | 0.650 | 1.141 |
| Education | 1.292 | 0.256 | 1.027 | 0.981 | 1.076 |
| APOE ɛ4 | 60.352 | <0.001 | 3.086 | 2.322 | 4.100 |
| Cognitive Diagnosis | 58.977 | <0.001 | 3.447 | 2.513 | 4.727 |
| NP decline | 73.206 | <0.001 | 2.841 | 2.236 | 3.608 |
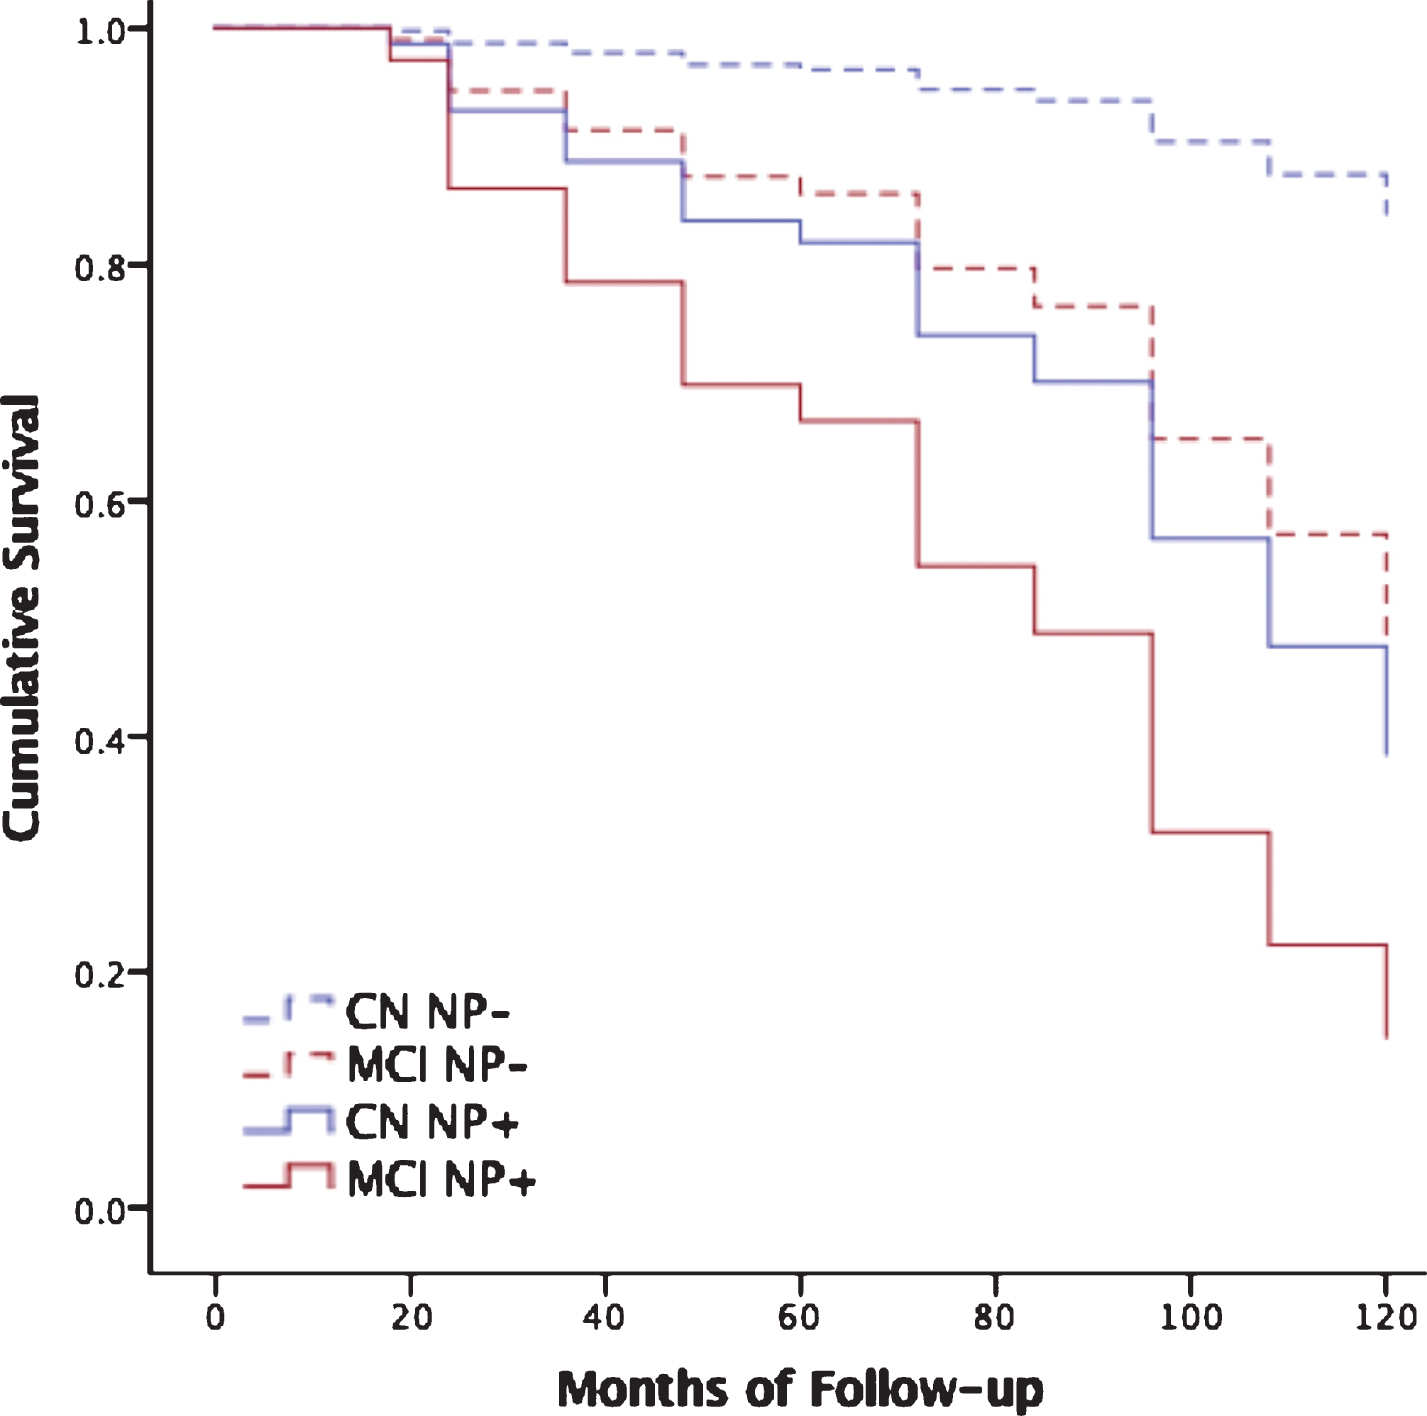
ROC analysis indicated an optimal cutoff for predicting dementia of z = –0.5716, approximately corresponding to the 28th cumulative percentile, for the cognitively normal group, and z = –0.4270, approximately corresponding to the 33rd percentile, for the MCI group. Findings were confirmed in the same analysis with a fixed 48-month follow-up to ensure no bias was introduced by variable follow-up interval (Supplementary Table 3). Figure 1 displays results of Cox regression stratified by cognitive diagnosis and optimal NP decline cutoff (N = 1,074). Findings were also confirmed in two additional post-hoc analyses that used random number generators to identify a subsample of robustly normal participants used to generate prediction equations. These participants were excluded from the test sample used in Cox regression analyses examining NP decline as a predictor of future dementia. Both analyses replicated the original study findings (Supplementary Table 4).
Fig.1
Neuropsychological decline predicts dementia beyond cognitive diagnosis. Cox regression models predicting progression to dementia over all follow-up among those who were cognitively normal (CN) without neuropsychological decline (CN NP-, dashed blue line) versus CN with neuropsychological decline (CN NP+, solid blue line), and MCI patients without neuropsychological decline (MCI NP-, dashed red line) versus MCI with neuropsychological decline (MCI NP+, solid red line). See Supplementary Table 2 for subject numbers, MMSE, CDR, and Logical Memory Story A delayed free recall scores by participant subgroup.
Additional analyses focused on the ADNI cognitively normal subgroup demonstrated that NP decline predicted progression to either MCI (by ADNI criteria) or dementia over all follow-up in those who were cognitively normal by ADNI criteria at both baseline and 12-month follow up (Supplementary Table 5).
Comparison of study results using regression-based norms (Table 2) to those of normalized simple difference scores revealed an apparent superiority of regression-based norming (OR 1.959, p < 0.001 for simple difference versus OR 2.841, p < 0.001, for regression approach), but normalized difference scores were also predictive of future decline (Supplementary Table 6)
NP decline predicting dementia risk beyond biomarker profiles
There were 134 patients who progressed to dementia (see Supplementary Table 7 for all events and censored cases for each month of follow-up). NP decline significantly improved the model and was linked to greater than 2.2-fold increased risk for future dementia after controlling for age, sex, education, APOE ɛ4 carrier status, cognitive diagnosis, and CSF Aβ, P-tau, and T-tau (change from first step in the regression model: χ2 = 26.365, p < 0.001, odds ratio = 2.283; Table 3 displays the model). ROC analysis indicated an optimal cutoff for predicting dementia of z = –0.5808, approximately corresponding to the 28th cumulative percentile, for the cognitively normal group, and z = –0.5051, approximately corresponding to the 30th percentile, for the MCI group. Figure 2 displays results of Cox regression stratified by cognitive diagnosis, AD biomarker profile and optimal NP decline cutoff (n = 703 with complete data and follow-up >12 months). Findings were confirmed in the same analysis with a fixed 48-month follow-up (Supplementary Table 8).
Table 3
Cox regression model for neuropsychological (NP) decline predicting future dementia beyond AD biomarkers
| Wald | p | Odds Ratio | 95% Confidence Interval | ||
| Lower | Upper | ||||
| Age | 2.217 | 0.136 | 1.021 | 0.994 | 1.048 |
| Sex | 0.502 | 0.479 | 1.146 | 0.787 | 1.668 |
| Education | 0.749 | 0.387 | 1.027 | 0.966 | 1.092 |
| APOE ɛ4 | 1.980 | 0.159 | 1.336 | 0.893 | 1.998 |
| CSF Aβ1 - 42 | 30.352 | <0.001 | 1.002 | 1.001 | 1.002 |
| CSF P-tau | 0.362 | 0.547 | 0.982 | 0.925 | 1.042 |
| CSF T-tau | 2.107 | 0.147 | 1.005 | 0.998 | 1.012 |
| Cognitive Diagnosis | 25.956 | <0.001 | 2.933 | 1.939 | 4.436 |
| NP decline | 27.321 | <0.001 | 2.283 | 1.675 | 3.112 |
Fig.2
Neuropsychological decline predicts dementia beyond AD biomarkers. Cox regression models predicting progression to dementia over all follow-up by cognitive diagnosis without neuropsychological decline (CN dashed blue; MCI dashed red) versus those cognitive diagnosis with neuropsychological decline (CN solid blue; MCI solid red) for each biomarker profile, including normal AD biomarkers, Aβ-Ptau- (A: n = 276, MMSE = 28.7[1.4]), AD pathophysiology, Aβ+Ptau- (B: n = 148, MMSE = 28.4[1.6]), suspected non-AD pathophysiology, Aβ-Ptau+(C: n = 120, MMSE = 28.5[1.5]), and AD, Aβ+Ptau+(D: n = 214, MMSE = 27.7[1.8]). Mean[SD].
![Neuropsychological decline predicts dementia beyond AD biomarkers. Cox regression models predicting progression to dementia over all follow-up by cognitive diagnosis without neuropsychological decline (CN dashed blue; MCI dashed red) versus those cognitive diagnosis with neuropsychological decline (CN solid blue; MCI solid red) for each biomarker profile, including normal AD biomarkers, Aβ-Ptau- (A: n = 276, MMSE = 28.7[1.4]), AD pathophysiology, Aβ+Ptau- (B: n = 148, MMSE = 28.4[1.6]), suspected non-AD pathophysiology, Aβ-Ptau+(C: n = 120, MMSE = 28.5[1.5]), and AD, Aβ+Ptau+(D: n = 214, MMSE = 27.7[1.8]). Mean[SD].](https://content.iospress.com:443/media/jad/2019/69-4/jad-69-4-jad180525/jad-69-jad180525-g002.jpg)
Baseline brain volumetric analysis
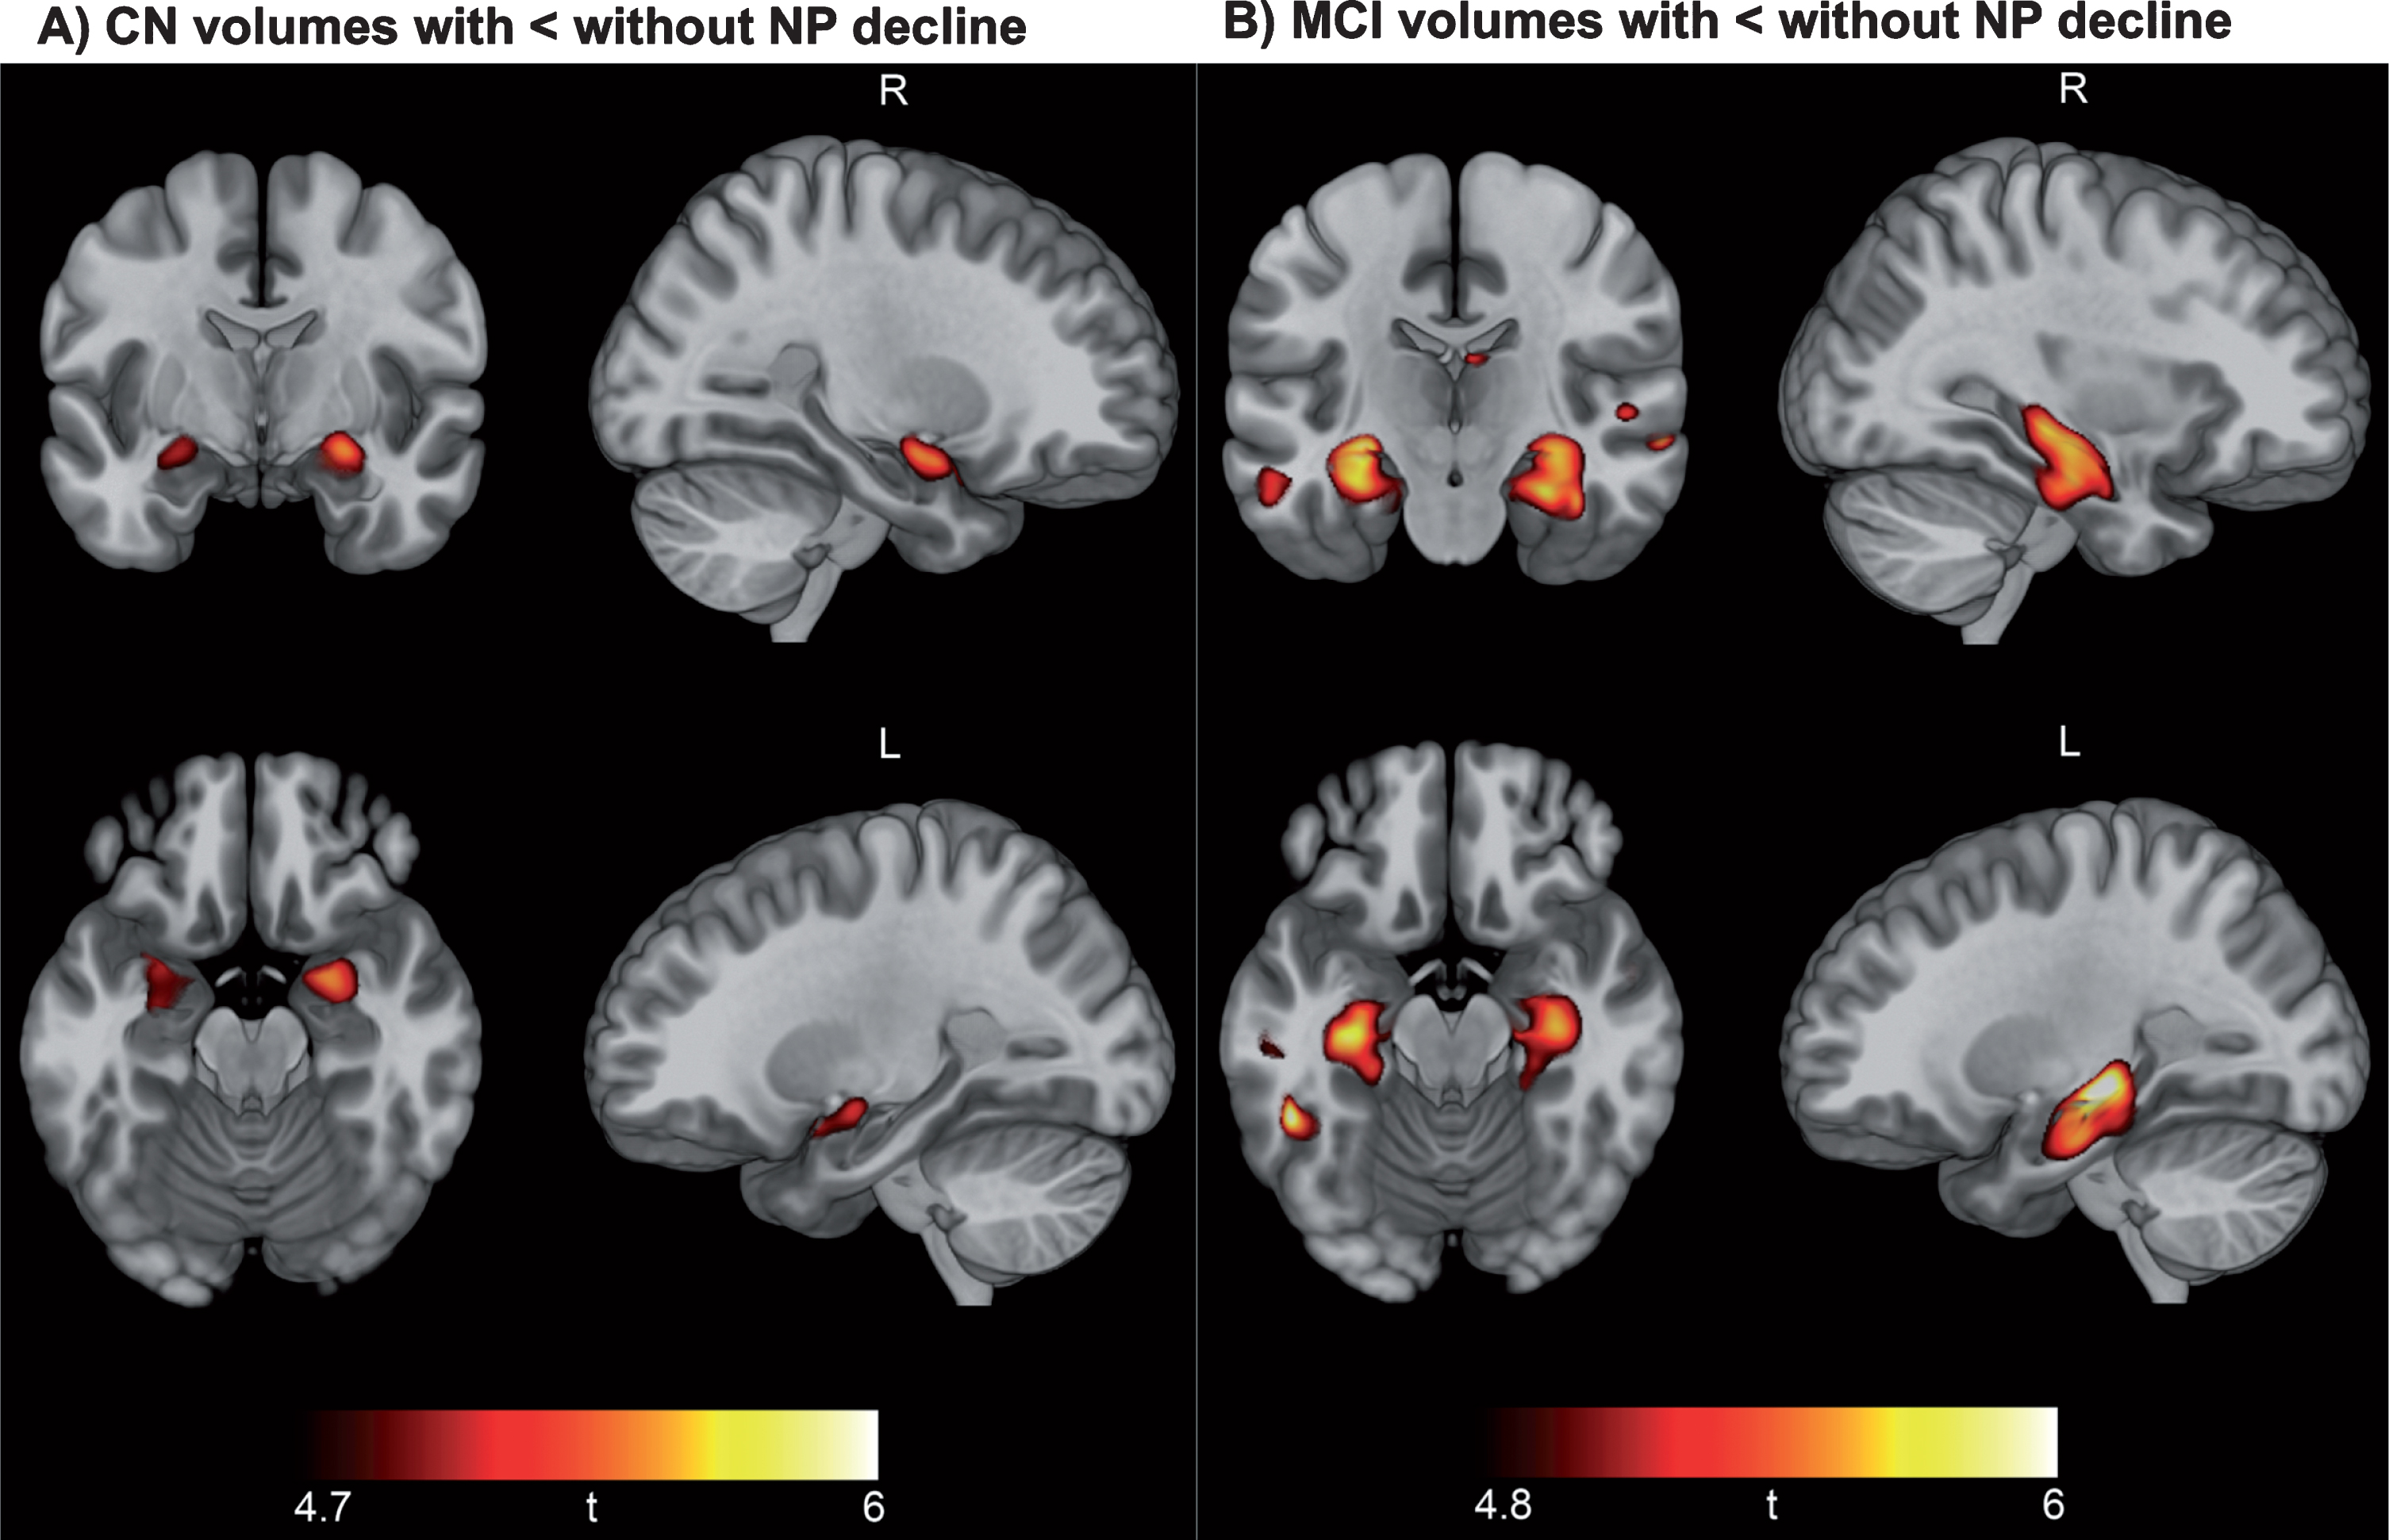
Figure 3 displays FWE corrected results of VBM analysis comparing brain volumes at baseline CN participants without NP decline to those with NP decline (Fig. 3A), as well as MCI patients without NP decline versus with NP decline (Fig. 3B) (see Supplementary Tables 9 and 10 for coordinates and other cluster details). Findings indicated smaller brain volume specifically within the hippocampus of CN participants with NP decline relative to those without NP decline, and smaller volumes within the hippocampus and medial temporal lobes of MCI participants with NP decline relative to those without NP decline.
Fig.3
Neuropsychological decline linked to baseline hippocampal and medial temporal lobe volume. Results of voxel-based morphometry analysis after FWE correction are displayed as t-maps overlaid onto a template T1 image for anatomical reference. Findings from two-sample t-tests show a consistent pattern of smaller hippocampal volume in CN participants with NP decline versus CN without NP decline (A) and smaller hippocampal and medial temporal volume in MCI patients with NP decline versus MCI without NP decline (B).
DISCUSSION
Asymptomatic older adults performing below expectations at follow-up exhibit more rapid progression to dementia, regardless of demographic factors, APOE ɛ4 carrier status, or biomarker status. Our linear regression-based approach was able to detect subtle cognitive changes that presaged ultimate risk for dementia, even in asymptomatic individuals showing normal range performance. The same approach identified pernicious cases of MCI with more rapid progression to dementia. Including longitudinal classification of NP decline in addition to baseline diagnosis and biomarker status will improve estimation of proximal dementia risk, particularly in asymptomatic cases. Notably, asymptomatic participants showing NP decline progressed to dementia at a rate similar to MCI patients showing no NP decline. This finding is consistent with the notion of a continuum of neuropsychological performance spanning the normal-to-mildly impaired range [2, 6, 25, 26], and that the addition of quantitative information regarding longitudinal decline improves our ability to classify individuals who are performing near diagnostic thresholds.
Prior studies have found that cognitively normal older adults who are biomarker positive for both CSF Aβ and P-tau are at increased risk for AD dementia [27]. According to recent research recommendations for neurocognitive staging of AD, these AD biomarker positive individuals without NP decline are Stage 1 and those with NP decline are Stage 2 [6]. The present study findings suggest that Stage 2 patients are at far greater risk for future dementia than Stage 1. Notably, older adults showing AD biomarker abnormalities are at increased risk for dementia, but the majority of that risk applies only to those who also exhibit NP decline. This may be due to the fact that current AD biomarkers do not account for a host of other co-morbid pathological factors likely contributing to overall dementia risk, including premorbid brain vulnerabilities and co-morbid brain pathologies [28]. Recent autopsy series have demonstrated that the most common form of dementia is due to multiple pathologies [29], and over 200 different combinations of pathology were observed in a large autopsy series [30]. Cognitive reserve and other genetic, psychological and environmental factors are also known to limit the relationship between underlying pathology and its clinical manifestation [31, 32]. The resulting impact of NP decline on prognostic accuracy has enormous clinical consequences in terms of targeting treatment toward those at the greatest risk and limiting iatrogenic effects in those at low risk. As demonstrated, use of NP decline with AD biomarkers may improve prognostic accuracy in asymptomatic patients.
The current conceptualization of Stage 3 neurocognitive decline includes both abnormal baseline performance and evidence of longitudinal decline [6], consistent with a tradition that makes no distinction between progressive and non-progressive forms of MCI [33]. Although an individual’s absolute level of cognitive ability at baseline is likely to be a more powerful predictor of imminent dementia risk, as suggested by the greater odds ratios for baseline diagnosis versus decline status, this baseline ability presents an incomplete picture of an individual’s overall risk in that it contains no information on cognitive trajectory. Premorbid cognitive ability, cultural/ethnic background, and linguistic variability limit the ability of baseline exams to optimally predict risk for dementia [34]. These factors may be less salient when evaluating within-subject variance from baseline to follow-up, suggesting NP decline may have value in evaluating more diverse populations. However, this remains an open question for future studies to evaluate using more ethnically diverse samples.
There are no operationalized criteria for cognitive decline as described in the research recommendations for diagnosis and staging of neurocognitive decline in AD [6]. Subjective reports of cognitive decline are prone to errors [35] and reliable informants are not always available or able to notice subtle cognitive changes. For these and other reasons, serial neuropsychological data may be the favored method for establishing cognitive trajectories. However, the known influence of practice effects and regression to the mean makes clinical judgments based on raw score changes extremely difficult [7]. The present study demonstrates that the use of regression-based norming practices can aid in the interpretation of serial neuropsychological test data. We also provide normative regression equations and optimal cutoff values for ascertaining the presence or absence of NP decline, which may be of clinical and investigational value in patients and participants similar to those studied as part of ADNI. Although more research is needed across different populations and test batteries, the present approach provides a relatively simple framework that may be readily applied in clinical and research settings. This practice is analogous to the widely adopted method of norm-referenced demographic corrections, but adds a norm-referencing method for neuropsychological change over 12 months. Future studies may help determine whether regression, mixed modeling, simple change scores, or other approaches are the most appropriate for obtaining norm-referenced decline metrics, but the present study findings suggested regression-based methods may be superior to simple change scores.
Despite the advantages of using neuropsychological markers as risk indicators for dementia, such an approach has also been understandably criticized for circularity since neuropsychological markers are often also used to arrive at a diagnosis of dementia. For this reason, the present study used independent modes of assessment to ascertain dementia diagnosis as the criterion measure. Thus, it is unlikely that shared methods variance alone can account for the study findings. The face validity of neuropsychological markers as indicators of cognitive impairment should not preclude their use as prognostic instruments, particularly since these markers predict progression over lengthy follow-up intervals in patients who are initially asymptomatic. Ultimately NP decline demonstrates considerable utility in predicting who will progress to dementia, indicating critical value for clinicians and scientists working with this population.
Prior work has demonstrated correlations between hippocampal volume and both AD biomarkers [36, 37] and cognitive decline [37] during the early stages of the disease. Consistent with these findings, older adults with NP decline exhibited smaller regional baseline brain volumes than those without NP decline in a pattern that was remarkably specific to the hippocampus and surrounding medial temporal regions. Although medial temporal regions are traditionally associated with memory functions and most attempts to identify preclinical decline have focused predominantly on memory measures [38], we chose to use tests that also assessed executive function and semantic fluency. Recent studies have suggested more widespread impact of preclinical AD across neuropsychological domains [2]. Consistent with these findings, research recommendations acknowledge that AD-related cognitive impairment may involve widespread versus specific cognitive domain impairment [6, 25]. This may be particularly true for NP decline versus single exam findings since subthreshold declines may occur across domains. Increased reliability is another advantage of global composites that average scores across domains, which may improve the likelihood of detected subtle cognitive changes. Future studies should use longitudinal and multimodal imaging to identify additional structural and functional characteristics of early NP decline, improving our understanding of the neuropathology underlying progressive forms of cognitive impairment.
Single exam diagnosis or biomarker-only evaluations are not likely to yield accurate prediction of when an individual will progress to dementia. Inclusion of asymptomatic individuals with no NP decline in clinical trials may require much larger samples and greatly extended follow-up due to high variability in progression rates. This leads to increased costs and delayed progress toward predicting and preventing dementia, as well as exposure of low risk individuals to potentially detrimental medication side effects. If additional studies can establish widely accepted standards for establishing cognitive trajectories, trial design may be improved by adding cognitive trajectory to single exam diagnoses to further classify participant risk.
Study limitations include the ADNI sample being comprised of relatively highly educated and demographically homogenous individuals recruited from over 50 sites across the US and Canada with variable sampling bias and methodology, and inclusion/exclusion criteria that limited comorbid neuropathological factors. Extension of the present study findings in larger community-based samples may further support the predictive utility of NP decline as a prognostic supplement to biomarkers and baseline cognitive diagnosis. Another potential limitation was the inclusion of robustly normal participants in both the generation of NP decline prediction equations and the testing of those equations as predictors of future dementia. However, we were able to replicate the main study findings in sub-analysis that excluded the robustly normal participants used to generate the equations, alleviating concern that circularity may have influenced our results. An additional concern may be raised regarding the application of normative regression equations to both cognitively normal and MCI cases since these two groups would have different anticipated cognitive trajectories. We chose to use normative models for both groups in an effort to not only predict future dementia in patients who are initially normal, but also to improve the prognostic value of MCI diagnosis, an inherently unstable category. Future studies will also evaluate whether use of 3 time-points further improves evaluation of NP decline, determine the degree to which individual tests contribute to overall decline prediction, and further characterize heterogeneity in patterns of decline across MCI subtypes.
ACKNOWLEDGMENTS
The study data analysis was supported by NIH grants (R21AG055034, P50 AG005142, P01 AG052350, R01AG055430) and Alzheimer’s Association grant AARG-17-532905.
Data collection and sharing for this project was funded by the Alzheimer’s Disease Neuroimaging Initiative (ADNI) (National Institutes of Health Grant U01 AG024904) and DOD ADNI (Department of Defense award number W81XWH-12-2-0012). ADNI is funded by the National Institute on Aging, the National Institute of Biomedical Imaging and Bioengineering, and through generous contributions from the following: AbbVie, Alzheimer’s Association; Alzheimer’s Drug Discovery Foundation; Araclon Biotech; BioClinica, Inc.; Biogen; Bristol-Myers Squibb Company; CereSpir, Inc.; Eisai Inc.; Elan Pharmaceuticals, Inc.; Eli Lilly and Company; EuroImmun; F. Hoffmann-La Roche Ltd and its affiliated company Genentech, Inc.; Fujirebio; GE Healthcare; IXICO Ltd.; Janssen Alzheimer Immunotherapy Research & Development, LLC.; Johnson & Johnson Pharmaceutical Research & Development LLC.; Lumosity; Lundbeck; Merck & Co., Inc.; Meso Scale Diagnostics, LLC.; NeuroRx Research; Neurotrack Technologies; Novartis Pharmaceuticals Corporation; Pfizer Inc.; Piramal Imaging; Servier; Takeda Pharmaceutical Company; and Transition Therapeutics. The Canadian Institutes of Health Research is providing funds to support ADNI clinical sites in Canada. Private sector contributions are facilitated by the Foundation for the National Institutes of Health (http://www.fnih.org). The grantee organization is the Northern California Institute for Research and Education, and the study is coordinated by the Alzheimer’s Disease Cooperative Study at the University of California, San Diego. ADNI data are disseminated by the Laboratory for Neuro Imaging at the University of Southern California.
Authors’ disclosures available online (https://www.j-alz.com/manuscript-disclosures/18-0525r2).
SUPPLEMENTARY MATERIAL
[1] The supplementary material is available in the electronic version of this article: http://dx.doi.org/10.3233/JAD-180525.
REFERENCES
[1] | Bondi MW , Jak AJ , Delano-Wood L , Jacobson MW , Delis DC , Salmon DP ((2008) ) Neuropsychological contributions to the early identification of Alzheimer’s disease. Neuropsychol Rev 18: , 73–90. |
[2] | Han SD , Nguyen CP , Stricker NH , Nation DA ((2017) ) Detectable neuropsychological differences in early preclinical Alzheimer’s disease: A meta-analysis. Neuropsychol Rev 27: , 305–325. |
[3] | Mortamais M , Ash JA , Harrison J , Kaye J , Kramer J , Randolph C , Pose C , Albala B , Ropacki M , Ritchie CW , Ritchie K ((2017) ) Detecting cognitive changes in preclinical Alzheimer’s disease: A review of its feasibility. Alzheimers Dement 13: , 468–492. |
[4] | Storandt M , Morris JC ((2010) ) Ascertainment bias in the clinical diagnosis of Alzheimer disease. Arch Neurol 67: , 1364–1369. |
[5] | Gavett BE , Ashendorf L , Gurnani AS ((2015) ) Reliable change on neuropsychological tests in the uniform data set. J Int Neuropsychol Soc 21: , 558–567. |
[6] | Jack CR Jr. , Bennett DA , Blennow K , Carrillo MC , Dunn B , Haeberlein SB , Holtzman DM , Jagust W , Jessen F , Karlawish J , Liu E , Molinuevo JL , Montine T , Phelps C , Rankin KP , Rowe CC , Scheltens P , Siemers E , Snyder HM , Sperling R , Contributors ((2018) ) NIA-AA Research Framework: Toward a biological definition of Alzheimer’s disease. Alzheimers Dement 14: , 535–562. |
[7] | Slick DJ ((2006) ) Psychometrics in Neuropsychological Assessment. 3–31. Sherman EMS, Spreen O, eds. A Compendium of Neuropsychological Tests - Third Edition. |
[8] | Crawford JR , Garthwaite PH ((2006) ) Comparing patients’ predicted test scores from a regression equation with their obtained scores: A significance test and point estimate of abnormality with accompanying confidence limits. Neuropsychology 20: , 259–271. |
[9] | Crawford JR , Howell DC ((1998) ) Regression equations in clinical neuropsychology: An evaluation of statistical methods for comparing predicted and obtained scores. J Clin Exp Neuropsychol 20: , 755–762. |
[10] | Hassenstab J , Ruvolo D , Jasielec M , Xiong C , Grant E , Morris JC ((2015) ) Absence of practice effects in preclinical Alzheimer’s disease. Neuropsychology 29: , 940–948. |
[11] | Machulda MM , Pankratz VS , Christianson TJ , Ivnik RJ , Mielke MM , Roberts RO , Knopman DS , Boeve BF , Petersen RC ((2013) ) Practice effects and longitudinal cognitive change in normal aging vs. incident mild cognitive impairment and dementia in the Mayo Clinic Study of Aging. Clin Neuropsychol 27: , 1247–1264. |
[12] | Amieva H , Jacqmin-Gadda H , Orgogozo JM , Le Carret N , Helmer C , Letenneur L , Barberger-Gateau P , Fabrigoule C , Dartigues JF ((2005) ) The 9 year cognitive decline before dementia of the Alzheimer type: A prospective population-based study. Brain 128: , 1093–1101. |
[13] | Jedynak BM , Lang A , Liu B , Katz E , Zhang Y , Wyman BT , Raunig D , Jedynak CP , Caffo B , Prince JL , Alzheimer’s Disease Neuroimaging Initiative ((2012) ) A computational neurodegenerative disease progression score: Method and results with the Alzheimer’s disease Neuroimaging Initiative cohort. Neuroimage 63: , 1478–1486. |
[14] | Iturria-Medina Y , Sotero RC , Toussaint PJ , Mateos-Perez JM , Evans AC , Alzheimer’s Disease Neuroimaging Initiative ((2016) ) Early role of vascular dysregulation on late-onset Alzheimer’s disease based on multifactorial data-driven analysis. Nat Commun 7: , 11934. |
[15] | Toledo JB , Bjerke M , Chen K , Rozycki M , Jack CR Jr. , Weiner MW , Arnold SE , Reiman EM , Davatzikos C , Shaw LM , Trojanowski JQ , Alzheimer’s Disease Neuroimaging Initiative ((2015) ) Memory, executive, and multidomain subtle cognitive impairment: Clinical and biomarker findings. Neurology 85: , 144–153. |
[16] | Donohue MC , Sperling RA , Petersen R , Sun CK , Weiner MW , Aisen PS and Alzheimer’s Disease Neuroimaging Initiative ((2017) ) Association between elevated brain amyloid and subsequent cognitive decline among cognitively normal persons. JAMA 317: , 2305–2316. |
[17] | Burnham SC , Bourgeat P , Dore V , Savage G , Brown B , Laws S , Maruff P , Salvado O , Ames D , Martins RN , Masters CL , Rowe CC , Villemagne VL , AIBL Research Group ((2016) ) Clinical and cognitive trajectories in cognitively healthy elderly individuals with suspected non-Alzheimer’s disease pathophysiology (SNAP) or Alzheimer’s disease pathology: A longitudinal study. Lancet Neurol 15: , 1044–1053. |
[18] | Bittner T , Zetterberg H , Teunissen CE , Ostlund RE Jr. , Militello M , Andreasson U , Hubeek I , Gibson D , Chu DC , Eichenlaub U , Heiss P , Kobold U , Leinenbach A , Madin K , Manuilova E , Rabe C , Blennow K ((2016) ) Technical performance of a novel, fully automated electrochemiluminescence immunoassay for the quantitation of beta-amyloid (1-42) in human cerebrospinal fluid. Alzheimers Dement 12: , 517–526. |
[19] | Seibyl J , L.M. S , Blennow K , Widmann M , Corradini V , Wahl S and Hansson O ((2017) ) Amyloid-PET concordance of Elecsys® CSF biomarker immunoassays for Alzheimer’s disease. Alzheimers Dement 13: , P199–P200. |
[20] | Edmonds EC , Delano-Wood L , Clark LR , Jak AJ , Nation DA , McDonald CR , Libon DJ , Au R , Galasko D , Salmon DP , Bondi MW , Alzheimer’s Disease Neuroimaging Initiative ((2015) ) Susceptibility of the conventional criteria for mild cognitive impairment to false-positive diagnostic errors. Alzheimers Dement 11: , 415–424. |
[21] | Clark LR , Delano-Wood L , Libon DJ , McDonald CR , Nation DA , Bangen KJ , Jak AJ , Au R , Salmon DP and Bondi MW ((2013) ) Are empirically-derived subtypes of mild cognitive impairment consistent with conventional subtypes? J Int Neuropsychol Soc 19: , 635–645. |
[22] | McKhann G , Drachman D , Folstein M , Katzman R , Price D , Stadlan EM ((1984) ) Clinical diagnosis of Alzheimer’s disease: Report of the NINCDS-ADRDA Work Group under the auspices of Department of Health and Human Services Task Force on Alzheimer’s Disease. Neurology 34: , 939–944. |
[23] | Ashburner J ((2007) ) A fast diffeomorphic image registration algorithm. Neuroimage 38: , 95–113. |
[24] | Ashburner J , Friston KJ ((2009) ) Computing average shaped tissue probability templates. Neuroimage 45: , 333–341. |
[25] | Ho JK , Nation DA , Alzheimer’s Disease Neuroimaging Initiative ((2018) ) Neuropsychological profiles and trajectories in preclinical Alzheimer’s disease. J Int Neuropsychol Soc 24: , 693–702. |
[26] | Sperling R , Mormino E , Johnson K ((2014) ) The evolution of preclinical Alzheimer’s disease: Implications for prevention trials. Neuron 84: , 608–622. |
[27] | Roe CM , Fagan AM , Grant EA , Hassenstab J , Moulder KL , Maue Dreyfus D , Sutphen CL , Benzinger TL , Mintun MA , Holtzman DM , Morris JC ((2013) ) Amyloid imaging and CSF biomarkers in predicting cognitive impairment up to 7.5 years later. Neurology 80: , 1784–1791. |
[28] | Knopman DS , Haeberlein SB , Carrillo MC , Hendrix JA , Kerchner G , Margolin R , Maruff P , Miller DS , Tong G , Tome MB , Murray ME , Nelson PT , Sano M , Mattsson N , Sultzer DL , Montine TJ , Jack CR Jr. , Kolb H , Petersen RC , Vemuri P , Canniere MZ , Schneider JA , Resnick SM , Romano G , van Harten AC , Wolk DA , Bain LJ , Siemers E ((2018) ) The National Institute on Aging and the Alzheimer’s Association Research Framework for Alzheimer’s disease: Perspectives from the Research Roundtable. Alzheimers Dement 14: , 563–575. |
[29] | Kapasi A , DeCarli C , Schneider JA ((2017) ) Impact of multiple pathologies on the threshold for clinically overt dementia. Acta Neuropathol 134: , 171–186. |
[30] | Boyle PA , Yu L , Wilson RS , Leurgans SE , Schneider JA , Bennett DA ((2018) ) Person-specific contribution of neuropathologies to cognitive loss in old age. Ann Neurol 83: , 74–83. |
[31] | Satz P , Cole MA , Hardy DJ , Rassovsky Y ((2011) ) Brain and cognitive reserve: Mediator(s) and construct validity, a critique. J Clin Exp Neuropsychol 33: , 121–130. |
[32] | Stern Y ((2012) ) Cognitive reserve in ageing and Alzheimer’s disease. Lancet Neurol 11: , 1006–1012. |
[33] | Petersen RC , Caracciolo B , Brayne C , Gauthier S , Jelic V , Fratiglioni L ((2014) ) Mild cognitive impairment: A concept in evolution. J Intern Med 275: , 214–228. |
[34] | Manly JJ ((2008) ) Critical issues in cultural neuropsychology: Profit from diversity. Neuropsychol Rev 18: , 179–183. |
[35] | Edmonds EC , Delano-Wood L , Galasko DR , Salmon DP , Bondi MW , Alzheimer’s Disease Neuroimaging Initiative ((2014) ) Subjective cognitive complaints contribute to misdiagnosis of mild cognitive impairment. J Int Neuropsychol Soc 20: , 836–847. |
[36] | Apostolova LG , Hwang KS , Andrawis JP , Green AE , Babakchanian S , Morra JH , Cummings JL , Toga AW , Trojanowski JQ , Shaw LM , Jack CR Jr. , Petersen RC , Aisen PS , Jagust WJ , Koeppe RA , Mathis CA , Weiner MW , Thompson PM , Alzheimer’s Disease Neuroimaging Initiative ((2010) ) 3D PIB and CSF biomarker associations with hippocampal atrophy in ADNI subjects. Neurobiol Aging 31: , 1284–1303. |
[37] | Beckett LA , Harvey DJ , Gamst A , Donohue M , Kornak J , Zhang H , Kuo JH , Alzheimer’s Disease Neuroimaging Initiative ((2010) ) The Alzheimer’s Disease Neuroimaging Initiative: Annual change in biomarkers and clinical outcomes. Alzheimers Dement 6: , 257–264. |
[38] | Donohue MC , Sperling RA , Salmon DP , Rentz DM , Raman R , Thomas RG , Weiner M , Aisen PS , Australian Imaging, Biomarkers, and Lifestyle Flagship Study of Ageing; Alzheimer’s Disease Neuroimaging Initiative; Alzheimer’s Disease Cooperative Study ((2014) ) The preclinical Alzheimer cognitive composite: Measuring amyloid-related decline. JAMA Neurol 71: , 961–970. |


