
The Effectiveness of a Web-Based Health Education Tool, WESIHAT 2.0, among Older Adults: A Randomized Controlled Trial
Abstract
Background:
Intervention strategies, especially online based approaches, are considered to be beneficial in improving the health of the senior. The effectiveness of such approaches is yet to be determined.
Objective:
This study aims to determine the effectiveness of the web-based application, WESIHAT 2.0©, for improving cognitive function, physical fitness, biochemical indices, and psychosocial variables among older adults in Klang Valley, Malaysia. The cost analysis of WESIHAT 2.0© was also determined.
Method:
The study utilized a two-arm randomized controlled trial with 25 subjects in each of the intervention and control groups. The participants chosen for the study included those who were 60 years and above with at least secondary education and had internet access using a computer at home. The intervention group was exposed to the website (30 minutes per day, 4 days per week) for six months, while the control group was given health education pamphlets. Activity-Based Costing method was used to determine the cost saved using WESIHAT 2.0© as compared to using the pamphlet.
Results:
Significant intervention effects were observed for self-perception of disability and informational support scores. WESIHAT 2.0© was able to save costs in improving the self-perception of disability score and the informational support score at MYR 6.92 and MYR 13.52, respectively, compared to the conventional method.
Conclusion:
WESIHAT 2.0© was able to save costs in improving the self-perceived disability and informational support scores for the intervention group.
INTRODUCTION
The older adult population is expected to outnumber the population of children by the year 2047 [1]. Developing countries worldwide are facing booming ‘greying’ populations. In Malaysia during the period 1991 to 2010, there was an increase in the aging population as the proportion from the total population jumped from 5.6% to 7.9%, respectively. The increase in life expectancy was due to lower mortality rate, better health-care standards, and good living standards [2].
Aging is often accompanied by subtle cognitive changes which affect the abilities of conceptual reasoning, memory, and processing speed. Besides that, aging may have an impact on fluid cognitive abilities comprising executive function, processing speed, memory, and psychomotor abilities [3]. For instance, Alzheimer’s disease (AD) does not occur overnight, but instead happens over several years from the early stages of mild cognitive impairment (MCI) [4]. MCI occurs with cognitive complaints and its prevalence varies according to countries due to methodological differences in the diagnosis. When a diagnosis of MCI is confirmed, attempts should be made to reduce its progression by practicing several lifestyle changes [4].
There is an increased risk of progression to dementia among individuals with MCI, especially with the presence of functional limitations [5]. Thus, a risk reduction approach must be considered to decrease the number of individuals diagnosed with MCI. Education level, physical activity, healthy dietary patterns (a diet which consists of fruits, vegetables, whole grains, and fish), abstinence from smoking, along with engagement in mental, social, and physical activities are protective measures against MCI [6]. Moreover, moderate calorie restriction may lead to healthy aging, extended lifespan, and improve metabolic and vascular parameters [7, 8]. In addition to these conventional approaches, new intervention strategies can be introduced to aid in combating MCI.
The progression of dementia can be prevented by undertaking and practicing intervention strategies targeting the risk factors of MCI. In this fast-paced era, Internet-based intervention can be accepted as a preferred strategy to convey health information to older people. Research done by the Pew Research Center’s Internet and American Life Project revealed that the number of older people accessing the internet to seek health information is on the rise [9]. The internet is a robust medium for delivering information because it can be accessed widely. In 2012, almost 53% of older American adults were users of Facebook, Twitter, Skype, LinkedIn, and e-mail. By 2014, the number of habitual adult internet users increased to 59%, with 47% having installed broadband connections in their respective homes [10]. Meanwhile, in the Netherlands, 77.8% of older adults have internet connections at home for online banking and social media [11]. Furthermore, the use of tablets and portable computers among the older generation in the United Kingdom has tripled from 5% in 2012, to 17% in 2013 [12]. Although older adults are slower in adapting to new technologies, their interest in using computers is comparable to that of the younger generation [13]. Hence, a web-based approach can be considered in health promotion or education involving older adults [14].
Based on a previous study, Anstey et al. (2015) stated in their findings that the Internet-based intervention was proven to be an effective educational tool where they used the website ‘Body Brain Life’ (BBL) for creating awareness among subjects in the intervention group on dementia and its risk factors [15]. The subjects in the intervention group were exposed to BBL for 26 weeks and were subsequently assessed using the Australian National University-Alzheimer‘s Disease Risk Index (ANU-ADRI) screening tool upon the completion of 26 weeks [15]. The study reported a significant increase in dementia risk reduction knowledge among the subjects. However, the subjects recruited in the study involved middle-aged adults.
Another intensive multi-domain randomized controlled trial involving older adults was the Finnish Geriatric Intervention Study to Prevent Cognitive Impairment and Disability (FINGER). The intervention study comprised of comprehensive intervention involving dietary counselling, physical activity, cognitive training, and management of metabolic risk factors for a duration of two years. This trial successfully manifested improvement in cognitive function of the subjects after two years of intervention [16]. Although this trial was conducted among older adults, the intervention lacks online mediated educational tools for informing older adults of the risk factors of cognitive decline [16]. Moreover, web-based studies involving older adults mostly focus on physical activity [17–21], diabetes mellitus [22, 23], and cardiovascular diseases [24]. Specific websites tackling the risk-reduction approach for MCI are lacking, especially for older populations in Malaysia where Malay is the most commonly spoken language. Thus, a senior-friendly, web-based health education website, WESIHAT 2.0©, was developed [25] as an extension of the previous WESIHAT version [26] to assist in the effort to lower the risk of MCI. The main objective of the current study was to determine the efficacy of WESIHAT 2.0© application towards cognition, physical fitness, biochemical indices, and psychosocial parameters. Furthermore, the cost saved using the website in improving specific parameters such as disability and information support has been analyzed.
METHODS
The study employed a two-arm randomized controlled trial (RCT), with 25 subjects in the treatment and control groups, respectively. The treatment group was exposed to WESIHAT 2.0© for four days per week, 30 minutes per session for six months. Meanwhile, the control group received the ‘Healthy Eating’ pamphlet. Subjects were randomized into the treatment and control group using randomization software Graph Pad (http://www.graphpad.com/quickcalcs/index.cfm) by considering the presence of covariates. The randomization software was utilized in this study as per the suggestion by Suresh (2011) [27], where he stated that clinical trials with a sample size of less than 100, would require adaptive randomization using randomization software especially when covariates are present in order to achieve treatment outcomes. The fieldworkers involved in the study were blinded, by not knowing the details of randomization to minimize performance bias, so that all participants obtained a similar amount of attention. Besides that, the chosen fieldworkers had to attend a training session with the experts in the respective fields to know the proper way of administering the questionnaire. Each fieldworker was assigned to one task throughout the data collection process.
This study design was approved by the Universiti Kebangsaan Malaysia and Research Ethics Committee (NN-060-2013). Written informed consent was obtained from all subjects involved in the study prior to commencing the study. This study was conducted for a period of six months at three intervals (baseline, third month, and sixth month) in four areas in and around the Klang Valley, namely Keramat, Cheras, Kajang, and Putrajaya.
Inclusion and exclusion criteria of the study
The inclusion criteria of the subjects were: 1) had a Mini-Mental State Examination (MMSE) score of 28 and below due to its high sensitivity and specificity for older adults with at least secondary education [28]; 2) received at least secondary education because this group of adults is more likely to use the internet frequently to browse for health-related information [29]; 3) had access to a computer, laptop, or tablet with an internet connection, and 4) had a Geriatric Depression Scale (GDS) score of below 5. Meanwhile, the exclusion criteria were: 1) having MMSE score above 28 and below 15 (MMSE score below 15 was considered at risk of dementia) [30]; and 2) had no computer with internet connection at home. In addition, individuals with symptoms of depression were excluded from the study because they had higher risk of mood swings, difficulties in decision making, and functional deficits such as dependency and isolation from society [31, 32].
Calculated sample size
The sample size was calculated using the GPower software. Compromise power analysis has been used because the a priori power analysis yields a larger sample size than is feasible. Compromise power analysis is used to alter the alpha level and power based on the error probability ratio. Sample size obtained for each group was 23 with power of 0.83%, effect size of 0.8, beta to alpha ratio of 2 at two tailed. After considering 10% drop-out the sample size for each group was 25.
Randomization of participants
Prior to the randomization, screening was conducted for the selection of eligible participants. The initial list comprised of 150 people with an educational level above elementary school where each individual in the list was personally contacted to invite them to participate in the screening program. However, only 80 people met the criteria for MMSE and GDS. The screening was conducted from May to July 2016. Information gathered during the screening included socio-demographic information (including having a personal computer, laptop, tablet, or iPad and having an internet connection), health status (co-morbidities), functional status (Activities of Daily Living and Instrumental Activities of Daily Living), cognitive tests (MMSE, digit span, Rey Auditory Verbal Learning Test), and GDS for symptoms of depression.
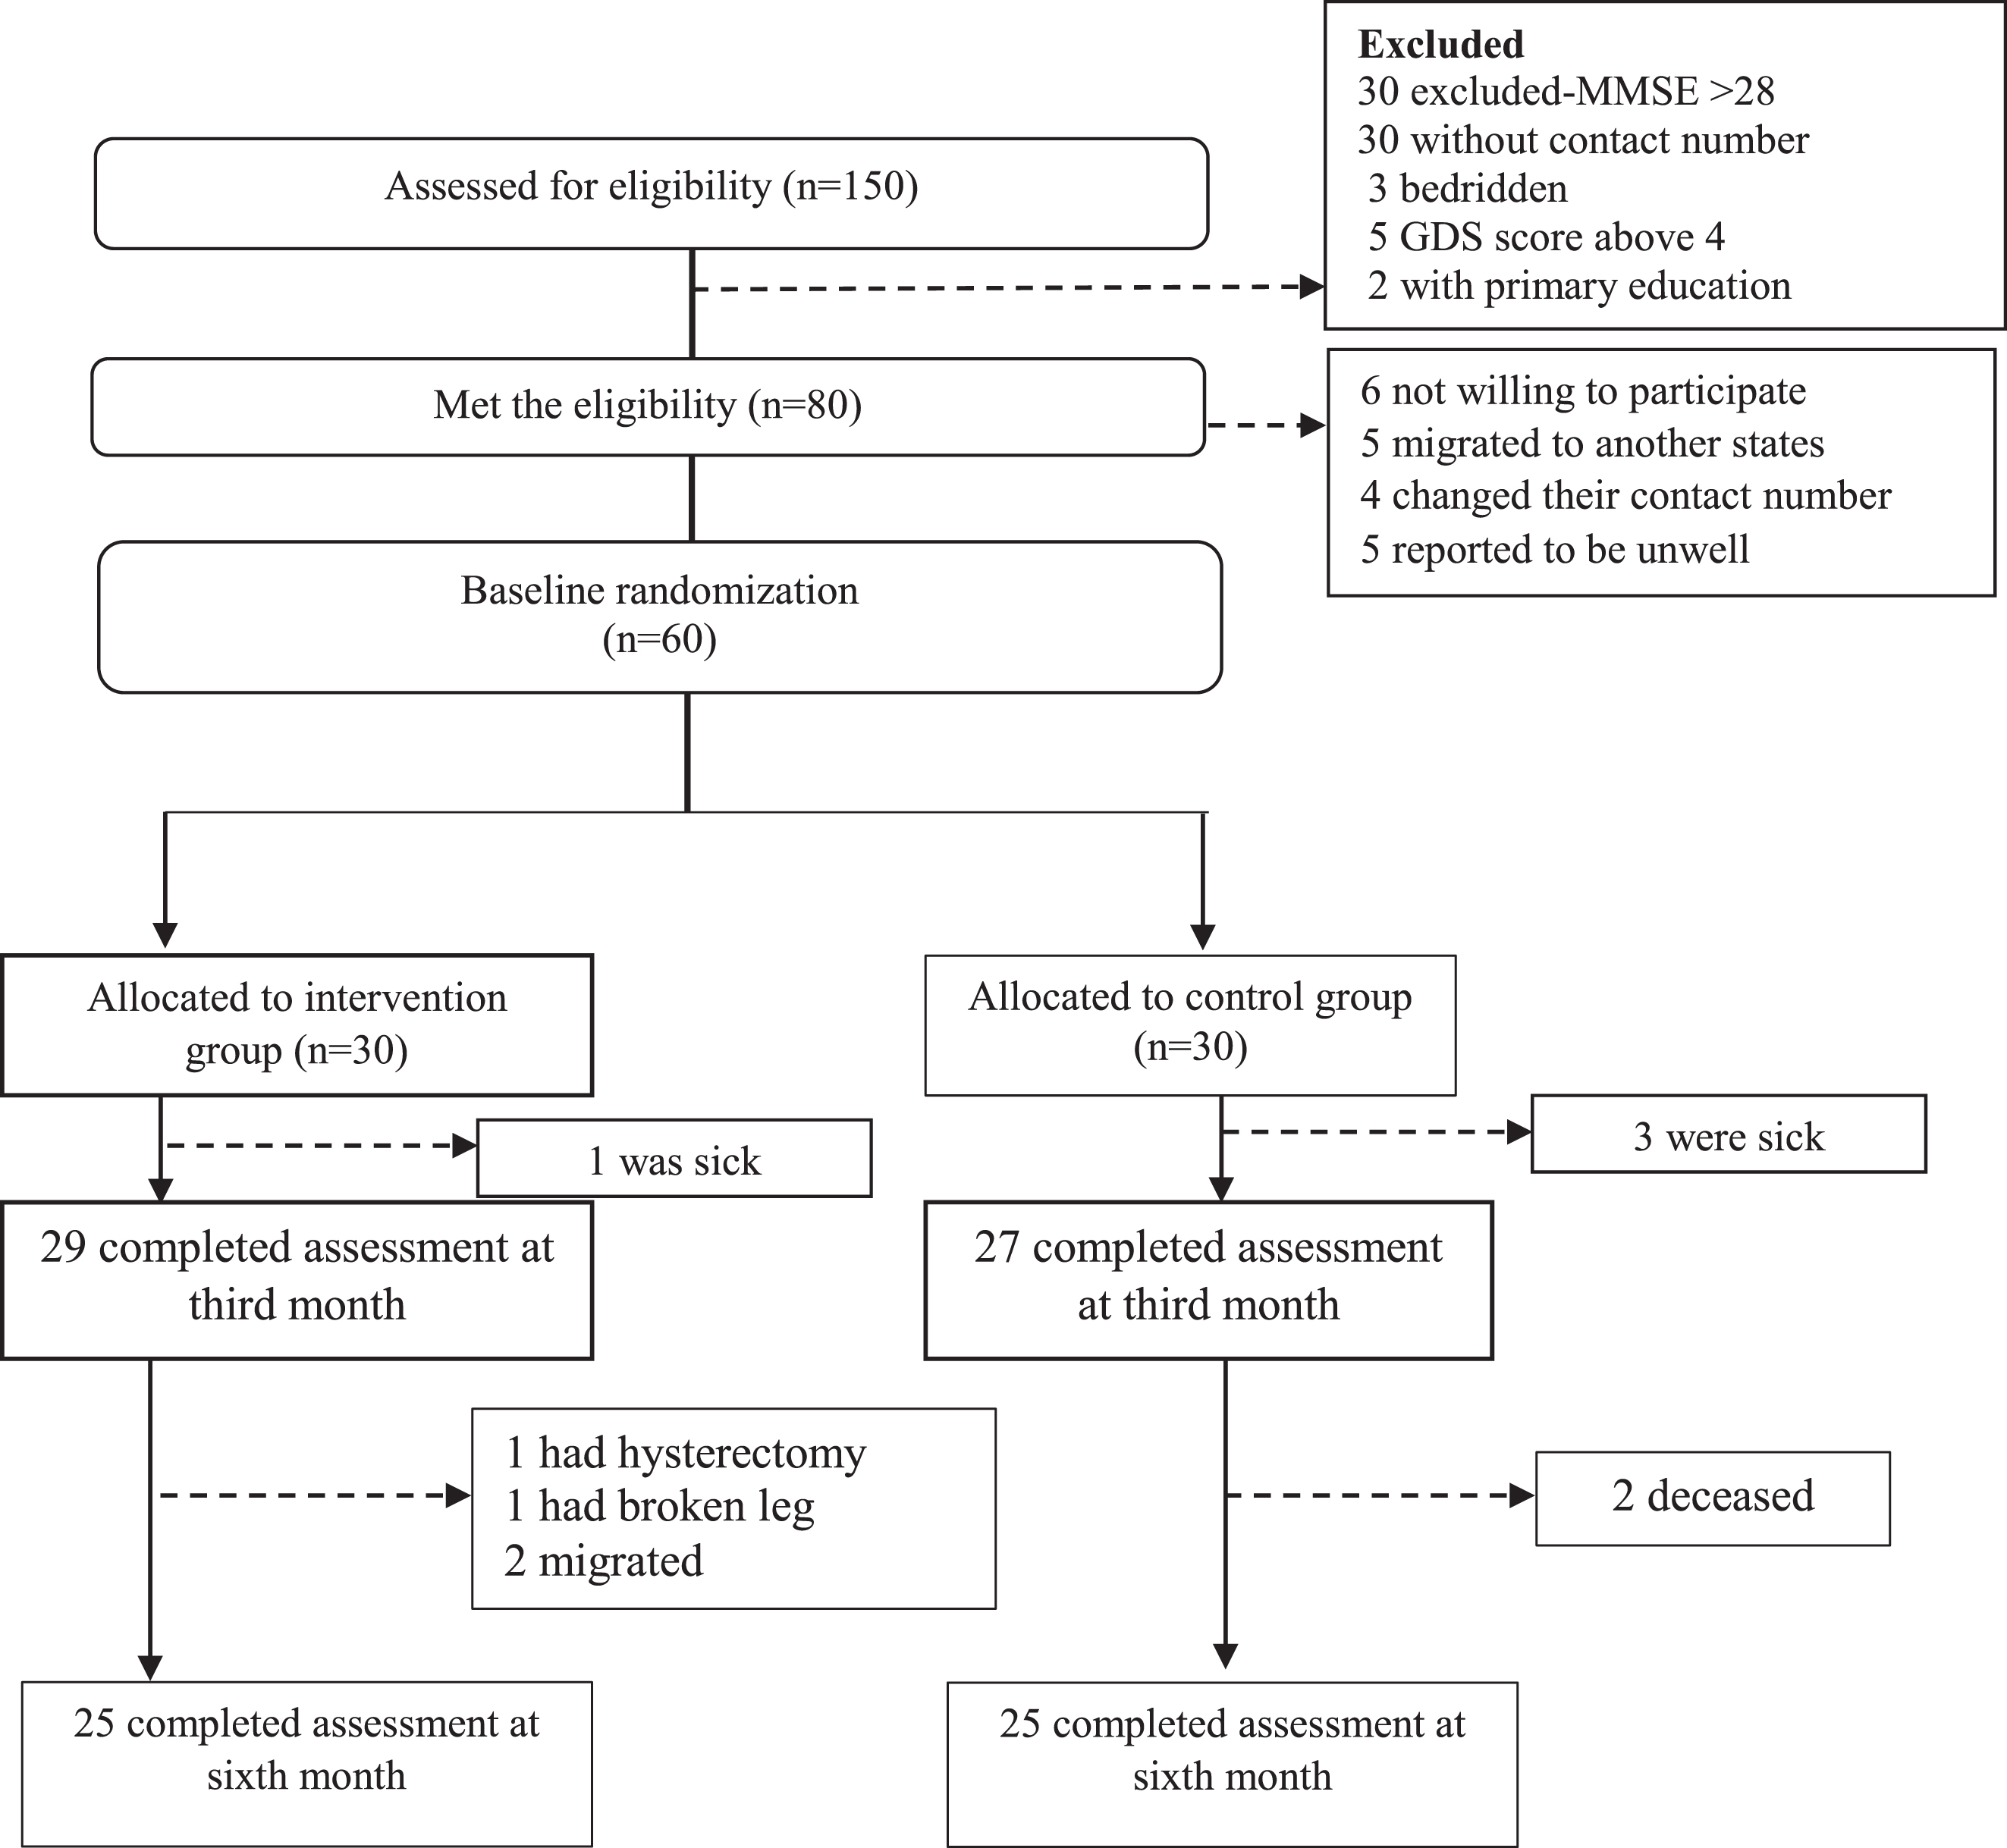
From the 80 people shortlisted based on the MMSE score, 20 were excluded because they were not willing to participate, shifted to another state, or could not be contacted. Finally, a total of 60 participants were shortlisted for the RCT and they participated in the baseline study of the intervention. However, during the study period, ten subjects withdrew from the study (five from each group) due to unavoidable circumstances such as demise, surgery, poor health, or transfer which was communicated via phone calls. Ultimately, 50 subjects were included in the statistical analysis upon the completion of the study period. Hence, each group consisted of 25 subjects respectively (Fig. 1 shows the randomization of subjects).
Fig.1
Sampling procedure flow chart.
Intervention using WESIHAT 2.0 and the printed material
The recruits from the intervention group were exposed to WESIHAT 2.0©, a web-based application for a duration of six months (at least 30 minutes per day). The development and acceptability of WESIHAT 2.0 have already been reported [25]. For the first three months of the intervention, group counselling was conducted among respondents in the intervention group to educate them about the components of WESIHAT 2.0©. A browsing manual was also provided to the subjects within the Uniform Resource Locator (URL) of the website.
As for the control group, the ‘Healthy Eating’ pamphlet was provided. The printed material was obtained from the Ministry of Health Malaysia. The pamphlet consisted of dietary recommendations and advice based on the Malaysian Food Pyramid. The control group was provided with dietary counselling based on the pamphlet given, during each visit.
The description of the website and pamphlet are summarized in Table 1
Table 1
Components of WESIHAT 2.0© and Pamphlet
| Intervention (WESIHAT 2.0©) | Control (Healthy Eating Pamphlet) |
| Website consist of four main components: | The pamphlet consists of nine dietary components: |
| 1) TUA-WELLNESS screening tool, a ten-item screening tool for identifying risk of memory impairment 2) Ten lifestyle-based memory enhancing guides (control blood sugar, control blood cholesterol, intake of fruits and vegetables, intake of fish, calorie restriction, mental stimulating activities, physical activity, smoking and alcohol, social activity and holistic health care) 3) Health Diary, a platform for users to save their biochemical test results 4) Healthy Food Menu, provided users with healthy meal preparation tips, shopping guidelines, and nutrition related quiz. | 1) Water 2) Fat and Cholesterol 3) Sugar and Salt 4) Milk and Dairy Products 5) Fish, Poultry, Meat and Legumes 6) Fruits and Vegetables 7) Cereals and Grain 8) Portion Size 9) Food Pyramid of Malaysia |
Parameters investigated during the intervention
Each subject was given a booklet with an individual registration number. The booklet consisted of the parameters investigated and it required a minimum of one hour to complete the booklet. Table 2 lists the parameters included in the booklet along with the references. The initial section of the booklet consists of the socio-demographic variables such as education level, gender, religion, age, marital status, household income, and much more. This is followed by self-reported medical history such as diabetes, heart diseases, gastrointestinal diseases, urinary incontinence, respiratory diseases, and swallowing problems. This intervention comprises two outcomes. The assessment of the cognitive function of the recruits is the primary outcome with the help of cognitive assessment batteries (Table 2). Meanwhile, the secondary outcome of this intervention was to assess the subjects’ fitness, psychosocial, and functional status (Table 2).
Table 2
Parameters investigated in this study
| Parameters | Description of parameters |
| Socio-demographics | Name, address, identification card number, gender, race, religion, education level (in years), contact number, marital status, total household income (including money given by children, spouses, relatives and funding received from governmental organization), living status, smoking and alcohol |
| Medical history | Self-reported medical history ‘Are you currently having any of the listed diseases?’ Hypertension, diabetes mellitus, hyperlipidemia, arthritis, chronic lung diseases, stroke, heart diseases, asthma, cancer, gout, constipation, gastric, urinary incontinence, chewing or swallowing problems. Family history of dementia. |
| Cognitive test | Digit span [33], digit symbol [33], Rey Auditory Verbal Learning Test [34], visual reproduction I and II [35], matrix reasoning [36], Clock Drawing Test [37], Trail Making Test part A and B [38], Mini-Mental State Examination [39] |
| Psychosocial | Loneliness [40], Medical Outcome Social Support Survey [41], self-reported quality of life, WHODAS disability scale [42], Geriatric Depression Scale [43] |
| Functional status | Activities of Daily Living [44] and Instrumental Activities of Daily Living [45] |
| Fitness | Two-minute step test, timed up and go test, chair stand test, chair sit and reach test, back scratch test, gait speed, and hand grip strength [46] |
Tools for assessing primary outcome
Cognitive function was measured using various cognitive test batteries. Digit span was used for assessing working memory and attention. It consists of two categories namely the digit span forward and backward. Score was the summation of both the components and the raw score was transformed to scale score for the purpose of analysis [33]. Digit symbol was important for determining processing speed. In this test, subjects were required to draw the symbols specific for each number within the duration of two minutes [33]. Rey Auditory Verbal Learning Test was used for assessing verbal memory [34]. In this test, subjects were required to remember a list of 15 words uttered by the researcher for a repetition of five times. The rate of verbal learning was calculated using the formula ‘(total sum of A1 to A5)-(5xA1)’ [35]. Visual memory was evaluated by using Visual Reproduction I and II [36]. In Visual Reproduction I, subjects were presented with four cards, one at each time, consisting of geometric shapes. They were required to remember the shapes in each card and draw them. Meanwhile, in Visual Reproduction II, subjects were required to draw all the four pictures after an interval of one minute without any clues. Matrix reasoning is another cognitive test battery for assessing working memory, processing speed, and reasoning abilities. Subjects were showed 35 pictures with any empty space in each. They were required to fill in the space with the correct answer based on appropriate reasoning [33]. Clock Drawing Test is for assessing visuo-spatial skills. In this test, subjects were required to draw a clock which showed 45 minutes past two. Scoring was based on the method proposed by Sunderland [37]. Folstein et al. [38] developed one of the most preferred and robust test battery called the MMSE. This questionnaire with 30 items is used to determine the global cognitive function by measuring the language, orientation, awareness, and registration and recall abilities of the subjects.
Tools for measuring secondary outcomes
The three-item loneliness scale was used for measuring level of loneliness. Each item had three-point Likert scale: 1 (hardly ever), 2 (some of the time), and 3 (often). Higher score indicated more severe loneliness [39]. Furthermore, social support was assessed using Medical Outcome Social Support Survey (MOSS). MOSS consist of four subscales namely informational support, tangible support, positive social interaction, and affective support. Higher score in each scale indicated better social support [40]. Quality of life was measured via a single question of ‘How do you rate your current quality of life?’ It has four-point Likert scale of ‘very satisfied’, ‘satisfied’, ‘not satisfied’, and ‘not satisfied at all’. WHODAS disability scale has 12 items and measured six major domains, namely mobility, self-care, household/life activities, cognitive, social/getting along, and society/participation [41]. Depressive symptoms were measured using GDS with 15 items and two answer options of ‘Yes’ and ‘No’ [42]. Activities of Daily Living has six items with ‘yes’ and ‘no’ answer options for assessing ability to perform basic routines such as toileting, eating, dressing, bathing, transferring, and continence [43]. On the other hand, Instrumental Activities of Daily Living assesses more complex activities such as transporting oneself, ability to use telephone, shopping, managing finance, performing household chores, and managing medications [44]. Fitness comprised of several tests assessing different domains. Two-minute step test is for assessing aerobic endurance, timed up and go is for agility and balance, chair stand test assesses lower body strength, chair sit and reach is for upper body flexibility, back scratch test is for lower body flexibility, gait speed is for assessing risk of falls, and hand grip strength measures upper muscle strength [45].
Upon collecting the questionnaire booklets, they were checked thoroughly for missing data. Finally, before returning home, WESIHAT 2.0© was explained to the subjects in the treatment group and permission was obtained to contact them at least once a week as a reminder to use the website. Furthermore, to avoid contamination bias, participants in the intervention group were requested not to leak any information regarding the website to the control group during the period of intervention.
Besides the actual data collection, subjects in the intervention group met once a month for group counselling sessions in order to educate them on the content of WESIHAT 2.0. It was conducted in the community hall near the subject’s area by the researcher. The main purpose of the discussion session is to provide exposure of the treatment group to the content of WESIHAT 2.0. Some of the subjects in the treatment group were not familiar with WESIHAT 2.0. Thus, group discussion was conducted to explain the proper ways to use the website, to describe the content in WESIHAT 2.0, and to identify the problems faced by subjects when using the website. To avoid boredom, the counselling session was made interesting by having a quiz related to the content of WESIHAT 2.0 and playing free online brain games using tablets. Subjects played brain games for 10 minutes during their recess session. Each group counselling session took almost 4 hours because there were practical sessions. There were three counselling sessions throughout the intervention period. Subjects were required to browse WESIHAT 2.0 using the researcher’s laptops, tablets, and internet connection. Meanwhile, the control group was not provided with counselling session.
Cost-analysis of WESIHAT2.0©
Activity-Based Costing, as proposed by Baker [46], was employed to estimate the cost and improvements in scores after the implementation of WESIHAT 2.0 and pamphlet. The Activity-Based Costing concept identifies activities which consume resources which are then translated into costs. During the study, costs related to human resources were identified by multiplying the staffs’ salary per subject with the score of the WHODAS 2.0 and informational support. Salary per subject for each fieldworker was obtained by dividing the salary per day with the total number of subjects per day. In this study, the fieldworkers were paid MYR 50 per day. The total number of subjects in one day is expected to be around 12 people. Thus, the estimated staff cost per subject for each fieldworker was 50/12 which is MYR 4.17.
Next, the cost required for the utilization of WESIHAT 2.0© and the pamphlet was calculated based on the need for staff and other elements such as questionnaire booklets, cost of printing pamphlets, the cost of websites, lodging of fieldworkers, transport, food, rental of the community hall, and honorarium. The total cost for WESIHAT 2.0 website development and web-application was MYR 26,000 over a maintenance period of five years, at approximately MYR 5,200 per year (MYR 26,000/5). Based on the Malaysian Communications and Multimedia Commission, the Internet users in year 2016 was about 24.5 million of which 1.2% were older individuals [47]. Therefore, the total older Internet users in the year 2016 represents 294,000 internet users per year (1.2% ×24.5 million). Hence, the cost per user per year was approximated at MYR 0.018 (MYR 5200/294000). For the purpose of this study which was six months, the cost per subject was MYR 0.009.
Statistical analysis
The baseline data analysis involved the use of Chi-Square test or the Fisher Exact test (for categorical variables with binary options when at least one cell has an expected frequency of less than 5), and the Mann-Whitney test for the analysis between the groups with numerical variables such as age and years of education. The effectiveness of the intervention was measured using a two-way repeated measure Analysis of Variance (ANOVA) adjusted for age, years of education, fasting blood sugar, triglyceride, high-density lipoprotein cholesterol, digit span scale score, and score of Trail Making Test B. The confounding variables, except for age and years of education, were the significant variables at the baseline analysis. The significance level was set at p < 0.05.
RESULTS
Participant demographics
As listed in Table 3, no significant differences were observed between the two groups in regards to age, gender, race, education level, marital status, living arrangements, and personal income. These results indicated that individuals in both the groups were comparable on socio-demographic aspects.
Table 3
Socio-demographic characteristics of the subjects in the WESIHAT2.0© and control group [presented as mean±standard deviation or n (%)]
| Parameter | Total (N = 50) | WESIHAT 2.0 © Group (n = 25) | Control Group (n = 25) | p |
| Mean age (y) | 67.84±5.65 | 66.92±4.60 | 68.76±6.50 | 0.2711 |
| Gender: | ||||
| Men | 21 (42.0) | 9 (36.0%) | 12 (48.0%) | 0.3902 |
| Women | 29 (58.0) | 16 (64.0%) | 13 (52.0%) | |
| Race: | 0.6673 | |||
| 0.1572 | ||||
| Malay | 44 (88.0) | 23 (92.0) | 21 (84.0) | |
| Indian | 6 (12.0) | 2 (8.0) | 4 (16.0) | |
| Personal Income*: | ||||
| <RM 1000 | 10 (20.0) | 2 (8.0) | 8 (32.0) | |
| RM1001-RM2000 | 14 (28.0) | 6 (24.0) | 8 (32.0) | |
| RM2001-RM3000 | 9 (18.0) | 6 (24.0) | 3 (12.0) | |
| RM3001-RM4000 | 9 (18.0) | 7 (28.0) | 3 (12.0) | |
| >RM4000 | 7 (14.0) | 4 (16.0) | 3 (12.0) | |
| Marital status: | ||||
| Married | 3 (6.0) | 21 (80.8) | 17 (70.8) | 0.184 2 |
| Single | 31 (62.0) | 5 (19.2) | 7 (29.2) | |
| Divorced/Widow | 16 (32.0) | 5 (20.0) | 11 (44.0) | |
| Living status: | ||||
| Living alone | 4 (8.0) | 3 (12.0) | 1 (4.0) | 0.609 3 |
| Living with others | 46 (92.0) | 22 (88.0) | 24 (96.0) | |
| Years of education | 11.91±2.47 | 12.58±2.86 | 11.24±1.81 | 0.0531 |
1p > 0.05 not significant using Mann-Whitney test; 2p > 0.05 not significant using Chi-Square; 3p > 0.05 not significant using Fisher-Exact Test. *Personal income was expressed in RM which is the abbreviation of Ringgit Malaysia or also known as MYR (Malaysian Ringgit). Personal income was the money a subject had in a month for their monthly expenses and this included subject’s salary if they are still working, pension or money given to them by their children.
Effect of intervention on cognitive function, physical fitness, biochemical parameters, and oxidative stress indices
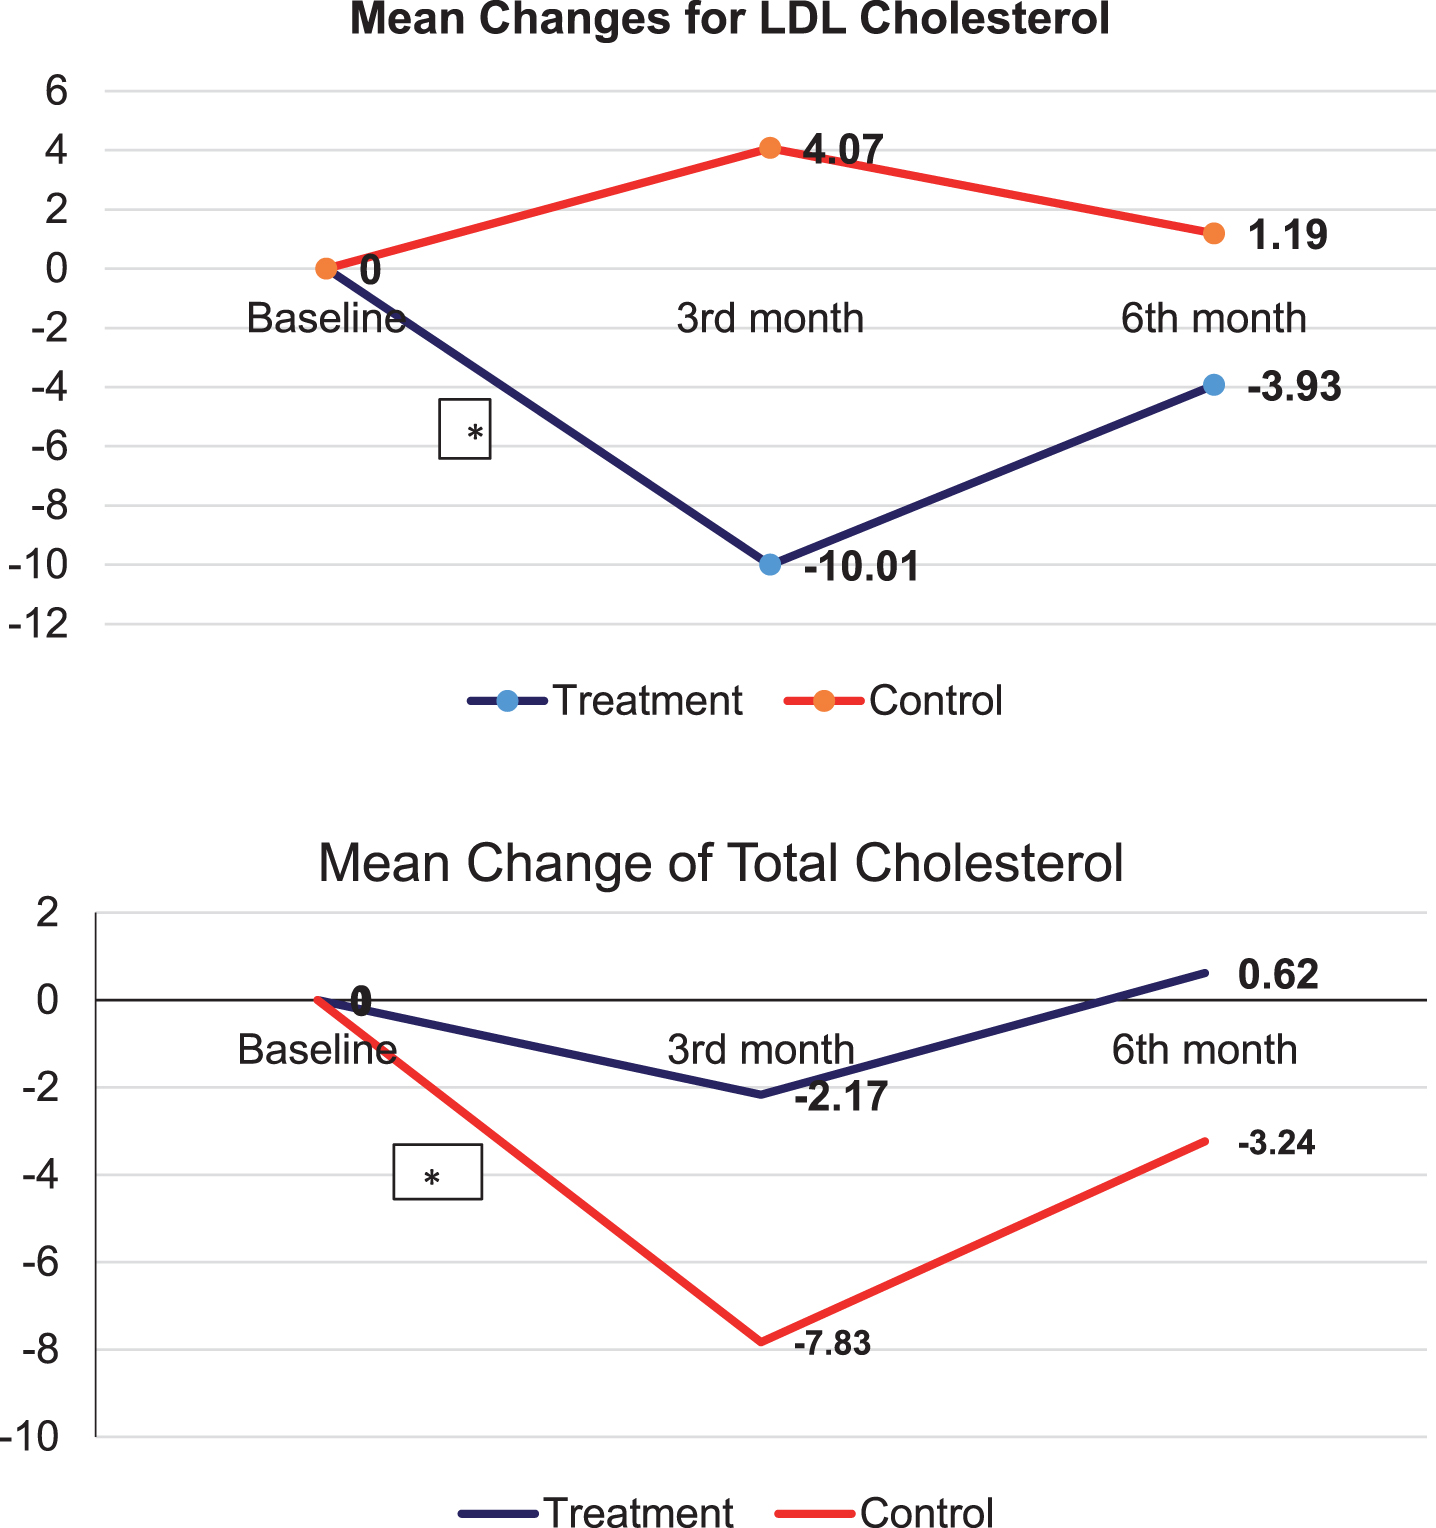
Table 4 indicated no significant intervention effects for all the cognitive tests assessed. However, significant time and group effects were observed for gait speed and back scratch tests, respectively. Intervention effect, however, was not significant for all the physical functions assessed (Table 5). Table 4 further demonstrated that there were no significant intervention effects observed in both groups for all biochemical and oxidative stress indices. Despite that, the intervention group did show a drastic decline in the mean percentage difference of low density lipoprotein (LD) cholesterol (–10.01%), while the control group demonstrated an increment of 4.07% from baseline to the third month (p < 0.05). The mean percentage difference for total cholesterol also showed a significant decline from baseline to the third month for both the intervention and control groups. A greater decline was demonstrated among the intervention group (–7.83%) as compared to the control group (–2.17%) (p < 0.05) (Fig. 2). This shows that the treatment group had proper control of their cholesterol level during the intervention period.
Table 4
Effectiveness of intervention on cognitive function
| Parameters | WESIHAT 2.0© group (n = 25) | Control group (n = 25) | Group effect | Time effect | Interaction effect | ||||||
| p |
| Power | p |
| Power | p |
| Power | |||
| Mini-Mental State Examination | |||||||||||
| Baseline | 28.30±1.78 | 27.00±2.63 | 0.460 | 0.020 | 0.112 | 0.001* | 0.266 | 0.953 | 0.256 | 0.049 | 0.258 |
| 3rd month | 28.70±1.45 | 28.19±1.80 | |||||||||
| 6th month | 29.25±0.91 | 27.31±2.44 | |||||||||
| Digit Symbol | |||||||||||
| Baseline | 9.05±2.70 | 8.13±2.66 | 0.905 | 0.001 | 0.052 | 0.674 | 0.015 | 0.111 | 0.991 | 0.019 | 0.051 |
| 3rd month | 10.00±3.04 | 8.25±2.91 | |||||||||
| 6th month | 11.05±2.42 | 8.88±2.99 | |||||||||
| Rate of verbal learning | |||||||||||
| Baseline | –3.75±25.71 | –13.60±23.64 | 0.404 | 0.034 | 0.201 | 0.272 | 0.046 | 0.191 | 0.401 | 0.035 | 0.202 |
| 3rd month | –5.80±24.39 | 3.40±22.97 | |||||||||
| 6th month | –8.70±27.95 | –20.80±28.06 | |||||||||
| Clock Drawing Test | |||||||||||
| Baseline | 9.95±0.22 | 9.63±0.89 | 0.334 | 0.035 | 0.158 | 0.181 | 0.063 | 0.321 | 0.631 | 0.624 | 0.104 |
| 3rd month | 9.95±0.22 | 9.5±0.89 | |||||||||
| 6th month | 10.0±0.00 | 9.50±0.89 | |||||||||
| Matrix reasoning | |||||||||||
| Baseline | 13.05±5.46 | 10.36±4.16 | 0.898 | 0.001 | 0.052 | 0.413 | 0.035 | 0.197 | 0.821 | 0.397 | 0.079 |
| 3rd month | 14.90±5.55 | 12.86±6.41 | |||||||||
| 6th month | 14.85±5.26 | 12.36±6.85 | |||||||||
| Visual Reproduction I | |||||||||||
| Baseline | 87.53±15.58 | 68.40±26.91 | 0.411 | 0.027 | 0.127 | 0.174 | 0.068 | 0.361 | 0.684 | 0.015 | 0.108 |
| 3rd month | 85.26±19.37 | 65.73±33.77 | |||||||||
| 6th month | 95.21±5.26 | 78.67±31.48 | |||||||||
| Visual Reproduction II | |||||||||||
| Baseline | 85.89±24.23 | 65.00±36.96 | 0.471 | 0.023 | 0.108 | 0.551 | 0.026 | 0.145 | 0.846 | 0.336 | 0.074 |
| 3rd month | 90.05±17.88 | 76.15±27.13 | |||||||||
| 6th month | 94.32±9.42 | 85.46±24.77 | |||||||||
| Trail Making Test A (s) | |||||||||||
| Baseline | 51.64±21.37 | 61.05±31.41 | 0.640 | 0.008 | 0.074 | 0.002* | 0.203 | 0.907 | 0.087 | 0.087 | 0.490 |
| 3rd month | |||||||||||
| 6th month | |||||||||||
*p < 0.01 significant using two-way repeated measure ANOVA adjusted for age, education years, digit span scale score, trail making test B, triglyceride, high density lipoprotein and fasting blood sugar.
Table 5
Effectiveness of intervention on Physical Function and Biochemical Indices
| Parameters | WESIHAT 2.0© group (n = 25) | Control group (n = 25) | Group effect | Time effect | Interaction effect | ||||||
| P |
| Power | p |
| Power | p |
| Power | |||
| Gait Speed (s) | |||||||||||
| Baseline | 5.09±0.83 | 5.40±1.45 | 0.428 | 0.026 | 0.121 | 0.018* | 0.181 | 0.814 | 0.612 | 0.020 | 0.127 |
| 3rd month | 5.45±0.76 | 5.73±1.25 | |||||||||
| 6th month | 5.05±1.26 | 5.12±1.52 | |||||||||
| Two-Minute Step Test | |||||||||||
| Baseline | 84.39±18.83 | 87.15±17.48 | 0.266 | 0.064 | 0.278 | 0.465 | 0.038 | 0.174 | 0.266 | 0.064 | 0.278 |
| 3rd month | 83.89±18.7 | 80.62±13.54 | |||||||||
| 6th month | 493.39±18.24 | 88.85±14.16 | |||||||||
| Hand Grip | |||||||||||
| Baseline | 23.25±5.97 | 24.03±9.04 | 0.574 | 0.012 | 0.085 | 0.060 | 0.102 | 0.553 | 0.602 | 0.019 | 0.130 |
| 3rd month | 22.09±6.77 | 23.67±8.51 | |||||||||
| 6th month | 23.97±5.95 | 25.20±9.61 | |||||||||
| Chair Stand Test | |||||||||||
| Baseline | 13.26±2.83 | 13.54±4.22 | 0.135 | 0.094 | 0.317 | 0.935 | 0.003 | 0.060 | 0.693 | 0.016 | 0.106 |
| 3rd month | 13.53±2.93 | 12.46±2.67 | |||||||||
| 6th month | 13.42±3.01 | 12.54±2.03 | |||||||||
| Chair Sit and Reach | |||||||||||
| Baseline | 1.51±7.87 | 1.15±5.76 | 0.684 | 0.006 | 0.068 | 0.166 | 0.067 | 0.370 | 0.972 | 0.001 | 0.054 |
| 3rd month | –0.56±9.95 | –1.66±10.38 | |||||||||
| 6th month | 1.31±5.37 | 0.04±8.63 | |||||||||
| TUG (s) | |||||||||||
| Baseline | 8.59±1.65 | 9.05±2.36 | 0.369 | 0.031 | 0.143 | 0.105 | 0.083 | 0.455 | 0.589 | 0.020 | 0.134 |
| 3rd month | 9.41±1.55 | 9.68±1.83 | |||||||||
| 6th month | 8.07±2.83 | 8.52±2.70 | |||||||||
| Back Scratch Test (cm) | |||||||||||
| Baseline | –6.67±8.01 | –14.19±11.85 | 0.027* | 0.174 | 0.616 | 0.495 | 0.027 | 0.164 | 0.753 | 0.011 | 0.093 |
| 3rd month | –7.97±10.18 | –14.03±11.75 | |||||||||
| 6th month | –6.08±9.80 | –14.34±12.83 | 0.203 | ||||||||
| PASE | |||||||||||
| Baseline | 88.45±34.31 | 86.18±38.38 | 0.081 | 0.109 | 0.417 | 0.484 | 0.027 | 0.168 | 0.400 | 0.033 | |
| 3rd month | 101.46±37.67 | 84.07±39.92 | |||||||||
| 6th month | 107.08±67.37 | 84.44±47.71 | |||||||||
| IADL | |||||||||||
| Baseline | 14.00±0.00 | 13.81±0.40 | 0.073 | 0.114 | 0.435 | 0.188 | 0.060 | 0.347 | 0.741 | 0.011 | 0.095 |
| 3rd month | 14.00±0.00 | 13.25±1.18 | |||||||||
| 6th month | 14.00±0.00 | 13.50±2.00 | |||||||||
| Total Cholesterol | |||||||||||
| Baseline | 5.29±1.02 | 5.21±1.24 | 0.964 | 0.000 | 0.050 | 0.992 | 0.000 | 0.051 | 0.791 | 0.009 | 0.085 |
| 3rd month | 4.81±0.90 | 5.04±1.75 | |||||||||
| 6th month | 5.05±0.71 | 5.31±1.26 | |||||||||
| LDL-C | |||||||||||
| Baseline | 3.22±0.97 | 3.17±1.03 | 0.816 | 0.002 | 0.056 | 0.468 | 0.030 | 0.174 | 0.343 | 0.042 | 0.231 |
| 3rd month | 2.87±0.84 | 3.20±1.28 | |||||||||
| 6th month | 3.00±0.78 | 3.27±1.11 | |||||||||
| TC/HDL | |||||||||||
| Baseline | 3.56±0.77 | 3.95±1.08 | 0.594 | 0.292 | 0.081 | 0.284 | 0.049 | 0.267 | 0.956 | 0.002 | 0.056 |
| 3rd month | 3.72±1.03 | 4.05±1.58 | |||||||||
| 6th month | 3.64±0.64 | 4.04±1.27 | |||||||||
| Malondialdehyde | |||||||||||
| Baseline | 0.03±0.02 | 0.02±0.02 | 0.339 | 0.040 | 0.155 | 0.106 | 0.093 | 0.454 | 0.186 | 0.071 | 0.347 |
| 3rd month | 0.01±0.01 | 0.01±0.01 | |||||||||
| 6th month | 0.01±0.004 | 0.02±0.01 | |||||||||
| Superoxide dismutase | |||||||||||
| Baseline | 0.06±0.02 | 0.06±0.04 | 0.628 | 0.010 | 0.076 | 0.098 | 0.096 | 0.467 | 0.901 | 0.005 | 0.065 |
| 3rd month | 0.04±0.01 | 0.04±0.02 | |||||||||
| 6th month | 0.05±0.01 | 0.06±0.02 | |||||||||
*p < 0.05 significant using two-way repeated measure ANOVA adjusted for age, education years, digit span scale score, Trail Making Test B, triglyceride, high density lipoprotein, and fasting blood sugar. TUG, Timed Up and Go Test; PASE, Physical Activity Scale for Elderly; IADL, Instrumental Activity of Daily Living; LDL-C, low density lipoprotein cholesterol; TC, total cholesterol; HDL, high density lipoprotein cholesterol; NS, not significant using two-way repeated measure ANOVA adjusted for age, education years, digit span scale score, trail making test B, triglyceride, high density lipoprotein and fasting blood sugar.
Fig.2
Percentage mean change for biochemical and oxidative stress indices. *p < 0.05 significant using Independent-t-test, **p < 0.05 significant using Mann-Whitney test.
Effect of intervention on disability and social support
The self-perception of disability was assessed by WHODAS 2.0 and indicated significant group, time, and interaction effects (p < 0.01) (Table 6). The intervention group scored lower than the control group in WHODAS 2.0 which was indicative of greater severity in disability within the control group. The change in self-perception of disability score in the control group was 4.87±6.16 at baseline, to 3.33±4.62 during the third month, and 2.53±5.64 at the sixth month (p < 0.05). The intervention group had a lower self-perception of disability score from 1.10±1.62 at baseline to 1.40±2.06 at the third month to 1.15±1.76 at the sixth month. Moreover, a significant effect was found for the informational support score (p < 0.05) and tangible support score (p < 0.01). The informational support score increased from 73.8±18.5 at baseline to 102.5±24.1 at the third month and to 112.5±20.4 at the sixth month for the intervention group; while for the control group, the baseline score was higher (78.7±27.0). However by the third (81.0±16.6) and sixth month (108.9±28.1), the scores were comparatively lower than that of the intervention group (p < 0.05).
Table 6
Effect of intervention on total score of WHODAS, social support and depressive symptoms [presented as mean±SD]
| Parameters | WESIHAT 2.0© group (n = 25) | Control group (n = 25) | Group effect | Time effect | Interaction effect | ||||||
| p |
| Power | p |
| Power | p |
| Power | |||
| Total Score WHODAS | |||||||||||
| Baseline | 1.1±1.6 | 4.9±6.2 | 0.001** | 0.341 | 0.942 | 0.029** | 0.128 | 0.668 | 0.004** | 0.191 | 0.871 |
| 3rd month | 1.4±2.1 | 3.3±4.6 | |||||||||
| 6th month | 1.2±1.8 | 2.5±5.6 | |||||||||
| Loneliness | |||||||||||
| Baseline | 3.1±0.3 | 3.4±0.8 | 0.020* | 0.184 | 0.662 | 0.524 | 0.018 | 0.112 | 0.261 | 0.048 | 0.225 |
| 3rd month | 3.1±0.3 | 3.4±0.9 | |||||||||
| 6th month | 3.2±0.5 | 4.5±1.9 | |||||||||
| Informational Support | |||||||||||
| Baseline | 73.8±18.5 | 78.7±27.0 | 0.519 | 0.016 | 0.427 | 0.321 | 0.041 | 0.244 | 0.029* | 0.123 | 0.666 |
| 3rd month | 102.5±24.1 | 81.0±16.6 | |||||||||
| 6th month | 112.5±20.4 | 108.9±28.1 | |||||||||
| Tangible Support | |||||||||||
| Baseline | 72.9±29.6 | 77.1±30.5 | 0.507 | 0.016 | 0.099 | 0.757 | 0.008 | 0.077 | 0.008** | 0.186 | 0.800 |
| 3rd month | 113.8±18.8 | 84.4±16.6 | |||||||||
| 6th month | 110.4±20.2 | 116.7±16.9 | |||||||||
| Affective Support | |||||||||||
| Baseline | 100.0±14.4 | 94.4±17.2 | 0.795 | 0.003 | 0.057 | 0.396 | 0.034 | 0.205 | 0.563 | 0.021 | 0.141 |
| 3rd month | 108.3±19.0 | 109.0±19.1 | |||||||||
| 6th month | 121.1±20.4 | 105.6±27.2 | |||||||||
| Positive Social Interaction | |||||||||||
| Baseline | 87.9±20.7 | 83.3±21.7 | 0.640 | 0.008 | 0.074 | 0.186 | 0.060 | 0.348 | 0.668 | 0.015 | 0.112 |
| 3rd month | 99.2±22.9 | 100.5±25.9 | |||||||||
| 6th month | 105.0±27.2 | 97.9±26.8 | |||||||||
| Total Social Support | 0.521 | 0.015 | 0.096 | 0.636 | 0.017 | 0.121 | 0.070 | 0.094 | 0.527 | ||
| Baseline | 80.7±15.6 | 81.8±21.7 | |||||||||
| 3rd month | 105.1±18.4 | 90.24±15.7 | |||||||||
| 6th month | 111.84±19.0 | 107.68±21.0 | |||||||||
| Depressive Symptoms | |||||||||||
| Baseline | 1.75±1.59 | 2.81±2.93 | 0.181 | 0.065 | 0.263 | 0.309 | 0.043 | 0.252 | 0.580 | 0.018 | 0.117 |
| 3rd month | 0.95±1.36 | 1.63±1.50 | |||||||||
| 6th month | 1.00±1.08 | 1.81±2.10 | |||||||||
*p < 0.05, **p < 0.01 significant using two-way repeated measure ANOVA adjusted for age, education years, digit span scale score, Trail Making Test B, triglyceride, high density lipoprotein and fasting blood sugar. WHODAS, World Health Organization Disability Assessment Schedule.
Cost-Analysis of WESIHAT 2.0 as compared to printed material
Based on the results of the intervention, WHODAS 2.0 scores post-intervention were 1.2±1.8 and 2.5±5.6 for the treatment and control groups, respectively (significant intervention effect, p < 0.05). The staff cost per subject is MYR 4.17. The staff cost per subject will be multiplied with the disability scores in the respective group. The staff costs for the disability score improvement using WESIHAT 2.0© was lower than the pamphlet (MYR 5.00 versus MYR 10.43) (Table 7). The cost of using WESIHAT 2.0© per subject is MYR 0.009 while pamphlet is MYR 4.00. Besides that, food expenses were higher for the intervention group due to counselling session. Each subject in the intervention group had to attend the counselling session once. They will be provided one meal. No other expenses were involved in the counselling session such as hall rental or fieldworker’s salary. Thus, the total overall cost (including staff cost and all other expenses) for WESIHAT 2.0© (MYR 120.479) was lower than the pamphlet (MYR127.40) and by using WESIHAT 2.0©, MYR 6.92 can be saved per subject (Table 7).
Table 7
Cost for improving WHODAS score of subjects using WESIHAT 2.0© and pamphlet
| Logistics/Field workers/Subjects | Resources | Cost drivers | Cost for per Subject Using WESIHAT 2.0© | Total Cost for WESIHAT 2.0© | Cost for per Subject Using Pamphlet | Total Cost for Pamphlet |
| Subjects | Number of subjects involved | 25 subjects | 25 subjects | |||
| 1 | Cost per subjecta | RM | 4.17/subject | 104.25 | 4.17/subject | 104.25 |
| 2 | Mean WHODAS score post intervention | 1.2 | 2.5 | |||
| 3 | Staff cost for WHODAS scoreb | RM | (4.17×1.2) = 5.00 | (5×25) = RM125 | (4.17×2.5) = 10.43 | (10.43×25) = RM260.75 |
| 4 | WHODAS score saved | 2.5-1.2 = 1.3 | (1.3×25) = 32.5 | |||
| 5 | Staff cost saved for WHODAS score | 10.43-5.00 = 5.43 | ||||
| Logistics | ||||||
| 1 | Questionnaire | Set per subject | RM 0.55 | (0.55×25) = RM 13.75 | RM 0.55 | (0.55×25) = RM 13.75 |
| 2 | Community center rental | Per day/per subject | RM 2.42 | RM 2.42 | ||
| 3 | Honorarium | Per subject | RM 20 | RM 20 | ||
| 4 | Food for subjects | Per subject | RM 10.00 | (10×25) = RM 250 | RM 7.50 | (7.5×25) = RM 187.50 |
| Fieldworkers | ||||||
| 1 | Food for fieldworkers | Per worker | RM 12.50 | (12.5×12workers) = RM 150 | RM 12.50 | (12.5×12workers) = RM 150 |
| 2 | Transport | Per worker | RM 30 | (30×12workers) = 360 | RM 30 | (30×12workers) = 360 |
| 3 | Lodging | Per worker | RM 40 | (40×12workers) = 480 | RM 40 | (40×12workers) = 480 |
| 4 | Cost of WESIHAT 2.0© or pamphletc | Per day | RM 0.009 | (RM0.009×25) = RM 0.225 | RM 4.00 | (4×25) = RM 100 |
| Total Cost (Logistic+Fieldworkers) | RM | RM 115.479 | RM 116.97 | |||
| Total Overall Cost (Total Cost + Staff Cost) | RM | RM115.479+RM 5.00 = RM 120.479 | RM116.97+RM10.43 = RM 127.40 |
aCost per subject = cost per day divided with number of subjects per day. bStaff cost = cost per subject multiplied with WHODAS score. cCost of WESIHAT 2.0© included cost of developing the website as well as the salary of website developer, while cost of pamphlet is the cost of printing colored pamphlet. RM indicates MYR.
Similarly, informational support scores post-intervention were 112.5±20.2 and 108.9±28.1 for the treatment and control groups, respectively (significant interaction effect, p < 0.05). The total overall cost spent for WESIHAT 2.0© (MYR 584.604) was lower than a pamphlet (MYR 571.083), indicating that WESIHAT 2.0© was cost-saving compared to the pamphlet in improving the informational support score (about MYR 13.52 saved using WESIHAT 2.0©) (Table 8).
Table 8
Cost for improving informational support score of subjects using WESIHAT 2.0© and pamphlet
| Logistics/Field workers/Subjects | Resources | Cost drivers | Cost for per Subject Using WESIHAT 2.0© | Total Cost for WESIHAT 2.0© | Cost for per Subject Using Pamphlet | Total Cost for Pamphlet |
| Subjects | Number of subjects involved | 25 subjects | 25 subjects | |||
| 1 | Cost per subjecta | RM | 4.17/subject | 104.25/subject | 4.17/subject | 104.25/subject |
| 2 | Mean informational support score post intervention | 112.5 | 108.9 | |||
| 3 | Staff cost for informational support scoreb | RM | (4.17×112.5) = 469.125 | (469.125×25) = RM11728.125 | (4.17×108.9) = 454.113 | (454.113×25) = RM11352.83 |
| 4 | Informational support score saved | 112.5-108.9 = 3.6 | (3.6×25) = 90 | |||
| 5 | Staff cost saved for informational support score | 469.125-454.113 = 15.012 | ||||
| Logistics | ||||||
| 1 | Questionnaire | Set per subject | RM 0.55 | (0.55×25) = RM 13.75 | RM 0.55 | (0.55×25) = RM 13.75 |
| 2 | Community center rental | Per day | RM 2.42 | RM 2.42 | ||
| 3 | Honorarium | Per subject | RM 20 | RM 20 | ||
| 4 | Food for subjects per day | Per subject | RM 10.00 | (10×25) = RM 250.00 | RM 7.50 | (7.5×25) = RM 187.50 |
| Fieldworkers | ||||||
| 1 | Food for fieldworkers per day | Per worker | RM 12.50 | (12.5×12workers) = RM 150 | RM 12.50 | (12.5×12workers) = RM 150 |
| 2 | Transport per day | Per worker | RM 30 | (30×12workers) = 360 | RM 30 | (30×12workers) = 360 |
| 3 | Lodging per day | Per worker | RM 40 | (40×12workers) = 480 | RM 40 | (40×12workers) = 480 |
| 4 | Cost of WESIHAT 2.0© or pamphletc | Per day | RM 0.009 | (RM0.018×25) = RM 0.45 | RM 4.00 | (4×25) = RM 100 |
| Total Cost (Logistic + Fieldworkers) | RM | RM 115.479 | RM 116.97 | |||
| Total Overall Cost | ||||||
| (Total Cost + Staff Cost) | RM | RM115.479+RM469.125 = RM 584.604 | RM116.97+RM454.113 = RM 571.083 |
aCost per subject = cost per day divided with number of subjects per day. bStaff cost = cost per subject multiplied with informational support score. cCost of WESIHAT 2.0© included cost of developing the website as well as the salary of website developer, while cost of pamphlet is the cost of printing colored pamphlet. RM indicated MYR.
DISCUSSION
The study successfully showed the effectiveness of a web-based intervention program compared to the conventional health education method. WESIHAT 2.0© was able to save costs in improving the self-perception of disability (WHODAS 2.0) and informational support score by MYR 6.92 and MYR 13.52, respectively. This agreed with findings by Golsteijn et al. [48], where they demonstrated that web-based intervention for physical activity was a more cost-saving method ($2.55 per participant per year) compared to a pamphlet ($2.88 per participant per year). Web-based intervention is a cheaper strategy for delivering health information for an unlimited number of people compared to printed materials. Although internet-based intervention is expensive to develop initially, the advantages compared to printed materials when disseminated to large populations is remarkable. Overall costs, especially staff costs, for printed material will increase with additional subjects; however, intervention delivered through the internet had no extra costs to reach out to a wider group of people [48, 49]. The web-based module carried more information and is accessible at all times worldwide in areas where the internet is available compared to using the conventional method of distributing pamphlets. Moreover, the contents on a website can be updated when required, unlike the printed materials.
The study demonstrated a significant effect on the self-perception of disability assessed using WHODAS 2.0. Based on the WHODAS 2.0 analysis, the intervention group was reported to have better ability to perform basic self-care, household routines, learning new tasks, and engaging in community-based activities. Overall, WESIHAT 2.0© encouraged older adults to be physically, mentally, and socially active by motivating them to participate in physical activities, mentally stimulating activities, or voluntary activities. However, difficulties were reported by the intervention group in dealing with unknown people due to the fear of being deceived. Besides that, as compared to the control group, subjects in the intervention group had difficulties maintaining friendship especially with friends staying apart. This may be due to the limited knowledge of using modern technologies such as e-mail, messages, Facebook, and Instagram or seldom going for vacation together.
On the other hand, the study also reported a significant effect on the informational support score, showing a better score in the intervention group compared to the control group. WESIHAT 2.0© encourages older people to build good social networking where it motivated them to be optimistic when dealing with challenges in life. They were advised to share problems with family members or friends to come up with solutions. Good social support may be a protective factor against poor cognition [50]. The relationship between good social support and increased grey matter volume has been shown in younger adults [50, 51], especially in the posterior parts of the posterior cingulate cortex, the bilateral lingual cortex, the cuneus, and the left occipital lobe, which indicated capability in self-referential processes (ability to connect the external information to the self) [51].
Unfortunately, this study did not demonstrate significant effects for the Trail Making Test A (TMT A) and MMSE. This is in agreement with an RCT conducted in China, exposing the intervention group to a computerized cognitive training program, which demonstrated no significant changes in cognitive test scores between the treatment and control group [52]. Although not significant, the participants with MCI in the treatment group reported improvement in the attention, orientation, memory, fluency, and language domains [52]. Similarly, the current study also reported improvement in MMSE and TMT A scores for the intervention group, without achieving statistical significance. A systematic review has showed that intervention program lasting for six to 12 months was not sufficient to detect changes in cognitive function [53].
Based on the results of this study, no significant intervention effect for all the physical fitness components assessed was revealed. This was in agreement with the findings of a previous study with a three-month RCT with four groups, namely: web-based (exposed to website targeting physical activity; n = 33), mixed (exposed to website and physical activity sessions; n = 38), physical activity (exposed to weekly physical activity; n = 40), and control group (no intervention; n = 38), which failed to obtain significant interaction effect for all groups except the mixed group [54]. Differences in exercise intensity or variation in types of exercised practiced by older adults may contribute to the insignificant findings [53]. Besides that, biochemical parameters such as total cholesterol and LDL cholesterol had no significant interaction effect related to lifestyle factors. This is in agreement with the study by Bosak et al. (2012) which did not find significant changes in lipid profile of subjects exposed to web-based physical activity intervention [55].
Therefore, the finding of no significant intervention effect in this study does not indicate that web-based intervention is less effective in improving the cognitive function of older adults. Methodological limitations or even fear of using the computer by older adults may be possible contributing factors to the insignificant findings. The use of the computer by older individuals requires complex motor functioning for typing, selecting, moving the cursor, language processing to understand, and focusing [56]. Therefore, with sufficient practice, older people may gain benefits by using a computer.
Strengths and limitations
This is the first online-based intervention study for educating older adults from a middle-class socioeconomic status in an Asian country in an effort to reduce the risk of cognitive impairment. The current study also evaluated the cost saved by using online websites, which was not often assessed in previous studies. The WESIHAT 2.0 website will be useful for health professionals for assessing the risk of cognitive impairment using the TUA-WELLNESS tool and educating their geriatric patients. Although this study only involved educated older people, future trials may be conducted among individuals who are illiterate or those with lower than secondary education.
The limitations faced during the study include smaller sample size. Systematic review has showed that improvement in behavioral and health outcomes in an intervention study using application can be demonstrated with sample size of at least 90 people [57]. This study was also unable to track the user’s frequency of logging in. The logging in information was self-reported and can be disputed, so any future study should include a monitoring aspect as part of the study.
Conclusion
The web-based application, WESIHAT 2.0©, has the potential to improve self-perception of disability and the informational support score. However, its effectiveness in improving cognitive function needs further study over a longer duration. WESIHAT 2.0© is also cheaper in achieving the goal compared to the conventional method. Therefore, this website can be used in memory clinics or community clinics in the future for screening risk of cognitive impairment as well as to educate the seniors on lifestyle modifications strategies which could slow the progression of cognitive impairment. In addition, WESIHAT 2.0© can be used in future research involving older people as an education module.
ACKNOWLEDGMENTS
We would like to acknowledge the Ministry of Higher Education Malaysia for their financial assistance to conduct this study under the grant scheme LRGS TUA (LRGS/BU/2012/UKM-UKM/K/01). We appreciate the cooperation of the subjects of this study for completing the research successfully and special thanks are given to the fieldworkers, staff and local authorities for their support throughout the study period.
Authors’ disclosures available online (https://www.j-alz.com/manuscript-disclosures/18-0464r5).
REFERENCES
[1] | Chatterji S , Byles J , Cutler D , Seeman T , Verdes E ((2015) ) Health, functioning, and disability in older adults—present status and future implications. Lancet 385: , 563–575. |
[2] | Tey NP , Saedah S , Shahrul Bahyah K , Chin AI , Tan MP , Sinnappan GS , Muller AM ((2016) ) Aging in multi-ethnic Malaysia. Gerontologist 56: , 603–609. |
[3] | Bennett IJ , Madden DJ ((2014) ) Disconnected aging: Cerebral white matter integrity and age related differences in cognition. Neuroscience 12: , 187–205. |
[4] | Korczyn AD ((2016) ) Parkinson’s and Alzheimer’s diseases: Focus on mild cognitive impairment. Parkinsonism Relat Disord 22: , 159–161. |
[5] | Roberts RO , Knopman DS , Mielke MM , Cha RH , Pankratz VS , Christianson TJ , Geda YE , Boeve BF , Ivnik RJ , Tangalos EG , Rocca WA , Petersen RC ((2014) ) Higher risk of progression to dementia in mild cognitive impairment cases who revert to normal. Neurology 82: , 317–325. |
[6] | Baumgart M , Snyder HM , Carrillo MC , Fazio S , Kim H , Johns H ((2015) ) Summary of the evidence on modifiable risk factors for cognitive decline and dementia: A population-based perspective. Alzheimers Dement 11: , 718–726. |
[7] | Smith PJ , Blumenthal JA ((2010) ) Diet and neurocognition: Review of evidence and methodological considerations. Curr Aging Sci 3: , 57–66. |
[8] | Prehn K , Jumpertz von Schwartzenberg R , Mai K , Zeitz U , Witte AV , Hampel D , Szela AM , Fabian S , Grittner U , Spranger J , Flöel A ((2016) ) Caloric restriction in older adults—differential effects of weight loss and reduced weight on brain structure and function. Cereb Cortex 27: , 1765–1778. |
[9] | Tennant B , Stellefson M , Dodd V , Chaney B , Chaney D , Paige S , Alber J ((2015) ) eHealth literacy and Web 2.0 health information seeking behaviors among baby boomers and older adults. J Med Internet Res 17: , e70. |
[10] | Smith A ((2014) ) Older adults and technology use: Adoption is increasing, but many seniors remain isolated from digital life. Pew Research Center. Retrieved from http://assets.pewresearch.org/wp-content/uploads/sites/14/2014/04/PIP_Seniors-and-Tech-Use_040314.pdf. |
[11] | van Boekel LC , Peek ST , Luijkx KG ((2017) ) Diversity in older adults’ use of the internet: Identifying subgroups through latent class analysis. J Med Internet Res 19: , e180. |
[12] | Vaportzis E , Giatsi Clausen M , Gow AJ ((2017) ) Older adults perceptions of technology and barriers to interacting with tablet computers: A focus group study. Front Psychol 8: , 1–11. |
[13] | Broady T , Chan A , Caputi P ((2010) ) Comparison of older and younger adults’ attitudes towards and abilities with computers: Implications for training and learning. Br J Educ Technol 41: , 473–485. |
[14] | Nijland N , van Gemert-Pijnen JE , Kelders SM , Brandenburg BJ , Seydel ER ((2011) ) Factors influencing the use of a Web-based application for supporting the self-care of patients with type 2 diabetes: A longitudinal study. J Med Internet Res 13: , e71. |
[15] | Anstey KJ , Bahar-Fuchs A , Herath P , Kim S , Burns R , Rebok GW , Cherbuin N ((2015) ) Body brain life: A randomized controlled trial of an online dementia risk reduction intervention in middle-aged adults at risk of Alzheimer’s disease. Alzheimers Dement (N Y) 1: , 72–80. |
[16] | Ngandu T , Lehtisalo J , Solomon A , Levälahti E , Ahtiluoto S , Antikainen R , Bäckman L , Hänninen T , Jula A , Laatikainen T , Lindström J , Mangialasche F , Paajanen T , Pajala S , Peltonen M , Rauramaa R , Stigsdotter-Neely A , Strandberg T , Tuomilehto J , Soininen H , Kivipelto M ((2015) ) A 2 year multidomain intervention of diet, exercise, cognitive training, and vascular risk monitoring versus control to prevent cognitive decline in at-risk elderly people (FINGER): A randomised controlled trial. Lancet 385: , 2255–2263. |
[17] | Hong Y , Goldberg D , Dahlke DV , Ory MG , Cargill JS , Coughlin R , Hernandez E , Kellstedt DK , Peres SC ((2014) ) Testing usability and acceptability of a web application to promote physical activity (iCanFit) among older adults. JMIR Human Factors 1: , e2. |
[18] | Wijsman CA , Westendorp RG , Verhagen EA , Catt M , Slagboom PE , de Craen AJ , Broekhuizen K , van Mechelen W , van Heemst D , van der Ouderaa F , Mooijaart SP ((2013) ) Effects of a web-based intervention on physical activity and metabolism in older adults: Randomized controlled trial. J Med Internet Res 15: , e233. |
[19] | Irvine AB , Gelatt VA , Seeley JR , Macfarlane P , Gau JM ((2013) ) Web-based intervention to promote physical activity by sedentary older adults: Randomized controlled trial.. J Med Internet Res 15: , e19. |
[20] | Sink KM , Espeland MA , Castro CM , Church T , Cohen R , Dodson JA , Guralnik J , Hendrie HC , Jennings J , Katula J , Lopez OL ((2015) ) Effect of a 24-month physical activity intervention vs health education on cognitive outcomes in sedentary older adults: The LIFE randomized trial. JAMA 314: , 781–790. |
[21] | Muellmann S , Forberger S , Möllers T , Bröring E , Zeeb H , Pischke CR ((2017) ) Effectiveness of eHealth interventions for the promotion of physical activity in older adults: A systematic review. Prev Med 108: , 93–108. |
[22] | McMahon GT , Fonda SJ , Gomes HE , Alexis G , Conlin PR ((2012) ) A randomized comparison of online-and telephone-based care management with internet training alone in adult patients with poorly controlled type 2 diabetes. Diabetes Technol Ther 14: , 1060–1067. |
[23] | Bond GE , Burr R , Wolf FM , Price M , McCurry SM , Teri L ((2007) ) The effects of a web-based intervention on the physical outcomes associated with diabetes among adults age 60 and older: A randomized trial. Diabetes Technol Ther 9: , 52–59. |
[24] | Beishuizen CR , Stephan BC , van Gool WA , Brayne C , Peters RJ , Andrieu S , Kivipelto M , Soininen H , Busschers WB , van Charante EPM , Richard E ((2016) ) Web-based interventions targeting cardiovascular risk factors in middle-aged and older people: A systematic review and meta-analysis. J Med Internet Res 18: , e55. |
[25] | Vanoh D , Ishak IH , Shahar S , Manaf ZA , Ali NM , Noah SAM ((2018) ) Development and assessment of a web-based intervention for educating older people on strategies promoting healthy cognition. Clin Interv Aging 13: , 1787–1798. |
[26] | Ali NM , Shahar S , Kee YL , Norizan AR , Noah SAM ((2012) ) Design of an interactive digital nutritional education package for elderly people. Inform Health Soc Care 37: , 217–229. |
[27] | Suresh KP ((2011) ) An overview of randomization techniques: An unbiased assessment of outcome in clinical research. J Hum Reprod Sci 4: , 8. |
[28] | Feng L , Chong MS , Lim WS , Ng TP ((2012) ) The Modified Mini-Mental State Examination test: Normative data for Singapore Chinese older adults and its performance in detecting early cognitive impairment. Singapore Med J 53: , 458–462. |
[29] | Gitlow L ((2014) ) Technology use by older adults and barriers to using technology. Phys Occup Ther Geriatr 32: , 271–280. |
[30] | CPG ((2009) ) Clinical Practice Guidelines Dementia, Ministry of Health, Putrajaya, Malaysia. |
[31] | Casey DA ((2017) ) Depression in older adults: A treatable medical condition. Primary Care 44: , 499–510. |
[32] | Santos KT , Fernandes MH , Reis LA , Coqueiro RS , Rocha SV ((2012) ) Depressive symptoms and motor performance in the elderly: A population based study. Braz J Phys Ther 16: , 295–300. |
[33] | Wechsler D ((1997) ) Wechsler adult intelligence scale-III. The Psychological Corporation, San Antonio. |
[34] | Rosenberg SJ , Ryan JJ , Prifitera A ((1984) ) Rey auditory? Verbal learning test performance of patients with and without memory impairment. J Clin Psychol 40: , 785–787. |
[35] | Wechsler D ((1987) ) Wechsler Memory Scale-Revised. The Psychological Corporation, San Antonio. |
[36] | Sunderland T , Hill JL , Mellow AM , Lawlor BA , Gundersheimer J , Newhouse PA , Grafman JH ((1989) ) Clock drawing in Alzheimer’s disease. J Am Geriatr Soc 37: , 725–729. |
[37] | Cangoz B , Karakoc E , Selekler K ((2009) ) Trail Making Test: Normative data for Turkish elderly population by age, sex and education. J Neurol Sci 283: , 73–78. |
[38] | Folstein MF , Folstein SE , McHugh PR ((1975) ) Mini-Mental State: A practical method for grading the cognitive state of patients for the clinician. J Psychiatr Res 12: , 189–198. |
[39] | Hughes ME , Waite LJ , Hawkley LC , Cacioppo JT ((2004) ) A short scale for measuring loneliness in large surveys results from two population-based studies. Res Aging 26: , 655–672. |
[40] | Sherbourne CD , Stewart AL ((1991) ) The MOS social support survey. Soc Sci Med 32: , 705–714. |
[41] | Andrews G , Kemp A , Sunderland M , von Korff M , Ustun TB ((2009) ) Normative data for the 12 item WHO Disability Assessment Schedule 2.0. PLoS One 4: , 8343–8348. |
[42] | Sheikh JI , Yesavage JA ((1986) ) Geriatric Depression scale: A recent evidence and development of a shorter version. Clin Gerontol 5: , 165–173. |
[43] | Katz S , Downs TD , Cash HR , Grotz RC ((1970) ) Progress in development of the index of ADL. Gerontologist 10: , 20–30. |
[44] | Lawton MP , Brody EM ((1969) ) Assessment of older people: Self-maintaining and instrumental activities of daily living. Gerontologist 9: , 179–186. |
[45] | Rikli RE , Jones CJ ((2013) ) Development and validation of criterion-referenced clinically relevant fitness standards for maintaining physical independence in later years. Gerontologist 53: , 255–267. |
[46] | Baker J ((1998) ) Activity-Based Costing and Activity-Based Management for Health Care. Aspen Publisher, Maryland. |
[47] | MCMC ((2017) ) Internet users survey. Malaysian Communications and Multimedia Commission, Cyberjaya. |
[48] | Golsteijn RH , Peels DA , Evers SM , Bolman C , Mudde AN , de Vries H , Lechner L ((2014) ) Cost-effectiveness and cost-utility of a Web-based or print-delivered tailored intervention to promote physical activity among adults aged over fifty: An economic evaluation of the Active Plus intervention. Int J Behav Nutr Phys Act 11: , 122. |
[49] | Lewis BA , Williams DM , Neighbors CJ , Jakicic JM , Marcus BH ((2010) ) Cost analysis of Internet vs. print interventions for physical activity promotion. J Sport Exerc Psychol 11: , 246–249. |
[50] | Kats D , Patel MD , Palta P , Meyer ML , Gross AL , Whitsel EA , Knopman D , Alonso A , Mosley TH , Heiss G ((2016) ) Social support and cognition in a community-based cohort: The Atherosclerosis Risk in Communities (ARIC) study. Age Ageing 45: , 475–480. |
[51] | Che X , Wei D , Li W , Li H , Qiao L , Qiu J , Zhang Q , Liu Y ((2014) ) The correlation between gray matter volume and perceived social support: A voxel-based morphometry study. Soc Neurosci 9: , 152–159. |
[52] | Zhuang JP , Fang R , Feng X , Xu XH , Liu LH , Bai QK , Tang HD , Zhao ZG , Chen SD ((2013) ) The impact of human-computer interaction-based comprehensive training on the cognitive functions of cognitive impairment elderly individuals in a nursing home. J Alzheimers Dis 36: , 245–251. |
[53] | Sanders LM , Hortobágyi T , la Bastide-van Gemert S , van der Zee EA , van Heuvelen MJ ((2019) ) Dose-response relationship between exercise and cognitive function in older adults with and without cognitive impairment: A systematic review and meta-analysis. PloS One 14: , p.e0210036. |
[54] | Mouton A , Cloes M ((2015) ) Efficacy of a web-based, center-based or combined physical activity intervention among older adults. Health Educ Res 30: , 422–435. |
[55] | Bosak KA , Yates B , Pozehl B ((2010) ) Effects of an Internet physical activity intervention in adults with metabolic syndrome. Western J Nurs Res 32: , 5–22. |
[56] | Austin J , Hollingshead K , Kaye J ((2017) ) Internet searches and their relationship to cognitive function in older adults: Cross-sectional analysis. J Med Internet Res 19: , e307. |
[57] | Schoeppe S , Alley S , Van Lippevelde W , Bray NA , Williams SL , Duncan MJ , Vandelanotte C ((2016) ) Efficacy of interventions that use apps to improve diet, physical activity and sedentary behaviour: A systematic review. Int J Behav Nutr Phys Act 13: , 127. |


