
Application of Weighted Gene Co-Expression Network Analysis to Explore the Key Genes in Alzheimer’s Disease
Abstract
Background:
Weighted co-expression network analysis (WGCNA) is a powerful systems biology method to describe the correlation of gene expression based on the microarray database, which can be used to facilitate the discovery of therapeutic targets or candidate biomarkers in diseases.
Objective:
To explore the key genes in the development of Alzheimer’s disease (AD) by using WGCNA.
Methods:
The whole gene expression data GSE1297 from AD and control human hippocampus was obtained from the GEO database in NCBI. Co-expressed genes were clustered into different modules. Modules of interest were identified through calculating the correlation coefficient between the module and phenotypic traits. GO and pathway enrichment analyses were conducted, and the central players (key hub genes) within the modules of interest were identified through network analysis. The expression of the identified key genes was confirmed in AD transgenic mice through using qRT-PCR.
Results:
Two modules were found to be associated with AD clinical severity, which functioning mainly in mineral absorption, NF-κB signaling, and cGMP-PKG signaling pathways. Through analysis of the two modules, we found that metallothionein (MT), Notch2, MSX1, ADD3, and RAB31 were highly correlated with AD phenotype. Increase in expression of these genes was confirmed in aged AD transgenic mice.
Conclusion:
WGCNA analysis can be used to analyze and predict the key genes in AD. MT1, MT2, MSX1, NOTCH2, ADD3, and RAB31 are identified to be the most relevant genes, which may be potential targets for AD therapy.
INTRODUCTION
Alzheimer’s disease (AD) is the most common type of dementia in aging population. It is pathologically characterized by intraneuronal formation of neurofibrillary tangles (NFTs), extracellular deposition of senile plaques, and early loss of synapses [1]. Until now, the pathogenesis of AD remains largely unknown. Several hypotheses, such as tau pathology, amyloidosis, neuroinflammation, oxidative stress, and cholinergic neurodegeneration theories were established to explain the mechanisms; however, no therapy based on current theories can effectively prevent the occurrence of AD. Therefore, identification of the molecular basis of the disease is urgently required for the discovery of novel pharmacological target.
Weighted gene co-expression network analysis (WGCNA) is a popular systems biology method used to describe the correlation of gene expression based on the microarray database [2]. WGCNA can be used for finding gene clusters with highly correlated expression (modules), for summarizing these co-expressed gene clusters by identification of the module eigengene or hub genes, for relating the modules to phenotypes to get the most phenotypic trait-related module and for calculating module membership measures. Further correlation network analysis can identify the key and central players within modules, thus facilitate the discovery of therapeutic targets or candidate biomarkers.
In the present study, we performed WGCNA using gene expression data from publicly accessible microarray data obtained from AD and control human hippocampus. We identified 19 co-expression modules. Through calculating the correlation coefficient between the module and each phenotype, we obtained two modules of interest. We conducted GO and pathway enrichment analysis and further identify the central players within the two modules through network analysis. At last, the expression of the identified genes was confirmed in AD transgenic mice. We concluded that MT1, MT2, MSX1, NOTCH2, ADD3, and RAB31 are the most relevant genes, which may be potential targets for AD therapy.
MATERIALS AND METHODS
Data acquisition and preprocessing
The data used in this paper was obtained from the GEO database in NCBI (Gene Expression Omnibus, http://www.ncbi.nlm.gov/geo), and the data entry number is GSE1297. The data come from the work of Blalock EM [3]. The platform was [HG-U133A] Affymetrix Human Genome Array. Hippocampal gene expression of nine control and 22 AD human subjects of varying severity including seven incipient, eight moderate, and seven severe cases were analyzed. To facilitate the follow-up analysis, these four levels of data distribution were assigned to group 1, 2, 3, and 4.
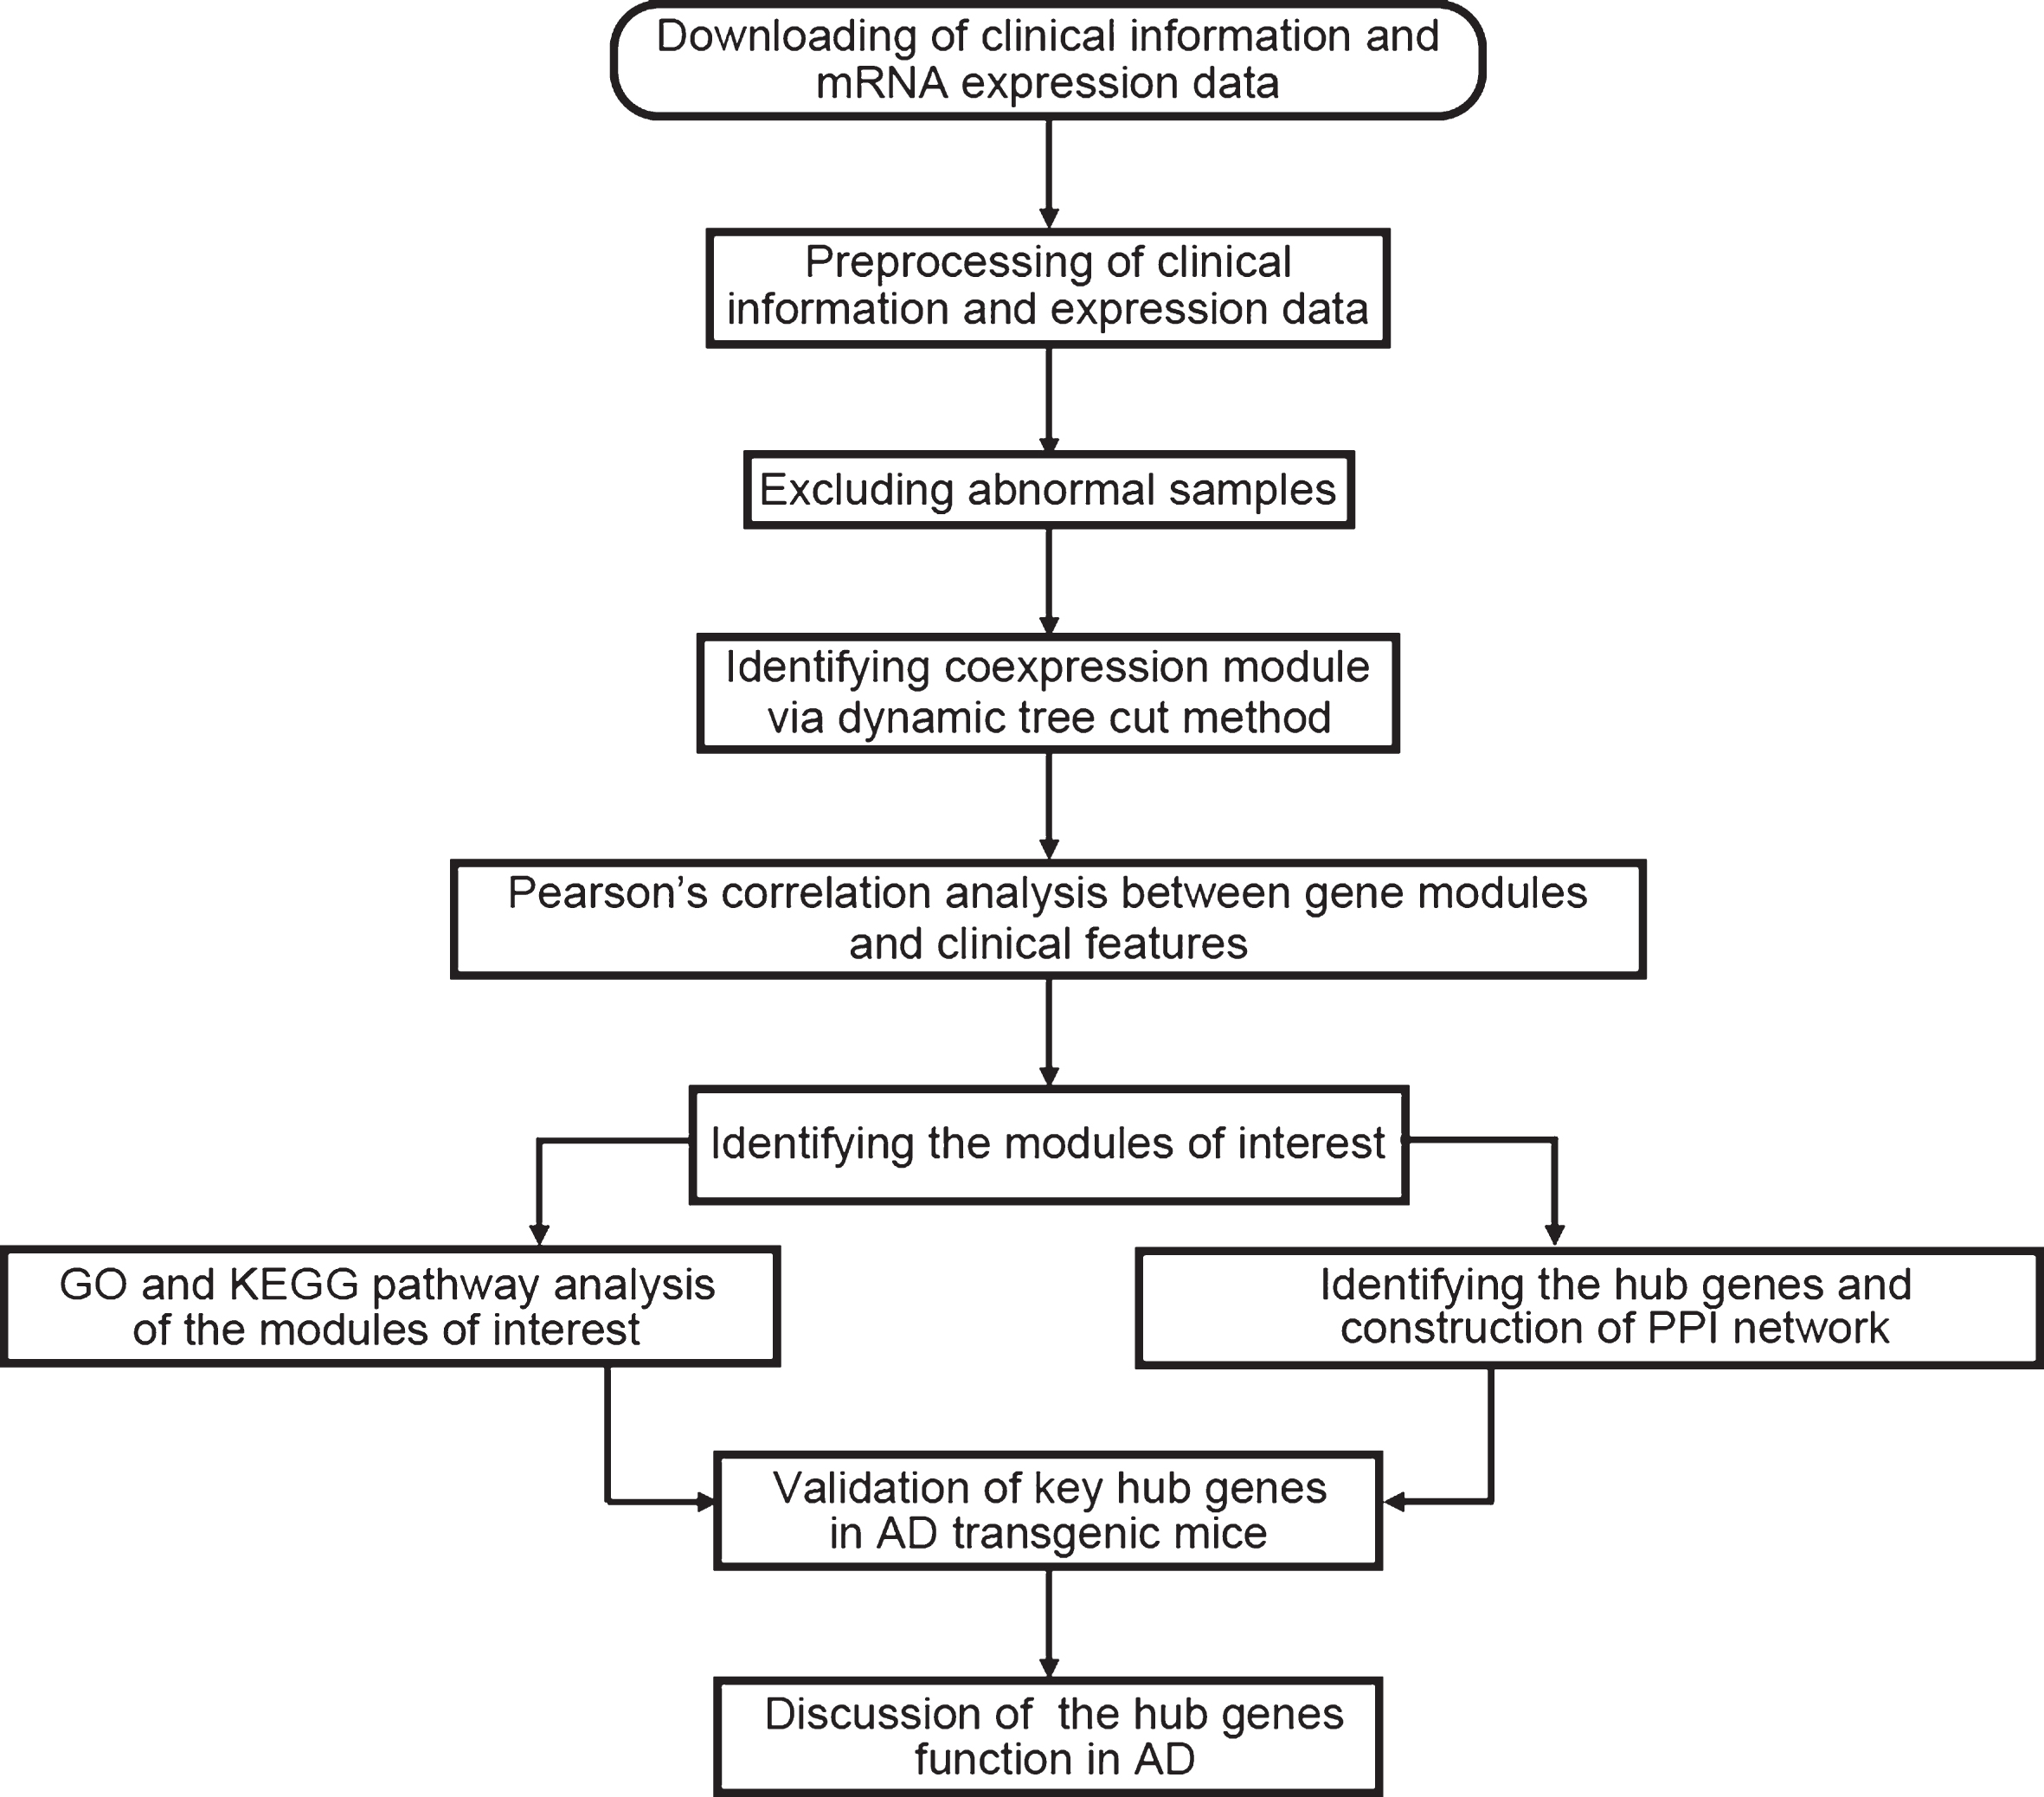
Data analysis procedures were illustrated in Fig. 1. The normalized data was downloaded [3] and the expression matrix was obtained, and data filtering was performed. The filtering criteria were as follows: the median expression was less than 1/5 of the average expression, and at least one expression is greater than 30,000. After the first filtering, the standard deviation of the remaining gene expression was calculated to obtain a list with decreasing standard deviations, the first 5,000 genes with large standard deviations were obtained, and the probe without corresponding annotation information were removed. There were 22,284 genes in the dataset; after the data preprocessing, we kept 4,880 genes for further analysis.
Fig.1
Flow chart of data preparation, analysis, and discussion in this study.
Construction of weighted gene co-expression network and identification of significant modules
Data was processed using R-Studio 3.4.0 software. To ensure that the results of network construction are reliable, abnormal samples were removed. The Pearson correlation coefficient was calculated to assess the similarity of the gene expression profiles, and then the correlation coefficients between genes were weighted by a power function to obtain a scale-free network. A gene module is a cluster of densely interconnected genes in terms of co-expression. WGCNA uses hierarchical clustering to identify gene modules and color to indicate modules. Dynamic tree cut method was used to identify different modules, during module selection, the adjacency matrix (a measure of topology similarity) was converted to a topology overlay matrix (TOM) and modules were detected by cluster analysis.
Correlation analysis of gene modules with clinical phenotype
The clinical data of GSE1297 included the severity of the disease, NFT value, Braak stage, Mini-Mental State Examination (MMSE) score, sex, age, and postmortem interval (PMI) values. To detect associations of modules to phenotype, first, the clinical data and gene expression data were correlated using the match function. Secondly, the associations of the module eigengene (ME, the first principal component of the module and represents the overall expression level of the module) to the clinical phenotype were calculated by Pearson’s correlation analysis. Modules showing significant association to phenotype were obtained. At last, to further confirm the modules with significant correlation to phenotype, the correlation coefficient between the module membership (gene expression level) with gene significance (GS, for assessing the association of genes with phenotypes) was calculated using the labeleHeatmap function, and the p values were obtained.
GO and pathway enrichment analyses, identification of Hub genes and protein-protein interaction (PPI) analysis
Functional enrichment of Gene Ontology (GO) and KEGG pathways analyses were performed using GSAT (http://www.webgestalt.org/option.php). p-value < 0.05 was considered to be significant enrichment. The genes in one module were analyzed using cytoHubba in Cytoscape [4] for identification of hub genes. The identified hub genes were further confirmed and analyzed using genemania (http://genemania.org/) [5] to establish the network through PPI analysis.
Total RNA isolation and qRT-PCR
Table 1
PCR primers for quantitative real-time PCR
| Gene | Primer sequence (5’→*3’) | |
| ADD3 | F: TCGACCATGCAGTTTGACGA | R:CACTCTGCGGTGACTGAGTT |
| MT1 | F:CTCCTGCAAGAAGAGCTGCT | R:CACAGCACGTGCACTTGTC |
| MT2 | F:CTCCGATGGATCCTGCTCCT | R:GGATGTAACCTGCCCAAGCT |
| NOTCH2 | F:CTCCGATGCCACATCCTCTC | R:GGATGTAACCTGCCCAAGCT |
| RAB31 | F:CGGGAGCTCAAAGTGTGTCT | R:CTGCAGCAGATCCTCGGTAG |
| EHD1 | F:GTCCTTGAGTGGTTCGCAGA | R:TAGACTCTGACCACCTCGGG |
| VCAN | F:GTTCCACATCACTGCTCCCA | R:TAGACCTCCTCCACACTGGG |
| MSX1 | F:AGTTCCGCCAGAAGCAGTAC | R:GGACCGCCAAGAGGAAAAGA |
| HEY2 | F:AGCTGCTTTCCACCATCTCC | R:ACAGTGGCCGAAAGAGACAG |
| EHD3 | F:TCCAGCCACTGAAGAGCAAG | R:ATACATAGGCTTGTCCCGCG |
Table 2
Module and the number of genes in each module
| Black 217 | Blue 936 | Brown 426 | Cyan 150 | Green 255 | Greenyellow 87 | Gray 137 |
| Grey60 32 | Lightcyan 39 | Lightgreen 35 | Magenta 140 | Turquoise1626 | Midnightblue 149 | Yellow281 |
| Purple 109 | Red 230 | Pink 199 | Salmon 50 | Tan 54 |
APP/PS1 transgenic mice and age-matched wild type C57Bl/6 mice were from Jackson Lab. Mice were housed individually under standard conditions of temperature and humidity, and a 12 h light/dark cycle (lights on at 08:00), with free access to food and water before use. Adequate measures were taken to minimize pain or discomfort during surgeries. All animal experiments were approved by the Animal Care and Use Committee of Huazhong University of Science and Technology, and performed in compliance with the National Institutes of Health Guide for the Care and Use of Laboratory Animals.
For RNA isolation, mice at 6 months or 14 months were deeply anesthetized and sacrificed. The brain was quickly removed on ice and hippocampal tissue was homogenized in Trizol reagents. Total RNA was isolated according to the manufacturer’s instructions (Invitrogen, Carlsbad, CA, USA) and reverse transcribed to produce cDNA using TaqMan reverse transcription reagents kit. Quantitative real-time polymerase chain reaction (qRT-PCR) was performed using the SYBR Premix Ex TaqTM (TaKaRa, Japan) in a Step One Plus real-time PCR system (Applied Biosystems, USA). Gene expression was quantified according to the 2–ΔΔCt method. Primer sets for selected genes were designed by TSING KE biological technology (Wuhan, China) and their sequences are available in Table 1.
RESULTS
Data filtering and preprocessing
In the GEO database GSE1297, 22,284 genes were detected. These genes were screened according to the screening criteria described in Method, and 4,880 genes were obtained. Then the 31 groups of samples were read by R software, clustered, and one outlier sample (GSM21207) with significantly high average expression level was removed (Supplementary Fig. 1A). Finally, 30 sets of data were obtained and matched to clinical data (Supplementary Fig. 1B).
Gene co-expression network construction and module identification
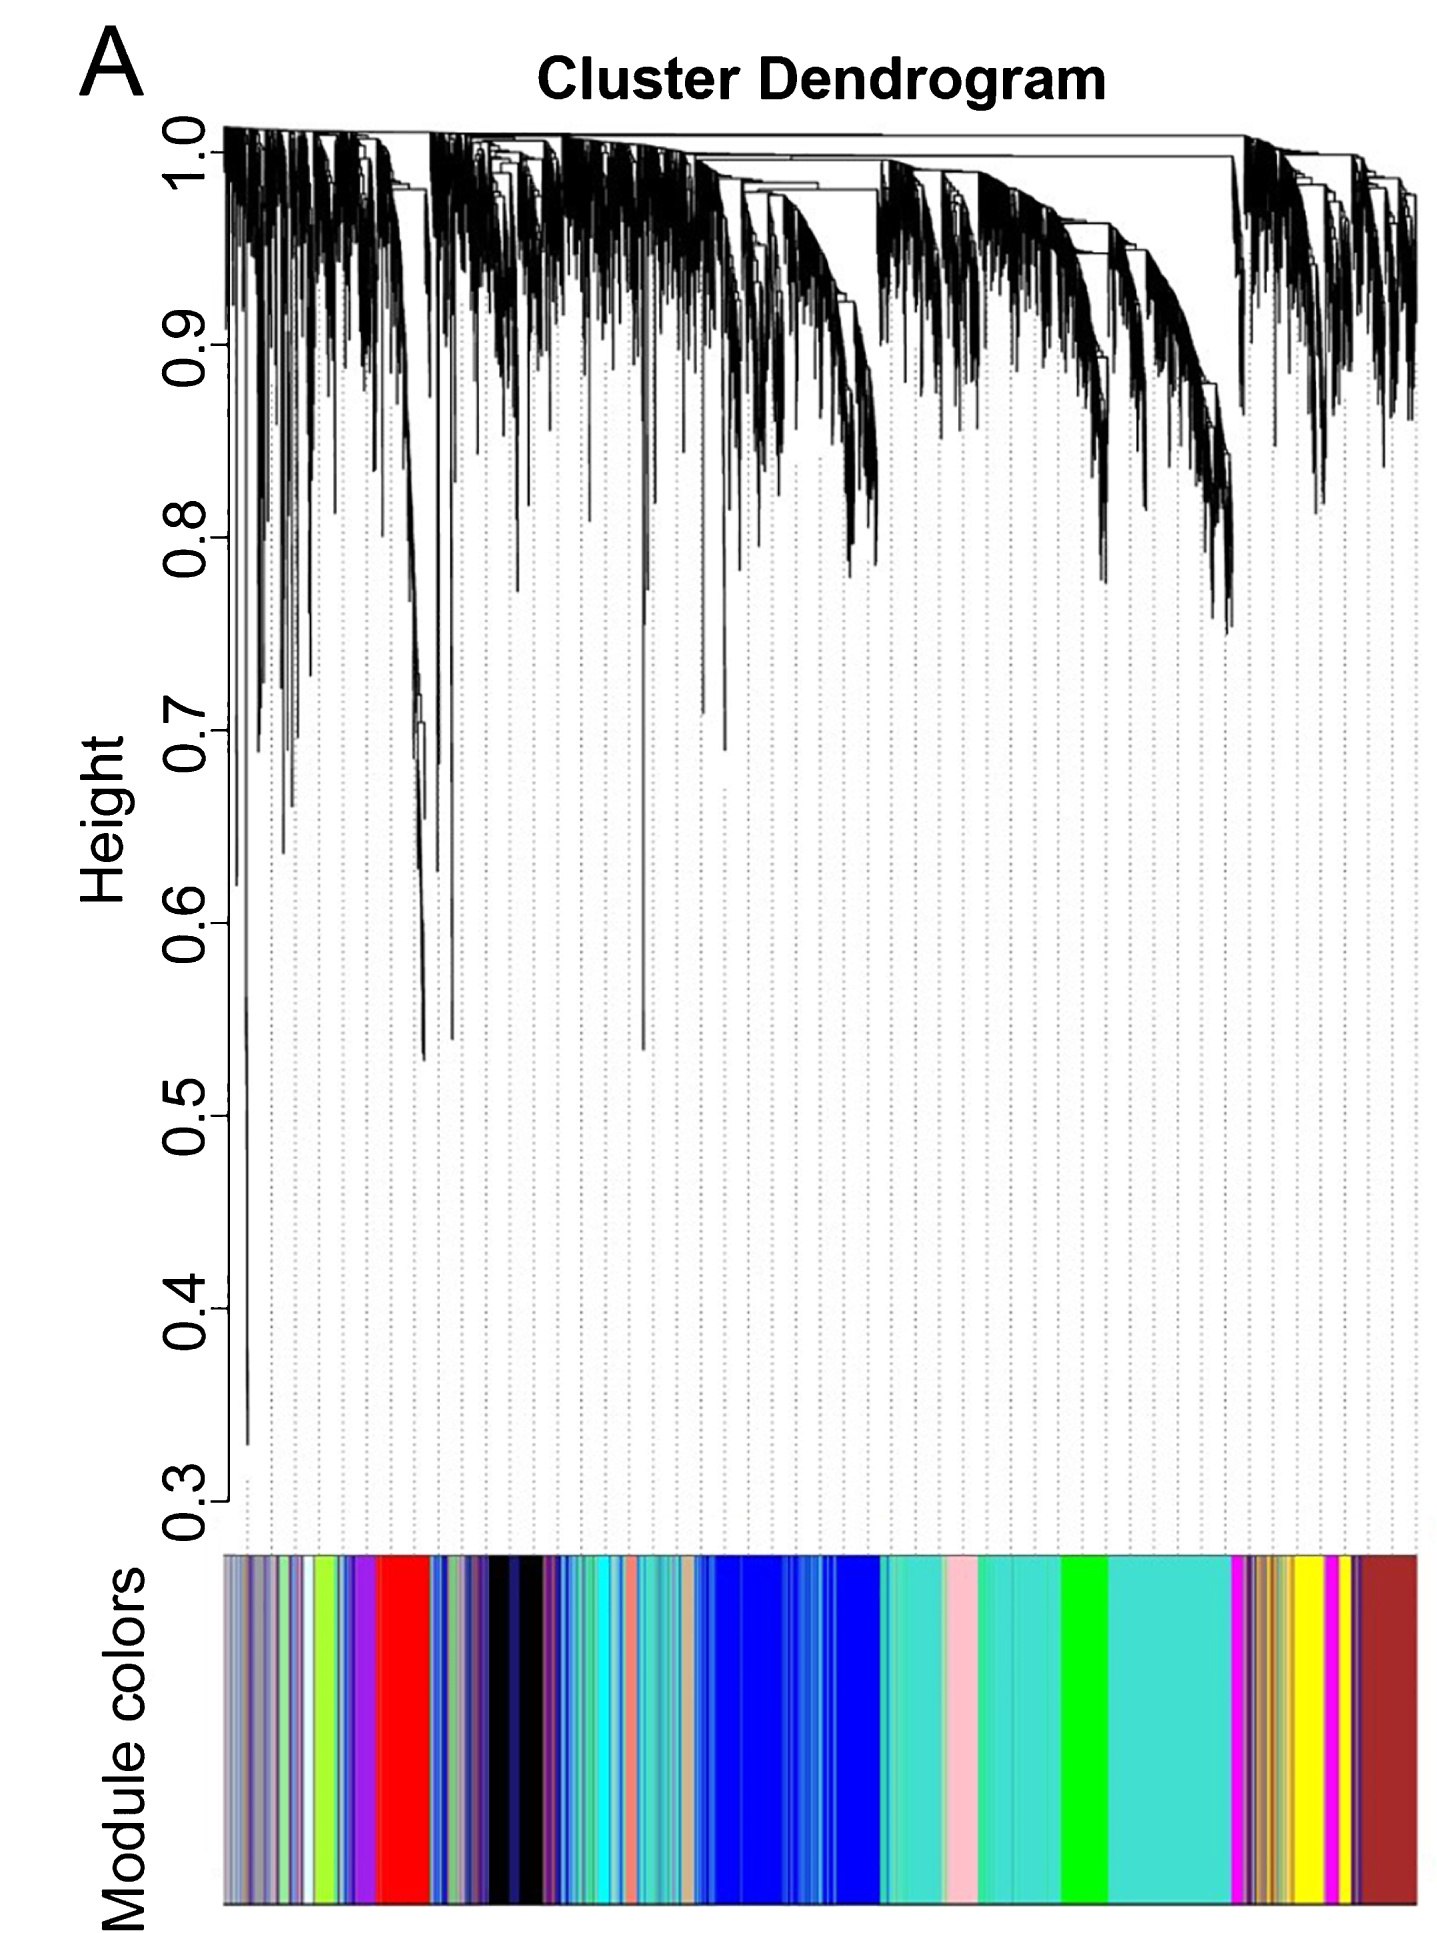
WGCNA was performed to identify gene co-expression networks associated with AD clinical pathological factors. The scale independence and mean connectivity analysis showed that when the weighted value equals to 6, the average degree of connectivity was close to 0, and scale independence was greater than 0.8, so the weighted value was set to 6. Through the calculation of the correlation coefficient between genes, the genes were classified according to the expression pattern theoretically, and the patterned genes are classified into one module. Nineteen co-expressed modules, ranged in size from 32 to 1,626 genes (assigning each module a color for reference), were identified (Table 2, Fig. 2).
Fig.2
Network analysis of gene expression in AD identifies distinct modules of co-expression data.
Finding module of interest and functional annotation
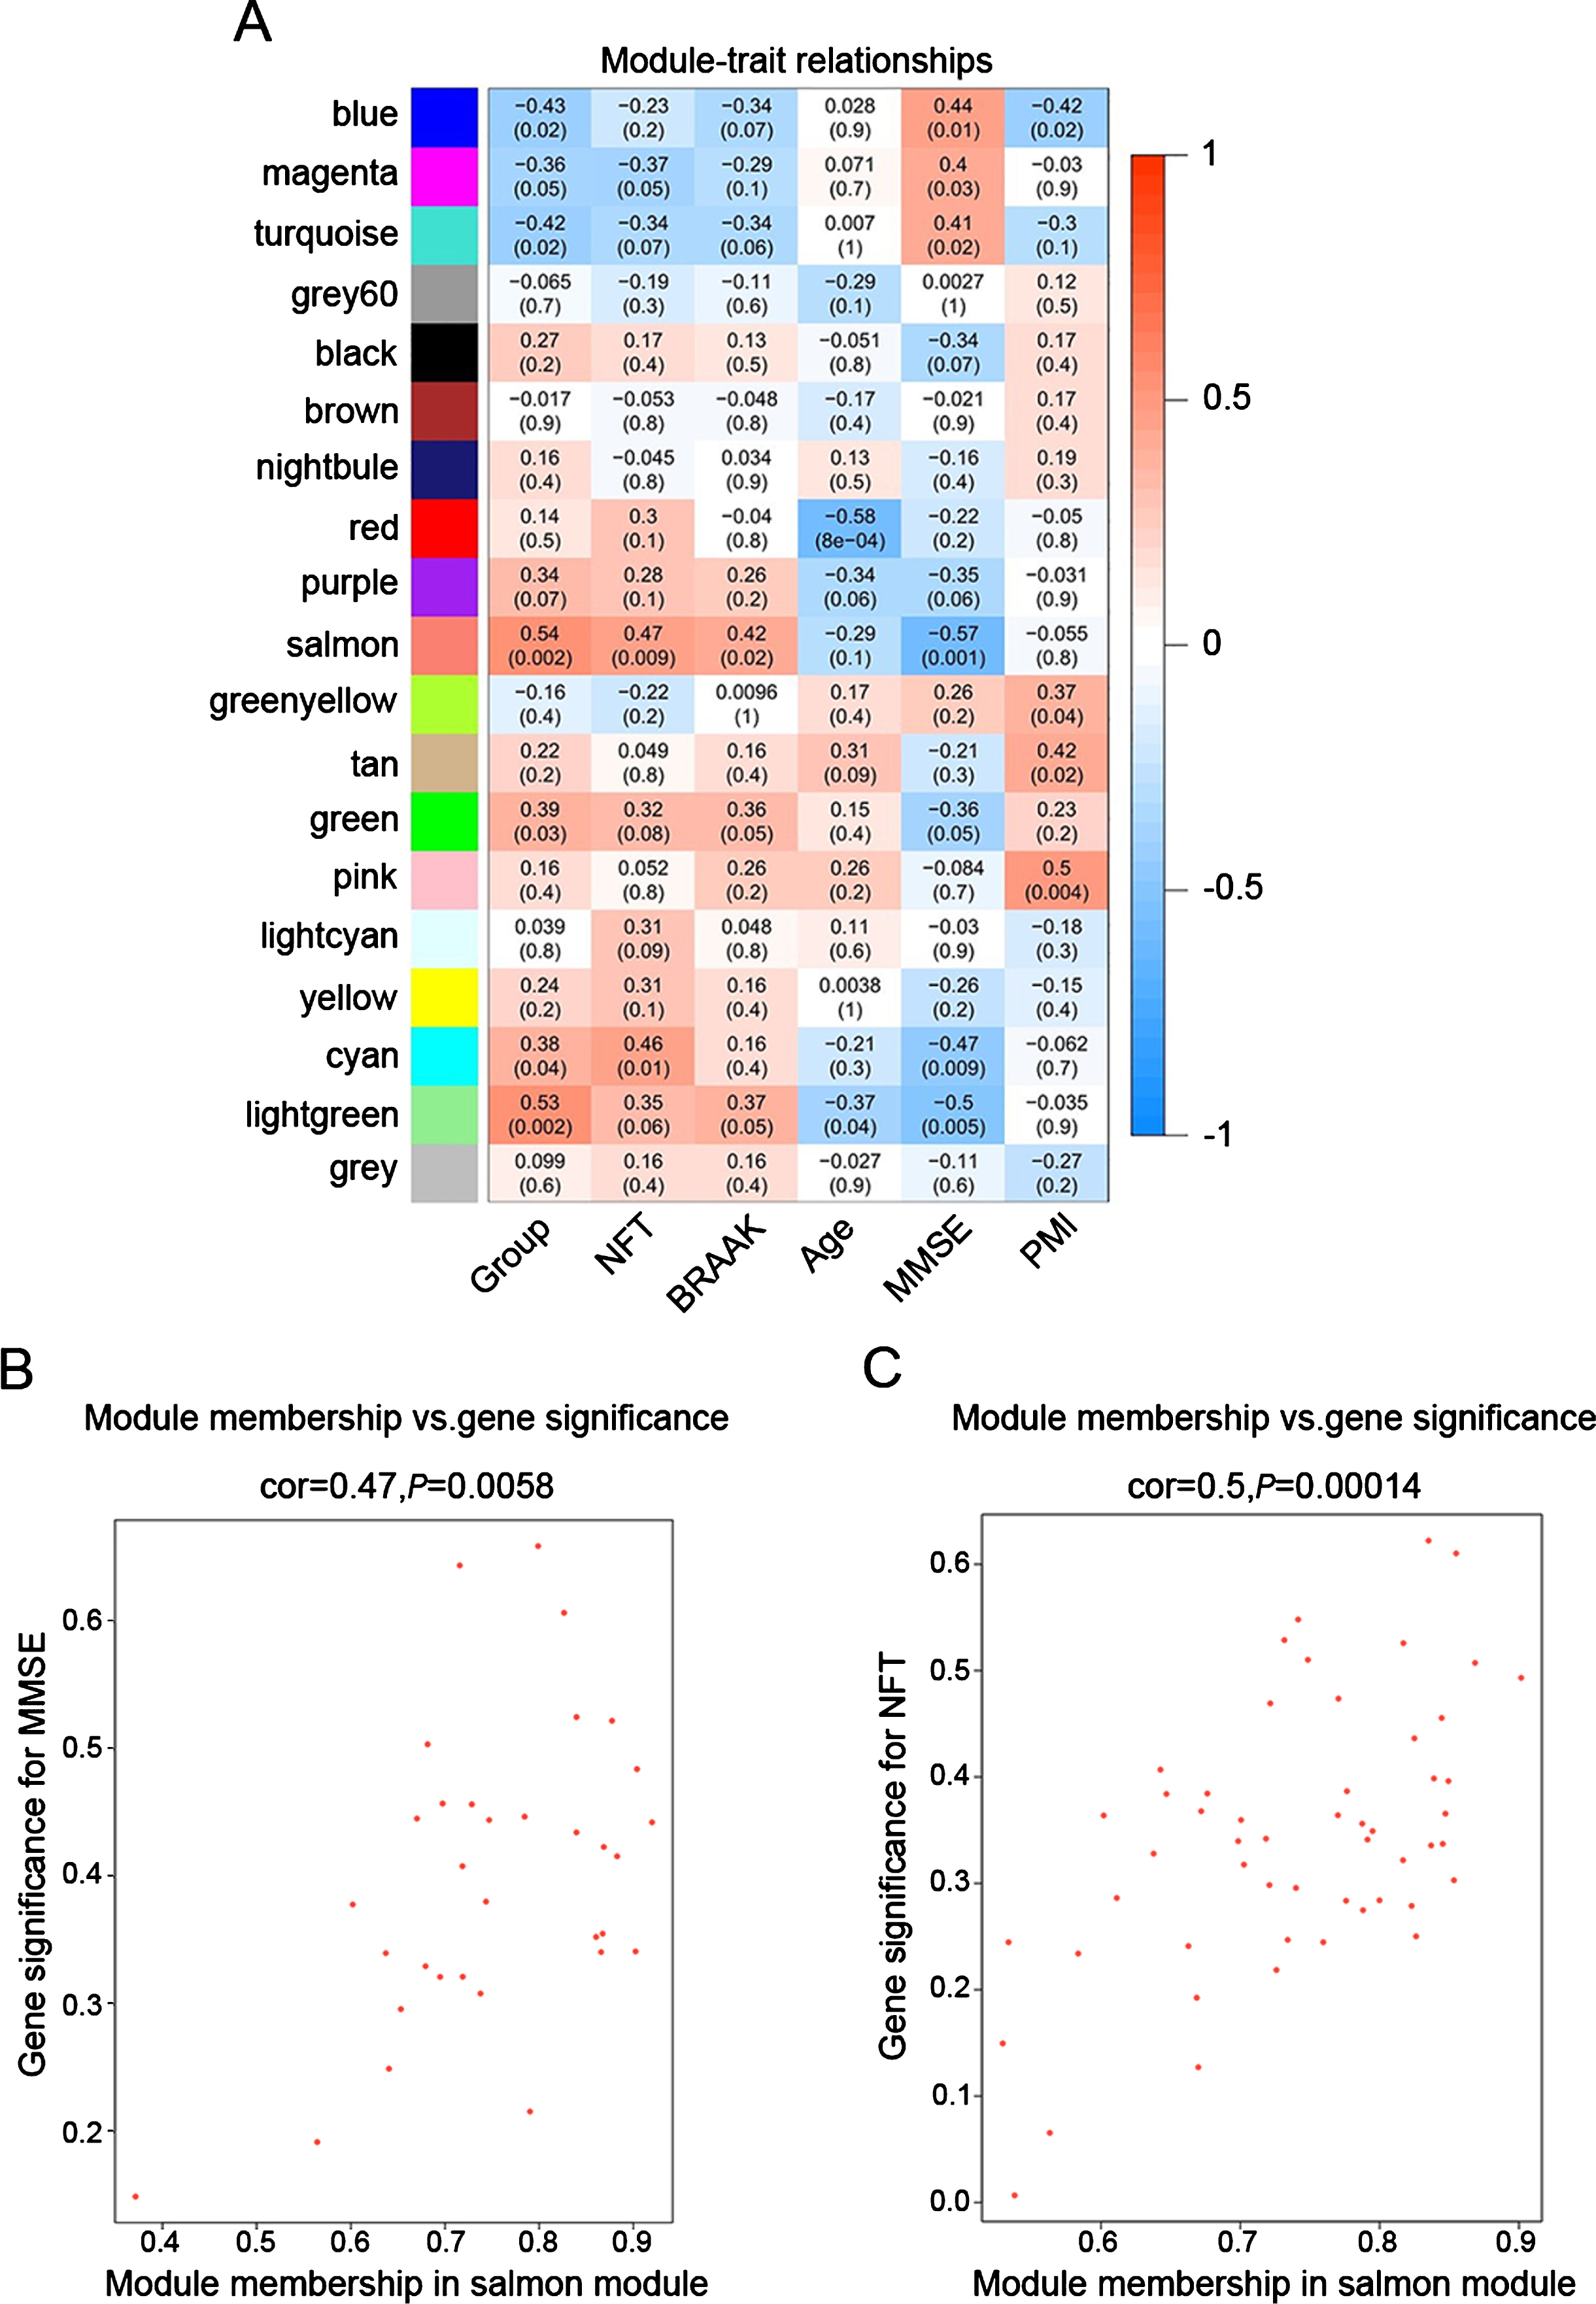
To identify modules most significantly associated with clinical features, the Pearson’s correlation coefficient between the module and each phenotype was calculated. The highest association in the module-trait relationship was found between salmon module and clinical features such as MMSE score (r = –0.57, p = 0.001), group (r = 0.54, p = 0.002) and NFT value (r = 0.47, p = 0.009; Fig. 3A). The second-highest association in the module-phenotype relationship was found between lightgreen module and clinical features such as group (r = 0.53, p = 0.002) and MMSE (r = –0.5, p = 0.005; Fig. 3A). Thus, salmon and lightgreen modules were selected as module of interest in subsequent analyses. To confirm the correlation between module of interest and clinical features, labeleHeatmap function was used to calculate the correlation values of module membership with gene significance (MMSE and NFT) in the salmon module. The results showed significant correlation of module membership with gene significance in MMSE (cor = 0.47, p = 0.0058) and NFT (cor = 0.5, p = 0.00014) in salmon module (Fig. 3).
Fig.3
Target modules screening and analysis. A) Pearson correlation coefficient between the module eigengene and sample feature vector, numbers in brackets indicate the corresponding p values. B, C) Correlation between module membership (MM) and gene significance (GS) for MMSE (B) and NFT (C) of all genes in salmon module. Cor represents absolute correlation coefficient between GS and MM.
Next, genes in salmon module and lightgreen module were subjected to GO functional and KEGG pathway enrichment analyses. Biological processes of both modules were found to focus on protein binding and ion binding (Fig. 4); In KEGG pathway analysis, cGMP-PKG signaling pathway was the most significant pathway in salmon module (p = 0.010725; Table 3); mineral absorption (p = 1.23×10⁻¹⁴) and NF-κB signaling pathway (p = 0.033744; Table 4) were found to be the significant pathways in lightgreen module.
Fig.4
GO functional analysis. GO enrichment analysis of salmon module (A) and lightgreen module (B). Y-axis shows the number of genes and x-axis shows the terms of GO pathway.
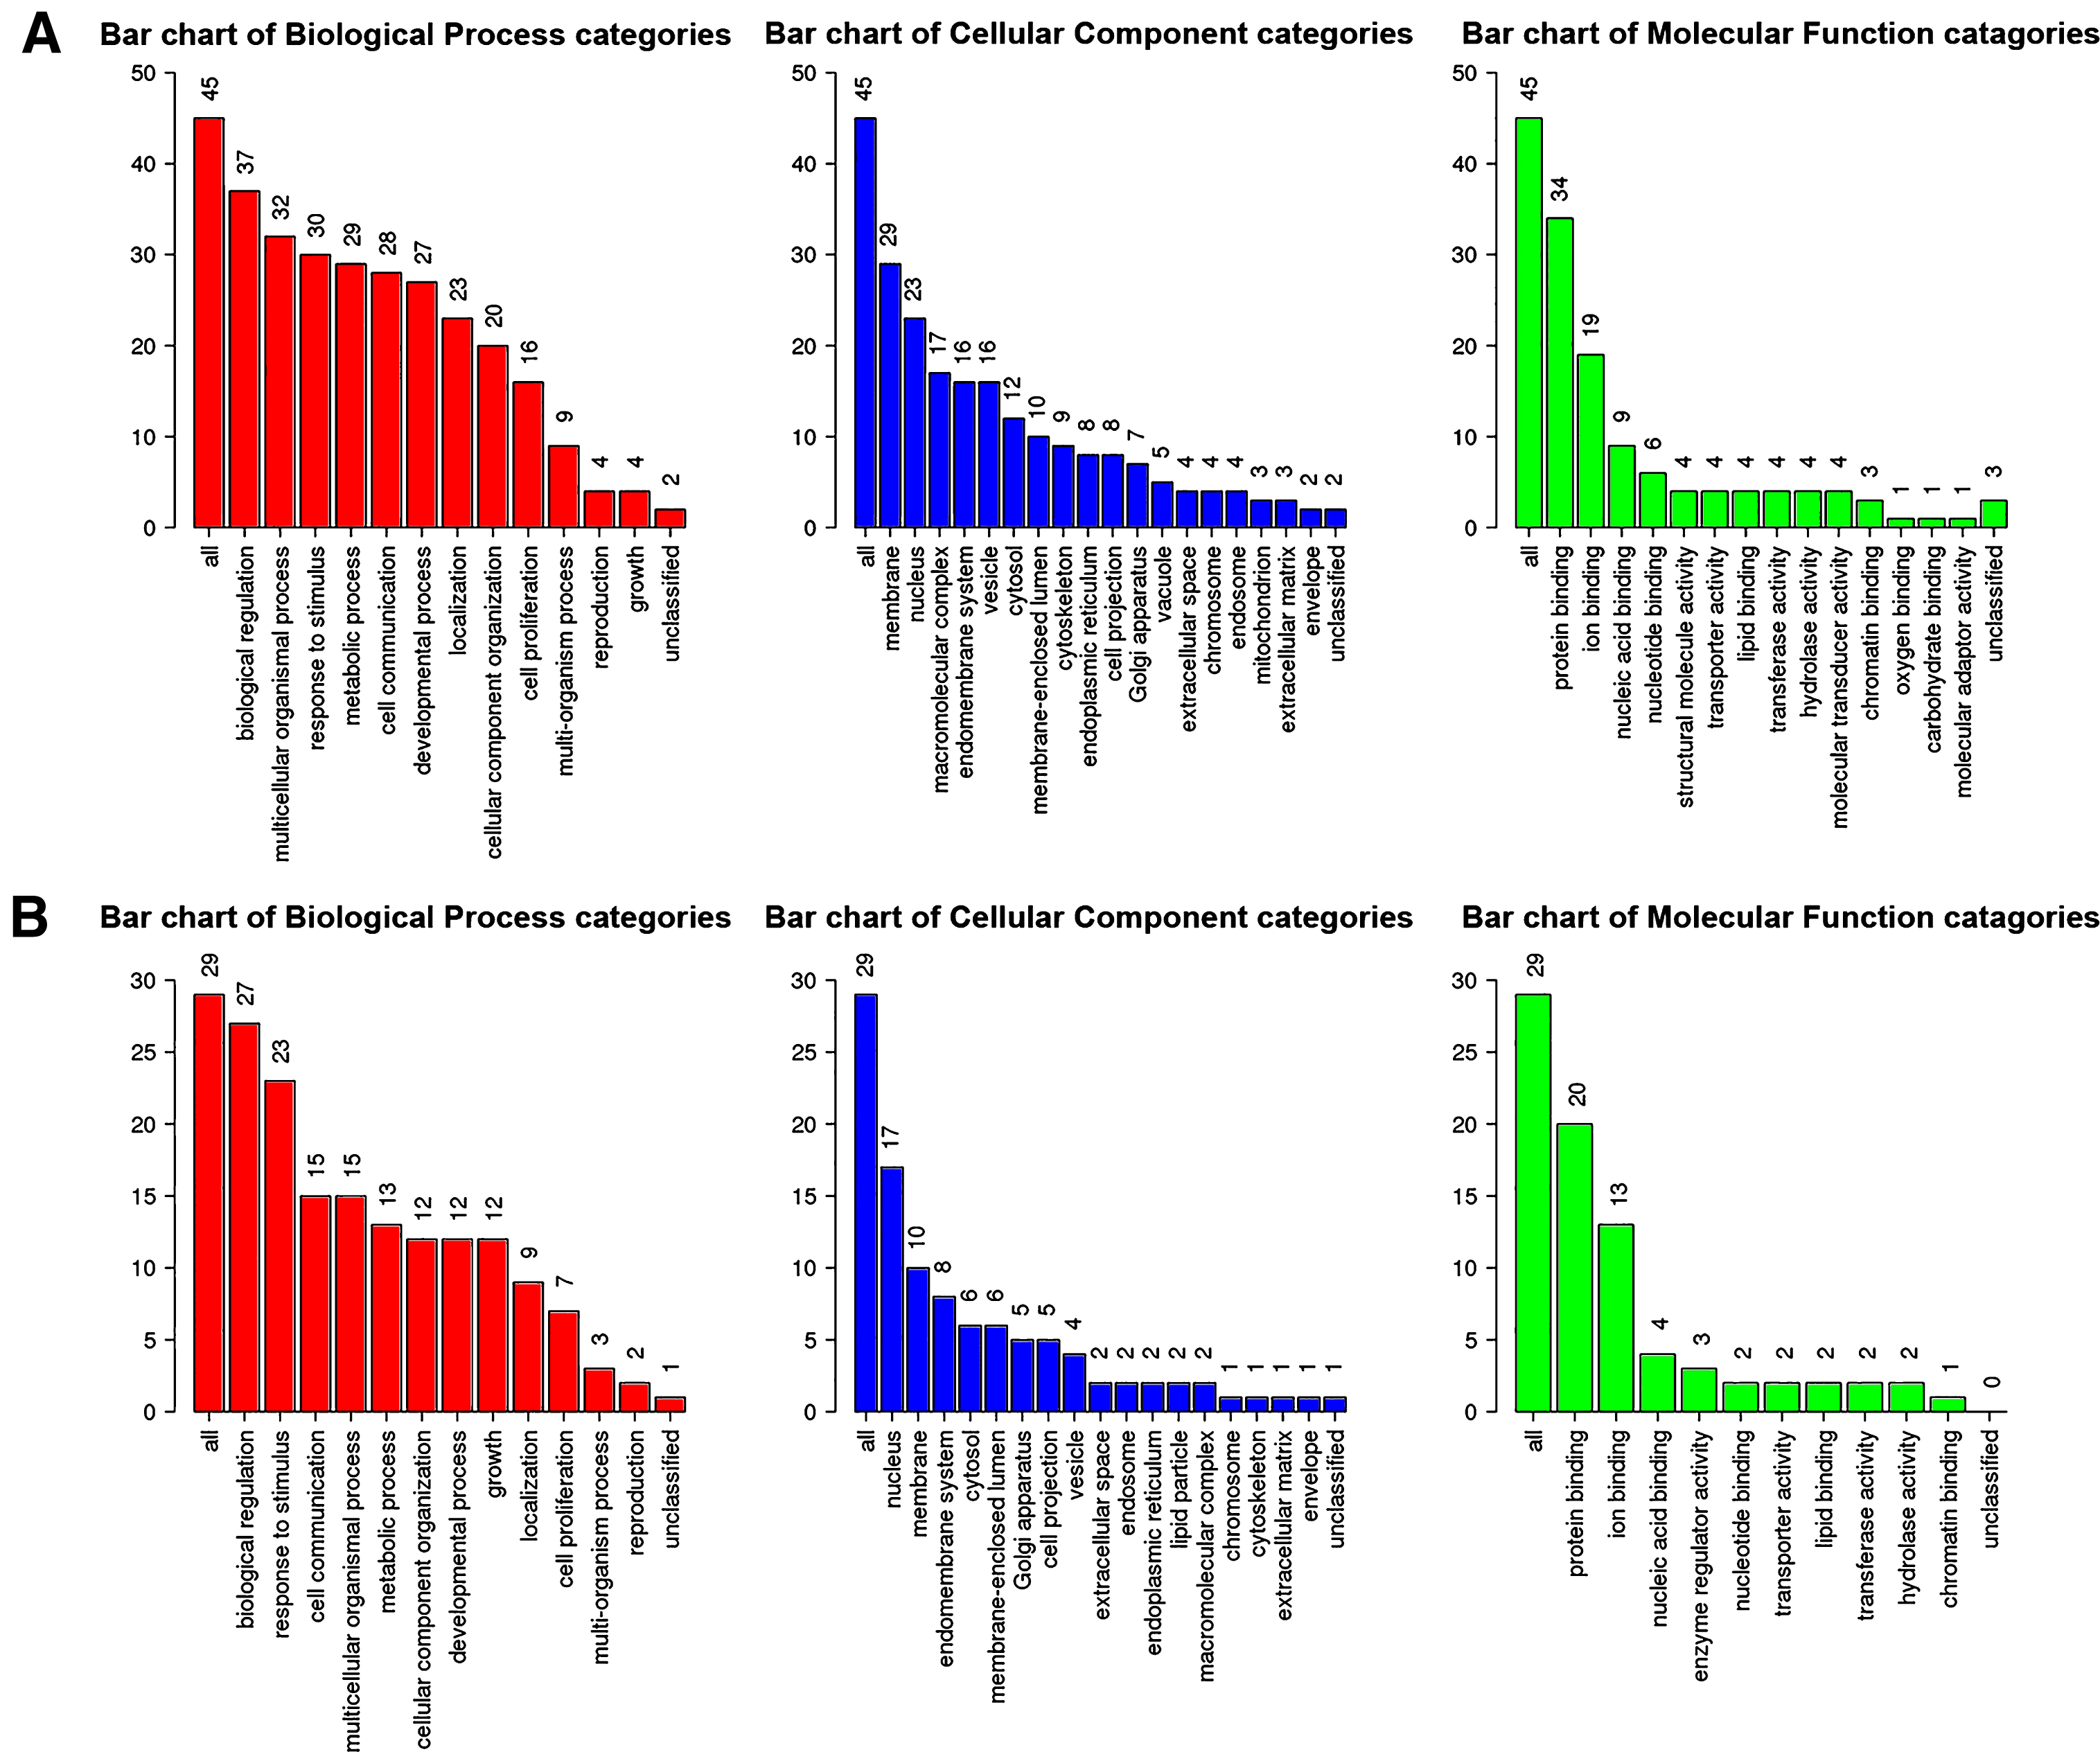
Table 3
KEGG pathway analysis of salmon module
| geneset | description | C | O | P Value |
| hsa04022 | cGMP-PKG signaling pathway - Homo sapiens (human) | 168 | 3 | 0.010725 |
| hsa05412 | Arrhythmogenic right ventricular cardiomyopathy (ARVC) - Homo sapiens (human) | 74 | 2 | 0.017684 |
| hsa04540 | Gap junction - Homo sapiens (human) | 88 | 2 | 0.024487 |
| hsa04970 | Salivary secretion - Homo sapiens (human) | 90 | 2 | 0 025534 |
| hsa04974 | Protein digestion and absorption - Homo sapiens (human) | 90 | 2 | 0.025534 |
| hsa04713 | Circadian entrainment - Homo sapiens (human) | 96 | 2 | 0.028785 |
| hsa04010 | MARK signaling pathway - Homo sapiens (human) | 255 | 3 | 0.03234 |
| hsa04725 | Cholinergic synapse - Homo sapiens (human) | 111 | 2 | 0.037592 |
| hsa04724 | Glutamatergic synapse - Homo sapiens (human) | 114 | 2 | 0.039465 |
| hsa04919 | Thyroid hormone signaling pathway - Homo sapiens (human) | 118 | 2 | 0.042017 |
Table 4
KEGG pathway analysis of lightgreen module
| geneset | description | C | O | P Value |
| hsa04978 | Mineral absorption - Homo sapiens (human) | 52 | 9 | 1.23E-14 |
| hsa04064 | NF-kappa B signaling pathway - Homo sapiens (human) | 95 | 2 | 0.033744 |
| hsa00565 | Ether lipid metabolism - Homo sapiens (human) | 45 | 1 | 0.12943879 |
| hsa05030 | Cocaine addiction - Homo sapiens (human) | 49 | 1 | 0.14013605 |
| hsa04720 | Long-term potentiation - Homo sapiens (human) | 67 | 1 | 0.18674032 |
| hsa05031 | Amphetamine addiction - Homo sapiens (human) | 68 | 1 | 0.18925744 |
Identifying hub genes and network analysis
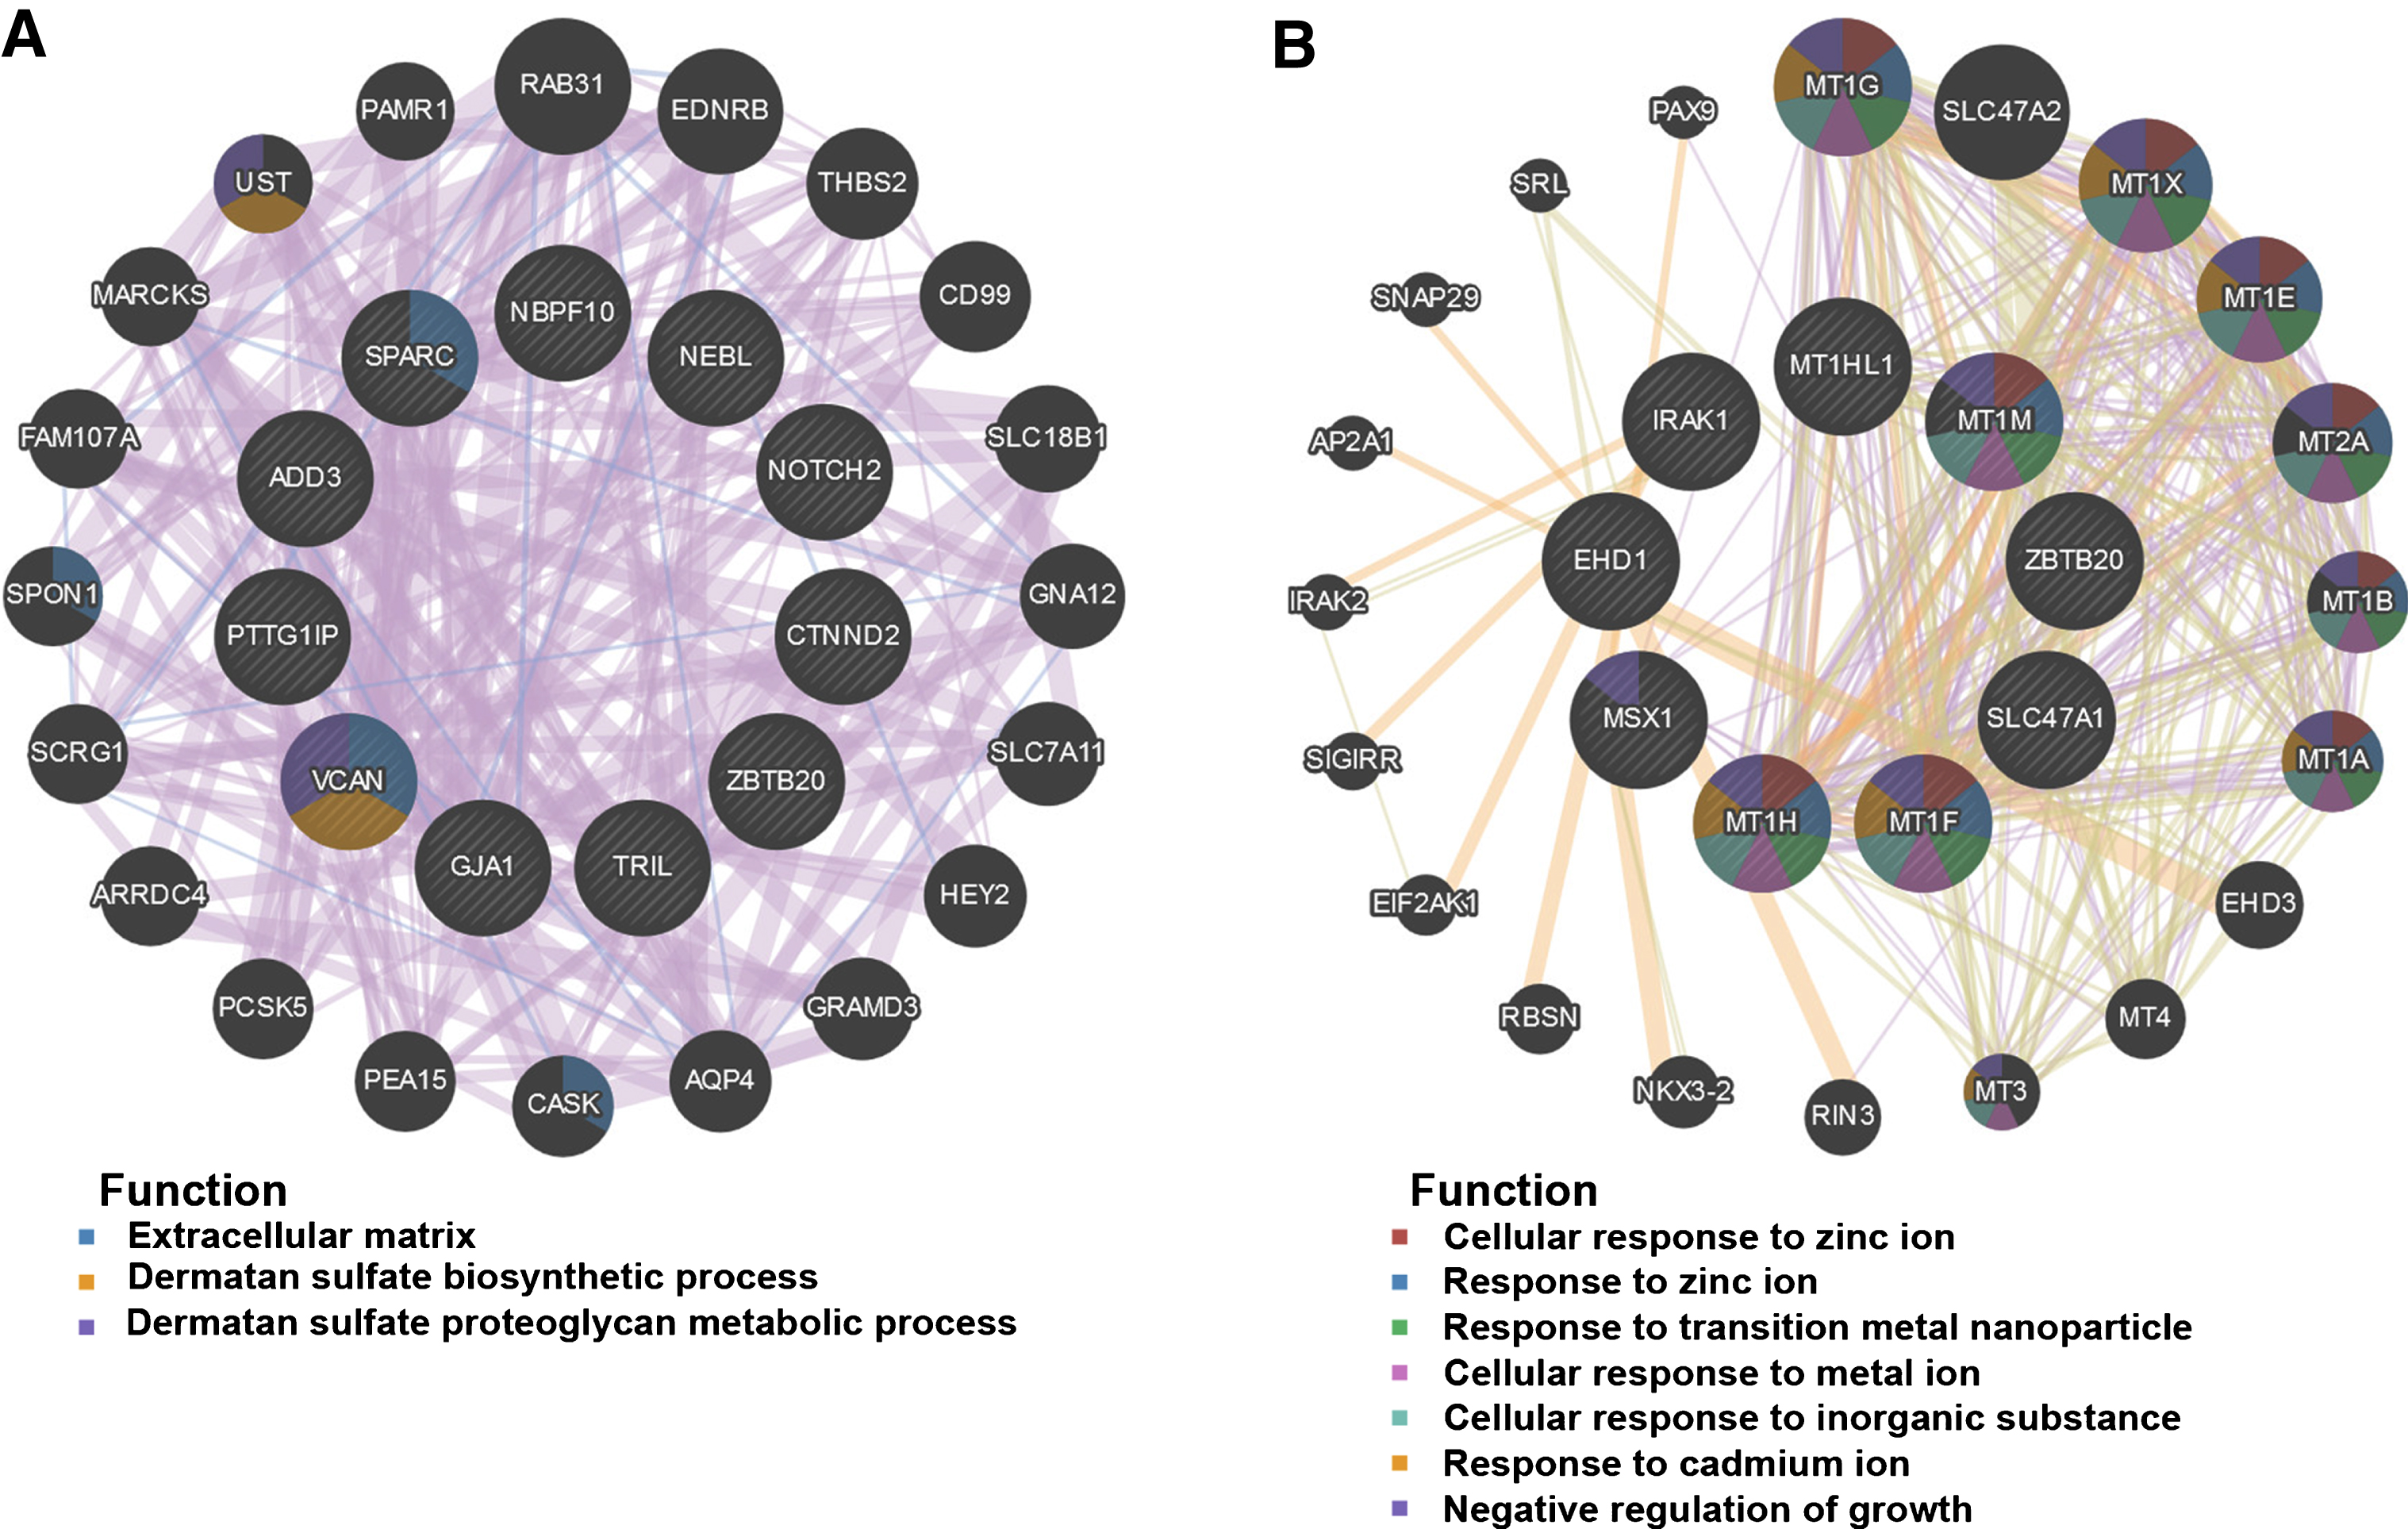
Fifty genes were clustered in the salmon module; thirty-five genes were clustered in the lightgreen module. CytoHubba in Cytoscape was used to identify hub genes in the two modules. The identified hub genes were further confirmed and analyzed by using genemania. To ascertain the significance of genes and analyze the network in the corresponding modules, the PPI maps were constructed (Fig. 5). Network of genes in salmon module was comprised of 31 hub genes, including the top 10 hub genes, NBPF10, ADD3, NOTCH2, SPARC, NEBL, ZBTB20, GJA1, TRIL, CTNND2, and PTTG1IP, with the interacted genes of 2, 17, 8, 15, 5, 4, 20, 20, 7, and 14, respectively (Fig. 5A); Network of genes in lightgreen module was comprised of 29 hub genes, including the top 10 hub genes, SLC47A1, MT1G, MT1X, MT1E, MT2A, MT1B, MT1A, MT1H, MSX1, and EHD1, with the interacted genes of 2, 12, 12, 12, 14, 11, 11, 12, 9, and 6, respectively (Fig. 5B).
Fig.5
PPI network construction. The PPI network of salmon (A) and lightgreen module (B). Different colors in each node represent different functions as indicated. Function of genes in dark node was not revealed through the analysis.
Validation of the hub genes in AD transgenic mice
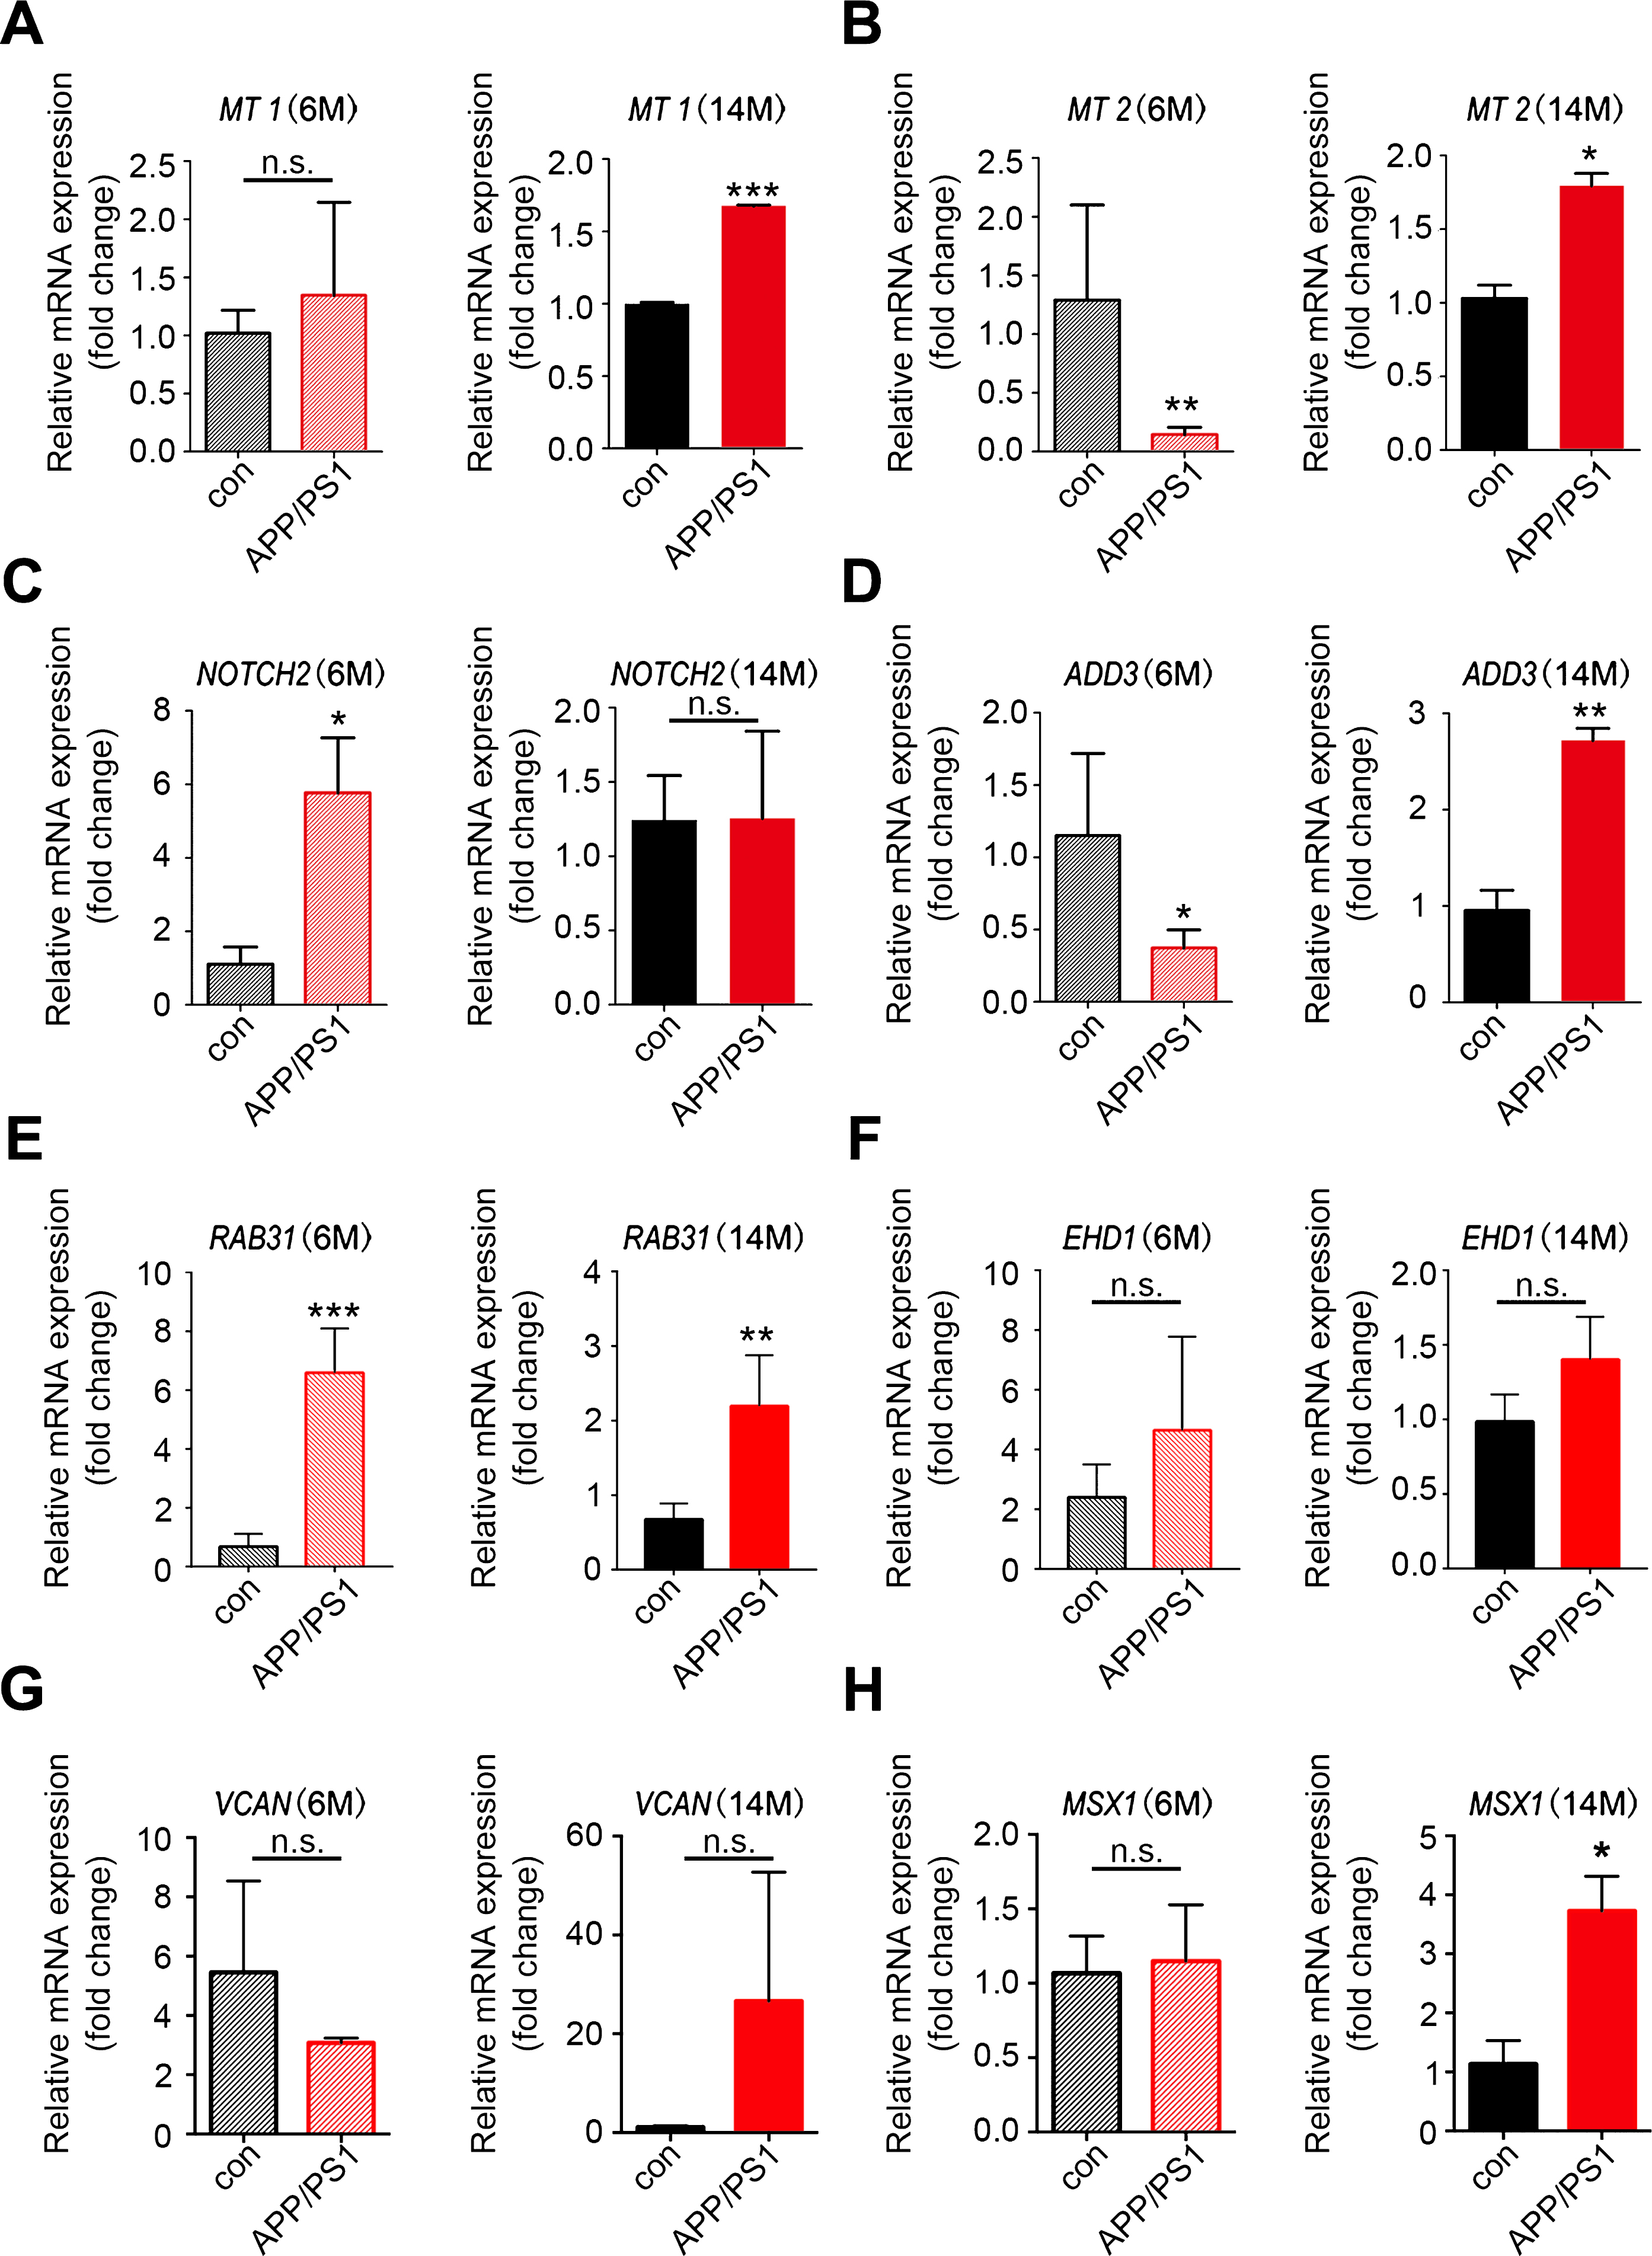
To obtain further evidence for the significance of the key genes in the module of interest, we measured the expression of the top hub genes in AD transgenic mouse hippocampus through qRT-PCR. The results showed that in aged 14–month-old APP/PS-1 transgenic mice, expression levels of MT1, MT2, ADD3, RAB31, and MSX1 were increased; upregulation of NOTCH2 was observed in 6-month-old transgenic mice; VCAN and EHD1 showed a trend of increase in expression in14–month-old AD mice (Fig. 6). HEY2 and EHD3, on the contrary, showed no change in expression level in AD mice (Supplementary Figure 2). Overall, most of the qRT-PCR results in AD transgenic mice were consistent with the results of the microarray analysis.
Fig.6
Validation of the key genes in AD transgenic mice. Total RNAs were isolated from hippocampal tissues of APP/PS-1 transgenic mice and wild type control mice for qRT-PCR analysis of the expression of key genes identified in WGCNA. A-H) Expression of MT1, MT2, NOTCH2, ADD3, RAB31, EHD1, VCAN, and MSX1 in 6-month-old and 14-month-old mice; n = 3 per group. *p < 0.05, **p < 0.01, ***p < 0.001 versus Con. Data are mean±SEM.
DISCUSSION
In this study, we used the weighted network analysis to analyze the whole genome expression data obtained from the hippocampus of AD patients. We choose dataset GSE1297 for analysis for the complete information of gene expression data and detailed clinical data in this database. In addition, GSE1297 includes samples from AD patients of varying severity including incipient, moderate and severe cases; such type of data from multiple group samples based on the disease severity is a good candidate for WGCNA analysis.
Through gene co-expression network construction, we identified 19 co-expressed modules. Genes in each module showed highly-related expression, indicating potential interaction or consistent effects of these gene-coded proteins in same pathways during the disease development. Through calculating the Pearson’s correlation coefficient between the module and most disease-related clinical features such as MMSE score and NFT value, we obtained two modules (salmon and lightgreen) of interest. Further GO functional and KEGG pathway enrichment analyses indicated that mineral absorption, NF-κB signaling pathway and cGMP-PKG signaling pathway as the most significant pathways in the two modules. In addition, we obtained hub genes which exhibited high gene significance and high intramodular connectivity in the module of interest. Through further confirmation in AD transgenic mice, NOTCH2, ADD3, metallothionein (MT) family, RAB31, and MSX1 were identified to be the key genes related to AD NFT severity and MMSE scores.
Analysis of hub genes showed that MT family might play an important role in AD pathogenesis. This was in accordance with the pathway enrichment analyses in which mineral absorption was a significant pathway. MT family members such as MT1, MT2, and MT3 were suspected relating to AD disease development for long time. Numerous studies reported increased MT1 and MT2 expression especially in the reactive astrocyte and microglia surrounding the plaques, as well as the increased oxidative stress elicited by the amyloid [6–8]. In animal models, same changes were observed [8, 9]. Upregulation of MT-I and MT-II in reactive glias together with clear signs of inflammation and oxidative stress around the plaques indicated that MT-I and MT-II may be involved in the regulation of astrocytosis and microgliosis in neuroinflammation. The exact roles of these two MTs in regulating astrocytes and glias need further exploration. Data of MT3 expression in AD was controversial. Decreased or unaltered MT-III was reported in AD patients or animal models [10, 11], indicating big variations among different cases or in different disease stages. This may explain that the gene significance of MT3 was lower than that of MT1 and MT2 in network analysis. MSX1 is another identified key gene in the lightgreen module. Msx1 is a transcription factor that is involved in the brain development [12]. Function studies implicate the role of Msx1 in the proliferation and differentiation of oligodendrocytes or astrocytes in the hippocampus and fimbria [13–15]. Co-expression of MSX1 with MT1 and MT2 in the network indicates that Msx1 may be also a candidate protein in regulating astrocytosis in AD brain. Identified functions of these hub genes in lightgreen module are consistent with the KEGG pathway analysis result in which mineral absorption and NF-κB signaling pathway are the major pathways. Through the network analysis of lightgreen module, we suspect that astrogliosis is an important event in AD development, while the role of MT1, MT2, and MSX1 in this event is worthy of further exploration.
In our study, Notch2 was identified as another important regulator in AD. Notch pathway plays a key role in neurodevelopment. It is also expressed and active in the adult brain, with conserved and novel roles in regulating adult neural stem cells, as well as in the regulation of migration, morphology, synaptic plasticity, and survival of immature and mature neurons [16, 17]. In AD brains, Notch1 was found to interact with PS-1 and APP [17, 18], with 2-fold increased expression in hippocampus in comparison to that in control human hippocampus [17]. Notch2 was also showed to interact with APP [19]; however, its relationship with AD pathology remained largely unclarified. The precise role and mechanism of Notch2 in AD development needs further exploration. We suspect that the aberrant cell cycle re-entry of neurons in both early- and late-onset AD [20] may be the upstream event leading to Notch signal activation, the latter, further participates in neurodegeneration.
In the network analysis, ADD3, another key hub gene, was found to be in connection with Notch2. Normally, genes in the same connection have the similar function, or participate in the same event. Adducin (ADD) is membrane-associated cytoskeleton protein family with recognized function of regulating the spectrin-actin interaction in neurons and other type cells [21–23]. A connection of ADD3 with proliferation signal Notch may be explained by reassembly of cytoskeleton proteins during mitosis, even though neurons fail to complete the cell cycle and undergo degeneration instead. One notable fact is that impaired cytoskeleton assembly, synaptic plasticity, motor ability, and learning/memory were observed in ADD-deficient cells or animals [24–26]. Adducin also controls synaptic elaboration and elimination [27]. These data indicate that Adducin plays an important role in synapse stability and dynamics. Whether and how Adducin is involved in AD pathogenesis has not been investigated. The reported disease correlation of ADD3 is related to biliary atresia [28–30] and hypertension [31, 32]. Thus, ADD3 may be an interesting target in understanding the mechanism for synaptic degeneration and memory loss in AD patients.
At last, RAB31 was characterized to be a hub gene with NOTCH2 and ADD3 in the same module. Rab31 (also known as Rab22b) is a member of the Rab5 subfamily [33]. Rab31 localizes largely to the trans-Golgi network and functions in the endocytic or exocytic trafficking of the epidermal growth factor receptor (EGFR) and mannose 6-phosphate receptors in epithelial cells [34, 35]. Reported function of Rab31 in the brain is controversial. Rodriguez-Gabin et al. found expression of Rab31 in oligodendrocytes and its role in the transport of certain proteins from trans Golgi to myelin [36, 37]; while Ng et al. found that this protein to be exceptionally enriched in nestin and RC2-positive radial glia of the embryonic mouse brain, and to be specifically expressed in GFAP-positive mature astrocytes, but is not in oligodendrocytes or neurons in the adult brain [38]. Recent studies showed that Rab31 enhanced the differentiation of NPCs to astrocytes [39]. Function of Rab31 to promote cell proliferation and inhibit apoptosis in cancer cells was also reported [40]. Taken together, Rab31 more possibly participates in proliferation and differentiation of adult neural stem cells, thus exerts the familiar function as Notch2 in cell cycle re-entry of neurons. It also may participate in astrogliosis in AD pathogenesis.
In a summary, through weighted gene co-expression network analysis (WGCNA) on microarray data from human hippocampal tissues, we uncover MT1, MT2, NOTCH2, ADD3, MSX1, and RAB31 as key hub genes in AD. Through the similar network-based approach, Zhang et al. has identified 89 modules related to neuropathology traits and reported series of key regulators in AD brain using microarray data from three brain regions (prefrontal cortex, visual cortex and cerebellum) [41]. Some key genes in this study were the same as those illustrated in our analysis, such as MT1, AQP4, GJA1, and SLC gene family. Consistently, immune response, zinc homeostasis, and cell cycle events were shown to be functional categories enriched in AD. Further functional exploration on these identified genes and studies of AD brain transcriptome diversity at the single cell level are needed to promote the understanding of AD mechanisms.
ACKNOWLEDGMENTS
This work was supported by the National Natural Science Foundation of China (No: 81471304, 31771189), Natural Science Foundation of Hubei Province, China (No: 2017CFA065), and Integrated Innovative Team for Major Human Diseases Program of Tongji Medical College, HUST.
Authors’ disclosures available online (https://www.j-alz.com/manuscript-disclosures/18-0400r2).
SUPPLEMENTARY MATERIAL
[1] The supplementary material is available in the electronic version of this article: 10.3233/JAD-180400.
REFERENCES
[1] | Gouras GK , Tsai J , Naslund J , Vincent B , Edgar M , Checler F , Greenfield JP , Haroutunian V , Buxbaum JD , Xu H , Greengard P , Relkin NR , ((2000) ) Intraneuronal Abeta42 accumulation in human brain. Am J Pathol 156: , 15–20. |
[2] | Langfelder P , Horvath S , ((2008) ) WGCNA: An R package for weighted correlation network analysis. BMC Bioinformatics 9: , 559. |
[3] | Blalock E , Geddes J , Chen K , Porter N , Markesbery W , Landfield P , ((2004) ) Incipient Alzheimer’s disease: Microarray correlation analyses reveal major transcriptional and tumor suppressor responses. Proc Natl Acad Sci USA 101: , 2173–2178. |
[4] | Chin CH , Chen SH , Wu HH , Ho CW , Ko MT , Lin CY , ((2014) ) cytoHubba: Identifying hub objects and sub-networks from complex interactome. BMC Syst Biol 8: (Suppl 4), S11. |
[5] | Montojo J , Zuberi K , Rodriguez H , Bader GD , Morris Q , ((2014) ) GeneMANIA: Fast gene network construction and function prediction for Cytoscape. F1000Res 3: , 153. |
[6] | Zambenedetti P , Giordano R , Zatta P , ((1998) ) Metallothioneins are highly expressed in astrocytes and microcapillaries in Alzheimer’s disease. J Chem Neuroanat 15: , 21–26. |
[7] | Adlard PA , West AK , Vickers JC , ((1998) ) Increased density of metallothionein I/II-immunopositive cortical glial cells in the early stages of Alzheimer’s disease. Neurobiol Dis 5: , 349–356. |
[8] | Hidalgo J , Penkowa M , Espejo C , Martinez-Caceres EM , Carrasco J , Quintana A , Molinero A , Florit S , Giralt M , Ortega-Aznar A , ((2006) ) Expression of metallothionein-I, -II, and -III in Alzheimer disease and animal models of neuroinflammation. Exp Biol Med (Maywood) 231: , 1450–1458. |
[9] | Carrasco J , Adlard P , Cotman C , Quintana A , Penkowa M , Xu F , Van Nostrand WE , Hidalgo J , ((2006) ) Metallothionein-I and -III expression in animal models of Alzheimer disease. Neuroscience 143: , 911–922. |
[10] | Palmiter RD , Findley SD , Whitmore TE , Durnam DM , ((1992) ) MT-III, a brain-specific member of the metallothionein gene family. Proc Natl Acad Sci U S A 89: , 6333–6337. |
[11] | Yu WH , Lukiw WJ , Bergeron C , Niznik HB , Fraser PE , ((2001) ) Metallothionein III is reduced in Alzheimer’s disease. Brain Res 894: , 37–45. |
[12] | Bach A , Lallemand Y , Nicola MA , Ramos C , Mathis L , Maufras M , Robert B , ((2003) ) Msx1 is required for dorsal diencephalon patterning. Development 130: , 4025–4036. |
[13] | Ramos C , Martinez A , Robert B , Soriano E , ((2004) ) Msx1 expression in the adult mouse brain:, Characterization of populations of beta-galactosidase-positive cells in the hippocampus and fimbria. Neuroscience 127: , 893–900 |
[14] | Roybon L , Hjalt T , Christophersen NS , Li JY , Brundin P , ((2008) ) Effects on differentiation of embryonic ventral midbrain progenitors by Lmx1a, Msx1, Ngn2, and Pitx3. J Neurosci 28: , 3644–3656. |
[15] | Ramos C , Fernandez-Llebrez P , Bach A , Robert B , Soriano E , ((2004) ) Msx1 disruption leads to diencephalon defects and hydrocephalus. Dev Dyn 230: , 446–460. |
[16] | Ables JL , Breunig JJ , Eisch AJ , Rakic P , ((2011) ) Not(ch) just development: Notch signalling in the adult brain. Nat Rev Neurosci 12: , 269–283. |
[17] | Berezovska O , Xia MQ , Hyman BT , ((1998) ) Notch is expressed in adult brain, is coexpressed with presenilin-1, and is altered in Alzheimer disease. J Neuropathol Exp Neurol 57: , 738–745. |
[18] | Oh SY , Ellenstein A , Chen CD , Hinman JD , Berg EA , Costello CE , Yamin R , Neve RL , Abraham CR , ((2005) ) Amyloid precursor protein interacts with notch receptors. J Neurosci Res 82: , 32–42. |
[19] | Chen CD , Oh SY , Hinman JD , Abraham CR , ((2006) ) Visualization of APP dimerization and APP-Notch2 heterodimerization in living cells using bimolecular fluorescence complementation. J Neurochem 97: , 30–43. |
[20] | Atwood CS , Bowen RL , ((2015) ) A unified hypothesis of early- and late-onset Alzheimer’s 4s. J Alzheimers Dis 47: , 33–47. |
[21] | Xu K , Zhong G , Zhuang X , ((2013) ) Actin, spectrin, and associated proteins form a periodic cytoskeletal structure in axons. Science 339: , 452–456. |
[22] | Wang S , Yang J , Tsai A , Kuca T , Sanny J , Lee J , Dong K , Harden N , Krieger C , ((2011) ) Drosophila adducin regulates Dlg phosphorylation and targeting of Dlg to the synapse and epithelial membrane. Dev Biol 357: , 392–403. |
[23] | Wilson PG , ((2005) ) Centrosome inheritance in the male germ line of Drosophila requires hu-li tai-shao function. Cell Biol Int 29: , 360–369. |
[24] | Porro F , Rosato-Siri M , Leone E , Costessi L , Iaconcig A , Tongiorgi E , Muro AF , ((2010) ) beta-adducin (Add2) KO mice show synaptic plasticity, motor coordination and behavioral deficits accompanied by changes in the expression and phosphorylation levels of the alpha- and gamma-adducin subunits. Genes Brain Behav 9: , 84–96. |
[25] | Zhao KN , Masci PP , Lavin MF , ((2011) ) Disruption of spectrin-like cytoskeleton in differentiating keratinocytes by PKCdelta activation is associated with phosphorylated adducin. PLoS One 6: , e28267. |
[26] | Kruer MC , Jepperson T , Dutta S , Steiner RD , Cottenie E , Sanford L , Merkens M , Russman BS , Blasco PA , Fan G , Pollock J , Green S , Woltjer RL , Mooney C , Kretzschmar D , Paisan-Ruiz C , Houlden H , ((2013) ) Mutations in gamma adducin are associated with inherited cerebral palsy. Ann Neurol 74: , 805–814. |
[27] | Pielage J , Bulat V , Zuchero JB , Fetter RD , Davis GW , ((2011) ) Hts/Adducin controls synaptic elaboration and elimination. Neuron 69: , 1114–1131. |
[28] | Zeng S , Sun P , Chen Z , Mao J , Wang J , Wang B , Liu L , ((2014) ) Association between single nucleotide polymorphisms in the ADD3 gene and susceptibility to biliary atresia. PLoS One 9: , e107977. |
[29] | Tang V , Cofer ZC , Cui S , Sapp V , Loomes KM , Matthews RP , ((2016) ) Loss of a candidate biliary atresia susceptibility gene, add3a, causes biliary developmental defects in zebrafish. J Pediatr Gastroenterol Nutr 63: , 524–530. |
[30] | Ye Y , Li Z , Feng Q , Chen Z , Wu Z , Wang J , Ye X , Zhang D , Liu L , Gao W , Zhang L , Wang B , ((2017) ) Downregulation of microRNA-145 may contribute to liver fibrosis in biliary atresia by targeting ADD3. PLoS One 12: , e0180896. |
[31] | Lanzani C , Citterio L , Jankaricova M , Sciarrone MT , Barlassina C , Fattori S , Messaggio E , Serio CD , Zagato L , Cusi D , Hamlyn JM , Stella A , Bianchi G , Manunta P , ((2005) ) Role of the adducin family genes in human essential hypertension. J Hypertens 23: , 543–549. |
[32] | Fan F , Pabbidi MR , Ge Y , Li L , Wang S , Mims PN , Roman RJ , ((2017) ) Knockdown of Add3 impairs the myogenic response of renal afferent arterioles and middle cerebral arteries. Am J Physiol Renal Physiol 312: , F971-F981. |
[33] | Diekmann Y , Seixas E , Gouw M , Tavares-Cadete F , Seabra MC , Pereira-Leal JB , ((2011) ) Thousands of rab GTPases for the cell biologist. PLoS Comput Biol 7: , e1002217. |
[34] | Chua CE , Tang BL , ((2014) ) Engagement of the small GTPase Rab31 protein and its effector, early endosome antigen 1, is important for trafficking of the ligand-bound epidermal growth factor receptor from the early to the late endosome. J Biol Chem 289: , 12375–12389. |
[35] | Ng EL , Ng JJ , Liang F , Tang BL , ((2009) ) Rab22B is expressed in the CNS astroglia lineage and plays a role in epidermal growth factor receptor trafficking in A431 cells. J Cell Physiol 221: , 716–728. |
[36] | Rodriguez-Gabin AG , Cammer M , Almazan G , Charron M , Larocca JN , ((2001) ) Role of rRAB22b, an oligodendrocyte protein, in regulation of transport of vesicles from trans Golgi to endocytic compartments. J Neurosci Res 66: , 1149–1160. |
[37] | Rodriguez-Gabin AG , Ortiz E , Demoliner K , Si Q , Almazan G , Larocca JN , ((2010) ) Interaction of Rab31 and OCRL-1 in oligodendrocytes: Its role in transport of mannose 6-phosphate receptors. J Neurosci Res 88: , 589–604. |
[38] | Ng EL , Ng JJ , Liang F , Tang BL , ((2009) ) Rab22B is expressed in the CNS astroglia lineage and plays a role in epidermal growth factor receptor trafficking in A431 cells. J Cell Physiol 221: , 716–728. |
[39] | Chua CE , Goh EL , Tang BL , ((2014) ) Rab31 is expressed in neural progenitor cells and plays a role in their differentiation. FEBS Lett 588: , 3186–3194. |
[40] | Pan Y , Zhang Y , Chen L , Liu Y , Feng Y , Yan J , ((2016) ) The critical role of Rab31 in cell proliferation and apoptosis in cancer progression. Mol Neurobiol 53: , 4431–4437. |
[41] | Zhang B , Gaiteri C , Bodea LG , Wang Z , McElwee J , Podtelezhnikov AA , Zhang C , Xie T , Tran L , Dobrin R , Fluder E , Clurman B , Melquist S , Narayanan M , Suver C , Shah H , Mahajan M , Gillis T , Mysore J , MacDonald ME , Lamb JR , Bennett DA , Molony C , Stone DJ , Gudnason V , Myers AJ , Schadt EE , Neumann H , Zhu J , Emilsson V , ((2013) ) Integrated systems approach identifies genetic nodes and networks in late-onset Alzheimer’s disease. Cell 153: , 707–720. |


