
Hippocampal Subfield Volumetry: Differential Pattern of Atrophy in Different Forms of Genetic Frontotemporal Dementia
Abstract
Background:
Frontotemporal dementia (FTD) is a heterogeneous neurodegenerative disorder, with a strong genetic component. Previous research has shown that medial temporal lobe atrophy is a common feature of FTD. However, no study has so far investigated the differential vulnerability of the hippocampal subfields in FTD.
Objectives:
We aimed to investigate hippocampal subfield volumes in genetic FTD.
Methods:
We in6/2/2018vestigated hippocampal subfield volumes in a cohort of 75 patients with genetic FTD (age: mean (standard deviation) 59.3 (7.7) years; disease duration: 5.1 (3.4) years; 29 with MAPT, 28 with C9orf72, and 18 with GRN mutations) compared with 97 age-matched controls (age: 62.1 (11.1) years). We performed a segmentation of their volumetric T1-weighted MRI scans to extract hippocampal subfields volumes. Left and right volumes were summed and corrected for total intracranial volumes.
Results:
All three groups had smaller hippocampi than controls. The MAPT group had the most atrophic hippocampi, with the subfields showing the largest difference from controls being CA1-4 (24–27%, p < 0.0005). For C9orf72, the CA4, CA1, and dentate gyrus regions (8–11%, p < 0.0005), and for GRN the presubiculum and subiculum (10–14%, p < 0.0005) showed the largest differences from controls.
Conclusions:
The hippocampus was affected in all mutation types but a different pattern of subfield involvement was found in the three genetic groups, consistent with differential cortical-subcortical network vulnerability.
INTRODUCTION
Frontotemporal dementia (FTD) is a clinically, pathologically, and genetically heterogeneous neurodegenerative disorder. Around a third of patients with FTD have an autosomal dominant mutation in one of three genes: microtubule-associated protein tau (MAPT), progranulin (GRN), and chromosome 9 open reading frame 72 (C9orf72) [1]. Although traditionally described as characteristic of Alzheimer’s disease, medial temporal lobe atrophy is commonly seen in FTD [2] with the hippocampus often strikingly affected, particularly in carriers of mutations in the MAPT gene [3, 4], where volume loss occurs 15 years before expected onset [5], and there is a faster rate of atrophy compared with other genetic forms of FTD [6, 7].
The hippocampus is composed of different cytoarchitectonic subfields, which have specialized functions and distinctive connections [8, 9]. Recently, advanced parcellation methods based on atlases built from ultra-high resolution scans of histology sections have led to the development of post-processing techniques of high-resolution magnetic resonance (MR) scans that allow visualization and measurement of the hippocampal subfields in vivo [10]. Given the recent availability of this method, the differential vulnerability of the hippocampal subfields across the genetic forms of FTD has so far not been investigated. This study aimed to look into this further with the hypothesis that the three genetic groups would have different patterns of subfield involvement.
METHODS
We reviewed the UCL Dementia Research Centre FTD database to identify all patients who were symptomatic carriers of a mutation in the MAPT, GRN, or C9orf72 genes and who had also undergone a volumetric T1-weighted MR scan. 75 patients were identified: 29 MAPT (28 with behavioral variant FTD, bvFTD [11], and one with progressive nonfluent aphasia, PNFA [12]), 28 C9orf72 (24 bvFTD, 2 PNFA, 2 FTD with associated motor neuron disease, FTD-MND), and 18 GRN (11 bvFTD, 5 PNFA, and 2 primary progressive aphasia not otherwise specified, PPA-NOS [13]). 97 cognitively normal subjects, with a similar age to the patients and with a usable volumetric T1-weighted MRI, were identified as controls. The study was approved by the local ethics committee and written informed consent was obtained from all participants. The study was conducted in accordance with the Helsinki Declaration of 1975.
MRIs were acquired from 1993 to 2017 with scanners from three different manufacturers: 69 on 1.5T Signa MRI scanner (GE Medical systems, Milwaukee, WI, TR = 12 ms, TI = 650 ms, TE = 5 ms, acquisition matrix = 256 × 256, spatial resolution = 1.5 mm), 85 on 3T Trio MRI scanner (Siemens, Erlangen, Germany, TR = 2200 ms, TI = 900 ms, TE = 2.9 ms, acquisition matrix = 256 × 256, spatial resolution = 1.1 mm), and 18 on 3T Prisma MRI scanner (Siemens, Erlangen, Germany, TR = 2000 ms, TI = 850 ms, TE = 2.93 ms, acquisition matrix = 256 × 256, spatial resolution = 1.1 mm). We reviewed the MRIs to make sure we excluded individuals with moderate to severe vascular disease or space occupying lesions.
T1-weighted volumetric MRI scans were first bias field corrected and whole-brain parcellated using the geodesic information flow (GIF) algorithm [14], which is based on atlas propagation and label fusion. Volumes of the whole hippocampus and of 12 hippocampal subfields were subsequently segmented using a customised version of the module available in FreeSurfer 6.0 [10], to adapt the output of GIF to the FreeSurfer format. We focused on the following subregions: hippocampal tail, cornu ammonis 1 (CA1), CA2/3, CA4, subiculum, presubiculum, and the granule cell layer of the dentate gyrus (DG). We decided to exclude from the analysis the hippocampus– amygdala transition area, the parasubiculum, the molecular layer of the hippocampus, the fimbria and the hippocampal fissure, as they were too small, not reliably delineated on T1-weighted images, or white matter tissue.
Left and right volumes were summed and corrected for total intracranial volumes (TIV). Volumes are expressed as a percentage of TIV, computed with SPM12 v6470 (Statistical Parametric Mapping, Wellcome Trust Centre for Neuroimaging, London, UK) running under Matlab R2014b (Math Works, Natick, MA, USA) [15]. All segmentations were visually checked for quality by an expert in hippocampal segmentation and none was excluded. We also investigated asymmetry by calculating an Asymmetry Index (AI), defined as the absolute difference between the left and right total hippocampal volumes in relation to the total bilateral volume: |(Left – Right)|/(Left + Right). The volumetric differences between groups were computed as follow: (Mean of Controls – Mean of Genetic Group)/Mean of Controls*100.
Statistical analyses were performed on subfield volumes (as percentage of TIV) and AI in SPSS software (SPSS Inc., Chicago, IL, USA) v22.0, between control and patient groups, using the ANCOVA test adjusting for scanner type, gender and age. When comparing each volume and AI between different patient subgroups (in pairs), we also adjusted for disease duration. For the subfield analysis, results were corrected for multiple comparisons (Bonferroni’s correction), and we considered them significant at p < 0.007.
RESULTS
Demographic and clinical data are reported in Table 1. The mean disease duration for the whole FTD group at the time of the scan was 5.1 years (standard deviation 3.4) with an average age at onset at 54.2 (7.7). There was no significant difference in age between FTD and controls (p = 0.052, t-test), or for scanner type (p = 0.297, Chi square test), but there were more males in the FTD group than in the control group (61% versus 44%, p = 0.027, Chi square test). Across the different genetic FTD groups, there was no difference for scanner type nor gender (p = 0.281 and 0.322, Chi square test). There was also no difference across the different genetic FTD groups and controls (p = 0.247 and p = 0.070, Chi square test). However, there was a significant difference in disease duration (p = 0.010, ANOVA), with C9orf72 having the longest and GRN the shortest duration, and in age (p = 0.001, ANOVA), with MAPT being the youngest group.
Table 1
Demographic and clinical variables for the FTD patients and controls. Values denote mean (standard deviation) or n (%)
| Groups | n | Gender, male | Age at scan (y) | Disease Duration (y) | Clinical Diagnosis |
|---|---|---|---|---|---|
| controls | 97 | 43 (44%) | 62.1 (11.1) | – | — |
| MAPT | 29 | 17 (59%) | 55.3 (7.9) | 5.5 (3.3) | 28 bvFTD, 1 PNFA |
| GRN | 18 | 9 (50%) | 62.2 (6.4) | 3.0 (2.6) | 11 bvFTD, 5 PNFA, 2 PPA-NOS |
| C9orf72 | 28 | 20 (71%) | 61.5 (6.7) | 6.0 (3.6) | 24 bvFTD, 2 PNFA, 2 FTD-MND |
The whole hippocampus was significantly smaller in all three genetic groups when compared to controls (p < 0.0005, ANCOVA), with the MAPT group showing the highest difference in volume (19%; GRN: 8%; C9orf72: 5%) (Table 2). For all the subfields, MAPT showed a strong and highly significant difference from controls. In MAPT carriers, the most affected subfields were the CA regions (27–24%, p < 0.0005), followed by the dentate gyrus (23%, p < 0.0005), while the hippocampal tail was the least affected (9%, p < 0.0005). The subiculum and presubiculum were the most affected subfields in GRN carriers (10 and 14%, p < 0.0005), while for C9orf72 CA4 (11%), the dentate gyrus and CA1 (both 8%, p < 0.0005) were the most affected (Figs. 1 and 2 and Table 2).
Fig. 1
Volume of the hippocampal subfields as a percentage of total intracranial volume in 97 controls and 75 patients with genetic FTD (29 MAPT, 18 GRN, and 28 C9orf72).
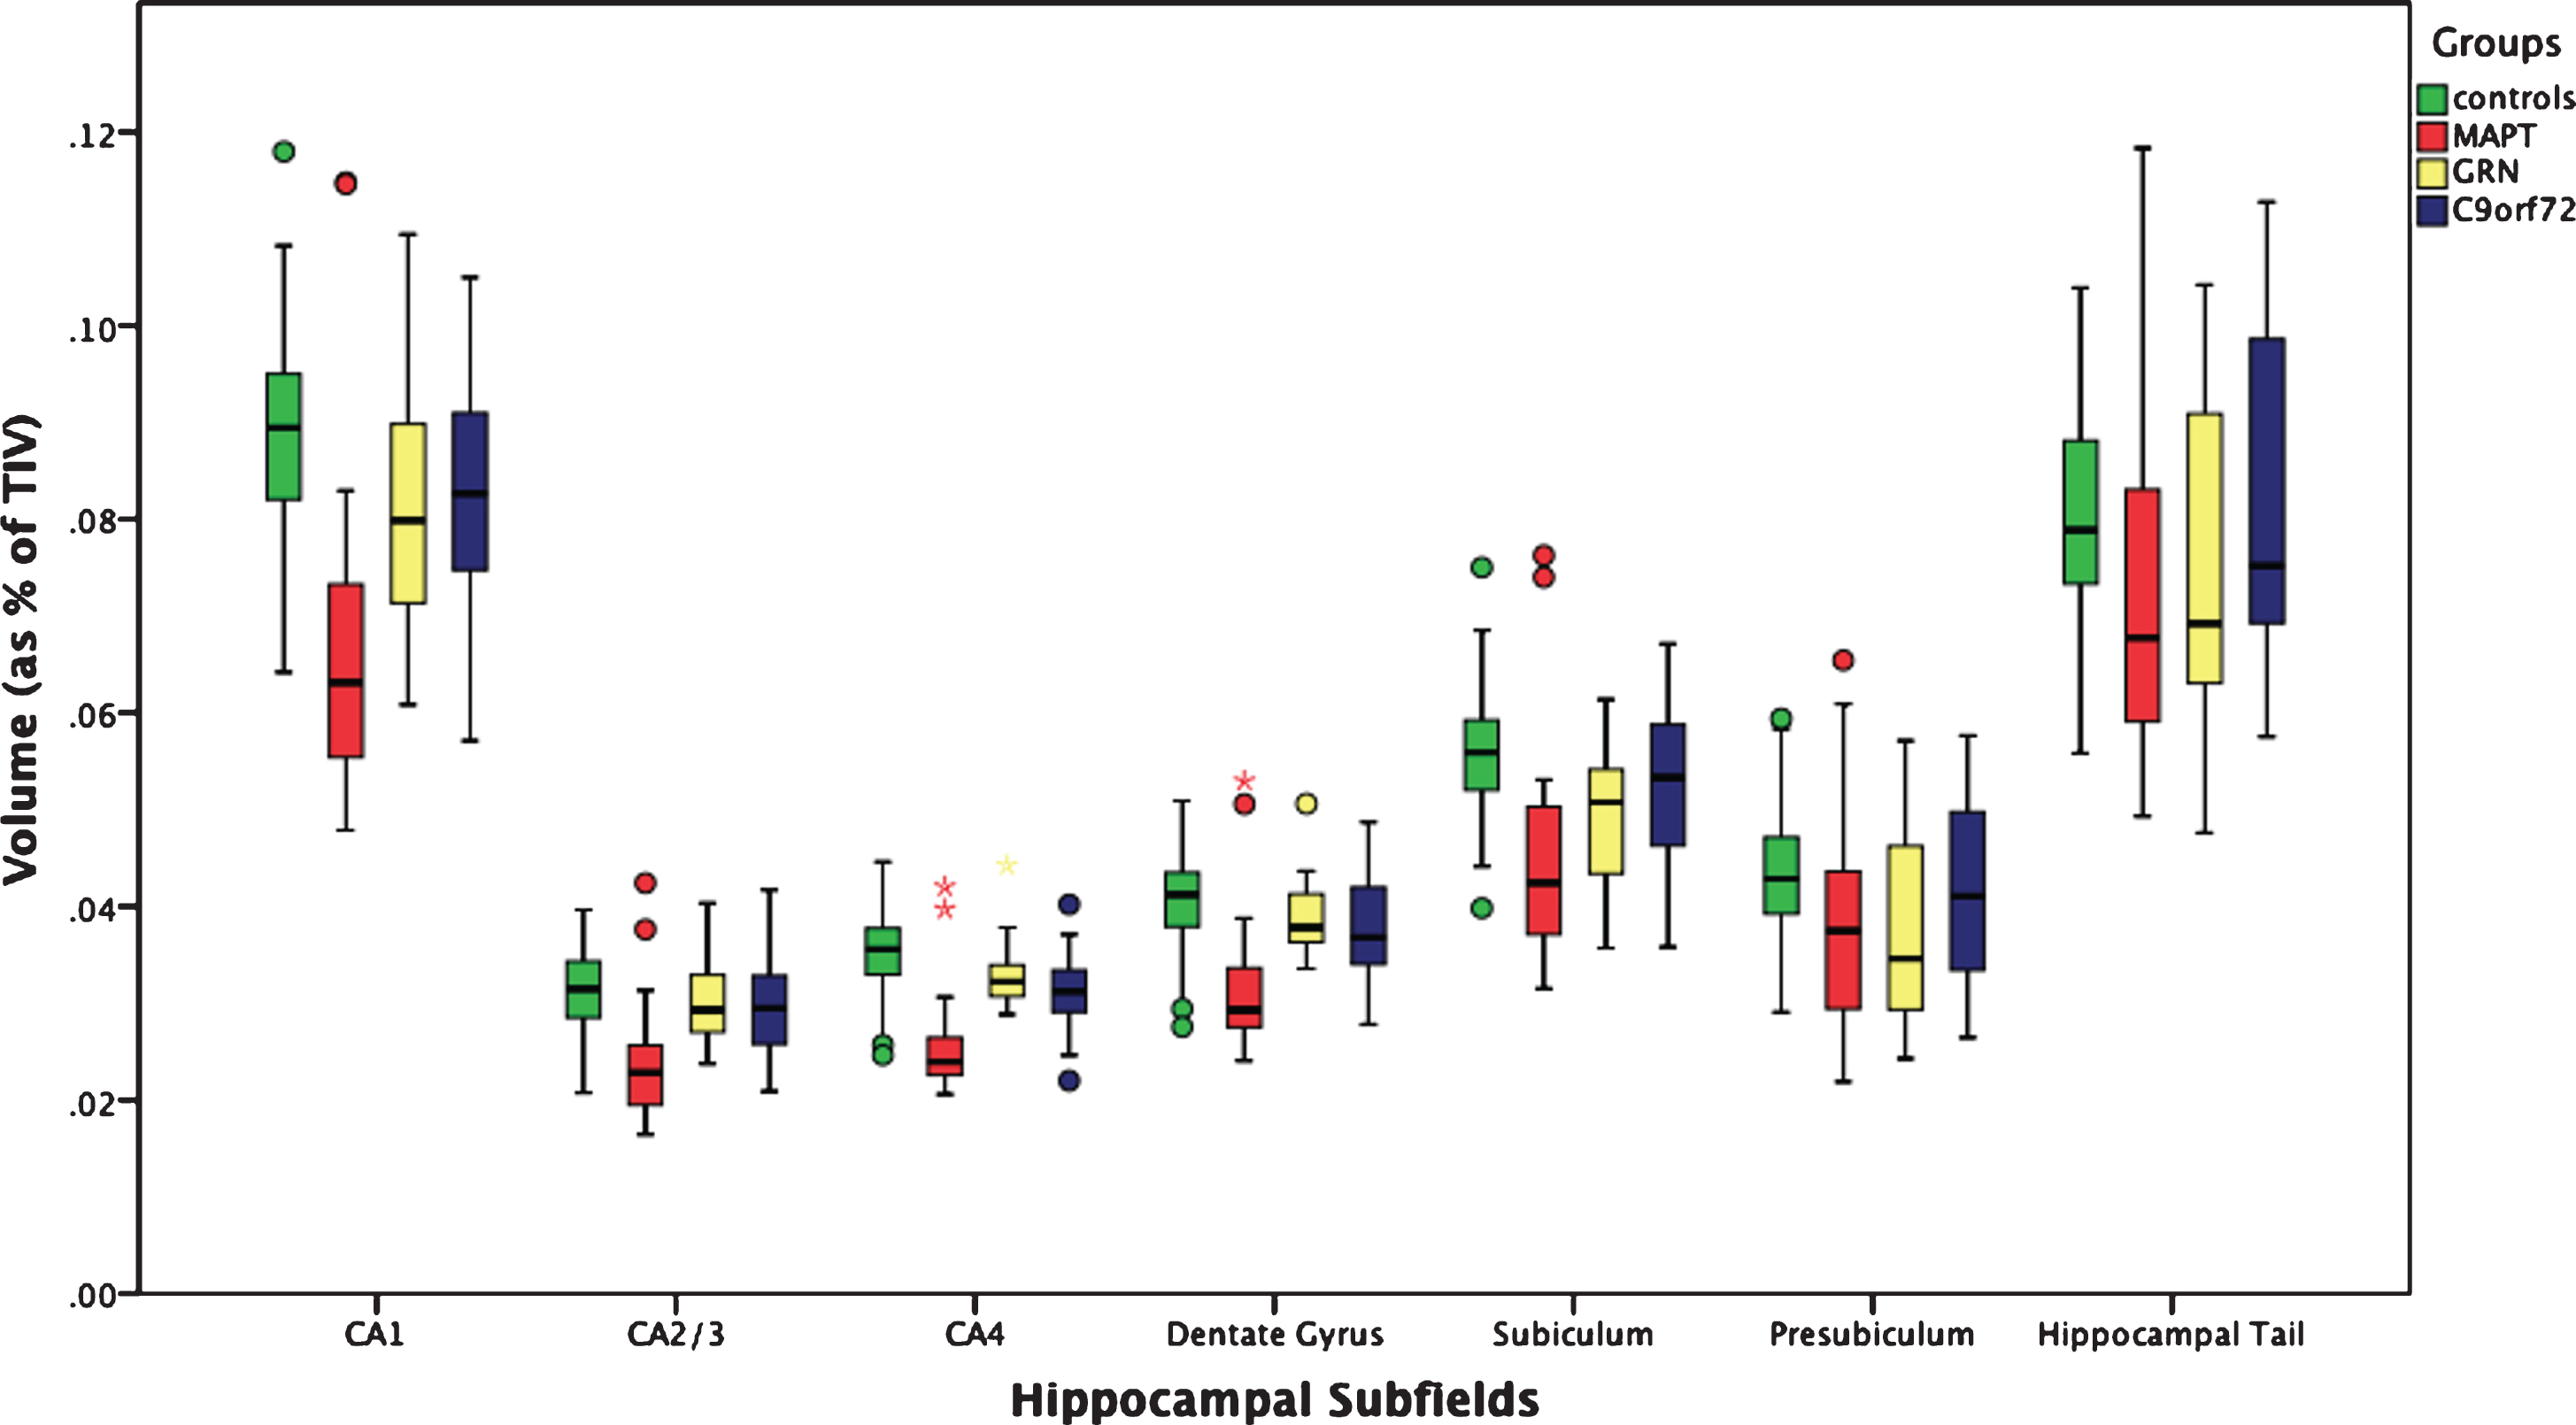
Fig. 2
Differential volumetric patterns for the three main genetic FTD forms when compared to controls. The most affected subfields for each gene are shown in color on a coronal representation of the hippocampus at the level of the body. CA, cornu ammonis; DG, granule cell layer of the dentate gyrus.
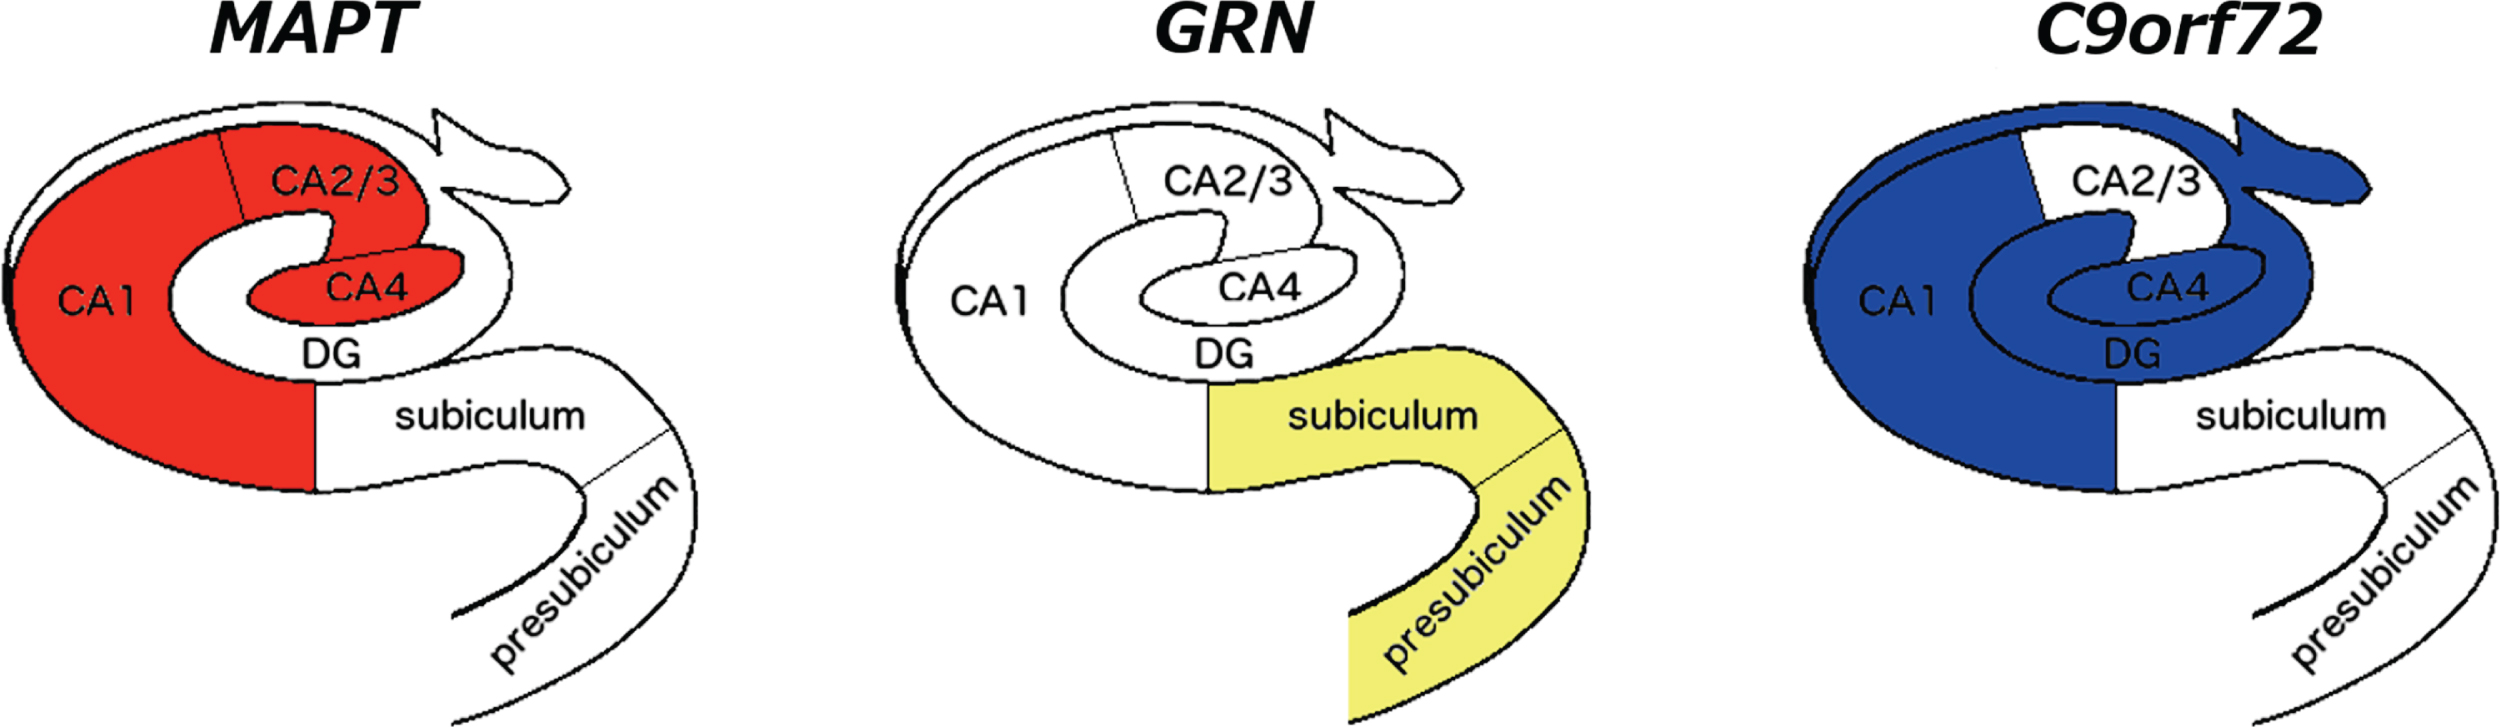
Table 2
Volumetry of hippocampal subfields in 97 healthy non-carrier controls and 75 genetic FTD patients
| Controls (97) | MAPT (29) | GRN (18) | C9orf72 (28) | MAPT versus Controls | GRN versus Controls | C9orf72 versus Controls | ||||||||
|---|---|---|---|---|---|---|---|---|---|---|---|---|---|---|
| Structure | Mean | SD | Mean | SD | Mean | SD | Mean | SD | p-value | difference | p-value | difference | p-value | difference |
| Whole hippocampus | 0.480 | 0.047 | 0.391 | 0.090 | 0.443 | 0.068 | 0.455 | 0.073 | <0.0005 | 19% | <0.0005 | 8% | <0.0005 | 5% |
| CA1 | 0.089 | 0.010 | 0.067 | 0.017 | 0.081 | 0.012 | 0.082 | 0.012 | <0.0005 | 24% | <0.0005 | 9% | <0.0005 | 8% |
| CA2/CA3 | 0.032 | 0.004 | 0.024 | 0.006 | 0.031 | 0.004 | 0.030 | 0.005 | <0.0005 | 24% | 0.054 | 3% | 0.042 | 6% |
| CA4 | 0.036 | 0.004 | 0.026 | 0.005 | 0.034 | 0.004 | 0.032 | 0.004 | <0.0005 | 27% | <0.0005 | 6% | <0.0005 | 11% |
| Dentate gyrus | 0.041 | 0.005 | 0.032 | 0.007 | 0.040 | 0.004 | 0.038 | 0.005 | <0.0005 | 23% | <0.0005 | 4% | <0.0005 | 8% |
| Subiculum | 0.056 | 0.006 | 0.045 | 0.011 | 0.050 | 0.008 | 0.053 | 0.008 | <0.0005 | 19% | <0.0005 | 10% | 0.001 | 6% |
| Presubiculum | 0.044 | 0.006 | 0.038 | 0.010 | 0.038 | 0.010 | 0.042 | 0.010 | <0.0005 | 13% | <0.0005 | 14% | 0.001 | 5% |
| Hippocampal tail | 0.080 | 0.010 | 0.073 | 0.017 | 0.076 | 0.018 | 0.082 | 0.017 | <0.0005 | 9% | <0.0005 | 5% | 0.003 | –3% |
Values denote mean and standard deviation (SD) volumes as % of total intracranial volume (TIV) or difference (%). p-values denote significance on ANCOVA test. Bold represents a significant difference between groups after correcting for multiple comparisons.
When directly comparing the three genetic subgroups, the MAPT group showed significantly lower volumes in the whole hippocampus than GRN (13%, p < 0.0005, ANCOVA) and C9orf72 (16%, p = 0.008) (Table 3). For the subfields, the MAPT group showed significantly smaller CA1, CA2/3, CA4, dentate gyrus (20–29% difference) and subiculum (11%) than GRN, and significantly smaller CA1, CA2/3, CA4 (22–23%) and dentate gyrus (18%) than C9orf72. No differences were found between the C9orf72 and GRN groups. Supplementary Table 1 shows additional volumetric results for the hippocampal subfields separated for the left and right hemisphere showing a similar pattern.
Table 3
Comparisons of volumetry of the hippocampal subfields in 75 genetic FTD patients
| MAPT versus GRN | MAPT versus C9orf72 | GRN versus C9orf72 | ||||
|---|---|---|---|---|---|---|
| Structure | p-value | difference | p-value | difference | p-value | difference |
| Whole hippocampus | 0.001 | –13% | 0.008 | –16% | 0.764 | –3% |
| CA1 | <0.0005 | –20% | <0.0005 | –22% | 0.968 | –1% |
| CA2/CA3 | <0.0005 | –27% | <0.0005 | –23% | 0.445 | 3% |
| CA4 | <0.0005 | –29% | <0.0005 | –22% | 0.131 | 6% |
| Dentate gyrus | <0.0005 | –24% | 0.001 | –18% | 0.394 | 5% |
| Subiculum | 0.005 | –11% | 0.013 | –16% | 0.669 | –4% |
| Presubiculum | 0.146 | 1% | 0.309 | –10% | 0.193 | –11% |
| Hippocampal tail | 0.089 | –5% | 0.144 | –13% | 0.807 | –8% |
p-values denote significance on ANCOVA test. Bold represents a significant difference between groups after correcting for multiple comparisons.
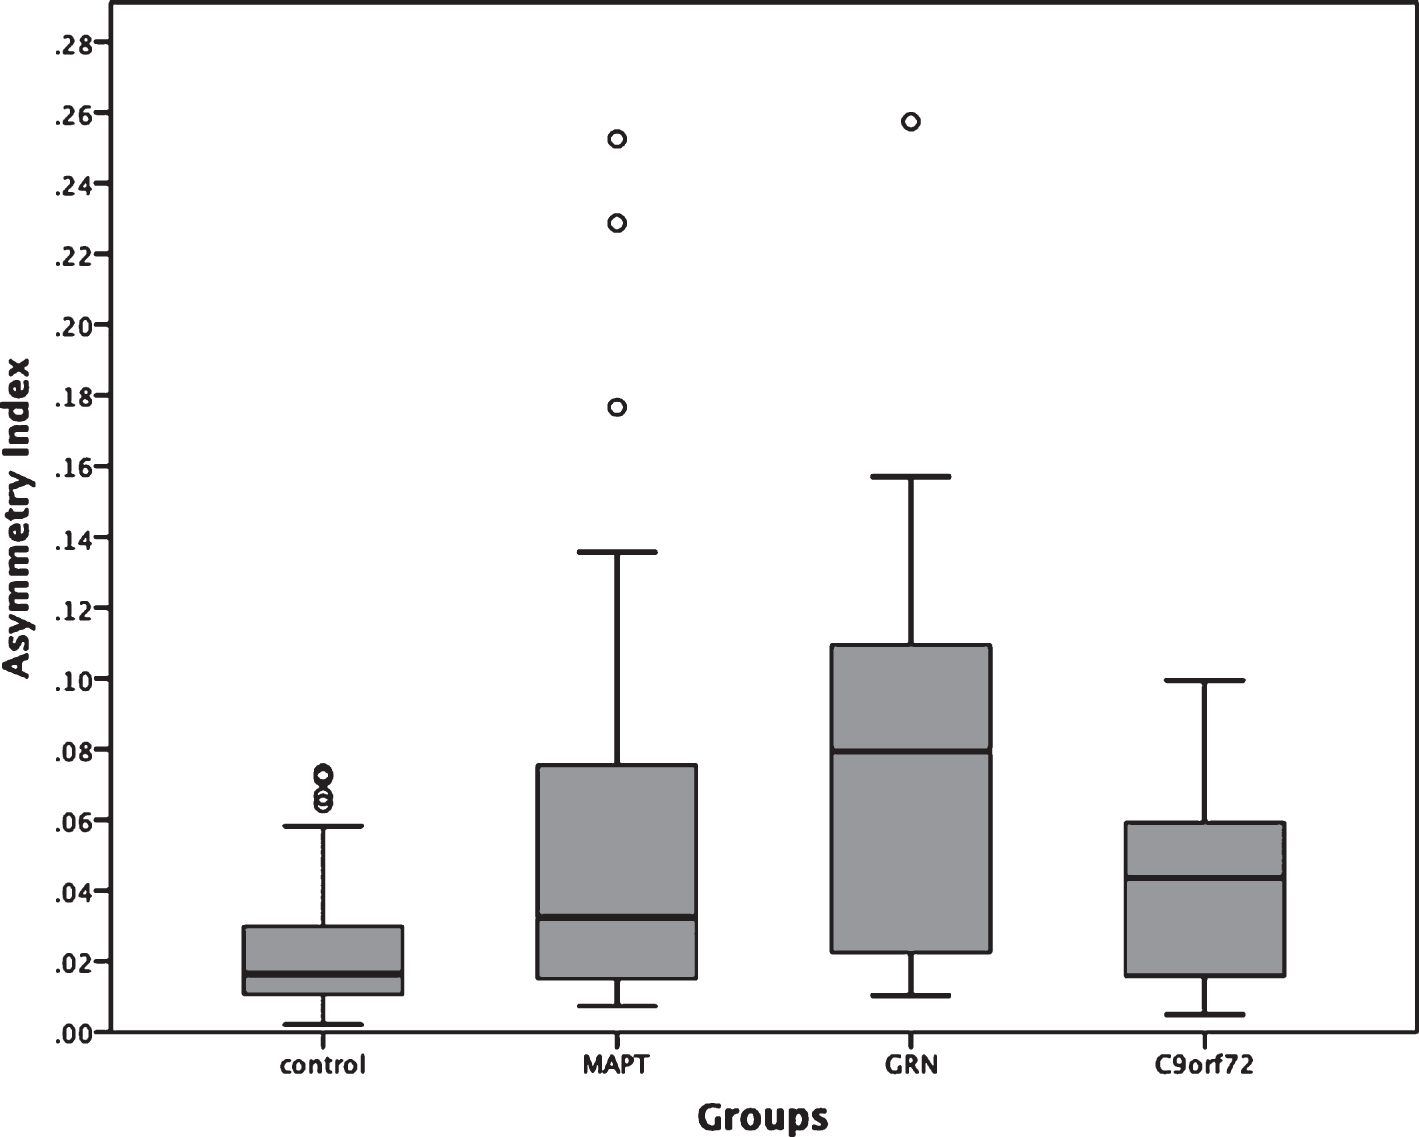
All three genetic groups showed significantly more asymmetry of the whole hippocampus than controls (mean: 0.020, standard deviation: 0.017; p < 0.0005, ANCOVA). The MAPT group (0.058, 0.067) did not show any significant difference when compared to GRN (0.079, 0.061) and C9orf72 (0.039, 0.029) (p = 0.064 and p = 0.146, respectively), while the GRN group showed significantly more asymmetry than C9orf72 (p = 0.027, ANCOVA) (Fig. 3).
We performed a comparison of hippocampal subfields volumes in the different scanners in the control group adjusting for age and found the following results reported on Supplementary Table 2: overall volumes tend to be slightly smaller on 1.5T scanner than on 3T ones with the range of difference from 3–9%.
Fig. 3
Asymmetry Index for the whole hippocampus in 75 genetic FTD patients (29 MAPT, 18 GRN and 28 C9orf72) and 97 controls. MAPT, C9orf72, and GRN versus controls: p < 0.0005; MAPT versus GRN: p = 0.064; MAPT versus C9orf72: p = 0.146; GRN versus C9orf72: p = 0.027 (ANCOVA).
DISCUSSION
We used an advanced automated segmentation method based on atlases built from ultra-high resolution scans of histological sections to extract volumes of hippocampal subfields in a large cohort of patients with genetic FTD. Those with MAPT mutations were the most affected group overall, a finding in line with the literature [3, 5, 7]. However, we also showed a pattern of differential involvement: the MAPT group showed an impairment in the hippocampus proper (formed by the CA subfields), C9orf72 in the dentate gyrus and CA1/4, and GRN in the subiculum and presubiculum.
Anatomical and imaging studies of hippocampal subfield connectivity to other cortical and subcortical regions provide insight into the differential involvement of the FTD genetic disorders [8, 9, 16]. The MAPT group showed greater involvement of the anterior and central regions of the hippocampus compared with the hippocampal tail. These regions are connected to the amygdala, nucleus accumbens, cingulate, and the medial prefrontal and orbitofrontal cortex [9, 16–18], a network linked to the regulation of emotions and goal-directed behaviour as part of the limbic system, previously described to be affected in MAPT mutations [6]. The GRN group showed the greatest involvement of the subiculum and presubiculum. A recent intrinsic connectivity study of the hippocampal subfields [19] showed that the subiculum connects to the lateral and medial parietal lobes and striatum as well as frontal regions, which have been described as key atrophic areas in GRN mutations [5, 20]. In the same study, CA4 and dentate gyrus (most affected in C9orf72) were connected with temporal and posterior cortical areas [19], similar to the early regions of involvement seen in this mutation group [5, 20]. This hypothesis of differential network involvement and our results are in line with pathological studies: tau deposition is extensively found in the hippocampus and other limbic structures in the early phases of FTD due to MAPT mutations [21]; dipeptide repeat proteins (DPRs), together or without TDP-43 deposition, are found in the CA subregions in C9orf72, and DPRs are also found in the cerebellum and the thalamus; while TDP-43 accumulates in the hippocampus and the cortex in GRN.
The GRN carriers were the most asymmetric group, consistent with previous literature highlighting the striking asymmetry in many cases with such mutations [6]. However, we also found that the MAPT and C9orf72 groups were significantly more asymmetric than controls albeit to a lesser extent than the GRN group. While the majority of studies of MAPT and C9orf72 have shown no difference in symmetry at the level of individual hemispheres, there is commonly subtle asymmetry in individual lobes or subcortical structures which is lost at a hemispheric level–the extent of such differences or their biological basis has yet to be studied in depth. As previously reported in the literature [23], the asymmetry index in the control group is non-zero with the right hippocampus being bigger than the left. Larger studies will be required to understand the asymmetrical involvement of the individual subfields.
This study has a number of limitations. It includes different scanners (three manufacturers, two different magnetic fields: 1.5T and 3T) with slightly different MRI sequence types, and age and disease duration differences between the genetic groups. We took into account these variables and corrected for them in the statistical model, but this cannot completely remove some of the heterogeneity in this genetic dataset. Moreover, we used an automated method to extract the subfield volumes, which is not as accurate as their segmentation on brain tissue postmortem, nor as their manual segmentation on MR images. After reviewing the segmentations, we decided to exclude from the analysis the smallest subfields which were not reliably delineated on T1 MR imaging, particularly in this cohort who had atrophic hippocampi. However, nonetheless, the larger subfields are consistently and accurately defined using this methodology providing in vivo volumetry of hippocampal subfields, with the automated nature allowing analysis of large cohorts. Manual segmentation on these large datasets would be very time-consuming and labor-intensive, as it would require extensive anatomical knowledge and may take several hours per MR scan for even an expert manual rater.
The whole hippocampus is affected in all genetic forms of FTD [2, 5], as we have also shown here. The advantage of subfield delineation as we have done here (rather than focusing on the whole hippocampal volume) is the ability to better understand group differences and therefore distinguish between the different genetic forms and their intrinsic networks: limbic system in MAPT, temporal and posterior areas in C9orf72 and fronto-parietal-striatum in GRN. Being able to investigate the hippocampal subfields with their clearly different projections will be helpful in providing further insights in disentangling the differences among the genetic forms of FTD.
Future studies, using functional and diffusion MR imaging, will be needed to investigate the different connections of these hippocampal subfields in each genetic form of FTD in more detail. Moreover, it will be important to investigate subfield volumetry both at the presymptomatic stage (through cohorts such as the Genetic FTD Initiative [5]) and longitudinally, to understand the differential involvement of the hippocampus over the course of the disease.
ACKNOWLEDGMENTS
The Dementia Research Centre is supported by Alzheimer’s Research UK, Brain Research Trust, and The Wolfson Foundation. This work was supported by the NIHR Queen Square Dementia Biomedical Research Unit and the NIHR UCL/H Biomedical Research Centre, the MRC UK GENFI grant and the Alzheimer’s Society. JDR is supported by an MRC Clinician Scientist Fellowship (MR/M008525/1) and has received funding from the NIHR Rare Disease Translational Research Collaboration (BRC149/NS/MH). JDW was supported by a Wellcome Trust Senior Clinical Fellowship (091673/Z/10/Z), and his research is supported by the Alzheimer’s Society and by the NIHR UCLH Biomedical Research Centre. SO is funded by the Engineering and Physical Sciences Research Council (EP/H046410/1, EP/J020990/1, EP/K005278), the Medical Research Council (MR/J01107X/1), the EU-FP7 project VPH-DARE@IT (FP7- ICT-2011-9- 601055), and the National Institute for Health Research University College London Hospitals Biomedical Research Centre (NIHR BRC UCLH/UCL High Impact Initiative BW.mn.BRC10269). JEI is supported by the European Research Council (Starting Grant 677697, project BUNGEE-TOOLS). MAS acknowledges financial support by the EPSRC-funded UCL Centre for Doctoral Training in Medical Imaging (EP/L016478/1). AA holds an MRC eMedLab Medical Bioinformatics Career Development Fellowship. AA’s work was partly supported by the Medical Research Council [grant number MR/L016311/1].
Authors’ disclosures available online (https://www.j-alz.com/manuscript-disclosures/18-0195r2).
SUPPLEMENTARY MATERIAL
[1] The supplementary material is available in the electronic version of this article: http://dx.doi.org/10.3233/JAD-180195.
REFERENCES
[1] | Rohrer JD , Warren JD ((2011) ) Phenotypic signatures of genetic frontotemporal dementia. Curr Opin Neurol 24: , 542–549. |
[2] | van de Pol LA , Hensel A , van der Flier WM , Visser PJ , Pijnenburg YA , Barkhof F , Gertz HJ , Scheltens P ((2006) ) Hippocampal atrophy on MRI in frontotemporal lobar degeneration and Alzheimer’s disease. J Neurol Neurosurg Psychiatry 77: , 439–442. |
[3] | Miyoshi M , Shinotoh H , Wszolek ZK , Strongosky AJ , Shimada H , Arakawa R , Higuchi M , Ikoma Y , Yasuno F , Fukushi K , Irie T , Ito H , Suhara T ((2010) ) In vivo detection of neuropathologic changes in presymptomatic MAPT mutation carriers: A PET and MRI study. Parkinsonism Relat Disord 16: , 404–408. |
[4] | Whitwell JL , Weigand SD , Boeve BF , Senjem ML , Gunter JL , DeJesus-Hernandez M , Rutherford NJ , Baker M , Knopman DS , Wszolek ZK , Parisi JE , Dickson DW , Petersen RC , Rademakers R , Jack CR Jr , Josephs KA ((2012) ) Neuroimaging signatures of frontotemporal dementia genetics: C9ORF72, tau, progranulin and sporadics. Brain 135: (Pt 3), 794–806. |
[5] | Rohrer JD , Nicholas JM , Cash DM , van Swieten J , Dopper E , Jiskoot L , van Minkelen R , Rombouts SA , Cardoso MJ , Clegg S , Espak M , Mead S , Thomas DL , De Vita E , Masellis M , Black SE , Freedman M , Keren R , MacIntosh BJ , Rogaeva E , Tang-Wai D , Tartaglia MC , Laforce R Jr , Tagliavini F , Tiraboschi P , Redaelli V , Prioni S , Grisoli M , Borroni B , Padovani A , Galimberti D , Scarpini E , Arighi A , Fumagalli G , Rowe JB , Coyle-Gilchrist I , Graff C , Fallström M , Jelic V , Ståhlbom AK , Andersson C , Thonberg H , Lilius L , Frisoni GB , Binetti G , Pievani M , Bocchetta M , Benussi L , Ghidoni R , Finger E , Sorbi S , Nacmias B , Lombardi G , Polito C , Warren JD , Ourselin S , Fox NC , Rossor MN ((2015) ) Presymptomatic cognitive and neuroanatomical changes in genetic frontotemporal dementia in the Genetic Frontotemporal dementia Initiative (GENFI) study: A cross-sectional analysis. Lancet Neurol 14: , 253–262. |
[6] | Rohrer JD , Ridgway GR , Modat M , Ourselin S , Mead S , Fox NC , Rossor MN , Warren JD ((2010) ) Distinct profiles of brain atrophy in frontotemporal lobar degeneration caused by progranulin and tau mutations. Neuroimage, 53: , 1070–1076. |
[7] | Whitwell JL , Weigand SD , Gunter JL , Boeve BF , Rademakers R , Baker M , Knopman DS , Wszolek ZK , Petersen RC , Jack CR Jr , Josephs KA ((2011) ) Trajectories of brain and hippocampal atrophy in FTD with mutations in MAPT or GRN. Neurology 77: , 393–398. |
[8] | Duvernoy HM ((2005) ) The human hippocampus: Functional anatomy, vascularization, and serial sections with MRI. 3rd ed. Springer, Berlin; New York. |
[9] | Small SA , Schobel SA , Buxton RB , Witter MP , Barnes CA ((2011) ) A pathophysiological framework of hippocampal dysfunction in ageing and disease. Nat Rev Neurosci 12: , 585–601. |
[10] | Iglesias JE , Augustinack JC , Nguyen K , Player CM , Player A , Wright M , Roy N , Frosch MP , McKee AC , Wald LL , Fischl B , Van Leemput K ((2015) ) A computational atlas of the hippocampal formation using ex vivo, ultra-high resolution MRI: Application to adaptive segmentation of in vivo MRI. Neuroimage 115: , 117–137. |
[11] | Rascovsky K , Hodges JR , Knopman D , Mendez MF , Kramer JH , Neuhaus J , van Swieten JC , Seelaar H , Dopper EG , Onyike CU , Hillis AE , Josephs KA , Boeve BF , Kertesz A , Seeley WW , Rankin KP , Johnson JK , Gorno-Tempini ML , Rosen H , Prioleau-Latham CE , Lee A , Kipps CM , Lillo P , Piguet O , Rohrer JD , Rossor MN , Warren JD , Fox NC , Galasko D , Salmon DP , Black SE , Mesulam M , Weintraub S , Dickerson BC , Diehl-Schmid J , Pasquier F , Deramecourt V , Lebert F , Pijnenburg Y , Chow TW , Manes F , Grafman J , Cappa SF , Freedman M , Grossman M , Miller BL ((2011) ) Sensitivity of revised diagnostic criteria for the behavioural variant of frontotemporal dementia. Brain 134: , 2456–2477. |
[12] | Gorno-Tempini ML , Hillis AE , Weintraub S , Kertesz A , Mendez M , Cappa SF , Ogar JM , Rohrer JD , Black S , Boeve BF , Manes F , Dronkers NF , Vandenberghe R , Rascovsky K , Patterson K , Miller BL , Knopman DS , Hodges JR , Mesulam MM , Grossman M ((2011) ) Classification of primary progressive aphasia and its variants. Neurology 76: , 1006–1014. |
[13] | Harris JM , Gall C , Thompson JC , Richardson AM , Neary D , du Plessis D , Pal P , Mann DM , Snowden JS , Jones M ((2013) ) Classification and pathology of primary progressive aphasia. Neurology 81: , 1832–1839. |
[14] | Cardoso MJ , Modat M , Wolz R , Melbourne A , Cash D , Rueckert D , Ourselin S ((2015) ) Geodesic information flows: Spatially-variant graphs and their application to segmentation and fusion. IEEE Trans Med Imaging 34: , 1976–1988. |
[15] | Malone IB , Leung KK , Clegg S , Barnes J , Whitwell JL , Ashburner J , Fox NC , Ridgway GR ((2015) ) Accurate automatic estimation of total intracranial volume: A nuisance variable with less nuisance. Neuroimage 104: , 366–372. |
[16] | Fanselow MS , Dong HW ((2010) ) Are the dorsal and ventral hippocampus functionally distinct structures? Neuron 65: , 7–19. |
[17] | Moser MB , Moser EI ((1998) ) Functional differentiation in the hippocampus. Hippocampus 8: .608–619. |
[18] | Adnan A , Barnett A , Moayedi M , McCormick C , Cohn M , McAndrews MP ((2016) ) Distinct hippocampal functional networks revealed by tractography-based parcellation. Brain Struct Funct 221: , 2999–3012. |
[19] | de Flores R , Mutlu J , Bejanin A , Gonneaud J , Landeau B , Tomadesso C , Mézenge F , de La Sayette V , Eustache F , Chételat G ((2017) ) Intrinsic connectivity of hippocampal subfields in normal elderly and mild cognitive impairment patients. Hum Brain Mapp 38: , 4922–4932. |
[20] | Cash DM , Bocchetta M , Thomas D , Dick KM , van Swieten JC , Borroni B , Galimberti D , Masellis M , Tartaglia MC , Rowe JB , Graff C , Tagliavini F , Frisoni GB , Laforce R Jr. , Finger E , de Mendonça A , Sorbi S , Rossor MN , Ourselin S , Rohrer JD , Genetic FTD Initiative, GENFI ((2017) ) Patterns of grey matter atrophy in genetic frontotemporal dementia: Results from the GENFI study. Neurobiol Aging 62: , 191–196. |
[21] | Ghetti B , Oblak AL , Boeve BF , Johnson KA , Dickerson BC , Goedert M ((2015) ) Invited review: Frontotemporal dementia caused by microtubule-associated protein tau gene (MAPT) mutations: A chameleon for neuropathology and neuroimaging. Neuropathol Appl Neurobiol 41: , 24–46. |
[22] | Mann DMA , Snowden JS ((2017) ) Frontotemporal lobar degeneration: Pathogenesis, pathology and pathways to phenotype. Brain Pathol 27: , 723–736. |
[23] | Guadalupe T , Mathias SR , vanErp TGM , Whelan CD , Zwiers MP , Abe Y , Abramovic L , Agartz I , Andreassen OA , Arias-Vásquez A , Aribisala BS , Armstrong NJ , Arolt V , Artiges E , Ayesa-Arriola R , Baboyan VG , Banaschewski T , Barker G , Bastin ME , Baune BT , Blangero J , Bokde ALW , Boedhoe PSW , Bose A , Brem S , Brodaty H , Bromberg U , Brooks S , Büchel C , Buitelaar J , Calhoun VD , Cannon DM , Cattrell A , Cheng Y , Conrod PJ , Conzelmann A , Corvin A , Crespo-Facorro B , Crivello F , Dannlowski U , de Zubicaray GI , de Zwarte SMC , Deary IJ , Desrivières S , Doan NT , Donohoe G , Dørum ES , Ehrlich S , Espeseth T , Fernández G , Flor H , Fouche JP , Frouin V , Fukunaga M , Gallinat J , Garavan H , Gill M , Suarez AG , Gowland P , Grabe HJ , Grotegerd D , Gruber O , Hagenaars S , Hashimoto R , Hauser TU , Heinz A , Hibar DP , Hoekstra PJ , Hoogman M , Howells FM , Hu H , Hulshoff Pol HE , Huyser C , Ittermann B , Jahanshad N , Jönsson EG , Jurk S , Kahn RS , Kelly S , Kraemer B , Kugel H , Kwon JS , Lemaitre H , Lesch K , Lochner C , Luciano M , Marquand AF , Martin NG , Martínez-Zalacaín I , Martinot JL , Mataix-Cols D , Mather K , McDonald C , McMahon KL , Medland SE , Menchón JM , Morris DW , Mothersill O , Maniega SM , Mwangi B , Nakamae T , Nakao T , Narayanaswaamy JC , Nees F , Nordvik JE , Onnink AMH , Opel N , Ophoff R , Paillère Martinot ML , Papadopoulos Orfanos D , Pauli P , Paus T , Poustka L , Reddy JY , Renteria ME , Roiz-Santiáñez R , Roos A , Royle NA , Sachdev P , Sánchez-Juan P , Schmaal L , Schumann G , Shumskaya E , Smolka MN , Soares JC , Soriano-Mas C , Stein DJ , Strike LT , Toro R , Turner JA , Tzourio-Mazoyer N , Uhlmann A , Hernández MV , van den Heuvel OA , van der Meer D , van Haren NEM , Veltman DJ , Venkatasubramanian G , Vetter NC , Vuletic D , Walitza S , Walter H , Walton E , Wang Z , Wardlaw J , Wen W , Westlye LT , Whelan R , Wittfeld K , Wolfers T , Wright MJ , Xu J , Xu X , Yun JY , Zhao J , Franke B , Thompson PM , Glahn DC , Mazoyer B , Fisher SE , Francks C ((2017) ) Human subcortical brain asymmetries in 15,847 people worldwide reveal effects of age and sex. Brain Imaging Behav 11: , 1497–1514. |


