
Potential Factors Associated with Cognitive Improvement of Individuals Diagnosed with Mild Cognitive Impairment or Dementia in Longitudinal Studies
Abstract
Despite the progressive nature of Alzheimer’s disease and other dementias, it is observed that many individuals that are diagnosed with mild cognitive impairment (MCI) in one clinical assessment, may return back to normal cognition (CN) in a subsequent assessment. Less frequently, such ‘back-transitions’ are also observed in people that had already been diagnosed with later stages of dementia. In this study, an analysis was performed on two longitudinal cohort datasets provided by 1) the Alzheimer’s Disease Neuroimaging Initiative (ADNI) and 2) the National Alzheimer’s Coordinating Centre (NACC). The focus is on the observed improvement of individuals’ clinical condition recorded in these datasets to explore potential associations with different factors. It is shown that, in both datasets, transitions from MCI to CN are significantly associated with younger age, better cognitive function, and the absence of ApoE ɛ4 alleles. Better cognitive function and in some cases the absence of ApoE ɛ4 alleles are also significantly associated with transitions from types of dementia to less severe clinical states. The effect of gender and education is not clear-cut in these datasets, although highly educated people who reach MCI tend to be more likely to show an improvement in their clinical state. The potential effect of other factors such as changes in symptoms of depression is also discussed. Although improved clinical outcomes can be associated with many factors, better diagnostic tools are required to provide insight into whether such improvements are a result of misdiagnosis, and if they are not, whether they are linked to improvements in the underlying neuropathological condition.
INTRODUCTION
Despite the progressive nature of many neurodegenerative disorders and the absence of curative treatments, in longitudinal cohort studies, where measurements are made at a series of time points, it is observed that the clinical condition of cognitively impaired individuals may improve irrespective of their disease severity. Such observations are frequent in many studies that have been designed to provide insights into the progression of Alzheimer’s disease (AD) and other types of dementia (for such studies see [1–11]).
The limited knowledge on the pathogenesis, development and progression of such diseases, and the currently available diagnostic and assessment tools, make it difficult to assess whether the observed improvement of the clinical status is correct, and if it is correct, whether it is connected to a real improvement in the underlying neuropathological condition. In any case, the accurate diagnosis of the clinical state is challenging. Factors that can affect the clinical diagnosis vary. The underlying causes of signs and symptoms associated with AD and other dementias can be masked by the presence of confounding comorbid conditions [9, 14] and emotional problems (e.g., grief, stress, depression, psychosis, fatigue) or other brain conditions. Poor methodologies and tools used for clinical assessment, the lack of resources, as well as patient factors such as communication problems [15] and practice effects [16–18] have also been reported as significant factors that can influence accurate diagnosis. Other factors suggested by various studies include adjustments of medication and therapies such as memantine and cholinesterase inhibitors developed to manage AD symptomology, resistance to cognitive decline due to cognitive reserve, lifestyle factors (e.g., alcoholism and substance abuse), and normal aging changes [1, 6, 9, 19–21].
In this study we investigate whether there are significant factors, including demographic and genetic, associated with the observed cognitive improvements. Generalized linear mixed models (GLMM) are developed. We focus our analysis on the transitions between three commonly recognized clinical states, namely, the cognitively normal (CN), the mild cognitive impairment (MCI), and the dementia (D) state. In particular, we analyze the data from individuals that were classified in the MCI or dementia state in one of the assessments, and had the possibility of transitioning backwards to an earlier state in a subsequent assessment. Two different longitudinal cohort datasets are utilized; the Alzheimer’s Disease Neuroimaging Initiative and the National Alzheimer’s Coordinating Center.
METHODS
Datasets used
The first dataset employed in the analyses was obtained from the Alzheimer’s Disease Neuroimaging Initiative (ADNI, http://adni.loni.usc.edu, last downloaded 2016/10/31). ADNI was launched in 2003 as a public-private partnership, led by Principal Investigator Michael W. Weiner, MD. The primary goal of ADNI has been to test whether serial magnetic resonance imaging (MRI), positron emission tomography (PET), other biological markers, and clinical and neuropsychological assessment can be combined to measure the progression of MCI and early AD. For up-to-date information, see http://www.adni-info.org.
ADNI is a multisite (50 ADNI clinical trial sites are located across the US and Canada), longitudinal study of normal cognitive aging, MCI, and early AD individuals. The ADNI study has three phases: ADNI-1, ADNI-GO, and ADNI-2. Important to note that ADNI is not a population-based study. Its population represents a primarily amnestic clinical population that can be used in treatment trials. Participants were recruited following specific recruitment methods.
The original dataset obtained from ADNI consists of 1,737 individuals (from the ADNI-1, ADNI-GO, and ADNI-2 protocols). 106 participants (of ADNI-2) were categorized as ‘Significant Memory Concern’ (SMC). The key inclusion criteria that distinguish SMC are a self-report significant memory concern from the participant, although participants in this class scored within normal range for cognition (or Clinical Dementia Rating = 0). However, this is not equated as progressive memory impairment or as consistent forgetfulness. SMC individuals were excluded from our analysis, so that in both datasets analyzed in this study, only transitions between CN, MCI, and D are considered. In addition, there were 7 individuals that had only a screening visit/diagnosis (preceding the baseline visit/diagnosis) and were also excluded from the study. The study duration up to the time the current analysis was performed is about 11 years.
The second dataset used was provided by the National Alzheimer’s Coordinating Center (NACC, http://alz.washington.edu). NACC was established by the National Institute on Aging/NIH (U01 AG016976) in 1999. It develops and maintains a cumulative database including clinical evaluations, neuropathology data when available, and MRI imaging [23]. The data are contributed by the 39 past and present Alzheimer’s Disease Centers (ADCs) using a prospective, standardized, and longitudinal clinical evaluation of the subjects in the National Institute on Aging’s ADC Program. Each center enrolls its subjects according to its own protocol. Subjects are enrolled through clinician referral, self-referral, referral by family members, or active recruitment through community organizations. They may also be volunteers who wish to contribute to the studies. Diagnosis is made by either a consensus team or a single physician, but the actual process varies according to each ADC’s protocol.
The analysis in the current study was based on data from visits conducted between September 2005 (start date of the Uniform Data Set) and June 2016 (data freeze). This specific dataset consists of 9,927 individuals. The clinic-based population of NACC includes subjects with AD and related disorders, as well as CN and MCI subjects. There is also a state, described as ‘Impaired, not MCI’ (INM), for those individuals whose presentation, tests, symptoms and clinical evaluation do not fit into the normal cognition, MCI, or dementia criteria. For comparison with ADNI, in NACC, the visits at which someone is classified as INM are ignored (1,667 INM classifications out of 47,434). The longest follow-up in NACC, up to the time the current analysis was performed, is about 10 years.
It should be noted that in both ADNI and NACC datasets that we consider, the majority of individuals that developed dementia was due to AD. In particular, in ADNI only 18 (2.6%) and in NACC only 337 (3.4%) individuals developed dementia that was not due to AD (note that ADNI focuses on amnestic MCI subtype and any significant neurologic disease other than AD is an exclusion criterion). The procedure of AD clinical diagnosis in NACC depends on the actual diagnostic protocol of the ADC, but as in ADNI, each center generally adheres to standardized clinical criteria as outlined by the NINCDS-ADRDA guidelines [24]. It should be acknowledged, however, that autopsy-verified diagnoses have confirmed that neuropathologic comorbidities are common among cases with neuropathologic AD [11, 12, 29, 30]. Such comorbidities can increase the rate of progression to more severe cognitive impairment states [9, 10]. It has also been verified that some clinically diagnosed MCI and AD individuals may not even present AD neuropathologic changes [9].
Key criteria for MCI diagnosis in ADNI include Mini–Mental State Examination (MMSE) scores between 24–30 (inclusive), a memory complaint, objective memory loss measured by education adjusted scores on Wechsler Memory Scale Logical Memory II, a Clinical Dementia Rating of 0.5, absence of significant levels of impairment in other cognitive domains, essentially preserved activities of daily living, and absence of dementia. Standard criteria were used to diagnose MCI in NACC (the participant is neither normal nor demented, there is evidence of cognitive deterioration and there are normal functional activities) [25, 26]. For a detailed list of all diagnostic, inclusion and exclusion criteria readers are referred to the ADNI Procedures Manual (http://adni.loni.usc.edu/methods/documents) and NACC protocols (http://alz.washington.edu). It is worth noting that, in both datasets, different MCI subtypes have been defined. Two major subtypes of MCI, amnestic and non-amnestic MCI, are recognized. Each subtype can be further subdivided into single and multiple domain types. In NACC, all subtypes are included whereas all enrolled MCI subjects in ADNI are amnestic MCI, as these subtypes progress to AD at a high rate. In addition, in ADNI 2, MCI is divided further into ‘Early MCI’ (EMCI) and ‘Late MCI’ (LMCI). In both datasets, we have combined the MCI subtypes (but see for example [6]).
Factors considered
We are interested in the effect of the following factors on the likelihood of MCI or D individuals moving to a less severe state in subsequent assessments:
Chronological age: exact age of individuals at the point of assessment.
Gender: male or female.
Education: we considered education as a factor that could increase resistance to cognitive decline. We focused on two different groups: one consisting of individuals that have completed 12 years of education and one of individuals that have more than 12 years of education.
Genetic background: absence or presence of one or two alleles of the apolipoprotein ɛ4 genotype (APOE ɛ4, homozygous or heterozygous), a well-known risk factor of AD.
Time between visits: time between clinical assessments (in years).
Cognitive performance: We are interested in a number of commonly used measures of cognition. We focused on the scores in an Alzheimer’s Disease Assessment Scale-Cognitive Subscale test (ADAS-Cog 11) and the scores in the MMSE test. The original ADAS-Cog 11 [27] includes 11 items assessing cognitive function (including memory, language, praxis, and orientation). Higher scores reflect greater cognitive impairment and the maximum score of the test is 70 points. Additional analysis including ADAS-Cog 13-item scale [28], which consists of all items of the original ADAS-Cog 11 test plus two additional tasks, yielded similar results and has not been considered further in this study. MMSE [29] is a 30-point questionnaire which also measures cognitive impairment, with a lower score indicating greater severity. ADAS-Cog 11 and ADAS-Cog 13 scores are available in ADNI. MMSE scores are available in both ADNI and NACC. It should be noted that MMSE score is one of the criteria used for the clinical diagnosis of participants in ADNI, and also one of the most widely used test of dementia severity in NACC [30].
Depression scores (Geriatric Depression Scale, GDS): These are scores from a screening test designed to identify depression symptoms in the elderly. A 15-item GDS bigger or equal to 6 was an exclusion criterion in ADNI. Individuals with history of major depression or bipolar disorder within the past year were also excluded from the study. In NACC, GDS is not recorded for individuals with severe dementia, but it is not used as an exclusion criterion for study entry. It should be noted, however, that GDS is not a required form in NACC, so it may not be recorded for any participant at any visit. Due to the inclusion/exclusion criteria and the reduced number of assessments of the GDS score in the datasets considered, the results and conclusions about the potential effect of depression should be interpreted with extra caution.
Statistical models/analysis
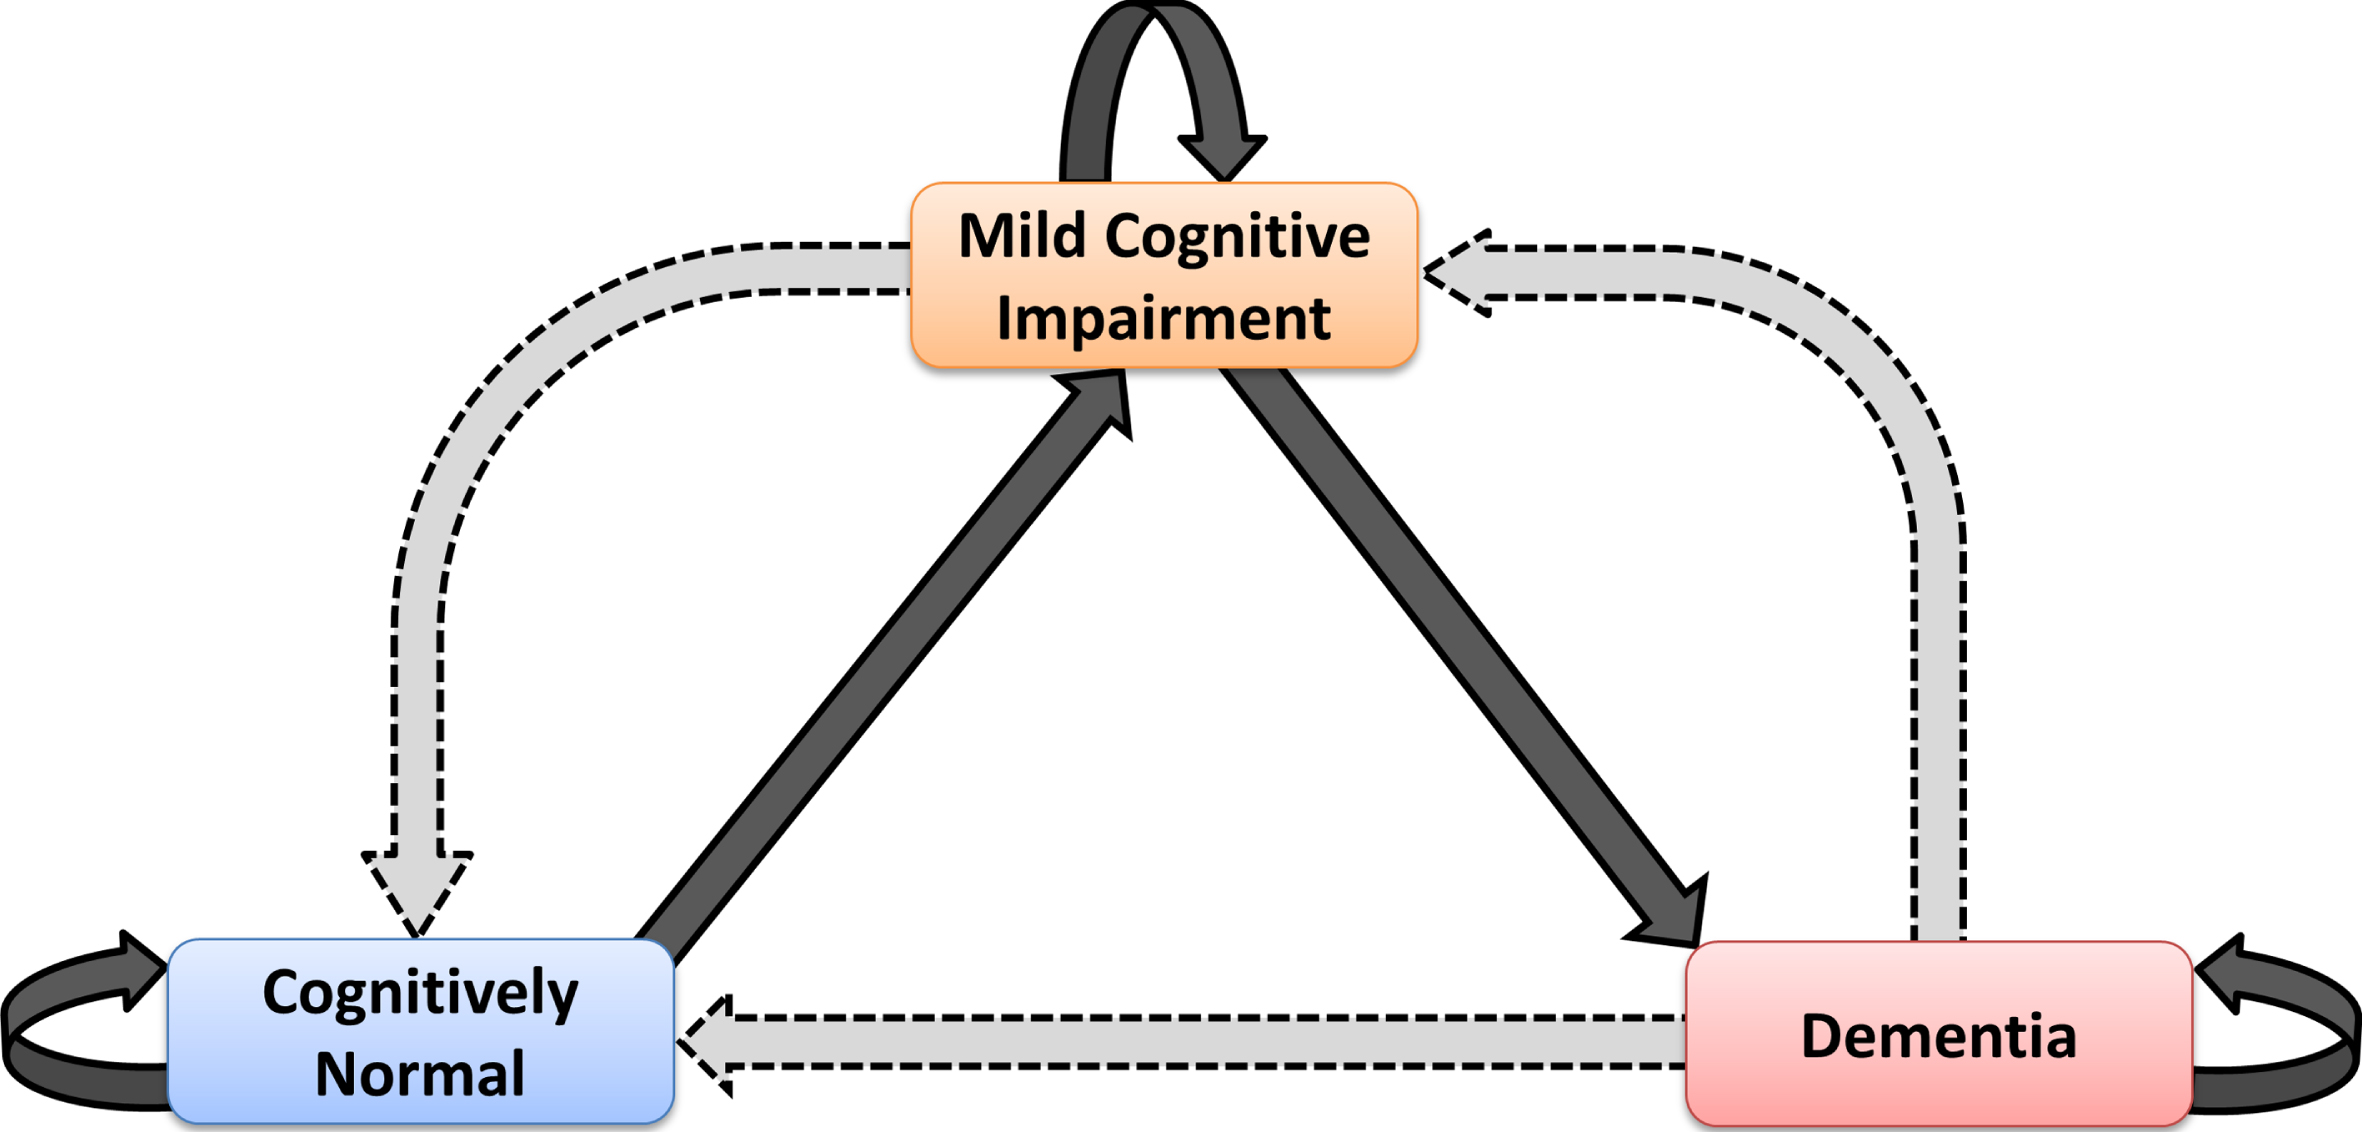
Individuals were classified in three clinical states: CN, MCI and D. We focused on MCI→CN, D→MCI and D→CN as the possible back-transitions during disease development. In ADNI, there were no direct transitions from D back to CN. In NACC, 43 such transitions were observed. The possible transitions between the different states are as shown in the schematic diagram of Fig. 1.
Fig. 1.
Schematic diagram showing the possible health and disease states in which one individual can be classified in the present study and potential transitions between these states. Observable back-transitions of individuals from Mild Cognitive Impairment to Cognitively Normal state, and from Dementia to Mild Cognitive Impairment and Cognitively Normal states are questionable; they might be real, or just due to different factors that can affect the accuracy of the diagnosis.
For the analysis of the back-transitions and associated factors, we first considered each factor independently. We calculated descriptive statistics and created box-and-whisker plots to illustrate the available data and differences in the median and variability of factors of interest in the group of participants that have moved backwards at least once and those that have never moved backwards. In this case, in order to avoid time effects and to make fair comparisons between individuals and datasets, only the clinical state at the beginning and the end of each year was considered. Thus, in ADNI, only for this analysis, any transitions at the 6-month and 18-month visits (see ADNI Procedures Manual; note that not all participants have been assessed at these time points) have not been taken into account in the transitions of year 1 and year 2, respectively. In the statistical models that we developed and describe below, all transitions of interest between any two recorded visits were included, regardless of the time between them. For this reason, we included the ‘time between visits’ variable, so that we account for the fact that the time between visits is varying.
In order to study the overall impact of the factors presented in the previous section on the likelihood of transitioning to a less severe clinical state from a more severe one, we developed a generalized linear mixed model (GLMM). GLMMs are an extension of the generalized linear model (GLM) that include both fixed and random effects. They are useful for studying longitudinal data by accounting for the non-independence of observations between subjects or groups (by the addition of one or more random intercept or slope terms).
GLMMs with a logit link function were used with the probability of transitioning to a less severe state as the response variable.
A series of models were developed; model 1 (the base model), model 2a, model 2b, and model 3.
Model 1, the base model: This model was developed to assess the individual impacts of the main demographic and genetic factors holding all else constant. In particular, the base model, as well as all subsequent models in which the base model is nested, included the same fixed effects for all combinations of ADNI/NACC and MCI/D transitions: age at visit (centered at 50 years of age), gender, education, ApoE ɛ4 status, and time since last visit (centered at one year). Unique subject identifier/Roster ID (RID) was included as a random factor (random intercept) in all models to incorporate the correlation between observations from a single individual, thus accounting for the repeated measure data structure of longitudinal studies. The RID variable can also be interpreted as accounting for, to some extent, any differences between individuals that have not already been represented by other variables in the analysis. These differences can be due to a number of other factors, for example, medical conditions or psychosocial factors. The Intraclass Correlation Coefficient (ICC) was used to assess the proportion of the total variation that is explained by the way in which repeated observations are clustered within individuals. In other words, the ICC helps to inform the extent to which the likelihood of back-transitioning is due to the differences between individuals after having accounted for the other explanatory variables.
Models 2a and 2b: The impact of the cognitive functions as assessed by the scores in MMSE and ADAS-Cog 11 tests were considered in model 2a and model 2b, respectively, by adding a new variable coded for each of these tests to the base model in an iterative manner. Since the cognitive scores are used as diagnostic criteria and it is expected that individuals classified to less severe states do better in cognitive tests, in the models we incorporated the scores only at the MCI and D diagnosis of the previous assessment (i.e., before the MCI→CN/MCI/D and D→CN/MCI/D transitions).
Model 3: The potential impact of depression on the occurrence of back-transitions was considered by incorporating in the base model the GDS of individuals relative to their previous visit, with positive values indicating potential increased depression since their previous visit.
To estimate the parameters of the models, subsets of each of the main datasets were used based on whether we were considering transitions to less severe states starting from MCI or D. A new variable, ‘previous diagnosis’, was derived and used to subset the data based on previous diagnoses of either MCI or D. Whether an individual did or did not transition to a less severe state at the visit in question was then determined by comparing the diagnosis at the visit with the diagnosis at their previous visit.
GLMMs were implemented using the R2MLwiN package in R [31]. Statistical significance was calculated using a 95% confidence level. More details about the statistical model and the fitting procedure are provided in the Supplementary Material A.
RESULTS
The analysis of the two datasets, ADNI and NACC, shows that a significant number of participants moved to a previous clinical state during the disease development cascade. The number of individuals that moved backwards (either from MCI to CN or from D to CN or MCI) at least once within a year is presented in Table 1. In ADNI, out of the 855 individuals that reached MCI, 73 (i.e., 8.54%) individuals moved back to CN. A lower proportion has moved backwards to MCI after reaching dementia. In particular, out of the 497 individuals that reached the dementia state, 17 (i.e., 3.42%) moved at least once back to MCI. In NACC, a very high proportion of individuals (607 out of the 2,764 individuals, i.e., 21.96%) that reached MCI transitioned back to the CN state. This higher proportion of backward transitions from the MCI state that is observed in NACC might be due to the different subtypes of MCI that are included in this dataset. 150 of 4,002 (3.75%) individuals previously diagnosed with dementia moved back to MCI within a year, a proportion similar to that observed in ADNI. 30 of these demented individuals (0.75%) have directly transitioned backwards to CN.
Table 1
Proportion of individuals that transitioned at least once within one year from MCI to CN and from D to CN or to MCI, in each sub-group in ADNI and NACC. It should be noted that here, for comparisons, any transitions at the 6-month and 18-month visits in ADNI have not been taken into account in the transitions of year 1 and year 2, respectively. PX-{} denotes the number of individuals in each sub-group that transitioned at least once within one year from state X to any of the states in {}
| PMCI→{CN}/ | PD→{CN}/ | PD→{MCI}/ | |||||
| PMCI→{CN, MCI, D} | PD→{CN, MCI, D} | PD→{CN, MCI, D} | |||||
| ADNI | NACC | ADNI | NACC | ADNI | NACC | ||
| Total in the datasets considered | 73/855 (8.54%) | 607/2,764 (21.96%) | 0/497 (0%) | 30/4,002 (0.75%) | 17/497 (3.42%) | 150/4,002 (3.75%) | |
| ≤70 | 39/277 (14.08%) | 222/746 (29.76%) | 0/121 (0%) | 10/1,138 (0.88%) | 6/121 (4.96%) | 39/1,138 (3.43%) | |
| Chronological age at baseline | 70<Age≤80 | 25/408 (6.13%) | 231/1,187 (19.46%) | 0/264 (0%) | 18/1,655 (1.09%) | 9/264 (3.41%) | 67/1,655 (4.05%) |
| >80 | 9/170 (5.29%) | 154/831 (18.53%) | 0/112 (0%) | 2/1,209 (0.16%) | 2/112 (1.79%) | 44/1,209 (3.64%) | |
| Gender | Women | 34/351 (9.69%) | 329/1,455 (22.61%) | 0/205 (0%) | 16/2,144 (0.75%) | 5/205 (2.44%) | 70/2,144 (3.26%) |
| Men | 39/504 (7.74%) | 278/1,309 (21.24%) | 0/292 (0%) | 14/1,858 (0.75%) | 12/292 (4.11%) | 80/1,858 (4.31%) | |
| ≤12 | 4/136 (2.94%) | 145/707 (20.51%) | 0/102 (0%) | 8/1,387 (0.58%) | 3/102 (2.94%) | 49/1,387 (3.53%) | |
| Years of education* | >12 | 69/719 (9.60%) | 461/2,052 (22.47%) | 0/395 (0%) | 22/2,592 (0.85%) | 14/395 (3.54%) | 101/2,592 (3.90%) |
| non-carriers | 45/427 (10.54%) | 363/1,368 (26.53%) | 0/165 (0%) | 18/1,419 (1.27%) | 7/165 (4.24%) | 67/1,419 (4.72%) | |
| Genetic Background (ApoE varepsilon 4)* | Carriers of 1 ɛ4 allele | 26/337 (7.71%) | 146/811 (18.00%) | 0/235 (0%) | 10/1,455 (0.69%) | 9/235 (3.83%) | 43/1,455 (2.95%) |
| Carriers of 2 ɛ4 alleles | 2/91 (2.20%) | 17/169 (10.06%) | 0/97 (0%) | 1/430 (0.23%) | 1/97 (1.03%) | 7/430 (1.63%) | |
[i] *Note that in NACC, the educational attainment was not recorded for all individuals. Similarly for the presence or absence of any ApoE ɛ4 in both ADNI and NACC.
As shown in Supplementary Figure B1, some of the participants have moved between MCI and CN at least five times (3 MCI→CN transitions). On the other hand, previously diagnosed CN individuals have been classified in the MCI state in a significant number of consecutive assessments (up to 4 assessments in NACC) before their classification back to the CN state. Previously diagnosed MCI individuals have also been diagnosed with dementia in a number of consecutive assessments (up to 4 in ADNI and 5 in NACC) before their classification again into the MCI state (see Supplementary Table B1). These results exclude the large number of transitions of individuals who entered the studies as MCI or D and transitioned backwards to CN or MCI, as the time since the transition to MCI or D diagnosed at the beginning of the study is unknown. Supplementary Table B2 shows the number of these transitions. It is observed that in some cases individuals that have been classified in either MCI or D at baseline have remained in these states even in ten and eight consecutive assessments, respectively (in duration of up to ten and eight years, respectively) before their movement back to CN or MCI states.
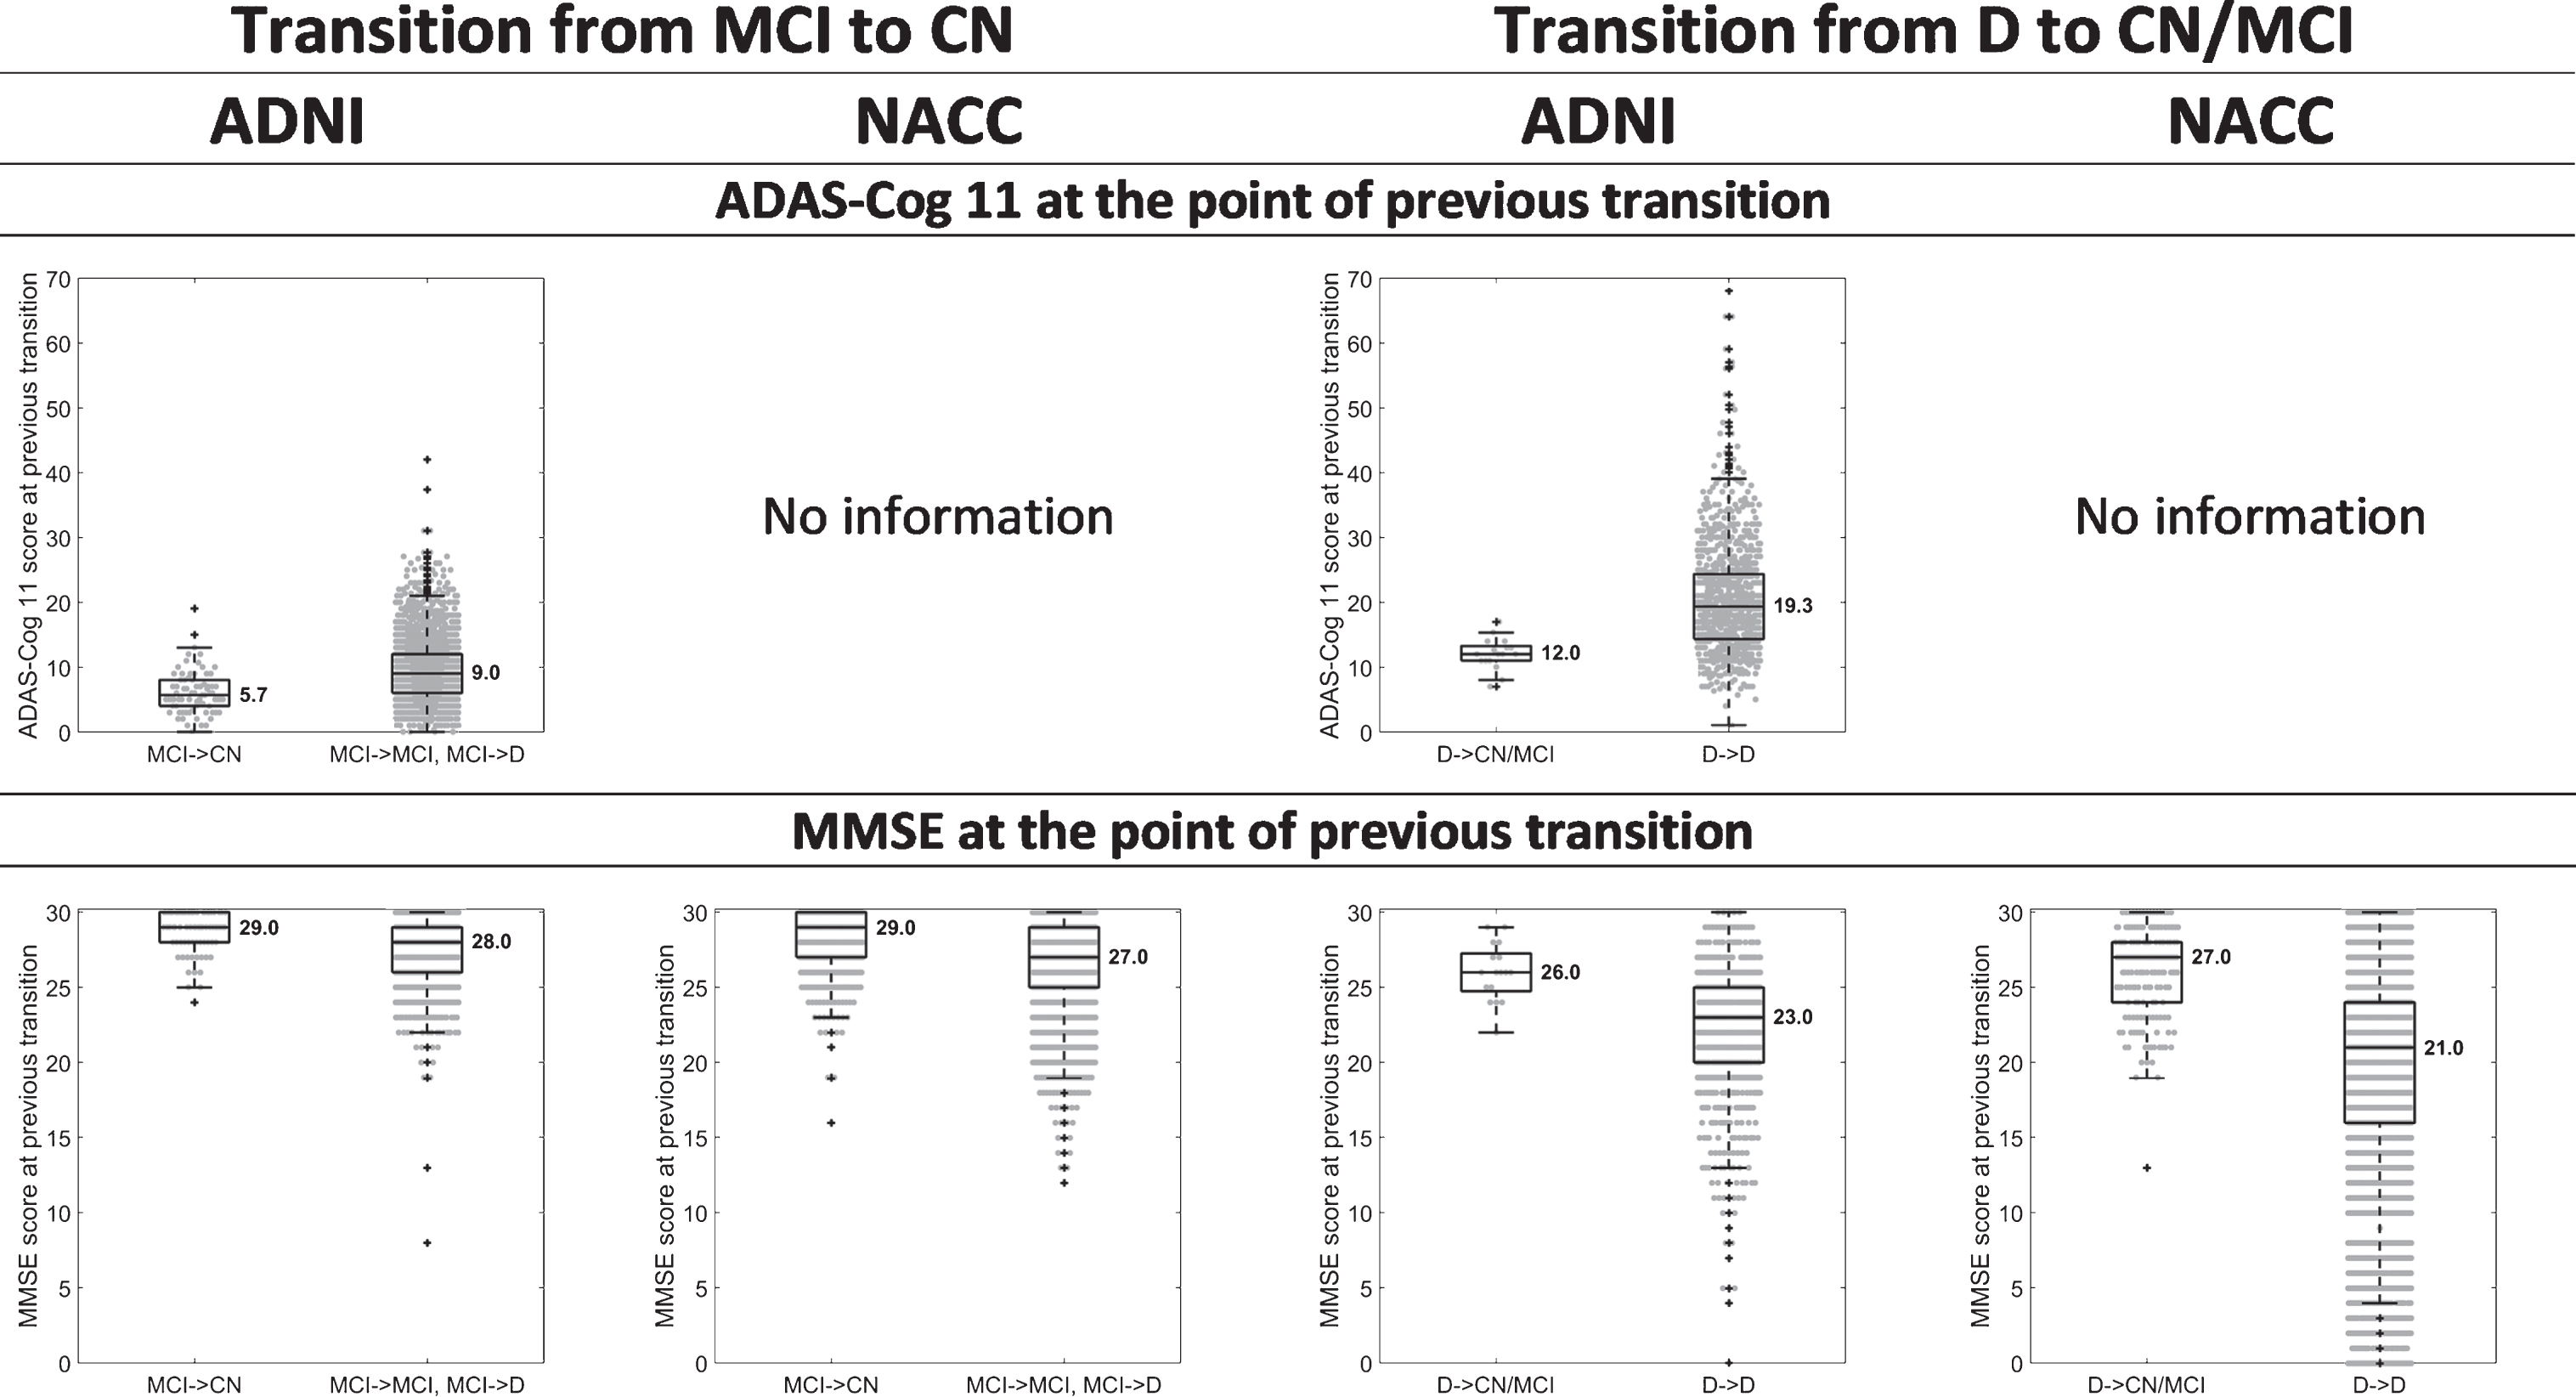
Figure 2 shows box-and-whisker plots of age, years of education, ADAS-Cog 11, and MMSE scores at the visit where participants that had reached MCI or D in the assessment of the previous year moved backwards, and at the visit where participants that had reached MCI or D in the previous year remained either at the same state or moved forward. Figure 3 shows box-and-whisker plots to illustrate differences in ADAS-Cog 11 and MMSE scores at the point of previous diagnosis between back-transitioners and those who have never transitioned backwards.
Fig. 2.
Box-and-whisker plots indicating differences in the median and variability of age, years of education, ADAS-Cog 11 and MMSE scores, between 1) those that transitioned from MCI to CN (MCI→CN) and those that transitioned from MCI to D (MCI→D) or remained at MCI (MCI→MCI), 'when assessed one year after the MCI diagnosis; and 2) those that transitioned from D to CN or MCI (D→CN/MCI) and those that remained at D (D→D), when assessed one year after the D diagnosis. The values presented are at the point of last diagnosis, i.e., at the point of the CN, last MCI, and D diagnoses for the MCI→CN, MCI→MCI, and MCI→D transitions, respectively, and at the point of the CN, MCI, and last D diagnoses for the D→CN, D→MCI, and D→D transitions, respectively. For the years of education, we compared those individuals that transitioned backwards at least once during the course of the study against those that remained at the same state or moved forward (and never backwards), so that to avoid taking into account multiple times the education of a single individual.
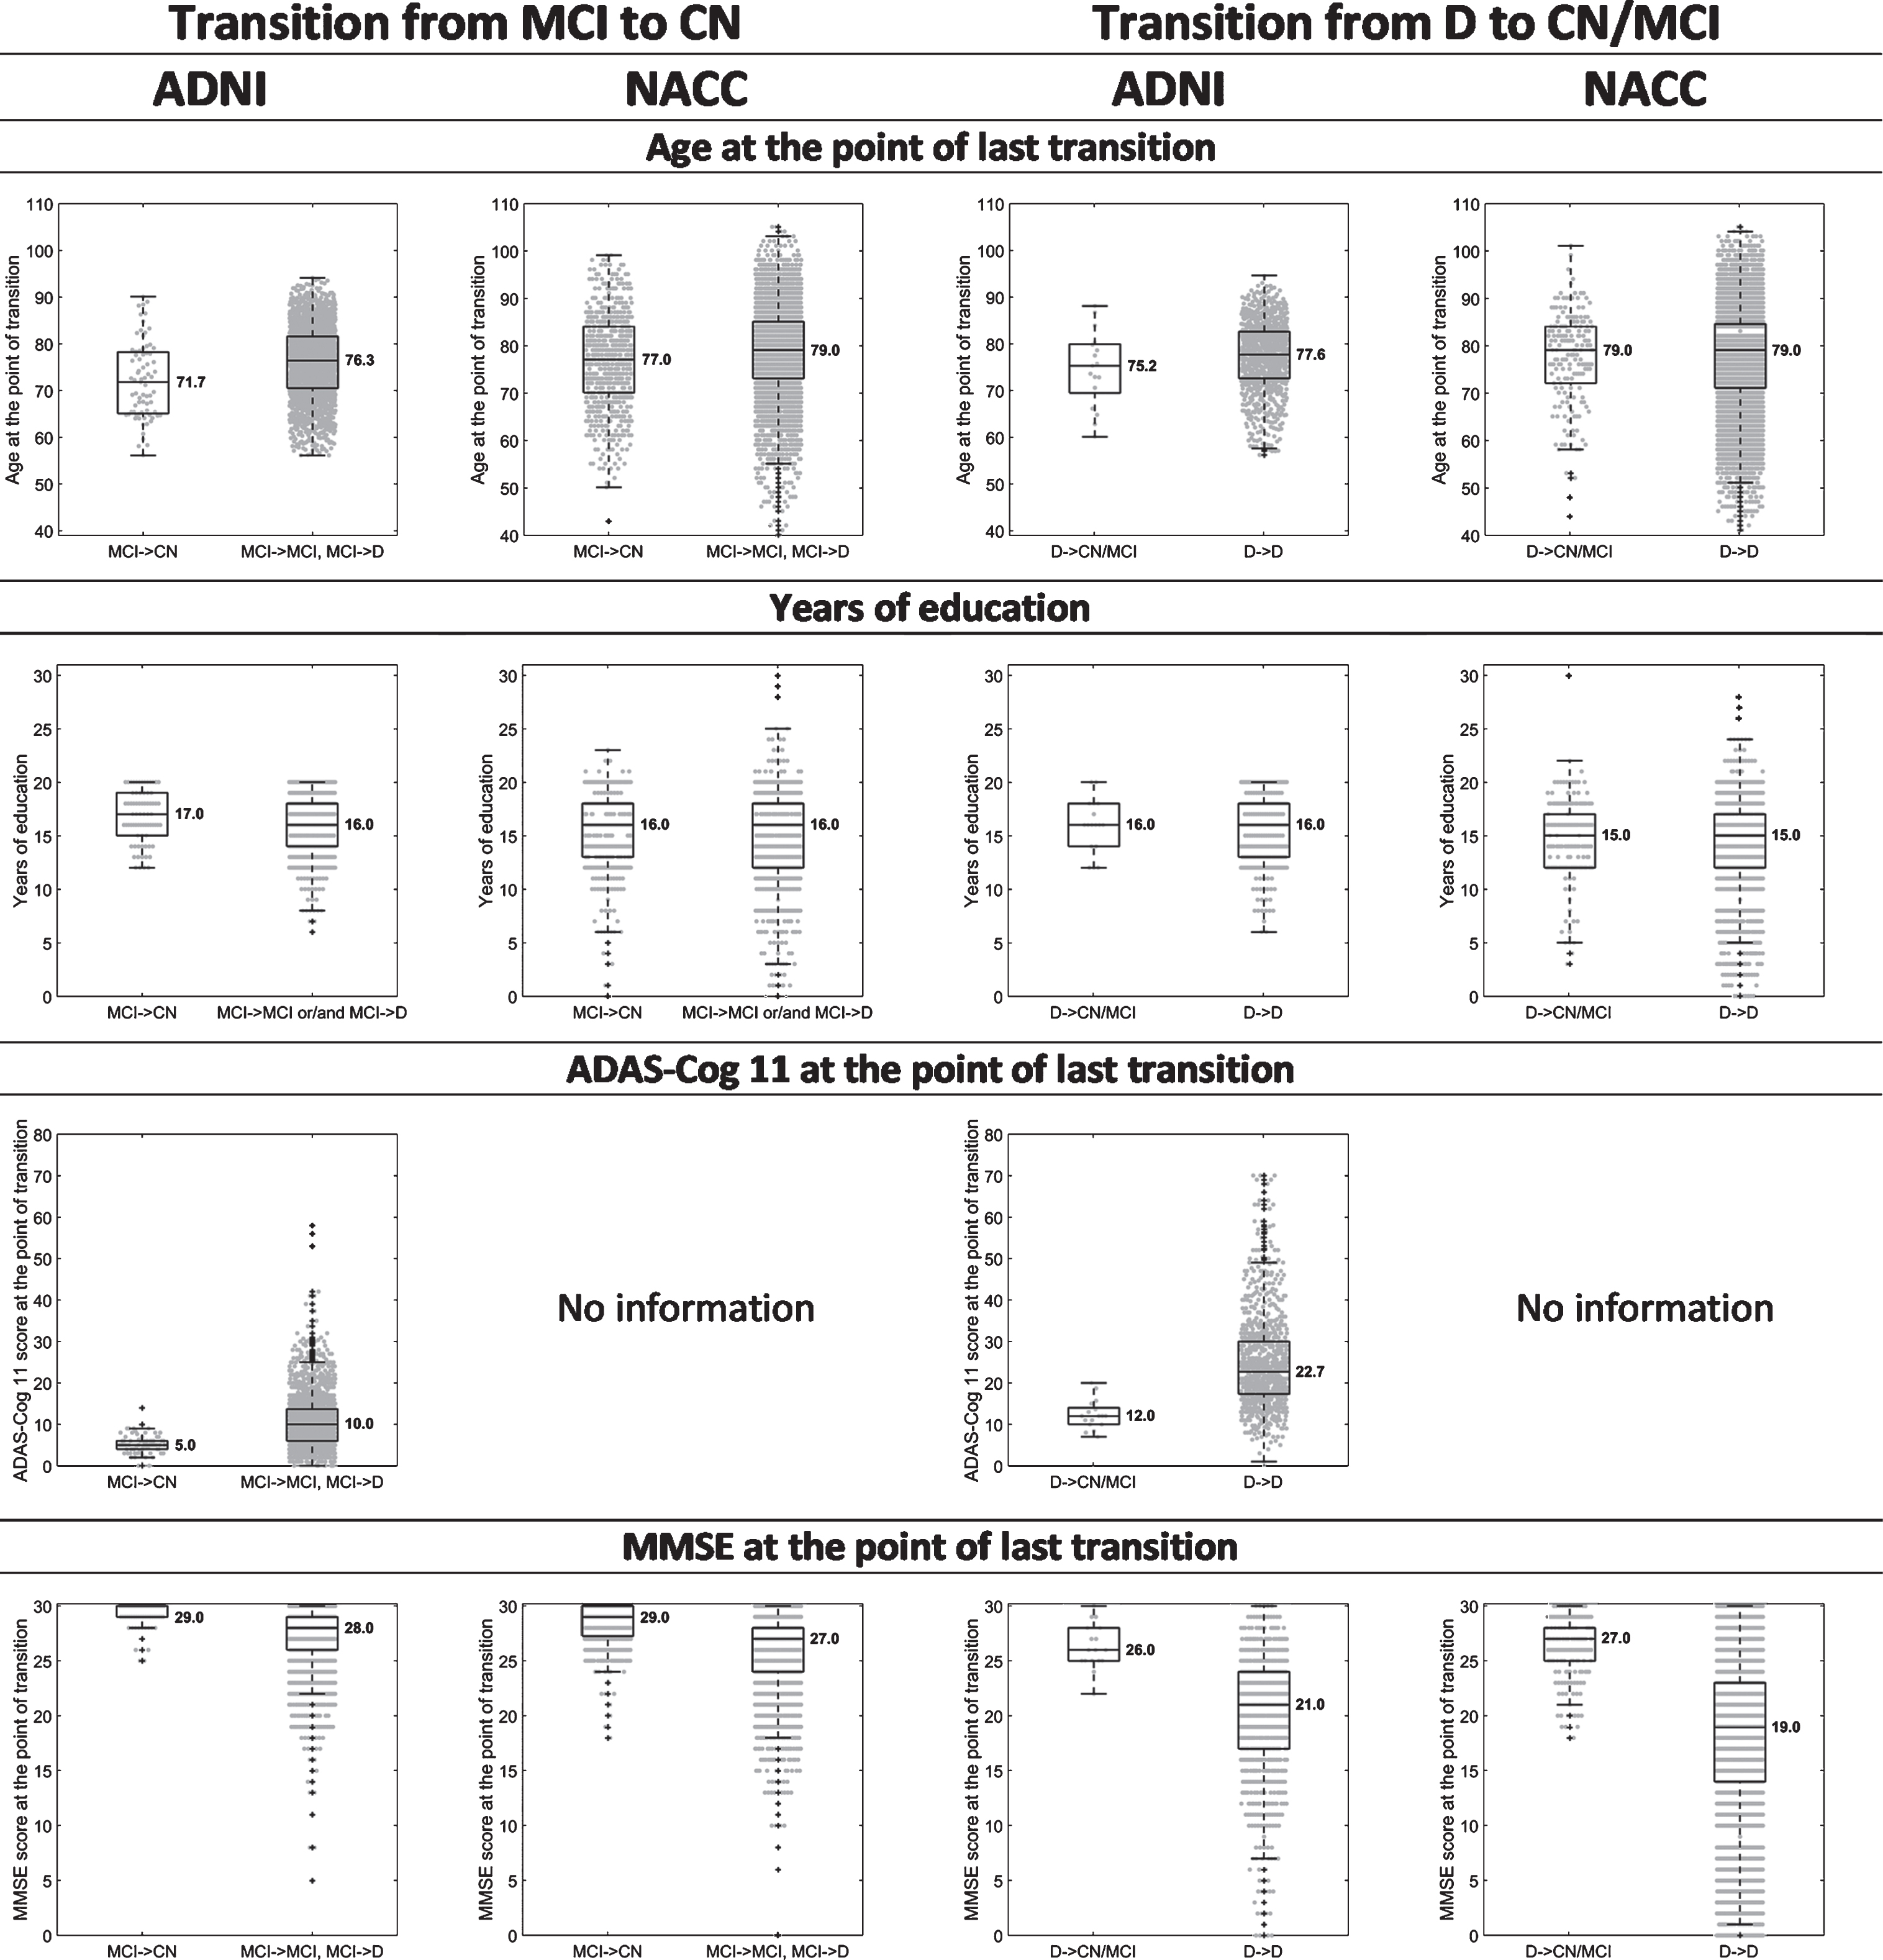
Fig. 3.
Box-and-whisker plots indicating differences in the median and variability of ADAS-Cog 11 and MMSE scores, between 1) those that transitioned from MCI to CN (MCI→CN) and those that transitioned from MCI to D (MCI→D) or remained at MCI (MCI→MCI), when assessed one year after the MCI diagnosis; and 2) those that transitioned from D to CN or MCI (D→CN/MCI) and those that remained at D (D→D), when assessed one year after the D diagnosis. The values presented are at the point of previous diagnosis, i.e., at the point of the first MCI diagnosis for the MCI→CN, MCI→MCI, and MCI→D transitions and at the point of the first D diagnosis for the D→CN, D→MCI, and D→D transitions.
Analysis of the output of the statistical models
The inclusion and exclusion criteria that have been used for the development of the base model yielded data from 1,208 participants in ADNI and 4,941 in NACC. These are participants that have reached either MCI or D and had the chance to transition to a previous clinical state in a subsequent visit. The baseline characteristics of these participants and other features are presented in Table 2. It should be noted that this is also a good representation of the characteristics of the sample used in the other models. The significance of the effect of the factors considered in the base model on the occurrence of MCI→CN transitions is presented in Table 3. Table 4 shows the potential influence of these factors on D→CN/MCI transitions. The additional influence of cognitive performance and GDS as considered in Model 2 and Model 3 are presented in the Supplementary Tables C1-C6.
Table 2
Baseline number and characteristics of individuals in ADNI and NACC datasets that have been used in the base model. The datasets used consist of those individuals that have reached either MCI or D and had the chance to transition backwards in a subsequent assessment. Data on all characteristics that are incorporated into the base model is available. It should be noted that the table also provides a good description of the sample used for the development of the other statistical models
| Dataset | |||||||||
| ADNI | NACC | ||||||||
| Total number of individuals considered | 1,208 | 4,941 | |||||||
| Cognitive state at baseline | CN | MCI | D | CN | MCI | D | |||
| Total number of individuals at each state | 67 (5.55%) | 827 (68.46%) | 314 (25.99%) | 724 (14.65%) | 1,753 (35.48%) | 2,464 (49.87%) | |||
| Chronological age | ⩽70 | 7 (0.58%) | 279 (23.10%) | 76 (6.29%) | 147 (2.97%) | 540 (10.93%) | 788 (15.95%) | ||
| 70<Age≤80 | 47 (3.89%) | 384 (31.79%) | 156 (12.91%) | 286 (5.79%) | 762 (15.42%) | 981 (19.85%) | |||
| >80 | 13 (1.08%) | 164 (13.58%) | 82 (6.79%) | 291 (5.89%) | 451 (9.13%) | 695 (14.07%) | |||
| Gender | Women | 28 (2.32%) | 334 (27.65%) | 140 (11.59%) | 435 (8.80%) | 879 (17.79%) | 1,323 (26.78%) | ||
| Men | 39 (3.23%) | 493 (40.81%) | 174 (14.40%) | 289 (5.85%) | 874 (17.69%) | 1,141 (23.09%) | |||
| ≤12 | 8 (0.66%) | 141 (11.67%) | 76 (6.29%) | 172 (3.48%) | 434 (8.78%) | 892 (18.05%) | |||
| Years of education | >12 | 59 (4.88%) | 686 (56.79%) | 238 (19.70%) | 552 (11.17%) | 1,319 (26.69%) | 1,572 (31.81%) | ||
| Genetic Background (ApoE ɛ4) | non-carriers | 43 (3.56%) | 403 (33.36%) | 100 (8.28%) | 482 (9.75%) | 977 (19.77%) | 1,011 (20.46%) | ||
| Carriers of 1 ɛ4 allele | 21 (1.74%) | 332 (27.48%) | 151 (12.50%) | 218 (4.41%) | 624 (12.63%) | 1,107 (22.40%) | |||
| Carriers of 2 ɛ4 alleles | 3 (0.25%) | 92 (7.62%) | 63 (5.21%) | 24 (0.49%) | 152 (3.08%) | 346 (7.00%) | |||
| Other characteristics (standard deviation of the mean in brackets) | |||||||||
| Average age | 75.49 (5.26) | 73.10 (7.52) | 74.80 (7.69) | 77.68 (9.11) | 74.41 (9.02) | 74.21 (9.83) | |||
| Years of education | 15.18 (2.96) | 15.96 (2.76) | 15.92 (2.85) | 15.21 (3.25) | 15.29 (3.33) | 14.35 (3.71) | |||
| ADAS-Cog 11 score | 6.82 (2.97) | 10.35 (4.57) | 19.39 (6.68) | - | - | - | |||
| MMSE score | 29.06 (1.09) | 27.58 (1.81) | 23.30 (2.05) | 28.56 (1.54) | 27.12 (2.38) | 21.14 (5.68) | |||
| Time between visits (years)* | 0.95 (0.39) | 0.76 (0.34) | 0.63 (0.24) | 1.19 (0.53) | 1.16 (0.51) | 1.12 (0.43) | |||
| Total follow-up (years) | 7.04 (3.00) | 3.77 (2.13) | 1.56 (0.70) | 5.44 (2.00) | 4.18 (1.93) | 3.81 (1.72) | |||
[i] *The 6-month and 18-month visits in ADNI have been taken into account.
Table 3
Potential factors associated with the MCI→CN transitions in the base model. n represents the number of assessments used to develop the GLMMs, i.e., the number of MCI cases that had the chance to transition to a previous clinical state in a subsequent assessment. CI: credible interval, SD: standard deviation, ICC: intraclass correlation coefficient, p: p-value, *:p≤0.05, **:p≤0.01, ***:p≤0.001
| Base model, MCI→CN | ADNI (n = 3,458) | NACC (n = 5,642) | ||||
| Fixed effects | Odds Ratio | (95% CI) | p | Odds Ratio | (95% CI) | p |
| Age at visit | 0.93 | (0.89, 0.98) | ** | 0.95 | (0.94, 0.97) | *** |
| Gender (male+) | 1.12 | (0.55, 2.27) | 1.28 | (0.98, 1.67) | ||
| Education (≤12 years+) | 5.29 | (1.3, 21.53) | * | 1.21 | (0.87, 1.66) | |
| ApoE ɛ4, 1 allele (absence of ApoE ɛ4+) | 0.70 | (0.33, 1.48) | 0.43 | (0.32, 0.59) | *** | |
| ApoE ɛ4, 2 alleles (absence of ApoE ɛ4+) | 0.17 | (0.03, 0.93) | * | 0.10 | (0.05, 0.22) | *** |
| Time between visits | 2.72 | (1.34, 5.52) | ** | 1.30 | (1.08, 1.57) | ** |
| Intercept | 0.01 | (0.00, 0.07) | *** | 0.27 | (0.16, 0.46) | *** |
| Random effects | Variance | SD | ICC | Variance | SD | ICC |
| Roster ID (Intercept) | 4.98 | 2.23 | 0.60 | 4.00 | 2.00 | 0.55 |
[i] +Reference category.
Table 4
Potential factors associated with transitions from D to less severe states (CN or MCI) in the base model. n represents the number of assessments used to develop the GLMMs, i.e., the number of dementia cases that had the chance to transition to a previous clinical state in a subsequent assessment. CI: credible interval, SD: standard deviation, ICC: intraclass correlation coefficient, p: p-value, *:p≤0.05, **:p≤0.01, ***:p≤0.001
| Base model, D→CN/MCI | ADNI (n = 1,429) | NACC (n = 10,167) | ||||
| Fixed effects | Odds Ratio | (95% CI) | p | Odds Ratio | (95% CI) | p |
| Age at visit | 0.95 | (0.90, 1.01) | 0.97 | (0.94, 1.01) | ||
| Gender (male+) | 0.48 | (0.19, 1.25) | 0.52 | (0.25, 1.09) | ||
| Education (≤12 years+) | 1.96 | (0.51, 7.53) | 0.78 | (0.36, 1.69) | ||
| ApoE ɛ4, 1 allele (absence of ApoE ɛ4+) | 0.83 | (0.35, 1.96) | 0.34 | (0.15, 0.76) | ** | |
| ApoE ɛ4, 2 alleles (absence of ApoE ɛ4+) | 0.07 | (0.01, 1.00) | 0.07 | (0.01, 0.32) | *** | |
| Time between visits | 3.00 | (0.99, 9.10) | 1.33 | (0.81, 2.17) | ||
| Intercept | 0.06 | (0.01, 0.50) | ** | 6.1E-04 | (7.0E-04, 5.5E-03) | *** |
| Random effects | Variance | SD | ICC | Variance | SD | ICC |
| Roster ID (Intercept) | 0.078 | 0.28 | 0.02 | 21.08 | 4.59 | 0.87 |
[i] +Reference category.
Chronological age: Age is shown to be a significant factor associated with back-transitions from MCI to CN in both ADNI and NACC datasets (see Table 3). In particular, younger individuals are more likely to move backwards after an MCI diagnosis. Although age is not significantly associated with transitions from D to MCI, the results also show that younger individuals tend to be more likely to move backwards when they reach the dementia state (Table 4, see also Fig. 2). This may suggest that younger individuals can better tolerate potential brain changes than older people and consequentially maintain a better test result.
Gender: Although statistical significance was not achieved for gender, in most of the cases, the output of the model suggests that there is a trend toward higher likelihood of transitioning back to CN from the MCI state for females (see Table 3), whereas males are more likely to move from dementia back to CN and MCI states in a subsequent assessment (see Table 4, see also the difference in the proportions of women and men that moved backwards from MCI and D in Table 1).
Education: Utilizing the ADNI dataset, the base model suggests that education is also a significant factor associated with MCI→CN transitions, with highly educated people (>12 years of education) being more likely to move back to the CN state after their classification in the MCI state in the previous assessment (see Table 3). A significant association between education and the occurrence of MCI→CN transitions is not verified when NACC data is used. However, even in NACC a high number of years of education seems to increase the likelihood of CN diagnosis in already diagnosed MCI individuals. The effect of education, as suggested by the output of the models, might be a feature of cognitive reserve of educated people and their ability to temporarily resist apparent cognitive decline, at least at earlier states in disease development. At the dementia state the effect of education is questionable in both studies, perhaps due to the small sample sizes; no significant association was found, and Odds Ratio > 1 in ADNI, whereas Odds Ratio < 1 in NACC (Table 4).
Genetic background: In NACC, it is shown that the presence of ApoE ɛ4 alleles is significantly associated with the occurrence of back-transitions, with ApoE ɛ4 carriers being less likely to move backwards either from MCI or D. This was not confirmed in ADNI where only the presence of two alleles of ApoE ɛ4 was shown to be a significant factor associated with MCI→CN transitions. However, carriers of one ApoE ɛ4 allele in ADNI also tend to be less likely to move backwards in disease development from any of the clinical states.
Time between visits: In both ADNI and NACC, the duration between two assessments is strongly associated with the transition of MCI individuals back to the CN state. Although statistical significance was not shown for back-transitions from the dementia state, in all the cases, the longer the duration between two assessments, the higher the chance of individuals moving backwards from any of the disease states. This might be related to the frequency of patient-clinician contact, with the chance of a misdiagnosis being increased when the patient is not assessed frequently and adequately.
Unique subject identifier/Roster ID (RID): In most models, a high proportion of the total variance was explained by individual patient differences. These could be unaccounted for measures such as medications, but a high intra-class correlation coefficient (ICC) also indicates that the probability of transitioning back to a less severe clinical state varies more between people, than within observations for an individual.
Cognitive performance: The models incorporating cognitive function that was assessed by MMSE and ADAS-Cog 11 tests before back-transitions (Models 2a and 2b) suggest that the score in these tests is significantly associated with both MCI→CN and D→CN/MCI transitions, with individuals performing better in the tests being more likely to move backwards in the subsequent assessment (see Supplementary Tables C1-C4. See also Figs. 2 and 3).
Depression scores (GDS): When GDS is incorporated into the statistical model (Model 3), it is shown that this is not a significant factor associated with the occurrence of back-transitions (see Supplementary Tables C5-C6). This may contradict conclusions of previous studies suggesting that the presence of depression might be an important determinant in the misclassification of cognitively normal individuals in more severe states due to poor performance in cognitive tests [32]. However, as mentioned earlier, due to the inclusion and exclusion criteria used in both ADNI and NACC, and the reduced number of visits where GDS was recorded, these findings and conclusions should be subject to caution in interpretation.
DISCUSSION
There is no significant body of scientific evidence as yet that suggests the condition of cognitively impaired individuals developing a neurodegenerative disease can improve over time, with or without therapy. However, in the available observational longitudinal studies, it is clear that a significant number of cognitively impaired and demented individuals move to less severe clinical states or even recover to a normal cognitive state.
We studied two large longitudinal cohort datasets, ADNI and NACC, to explore factors that could be associated with transitions of individuals to earlier clinical states. In some cases, the analysis of the datasets yielded different results. This can be partly attributed to variation in recruitment and inclusion criteria for the two cohort databases, differences in the sample size and the demographic characteristics of the sample in each diagnostic group, and other differences in the protocols. The nature and level of impairment and disease severity at the different clinical states as defined in the two datasets could also be an important factor. For example, in ADNI all enrolled MCI subjects were amnestic MCI; amnestic MCI may represent a more stable group and individuals in this group are more likely to convert to clinically probable AD within a few years [33]. Hence, the occurrence of back-transitions from MCI may be less frequent in ADNI than in NACC where different types of MCI are included. In addition, both datasets include data obtained from multiple longitudinal aging studies. In NACC, the procedure of clinical diagnosis, as well as the recruitment and follow-up procedures, may vary according to the protocol of each ADC. For example, some ADCs diagnose participants blinded to the previous diagnoses, and these centers have higher back-transition rates (see also [10, 11]). ADNI is also a multisite, multi-study program, and it is also observed that back-transitions are more frequent in some sites than in others. Extended models should incorporate different types of MCI. Whenever possible, they should also control for research center and potentially for clinician, so they account for variability due to the different ADCs and assessments by multiple clinicians (see for example [9]).
Despite differences between the two datasets, analyses suggest some underlying common patterns. It was shown that in both datasets, younger individuals are more likely to recover to normal cognition from an MCI state. Although not always a statistically significant factor, education was also shown to play an important role in the presence of back-transitions with highly educated people being more likely to move from MCI to CN state. This might support the hypothesis that despite the presence of pathological changes, young and highly educated individuals are more resilient, leading to the absence of observable clinical effects and delays in the accurate diagnosis of mental state. The effect of gender is less clear-cut; although the analysis showed that it is not a significant factor associated with back-transitions, females tended to be more likely to transition backwards to CN from MCI, whereas back-transitions from dementia seemed to be more likely in males. The presence of symptoms of depression was not shown to be significantly associated with back-transitions, but the data used in this study may not be sufficient for drawing robust conclusions on the effect of depression. According to the analysis, APOE ɛ4 is a significant factor associated with back-transitions from the MCI state, with carriers of APOE ɛ4 being less likely to move backwards in the development of the disease. In NACC, it was shown that this genetic factor is significantly associated with back-transitions even from an advanced disease state. The significant association of this factor with back-transitions has also been confirmed in autopsied subjects in other studies [9]. In general, our analyses showed that once a transition to dementia has occurred, then only a few factors can significantly affect the transition of individuals to an earlier stage. This could of course arise due to the limited number of observations of people moving to the MCI state after a previous classification to the dementia state. However, it is also expected that this may occur because once individuals reach a severe state, they may no longer mask the serious and irreversible changes in the brain.
The analysis performed in the current study has a number of limitations. It is well known that all the clinical states, and MCI in particular, are heterogeneous in the sense that a broad range of cognitive abilities is covered within a state [9, 38]. Due to the small sample size and insufficient information, we have not considered any subtypes within the clinical states. However, it is likely that the significant effect of some of the factors considered might change, especially when subtypes of MCI and AD/dementia are considered [6]. The outputs of the analysis may also be affected by the duration of the studies and withdrawal rates, as the clinical states that individuals will reach in the future are not known. As such, and most importantly, the analysis is censored with incomplete outcome data on individuals. In addition, both ADNI and NACC consist of highly selective populations that are at a high risk of developing AD or other dementias. The proportions of highly educated people and ApoE ɛ4 carriers are also higher than what would be observed in a population-based sample. It would thus be interesting to consider in future studies whether the present results can be validated in population-based studies outside clinical settings.
The current study does not consider whether the improvement in clinical outcome is connected to an improvement in the pathological condition. Some studies suggest that this is not necessarily true (see also [9]). Misdiagnosis is very common for multiple types of cognitive impairment and dementia, even when using strict diagnosis criteria for the classification of individuals in the different clinical states. For AD in particular, it has been shown that a high proportion, which can be up to 30%, of subjects diagnosed with probable AD, may not actually display AD-typical neuropathological changes at autopsy [12, 13]. A high number of misdiagnosis cases has also been observed at the MCI state [9]. An analysis of the transitions between states defined within the NIA-AA research framework [36, 37], which focuses on the diagnosis of AD with biomarkers (amyloid-β deposition, pathologic tau, and neurodegeneration), has also shown that in many cases, back-transitions to less severe clinical states is not confirmed by the improvement in the level of any of the biomarkers used for the classification in the NIA-AA states. On the other hand, we cannot rule out the possibility of some of the back-transitions being real. One could suggest that back-transitions are associated with a slower progression towards AD and other dementias. Although the numbers of individuals that transitioned backwards but eventually reached dementia are very small in our samples from two datasets, one can show that the time required to reach the dementia state since the first MCI diagnosis is higher for back-transitioners compared to that of individuals that developed dementia and had never moved backwards in disease development. This finding still needs to be verified using studies with bigger samples and longer follow-up, but it may suggest that in some cases back-transitions are part of the process and an indication of a slower dementia progression.
In either way, with the current diagnostic tools, many factors can affect diagnosis and the occurrence of back-transitions, ranging from lifestyle factors to the presence of comorbidities. Indeed, due to such factors, individuals can also be misclassified in any of the more severe states. In the two datasets considered, many of the individuals that moved backwards from the MCI state to the CN state either have never reconverted to MCI, or they have moved again back to MCI but have never developed dementia during the study. Although individuals who transitioned backwards from MCI and have never transitioned again back to MCI or have never developed dementia could have pathological features similar to those in the MCI group [9], these observations could support the idea that in some cases there might be a misclassification to the more severe state, although a longer follow-up would be required in order to verify this. The analysis of the datasets also showed that most of the people who back-transitioned are classified in the more severe states only for a short time. This may imply that the accuracy in diagnosis increases over time and that clinicians should potentially assess a longitudinal follow-up of cognitive performance before the classification of individuals, at least at the MCI state. On the other hand, this also raises questions about the definition of the MCI state and the criteria used for the classification of individuals to it, plus the reliability of this state and whether it can be a real risk state and precursor of AD or related dementias [3, 9, 34, 35]. It is worth noting that based on the physician confidence in diagnosis score which is available only in ADNI (in the ADNI-1 protocol) up to the first two years in the study (in 3,867 assessments), in 54.6% of the MCI diagnoses the clinician was not highly confident when they made the diagnosis. The confidence in diagnosis was higher at the healthy and dementia stages; 80.8% of CN diagnoses and 64.3% of the dementia diagnoses were made with high confidence.
Whether the factors considered in this study facilitate the improvement of the cognitive state or contribute to misdiagnosis remains uncertain and it would be something interesting to investigate in subsequent studies. The development of better diagnostic tools will enable an accurate description of the clinical severity of AD and other dementias, and especially will aid in early detection of neuropathologic changes. This will require the examination of, not only a summary mental status score, but also a combination of biochemical and neuroimaging biomarkers, taking into account the cognitive reserve hypothesis and demographic plus genetic factors [21, 39].
ACKNOWLEDGMENTS
This study was funded by the Janssen Prevention Center.
The authors would like to thank the two anonymous reviewers for their constructive comments and input.
Data collection and sharing for this project was funded by the Alzheimer’s Disease Neuroimaging Initiative (ADNI) (National Institutes of Health Grant U01 AG024904) and DOD ADNI (Department of Defense award number W81XWH-12-2-0012). ADNI is funded by the National Institute on Aging, the National Institute of Biomedical Imaging and Bioengineering, and through generous contributions from the following: AbbVie, Alzheimer’s Association; Alzheimer’s Drug Discovery Foundation; Araclon Biotech; BioClinica, Inc.; Biogen; Bristol-Myers Squibb Company; CereSpir, Inc.; Cogstate; Eisai Inc.; Elan Pharmaceuticals, Inc.; Eli Lilly and Company; EuroImmun; F. Hoffmann-La Roche Ltd and its affiliated company Genentech, Inc.; Fujirebio; GE Healthcare; IXICO Ltd.; Janssen Alzheimer Immunotherapy Research & Development, LLC.; Johnson & Johnson Pharmaceutical Research & Development LLC.; Lumosity; Lundbeck; Merck & Co., Inc.; Meso Scale Diagnostics, LLC.; NeuroRx Research; Neurotrack Technologies; Novartis Pharmaceuticals Corporation; Pfizer Inc.; Piramal Imaging; Servier; Takeda Pharmaceutical Company; and Transition Therapeutics. The Canadian Institutes of Health Research is providing funds to support ADNI clinical sites in Canada. Private sector contributions are facilitated by the Foundation for the National Institutes of Health (http://www.fnih.org). The grantee organization is the Northern California Institute for Research and Education, and the study is coordinated by the Alzheimer’s Therapeutic Research Institute at the University of Southern California. ADNI data are disseminated by the Laboratory for Neuro Imaging at the University of Southern California.
The NACC database is funded by NIA/NIH Grant U01 AG016976. NACC data are contributed by the NIAfunded ADCs: P30 AG019610 (PI Eric Reiman, MD), P30 AG013846 (PI Neil Kowall, MD), P50 AG008702 (PI Scott Small, MD), P50 AG025688 (PI Allan Levey, MD, PhD), P50 AG047266 (PI Todd Golde, MD, PhD), P30 AG010133 (PI Andrew Saykin, PsyD), P50 AG005146 (PI Marilyn Albert, PhD), P50 AG005134 (PI Bradley Hyman, MD, PhD), P50 AG016574 (PI Ronald Petersen, MD, PhD), P50 AG005138 (PI Mary Sano, PhD), P30 AG008051 (PI Thomas Wisniewski, MD), P30 AG013854 (PI M. Marsel Mesulam, MD), P30 AG008017 (PI Jeffrey Kaye, MD), P30 AG010161 (PI David Bennett, MD), P50 AG047366 (PI Victor Henderson, MD, MS), P30 AG010129 (PI Charles DeCarli, MD), P50 AG016573 (PI Frank LaFerla, PhD), P50 AG005131 (PI James Brewer, MD, PhD), P50 AG023501 (PI Bruce Miller, MD), P30 AG035982 (PI Russell Swerdlow, MD), P30 AG028383 (PI Linda Van Eldik, PhD), P30 AG053760 (PI Henry Paulson, MD, PhD), P30 AG010124 (PI John Trojanowski, MD, PhD), P50 AG005133 (PI Oscar Lopez, MD), P50 AG005142 (PI Helena Chui, MD), P30 AG012300 (PI Roger Rosenberg, MD), P30 AG049638 (PI Suzanne Craft, PhD), P50 AG005136 (PI Thomas Grabowski, MD), P50 AG033514 (PI Sanjay Asthana, MD, FRCP), P50 AG005681 (PI John Morris, MD), P50 AG047270 (PI Stephen Strittmatter, MD, PhD).
Authors’ disclosures available online (https://www.j-alz.com/manuscript-disclosures/18-0101r3).
SUPPLEMENTARY MATERIAL
[5] The supplementary material is available in the electronic version of this article: 10.3233/JAD-180101.
REFERENCES
[1] | Neumann PJ , Araki SS , Arcelus A , Longo A , Papadopoulos G , Kosik KS , Kuntz KM , Bhattacharjya A ((2001) ) Measuring Alzheimer’s disease progression with transition probabilities: Estimates from CERAD. Neurology 57: , 957–964. |
[2] | Ganguli M , Dodge HH , Shen C , DeKosky ST ((2004) ) Mild cognitive impairment, amnestic type: An epidemiologic study. Neurology 63: , 115–121. |
[3] | Gauthier S , Touchon J ((2005) ) Mild cognitive impairment is not a clinical entity and should not be treated. Arch Neurol 62: , 1164–1166; discussion 1167. |
[4] | Tyas SL , Salazar JC , Snowdon DA , Desrosiers ME Riley KP , Mendiondo MS , Kryscio RJ ((2007) ) Transitions to mild cognitive impairments, dementia, and death: Findings from the Nun Study. Am J Epidemiol 165: , 1231–1238. |
[5] | Hubbard RA , Zhou XH ((2011) ) A comparison of non-homogeneous Markov regression models with application to Alzheimer’s disease progression. J Appl Stat 38: , 2313–2326. |
[6] | Abner EL , Kryscio RJ , Cooper GE , Fardo DW , Jicha GA , Mendiondo MS , Nelson PT , Smith CD , Van Eldik LJ , Wan L , Schmitt FA ((2012) ) Mild cognitive impairment: Statistical models of transition using longitudinal clinical data. Int J Alzheimers Dis (2012) , 9. |
[7] | Spackman DE , Kadiyala S , Neumann PJ , Veenstra DL , Sullivan SD ((2012) ) Measuring Alzheimer disease progression with transition probabilities: Estimates from NACC-UDS. Curr Alzheimer Res 9: , 1050–1058. |
[8] | Hadjichrysanthou C , Ower A , de Wolf F , Anderson MR ((2018) ) The development of a stochastic mathematical model of Alzheimer’s disease to help improve the design of clinical trials of potential treatments. PLoS One 13: , e0190615. |
[9] | Abner EL , Kryscio RJ , Schmitt FA , Fardo DW , Moga DC , Ighodaro ET , Jicha GA , Yu L , Dodge HH , Xiong C , Woltjer RL , Schneider JA , Cairns NJ , Bennett DA , Nelson PT ((2017) ) Outcomes after diagnosis of mild cognitive impairment in a large autopsy series. Ann Neurol 81: , 549–559. |
[10] | Yu L , Boyle PA , Leurgans S , Schneider JA , Kryscio RJ , Wilson RS , Bennett DA ((2015) ) Effect of common neuropathologies on progression of late life cognitive impairment. Neurobiol Aging 36: , 2225–2231. |
[11] | Abner EL , Schmitt FA , Nelson PT , Lou W , Wan L , Gauriglia R , Dodge HH , Woltjer RL , Yu L , Bennett DA , Schneider JA , Chen R , Masaki K , Katz MJ , Lipton RB , Dickson DW , Lim KO , Hemmy LS , Cairns NJ , Grant E , Tyas SL , Xiong C , Fardo DW , Kryscio RJ ((2015) ) The Statistical Modeling of Aging and Risk of Transition Project: Data collection and harmonization across 11 longitudinal cohort studies of aging, cognition, and dementia. Obs Stud 1: , 56–73. |
[12] | Nelson PT , Head E , Schmitt FA , Davis PR , Neltner JH , Jicha GA , Abner EL , Smith CD , VanEldik LJ , Kryscio RJ , Scheff SW ((2011) ) Alzheimer’s disease is not “brain aging”: Neu-ropathological, genetic, and epidemiological human studies. Acta Neuropathol 121: , 571–587. |
[13] | Beach TG , Monsell SE , Phillips LE , Kukull W ((2012) ) Accuracy of the clinical diagnosis of Alzheimer disease at National Institute on Aging Alzheimer Disease Centers, 2005-2010. J Neuropathol Exp Neurol 71: , 266–273. |
[14] | Armstrong RA , Lantos PL , Cairns NJ ((2005) ) Overlap between neurodegenerative disorders. Neuropathology 25: , 111–124. |
[15] | Bradford A , Kunik ME , Schulz P , Williams SP , Singh H ((2009) ) Missed and delayed diagnosis of dementia in primary care: Prevalence and contributing factors. Alzheimer Dis Assoc Disord 23: , 306–314. |
[16] | Abner EL , Dennis BC , Mathews MJ , Mendiondo MS , Caban-Holt A , Kryscio RJ , Schmitt FA , Crowley JJ ((2012) ) Practice effects in a longitudinal, multi-center Alzheimer’s disease prevention clinical trial. Trials 13: , 217–217. |
[17] | Mathews M , Abner E , Kryscio R , Jicha G , Cooper G , Smith C , Caban-Holt A , Schmitt FA. Diagnostic accuracy and practice effects in the National Alzheimer’s Coordinating Center Uniform Data Set neuropsychological battery. Alzheimers Dement 10: , 675–683. |
[18] | Goldberg TE , Harvey PD , Wesnes KA , Snyder PJ , Schneider LS ((2015) ) Practice effects due to serial cognitive assessment: Implications for preclinical Alzheimer’s disease randomized controlled trials. Alzheimers Dement (Amst) 1: , 103–111. |
[19] | Mortimer JA ((1997) ) Brain reserve and the clinical expression of Alzheimer’s disease. Geriatrics 52: (Suppl 2), S50–S53. |
[20] | Schmand B , Smit JH , Geerlings MI , Lindeboom J ((1997) ) The effects of intelligence and education on the development of dementia. A test of the brain reserve hypothesis. Psychol Med 27: , 1337–1344. |
[21] | Stern Y ((2003) ) The concept of cognitive reserve: A catalyst for research. J Clin Exp Neuropsychol 25: , 589–593. |
[22] | Hunter CA , Kirson NY , Desai U , Cummings AK , Faries DE , Birnbaum HG ((2015) ) Medical costs of Alzheimer’s disease misdiagnosis among US Medicare beneficiaries. Alzheimers Dement 11: , 887–895. |
[23] | Beekly DL , Ramos EM , Lee WW , Deitrich WD , Jacka ME , Wu J , Hubbard JL , Koepsell TD , Morris JC , Kukull WA ((2007) ) The National Alzheimer’s Coordinating Center (NACC) database: The Uniform Data Set. Alzheimer Dis Assoc Disord 21: , 249–258. |
[24] | McKhann G , Drachman D , Folstein M , Katzman R , Price D , Stadlan EM ((1984) ) Clinical diagnosis of Alzheimer’s disease: Report of the NINCDS-ADRDA Work Group under the auspices of Department of Health and Human Services TaskForce on Alzheimer’s Disease. Neurology 34: ,939–939. |
[25] | Petersen RC ((2004) ) Mild cognitive impairment as a diagnostic entity. J Intern Med 256: , 183–194. |
[26] | Winblad B , Palmer K , Kivipelto M , Jelic V , Fratiglioni L , Wahlund LO , Nordberg A , Backman L , Albert M , Almkvist O , Arai H , Basun H , Blennow K , de Leon M , DeCarli C , Erkinjuntti T , Giacobini E , Graff C , Hardy J , Jack C , Jorm A , Ritchie K , van Duijn C , Visser P , Petersen RC ((2004) ) Mild cognitive impairment-beyond controversies, towards a consensus: Report of the International Working Group on Mild Cognitive Impairment. J Intern Med 256: , 240–246. |
[27] | Rosen WG , Mohs RC , Davis KL ((1984) ) A new rating scale for Alzheimer’s disease. Am J Psychiatry 141: , 1356–1364. |
[28] | Mohs RC , Knopman D , Petersen RC , Ferris SH , Ernesto C , Grundman M , Sano M , Bieliauskas L , Geldmacher D , Clark C , Thal LJ ((1997) ) Development of cognitive instruments for use in clinical trials of antidementia drugs: Additions to the Alzheimer’s Disease Assessment Scale that broaden its scope. The Alzheimer’s Disease Cooperative Study. Alzheimer Dis Assoc Disord 11: (Suppl 2), S13–S21. |
[29] | Folstein MF , Folstein SE , McHugh PR ((1975) ) “Mini-mental state”. A practical method for grading the cognitive state of patients for the clinician. J Psychiatr Res 12: , 189–198. |
[30] | Weintraub S , Salmon D , Mercaldo N , Ferris S , Graff-Radford NR , Chui H , Cummings J , DeCarli C , Foster NL , Galasko D , Peskind E , Dietrich W , Beekly DL , Kukull WA , Morris JC ((2009) ) The Alzheimer’s Disease Centers’ Uniform Data Set (UDS): The Neuropsychological Test Battery. Alzheimer Dis Assoc Disord 23: , 91–101. |
[31] | Zhang Z , Parker RMA , Charlton CMJ , Leckie G , Browne WJ ((2016) ) R2MLwiN: A package to run MLwiN from within R. J Stat Softw 72: , 43. |
[32] | Ganguli M ((2009) ) Depression, cognitive impairment and dementia: Why should clinicians care about the web of causation? Indian J Psychiatry 51: , S29–S34. |
[33] | Jicha GA , Parisi JE , Dickson DW , Johnson K , Cha R , Ivnik RJ , Tangalos EG , Boeve BF , Knopman DS , Braak H , Petersen RC ((2006) ) Neuropathologic outcome of mild cognitive impairment following progression to clinical dementia. Arch Neurol 63: , 674–681. |
[34] | Palmer K , Fratiglioni L , Winblad B ((2003) ) What is mild cognitive impairment? Variations in definitions and evolution of nondemented persons with cognitive impairment. Acta Neurol Scand Suppl 179: , 14–20. |
[35] | Palmer K , Backman L , Winblad B , Fratiglioni L ((2008) ) Mild cognitive impairment in the general population: Occurrence and progression to Alzheimer disease. Am J Geriatr Psychiatry 16: , 603–611. |
[36] | McKhann GM , Knopman DS , Chertkow H , Hyman BT , Jack CR , Kawas CH , Klunk WE , Koroshetz WJ , Manly JJ , Mayeux R , Mohs RC , Morris JC , Rossor MN , Scheltens P , Carrillo MC , Thies B , Weintraub S , Phelps CH ((2011) ) The diagnosis of dementia due to Alzheimer’s disease: Recommendations from the National Institute on Aging-Alzheimer’s Association workgroups on diagnostic guidelines for Alzheimer’s disease. Alzheimers Dement 7: , 263–269. |
[37] | Lowe VJ , Peller PJ , Weigand SD , Montoya Quintero C , Tosakulwong N , Vemuri P , Senjem ML , Jordan L , Jack CR , Knopman D , Petersen RC ((2013) ) Application of the National Institute on Aging-Alzheimer’s Association AD criteria to ADNI. Neurology 80: , 2130–2137. |
[38] | Hughes TF , Snitz BE , Ganguli M ((2011) ) Should mild cognitive impairment be subtyped? Curr Opin Psychiatry 24: , 237–242. |
[39] | Tucker AM , Stern Y ((2011) ) Cognitive reserve in aging. Curr Alzheimer Res 8: , 354–360. |
[40] | Geldmacher DS , Kirson NY , Birnbaum HG , Eapen S , Kantor E , Cummings AK , Joish VN ((2014) ) Implications of early treatment among Medicaid patients with Alzheimer’s disease. Alzheimers Dement 10: , 214–224. |
[41] | Gaugler JE , Ascher-Svanum H , Roth DL , Fafowora T , Siderowf A , Beach TG ((2013) ) Characteristics of patients misdiagnosed with Alzheimer’s disease and their medication use: An analysis of the NACC-UDS database. BMC Geriatrics 13: , 137–137. |


