
Risk Factors Associated with Cortical Thickness and White Matter Hyperintensities in Dementia Free Okinawan Elderly
Abstract
Background:
Cortical gray matter (GM) and white matter (WM) deterioration are signals of neurodegeneration and increased dementia risk; however, their specific etiologies in dementia-free aging is unclear.
Objective:
The objective of this study was to examine potentially modifiable risk factors of GM and WM degeneration in a well-characterized cohort of dementia-free elderly.
Methods:
96 Okinawan elderly participants (age 83.6) from the Keys to Optimal Cognitive Aging Project (KOCOA) underwent MRI and cognitive evaluation. Serum markers of inflammation (interleukin-6 (IL-6), high sensitivity C-reactive protein), cerebrovascular disease (systolic blood pressure (SBP) 140+, hemoglobin A1C (HgbA1C), total cholesterol), and essential minerals (copper (Cu), magnesium, and calcium) were examined in relation to mean cortical thickness (MCT) and white matter hyperintensities (WMH), adjusting for age and gender. Voxel-based morphometry (VBM) analyses identified relationships between regional GM density and the above markers.
Results:
Decreased MCT was associated with SBP 140 + (p = 0.029) and increased serum IL-6 (p = 0.036), HgbA1C (p = 0.002), and Cu (p = 0.025). In VBM analyses, increased IL-6, HgbA1C, and Cu were associated with decreased GM density in temporal lobe regions. HgbA1C (p = 0.004) was associated with greater WMH volume.
Conclusions:
Peripheral markers of Cu, CVD risk, and inflammation are associated with MRI-markers of decreased brain health in dementia-free Okinawan elderly, with regional cortical thinning in areas involved in early accumulation of Alzheimer’s disease pathology. Results identify potentially modifiable biomarkers as targets in the prevention of dementia in older individuals.
INTRODUCTION
Changes in brain volume and structure have been associated with both increased age [1] and early neurodegeneration, particularly Alzheimer’s disease (AD) [2, 3], with brain atrophy being associated of AD pathology in an older population [4, 5]. Multiple risk factors have been associated with poorer brain health and include those associated with cerebrovascular disease (CVD), inflammation, and certain micronutrients. It is conceivable that early cortical injury in AD-vulnerable regions associated with chronic disease and lifestyle influences may decrease cognitive and neuronal reserve in older individuals, leaving them more susceptible to clinical manifestations of age and AD-related pathologies.
Cortical thickness measures can detect early brain change in older individuals, with regional decline in cortical thickness observed prior to the clinical onset of AD [6]. Furthermore, ante-mortem medial temporal lobe thickness has been related to in-vivo and post-mortem AD pathology markers [7]. In dementia-free elderly, preserved cortical thickness has been associated with superior cognitive performance [8], distinguishing “super agers” from those susceptible to the more commonly observed, age-related cognitive decline [9], supporting this use of cortical thickness as a strong biomarker of healthy aging.
T2-weighted MRI white matter hyperintensities (WMH) are an imaging hallmark of underlying small vessel ischemic disease [10]. WMHs are commonly observed in advanced age and confer increased risk of cognitive and motor impairment [11, 12], stroke, and overall mortality [13].
Recent studies have shown lifestyle factors, such as diet and exercise, to be associated with cortical thickness [14–16] and WMHs [17], indicating the likelihood that certain preventative measures may retard or delay cortical volume loss and WMH accumulation in the elderly. Individual serum biomarkers and specific risk factors related to structural brain change are not well established, and may lead to specific interventions aimed at improving cognitive health in our growing elderly population. Accordingly, the objective of this study was to examine peripheral markers and potentially modifiable risk factors associated with cortical thickness and WMHs in a well-characterized cohort of dementia-free Okinawan elderly.
MATERIALS AND METHODS
Subjects
96 dementia-free Okinawan participants from the Keys to Optimal Cognitive Aging Project (KOCOA), underwent detailed cognitive and neurological testing and MRI. The KOCOA project is a prospective pilot cohort study of community-dwelling elderly aged 80 years or older living in Ginowan City in Okinawa, Japan. The study was approved by the Ethics Committee and the Intuitional Review Board of the University of the Ryukyus. Informed consent was obtained from all participants prior to enrollment in the study. Details of the study recruitment and methods have been published elsewhere [18, 19]. In brief, subjects were recruited from those participating in one of 22 government-funded senior centers. A total of 196 volunteers (mean age: 85.2 years, range: 80–98) were followed annually, between November 2007 and March 2010, for a total of three time points. Cognitive function was evaluated by a trained examiner using the Japanese version of the 30-point Mini-Mental State Examination (JMMSE) [20, 21] as a measure of global cognitive function. 114/196 subjects had brain MRI corresponding to their baseline clinical evaluation. For the current study, we included those without frank dementia, defined as JMMSE >20, Clinical Dementia Rating Scale (CDR) [22] score <1.0, and without evidence of functional impairment on Instrumental Activities of Daily Living (IADL), including using the telephone, shopping, bill paying, preparing meals, and banking, leaving a total of 96 subjects included in this analysis. Eighty-five of these subjects had fluid attenuated inversion recovery (FLAIR) images for WMH analysis.
As part of their participation in the KOCOA study, all subjects had vital signs, including blood pressure, recorded at their baseline neurological and cognitive examination. Laboratory evaluation corresponding with their baseline visit examined markers of CVD risk and inflammation, as well as essential minerals previously shown to be associated with cerebrovascular or neurodegenerative disease. CVD risk markers included Hemoglobin A1C (HgbA1C), total cholesterol (Tchol), and systolic blood pressure ≥ 140 (SBP 140+). Inflammatory markers included interleukin-6 (IL-6) and high sensitivity C-reactive protein (hsCRP). Nutrient biomarkers previously shown to be associated with brain health were obtained, and included magnesium (Mg), copper (Cu), and calcium (Ca) [23–25].
MRI acquisition and analysis
MRI was acquired on a Siemens 1.5T Avanto system, including T1 sequences: voxel size 0.9×0.9×1.25 mm3, 256×256 imaging matrix, 144 sagittal slices, TR: 1700 ms, TI: 800 ms, TE: 3.3 ms; FLAIR: 0.9×0.9×5 mm3, 19 axial slices, TR: 8500 ms, TI: 2500 ms, TE: 107 ms. Mean cortical thickness (MCT) was derived using FreeSurfer (version 5.1). Intracranial volume (ICV) was determined from a nonlinear registration to standard MNI space. WMH values were obtained using a semi-automated algorithm previously described [26].
Voxelwise GM density was calculated using the standard FSL VBM package (http://fsl.fmrib.ox.ac.uk/fsl/fslwiki/FSLVBM). T1 images were brain extracted, non-linearly aligned to the MNI-152 template and GM extracted. These images were averaged to create a study-specific template to which all GM images were non-linearly aligned, modulated by the Jacobian and smoothed with an isotropic Gaussian kernel of sigma 2 mm. Cluster thresholded voxelwise GLM was used to explore the relationship between regional GM density and CVD risk factors and serum biomarkers of brain health described above (3dRegAna, AFNI).
Statistical analysis
Multivariable regression models, adjusted for age and sex, examined the relationships between MRI MCT and vascular disease (WMH) with peripheral vascular (HgbA1C, Tchol, SBP140+), inflammatory (IL-6, hsCRP) and nutrient (Cu, Mg, Ca) markers of brain health. WMH, hsCRP, and IL-6 were log transformed in order to obtain normal distribution. WMH volume was examined as a percentage of ICV to account for differences in head size. Whole brain VBM analyses examined relationships between regional GM density and factors found to be significant in the above MCT analyses. A final step-wise linear regression model was run, which included all variables previously found to be significant. Due to relatively small sample size in the current study, we used type I error rate of 0.05 as a statistical significance.
RESULTS
The mean age of participants was 83.6 (sd 3.0), with 76.6% women. Subject characteristics are described in Table 1. Multivariable analyses were adjusted for age and sex.
Table 1
Subject characteristics (N = 96)
| Mean (sd) | Range | |
| Age (y) | 83.6 (3.0) | 78–92 |
| Sex (% women) | 76.6 | |
| Education (y) | 7.8 (2.4) | 0–17 |
| JMMSE | 26 (2.5) | 21–30 |
| CDR = 0 (%) (vs % of CDR = 0.5) | 71.4 | |
| BMI | 24.3 (3.2) | 17–33.9 |
| WMH volume (cc, n = 85 with FLAIR) | 11.6 (10.4) | 0.59–61.1 |
| HgbA1C | 5.59 (0.66) | 4.5–8.1 |
| SBP >140 (%) | 58.3 | |
| Total cholesterol | 211.18 (39.97) | 123–356 |
| Interleukin-6 | 3.92 (7.56) | 0.9–74.2 |
| hsCRP | 0.29 (0.55) | 0.01–3.96 |
| Copper | 125.51 (20.56) | 67.1–191.2 |
| Magnesium | 2.36 (0.17) | 1.9–3.0 |
| Calcium | 9.52 (0.36) | 8.6–10.7 |
JMMSE, Japanese Mini-Mental State Exam; CDR, Clinical Dementia Rating; BMI, body mass index; WMH, white matter hyperintensity; HgbA1C, hemoglobin A1C; SBP, systolic blood pressure; hsCRP, high sensitivity C-reactive protein.
CVD risk markers
In individual multivariable analyses adjusted for age and sex, greater HgbA1C (p = 0.002) and SBP 140+ (p = 0.029) were associated with decreased MCT. Tchol was not associated with MCT. Of the CVD risk factors examined, only HgbA1C was related to greater WMH volume after adjustment for age and sex (p = 0.0038) (Table 2).
Table 2
Results of multivariable linear regression analyses of CVD, Inflammatory, and Micronutrient factors related to structural brain health, age and sex adjusted (p < 0.05)
| MCT Estimate (p-value) | WMH Estimate (p-value) | |
| CVD RISK | ||
| HgbA1C | –0.08 (0.002) | 0.03 (0.038) |
| SBP >140 | –0.04 (0.029) | NS |
| Tchol | NS | NS |
| Inflammatory Markers | ||
| IL-6 | –0.06 (0.036) | NS |
| hsCRP | NS | NS |
| Micronutrients | ||
| Cu | –0.002 (0.025) | 0.001 (0.07) |
| Magnesium | NS | NS |
| Calcium | NS | NS |
CVD, cerebrovascular disease; HgbA1C, hemoglobin A1C; SBP, systolic blood pressure; Tchol, total cholesterol; IL-6, interleukin-6; hsCRP, high sensitivity C-reactive protein; Cu, copper.
Serum inflammatory markers
Decreased MCT was related to greater serum IL-6 (p = 0.036) after adjustments for age and sex, but not with hsCRP. Neither of the serum inflammatory markers were related to WMH volume.
Micronutrients
Decreased MCT was associated with greater serum Cu (p = 0.025), but not with either Mg or Ca, after adjustments for age and gender. There was a weak relationship between higher serum Cu and greater WMH volume after adjustments for age and sex (p = 0.07). Mg and Ca were not related to MRI WMH burden.
Final model of cortical thickness
A mixed linear step-wise regression was performed composed of all variables previously shown to be associated with MCT, which included: HgbA1C, SBP 140+, Cu, and IL-6, adjusted for age and sex (probability to enter and leave, p = 0.25). All variables of interest remained in the model, with greater HgbA1C (p = 0.001), Cu (p = 0.024), and SBP 140+ (p = 0.013) remaining significantly related to decreased MCT, and IL-6 having attenuated its significance (p = 0.092)
Voxel-based morphometry
Voxel-wise analyses demonstrated that increased HgbA1C was associated with decreased GM density in the right middle temporal gyrus and temporal pole, left lateral occipital cortex, and right superior frontal gyri (Table 3, Fig. 1). Increased IL-6 was related to decreased GM density in the left inferior and middle temporal gyri (Table 4, Fig. 1). Greater serum Cu was related to more widespread cortical thinning, with regions of greatest impact being within medial frontal, medial temporal and parahippocampal structures (Table 5, Fig. 1). SBP 140+ was not related to regional GM thinning in VBM analysis.
Table 3
Regions in which VBM identified significantly reduced GM density in comparison with increased HgbA1c (p < 0.05)
| Talairach Region | Coordinates | Cluster size | ||||
| side | X | Y | Z | Voxels | Volume (cm3) | |
| Middle Temporal Gyrus and Temporal Pole | R | –52 | 10 | –25 | 781 | 6.25 |
| Lateral Occipital Cortex | L | 23 | 85 | 26 | 660 | 5.28 |
| Superior Frontal Gyrus | R | –14 | –20 | 55 | 470 | 3.76 |
Fig.1
VBM analysis with cluster thresholding to account for false positive rates. Colored voxels indicate regions of decreased GM density significantly associated with higher HgbA1C (a), Copper (b), and IL-6 (c), age and sex adjusted (p < 0.05).
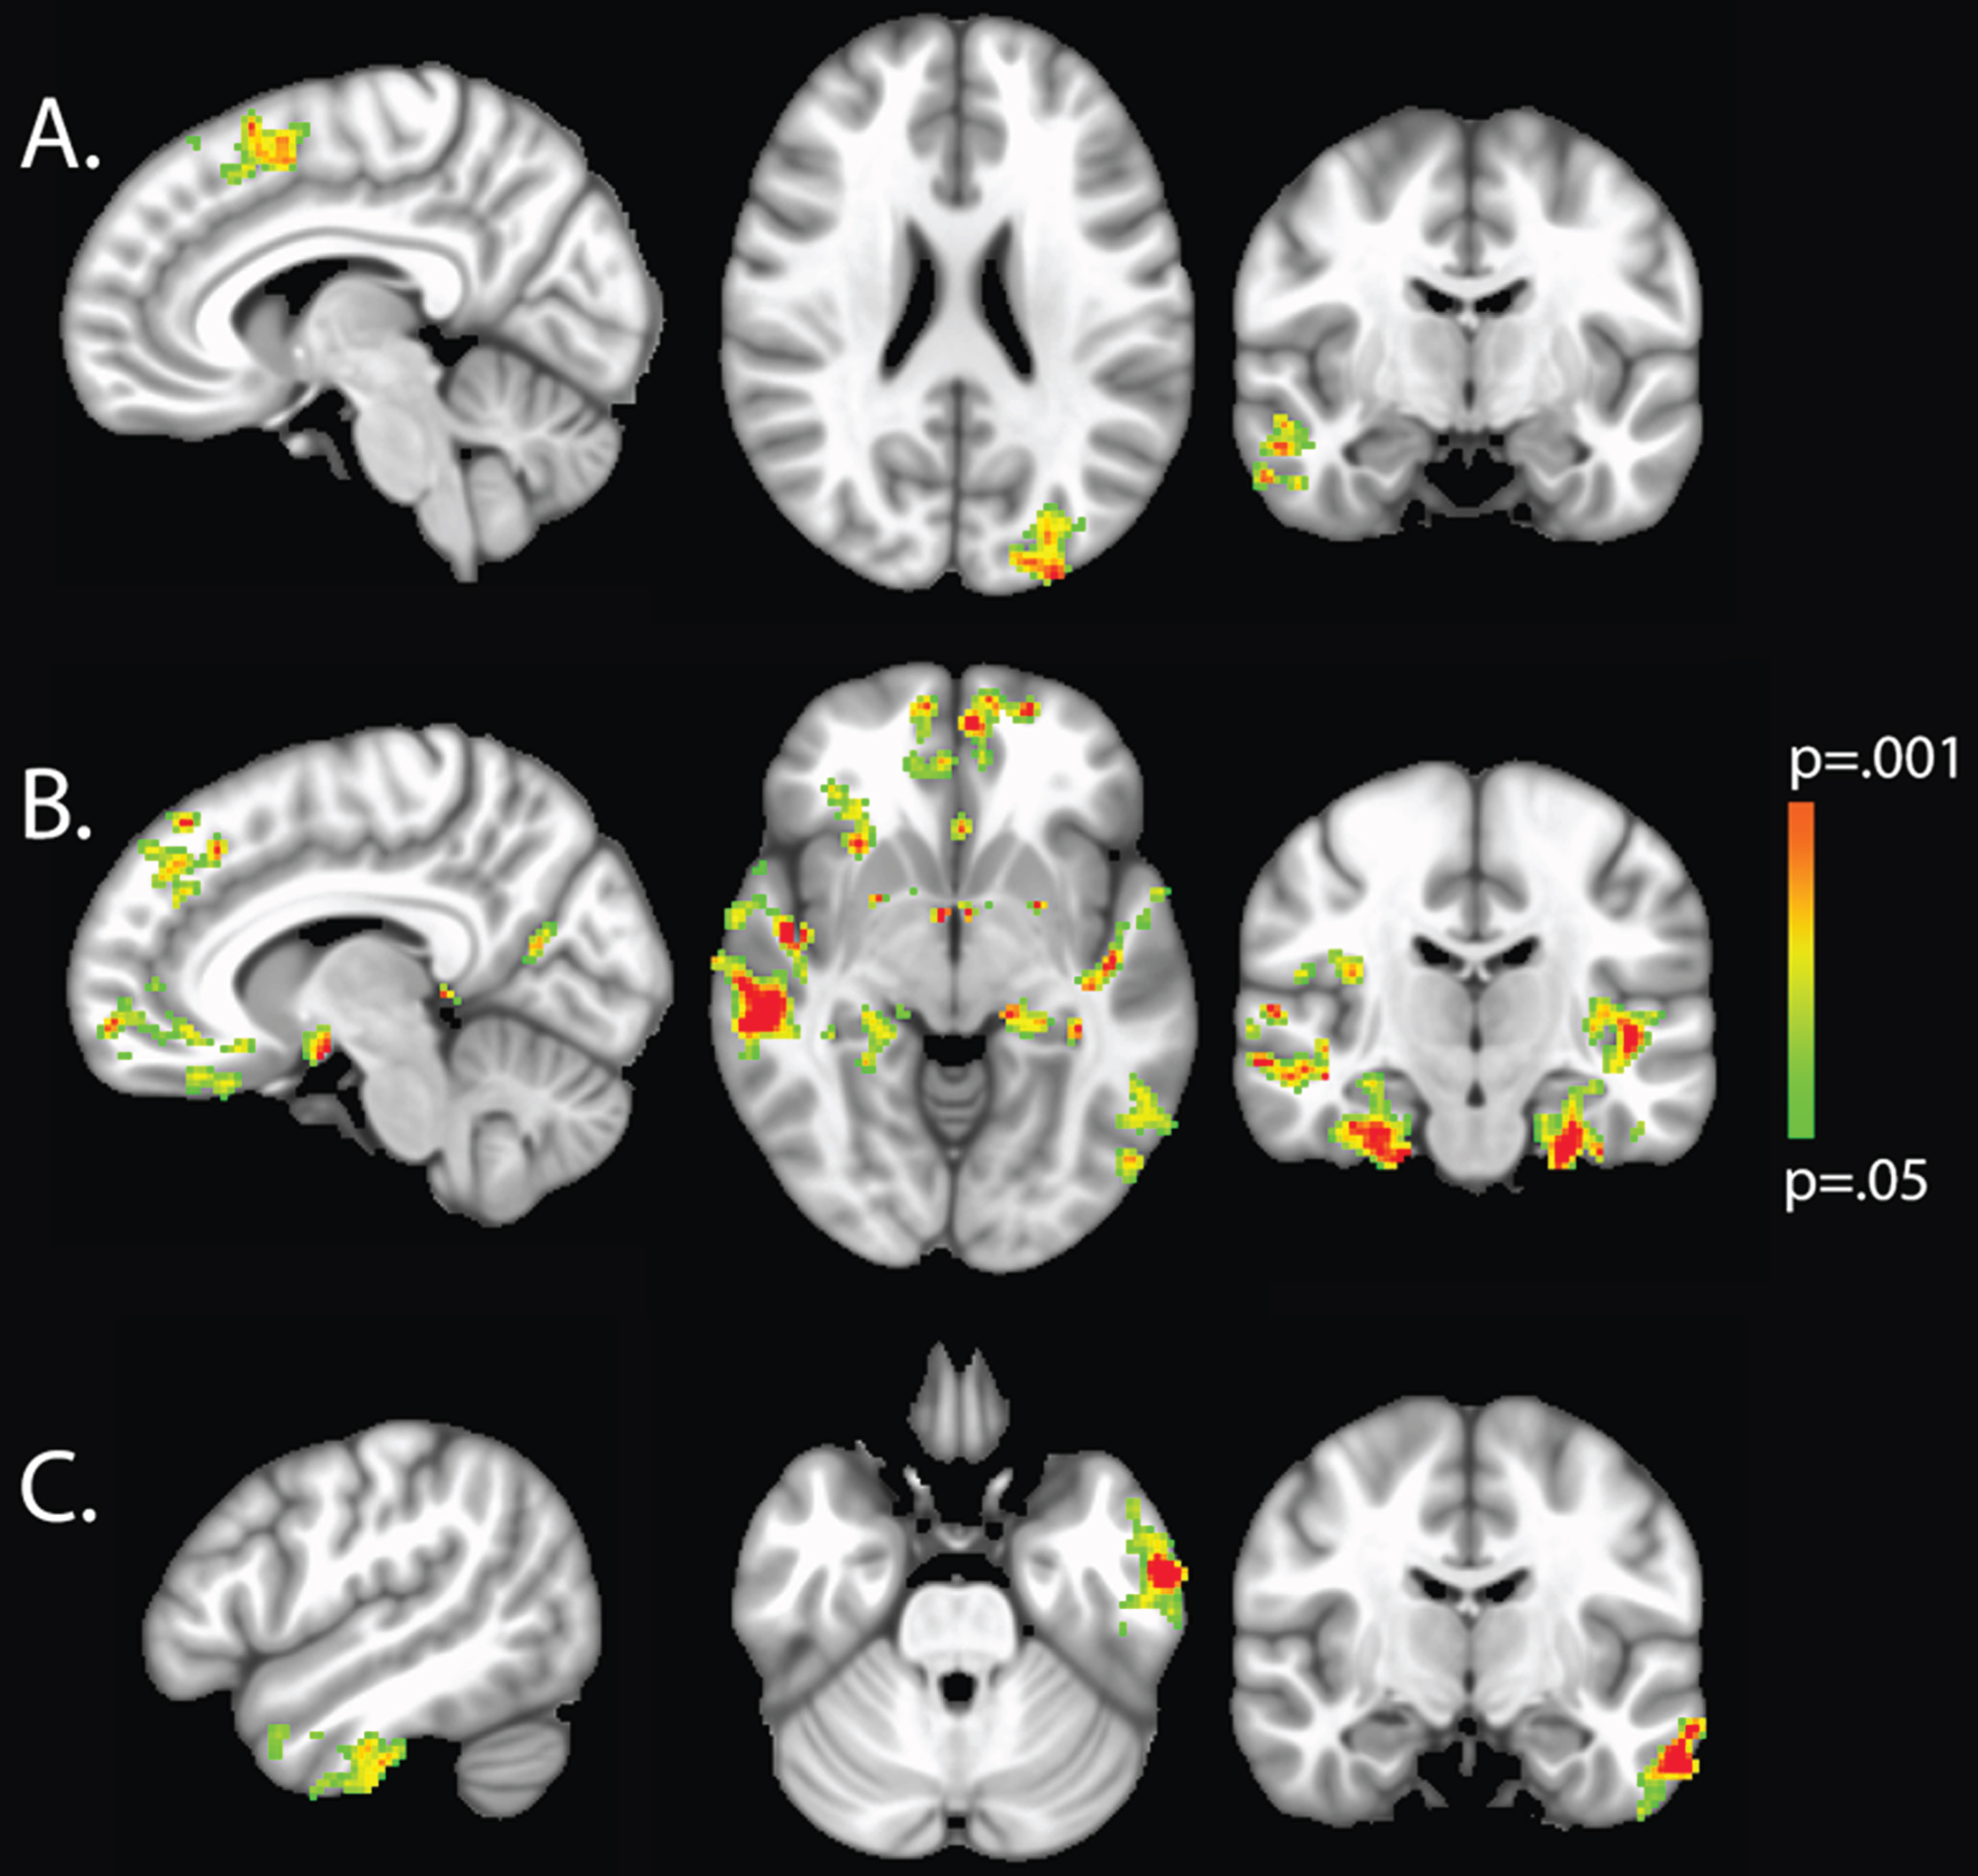
Table 4
Regions in which VBM identified significantly reduced GM density in comparison with increased IL-6 (p < 0.05)
| Talairach Region | Coordinates | Cluster size | ||||
| side | X | Y | Z | Voxels | Volume (cm3) | |
| Inferior and Middle Temporal Gyrus | L | 56 | 11 | –30 | 698 | 5.58 |
Table 5
Regions in which VBM identified significantly reduced GM density in comparison with increased copper (p < 0.01)
| Talairach Region | Coordinates | Cluster size | ||||
| side | X | Y | Z | Voxels | Volume (cm3) | |
| Middle Frontal Gyrus | L+ R | 3 | –37 | 46 | 565 | 4.52 |
| Parahippocampal Gyrus | R | –25 | 11 | –30 | 561 | 4.49 |
| Middle Temporal Gyrus | R | –57 | 26 | –9 | 519 | 4.15 |
| Parahippocampal Gyrus | L | 23 | 12 | –29 | 506 | 4.05 |
| Intracalcarine Cortex | L | 50 | 70 | 3 | 456 | 3.65 |
| Lateral Occipital Cortex | R | –46 | 65 | 40 | 437 | 3.5 |
| Temporal Pole | R | –57 | –2 | 27 | 427 | 3.42 |
DISCUSSION
Greater cortical thickness in older individuals has been associated with immunity from the typically observed decline in cognitive performance, separating “super agers” from those who have accelerated cortical thinning and poorer cognition commonly associated with aging [9]. These studies, and other investigations demonstrating lifestyle preferences and interventions to be associated with improvements in structural brain measures [14, 15], support the likely existence of modifiable targets associated with cortical thickness and cognitive health.
In this study, CVD risk factors of greater HgbA1c and SBP 140+ were associated with decreased MCT, with greater HgbA1c being associated with regional reductions of cortical density within the medial temporal lobe. Previous studies have found associations between CVD risk factors and brain atrophy [27], specifically in relation to blood glucose levels [28] and hypertension [29].
Diabetes is a known risk factor for cognitive impairment, including both vascular and Alzheimer’s dementias [30], with cognitive changes likely to occur in older individuals [30]. Like others, we found associations between diabetic risk and WMH burden [31, 32] implicating cerebrovascular disease as a significant contributor to cognitive impairment in diabetic elderly. It has been shown, however, that the risk for AD in diabetics remains strong even after controlling for CVD risk factors, supporting shared molecular pathways between AD and diabetes, including greater neuronal insulin resistance, amyloid-β (Aβ) aggregation, tau hyperphosphorylation, and reduced Aβ clearance [30, 33], all of which might be possible contributors to early cortical changes.
HTN is also a strong risk factor for vascular dementia [34] with likely mediation via associations with arteriolosclerosis, endothelial dysfunction, and subsequent small vessel ischemic disease. In this study of older, non-demented, Okinawan participants, SBP 140+ was not associated with MRI WMH burden, indicating detrimental effects of chronic hypertension on brain health that are independent of the effects associated with typical CVD. Previous studies have demonstrated associations between HTN and cortical thickness, possibly due, in part, to decrease cortical perfusion resulting from impaired autoregulatory cerebrovascular response [29, 35]. Finally, both greater blood glucose and SBP increase the risk for cortical microinfarcts [30, 36], further explaining possible associations between these CVD risk factors and cortical thickness measures.
An equitable balance between pro- and anti-inflammatory responses is thought to separate older individuals experiencing longevity and successful aging from those more susceptible to increased morbidity, and decreased survival [37]. IL-6 is a pro-inflammatory cytokine produced by both immune and non-immune cells, including adipocytes, which contribute up to 35% of circulating IL-6 levels [38]. Previous studies have reported associations between IL-6 and chronic disease of aging, including those related to impaired cognitive function [39, 40], even after controlling for vascular risk factors [41]. Findings from this study are consistent with others showing associations between IL-6 and structural brain changes [42–44]. Few studies have examined IL-6 in relation to cortical thickness specifically. Our findings are consistent with one previous study of older individuals demonstrating relationships between IL-6 and both cross-sectional and longitudinal regional cortical thinning that included temporal lobe structures [42]. We did not observe a relationship between hsCRP and cortical thickness in this study. Previous investigations examining brain volume change with CRP have demonstrated conflicting results, with some reporting significant correlations with regional GM volume [45], and others finding either no relationship [46] or weaker relationships compared with that observed between brain structure and IL-6 [43, 44]. In the present study, neither CRP nor IL-6 were related to WMH, findings similar to many previous reports [43, 46–48], with a few exceptions [44, 49].
This study is one of this first to examine circulating Cu levels in relation to human brain structure, showing regional effects of Cu on medial temporal lobe structures known to be involved in early accumulation of AD pathology. In animal models fed a high cholesterol diet, even low doses of dietary Cu have been shown to result in accumulation of Aβ and worse cognitive performance [50, 51]. Recent investigations have demonstrated Cu to accumulate within the brain capillaries of older mice, thought to cause disruption of Aβ clearance across the blood-brain barrier through its down-regulation of endothelial low-density lipoprotein receptor-related protein 1 (LRP1), with additional effects on Aβ production and neuroinflammation in transgenic mice overexpressing Aβ precursor protein [52, 53]. In humans, the overall effects of Cu appear mixed, with dietary and serum Cu levels associated with decreased blood pressure and cholesterol, but higher markers of peripheral inflammation, oxidative stress [54], and HgA1C [55] and with increased risk for conversion from MCI to AD [25]. Importantly, we found greater Cu levels to be related to MCT in the final model adjusted for IL-6 and HbgA1C, indicating its effects to be independent of these secondary inflammatory and blood glucose/insulin resistance markers. It is possible, however, that the relationship between serum Cu and cortical thinning was driven by other inflammatory or oxidative stress markers previously associated with serum Cu, but not explicitly examined in this study. Interestingly, a weak association between serum Cu and WMH burden was observed in this population. Previous studies have demonstrated a role of Cu in the development of atherosclerotic disease through the generation of reactive oxygen species. It is likely that this relationship is biphasic, with both Cu deficiency and excess Cu causing enhanced atherogenesis, although the argument has been made that even “normal” levels of Cu may contribute to atherosclerotic disease in older individuals (for a review, see [56]). This is one of the first studies to investigate the relationship between MRI WMH and serum Cu levels in an elderly population, and findings may indicate a more important role for Cu in age-related cerebrovascular dysfunction than previously recognized. Future examination of the effects of Cu on GM and WM integrity in other cohorts will be necessary to fully elucidate these relationships.
This study has several limitations, including the lack of longitudinal MRI to investigate risk factors for rates of cortical thinning and detailed dietary and medication information on study participants. In addition, inflammatory markers examined in this study were peripheral, and direct effect on the CNS can only be surmised. A direct link between peripheral and central inflammation is biologically plausible, however, with possible pathways including active passage across the blood-brain barrier and passive diffusion from the choroid plexus (see Rosano [57] for review). Future studies investigating peripheral in relation to central inflammatory markers (i.e., using novel PET ligands) will be necessary to validate these relationships.
In this study of highly characterized, dementia-free, Okinawan elderly, MCT was associated with SBP 140+ and greater serum HgbA1C, IL-6, and Cu, with specific regional effects observed within the temporal lobe, an area known to be susceptible to the accumulation of AD pathology prior to clinical manifestation of dementia. In addition, greater HgbA1C and to a lesser extent, serum Cu, were related to greater CVD burden. The identified peripheral markers and risk factors predictive of worse brain structure are all potentially modifiable, and thus represent specific targets for prevention and intervention therapies aimed at maintaining brain health and increasing resistance to age and neurodegenerative disease-related decline in cognitive function in older individuals.
ACKNOWLEDGMENTS
This study was supported by the National Institute on Aging (K01AG023014, R01AG033581, P30AG008017;), Linus Pauling Institute Research Grant, Japanese Ministry of Education, Culture, Sports, Science and Technology (MEXT) Grant-in-Aid for Young Scientists (B) (20790442), JSPS KAKENHI Grant Number 23591278 and JSPS KAKENHI Grant Number 26461313.
Authors’ disclosures available online (https://www.j-alz.com/manuscript-disclosures/17-1153r1).
REFERENCES
[1] | Salat DH , Buckner RL , Snyder AZ , Greve DN , Desikan RS , Busa E , Morris JC , Dale AM , Fischl B ((2004) ) Thinning of the cerebral cortex in aging. Cereb Cortex 14: , 721–730. |
[2] | Whitwell JL , Przybelski SA , Weigand SD , Knopman DS , Boeve BF , Petersen RC , Jack CRJr ((2007) ) 3D maps from multiple MRI illustrate changing atrophy patterns as subjects progress from mild cognitive impairment to Alzheimer’s disease. Brain 130: , 1777–1786. |
[3] | Dodge HH , Zhu J , Harvey D , Saito N , Silbert LC , Kaye JA , Koeppe RA , Albin RL , Alzheimer’s Disease Neuroimaging Initiative ((2014) ) Biomarker progressions explain higher variability in stage-specific cognitive decline than baseline values in Alzheimer disease. Alzheimers Dement 10: , 690–703. |
[4] | Silbert LC , Quinn JF , Moore MM , Corbridge E , Ball MJ , Murdoch G , Sexton G , Kaye JA ((2003) ) Changes in premorbid brain volume predict Alzheimer’s disease pathology. Neurology 61: , 487–492. |
[5] | Kaur B , Himali JJ , Seshadri S , Beiser AS , Au R , McKee AC , Auerbach S , Wolf PA , DeCarli CS ((2014) ) Association between neuropathology and brain volume in the Framingham Heart Study. Alzheimer Dis Assoc Disord 28: , 219–225. |
[6] | Pettigrew C , Soldan A , Zhu Y , Wang MC , Moghekar A , Brown T , Miller M , Albert M , BIOCARD Research Team ((2016) ) Cortical thickness in relation to clinical symptom onset in preclinical AD. Neuroimage Clin 12: , 116–122. |
[7] | LaPoint MR , Chhatwal JP , Sepulcre J , Johnson KA , Sperling RA , Schultz AP ((2017) ) The association between tau PET and retrospective cortical thinning in clinically normal elderly. Neuroimage 157: , 612–622. |
[8] | Dickerson BC , Fenstermacher E , Salat DH , Wolk DA , Maguire RP , Desikan R , Pacheco J , Quinn BT , Van der Kouwe A , Greve DN , Blacker D , Albert MS , Killiany RJ , Fischl B ((2008) ) Detection of cortical thickness correlates of cognitive performance: Reliability across MRI scan sessions, scanners, and field strengths. Neuroimage 39: , 10–18. |
[9] | Rogalski EJ , Gefen T , Shi J , Samimi M , Bigio E , Weintraub S , Geula C , Mesulam MM ((2013) ) Youthful memory capacity in old brains: Anatomic and genetic clues from the Northwestern SuperAging Project. J Cogn Neurosci 25: , 29–36. |
[10] | Erten-Lyons D , Woltjer R , Kaye J , Mattek N , Dodge HH , Green S , Tran H , Howieson DB , Wild K , Silbert LC ((2013) ) Neuropathologic basis of white matter hyperintensity accumulation with advanced age. Neurology 81: , 977–983. |
[11] | Silbert LC , Nelson C , Howieson DB , Moore MM , Kaye JA ((2008) ) Impact of white matter hyperintensity volume progression on rate of cognitive and motor decline. Neurology 71: , 108–113. |
[12] | Silbert LC , Dodge HH , Perkins LG , Sherbakov L , Lahna D , Erten-Lyons D , Woltjer R , Shinto L , Kaye JA ((2012) ) Trajectory of white matter hyperintensity burden preceding mild cognitive impairment. Neurology 79: , 741–747. |
[13] | Debette S , Markus HS ((2010) ) The clinical importance of white matter hyperintensities on brain magnetic resonance imaging: Systematic review and meta-analysis. BMJ 341: , c3666. |
[14] | Reiter K , Nielson KA , Smith TJ , Weiss LR , Alfini AJ , Smith JC ((2015) ) Improved cardiorespiratory fitness is associated with increased cortical thickness in mild cognitive impairment. J Int Neuropsychol Soc 21: , 757–767. |
[15] | Lee JS , Shin HY , Kim HJ , Jang YK , Jung NY , Lee J , Kim YJ , Chun P , Yang JJ , Lee JM , Kang M , Park KC , Na DL , Seo SW ((2016) ) Combined effects of physical exercise and education on age-related cortical thinning in cognitively normal individuals. Sci Rep 6: , 24284. |
[16] | Mosconi L , Murray J , Tsui WH , Li Y , Davies M , Williams S , Pirraglia E , Spector N , Osorio RS , Glodzik L , McHugh P , de Leon MJ ((2014) ) Mediterranean diet and magnetic resonance imaging-assessed brain atrophy in cognitively normal individuals at risk for Alzheimer’s disease. J Prev Alzheimers Dis 1: , 23–32. |
[17] | Torres ER , Strack EF , Fernandez CE , Tumey TA , Hitchcock ME ((2015) ) Physical activity and white matter hyperintensities: A systematic review of quantitative studies. Prev Med Rep 2: , 319–325. |
[18] | Katsumata Y , Todoriki H , Higashiuesato Y , Yasura S , Willcox DC , Ohya Y , Willcox BJ , Dodge HH ((2012) ) Metabolic syndrome and cognitive decline among the oldest old in Okinawa: In search of a mechanism. The KOCOA Project. J Gerontol A Biol Sci Med Sci 67: , 126–134. |
[19] | Dodge HH , Katsumata Y , Todoriki H , Yasura S , Willcox DC , Bowman GL , Willcox B , Leonard S , Clemons A , Oken BS , Kaye JA , Traber MG ((2010) ) Comparisons of plasma/serum micronutrients between Okinawan and Oregonian elders: A pilot study. J Gerontol A Biol Sci Med Sci 65: , 1060–1067. |
[20] | Dodge HH , Meguro K , Ishii H , Yamaguchi S , Saxton JA , Ganguli M ((2009) ) Cross-cultural comparisons of the Mini-mental State Examination between Japanese and U.S. cohorts. Int Psychogeriatr 21: , 113–122. |
[21] | Folstein MF , Folstein SE , McHugh PR ((1975) ) “Mini-mental state”. A practical method for grading the cognitive state of patients for the clinician. J Psychiatr Res 12: , 189–198. |
[22] | Morris JC ((1993) ) The Clinical Dementia Rating (CDR): Current version and scoring rules. [see comment]. Neurology 43: , 2412–2414. |
[23] | Ozawa M, Ninomiya T, Ohara T, Hirakawa Y, Doi Y, Hata J, Uchida K, Shirota T, Kitazono T, Kiyohara Y ((2012) ) Self-reported dietary intake of potassium, calcium, and magnesium and risk of dementia in the Japanese: The Hisayama Study. J Am Geriatr Soc 60: , 1515–1520. |
[24] | Squitti R , Barbati G , Rossi L , Ventriglia M , Dal Forno G , Cesaretti S , Moffa F , Caridi I , Cassetta E , Pasqualetti P , Calabrese L , Lupoi D , Rossini PM ((2006) ) Excess of nonceruloplasmin serum copper in AD correlates with MMSE, CSF [beta]-amyloid, and h-tau. Neurology 67: , 76–82. |
[25] | Squitti R , Ghidoni R , Siotto M , Ventriglia M , Benussi L , Paterlini A , Magri M , Binetti G , Cassetta E , Caprara D , Vernieri F , Rossini PM , Pasqualetti P ((2014) ) Value of serum nonceruloplasmin copper for prediction of mild cognitive impairment conversion to Alzheimer disease. Ann Neurol 75: , 574–580. |
[26] | Promjunyakul N , Lahna D , Kaye JA , Dodge HH , Erten-Lyons D , Rooney WD , Silbert LC ((2015) ) Characterizing the white matter hyperintensity penumbra with cerebral blood flow measures. Neuroimage Clin 8: , 224–229. |
[27] | Tchistiakova E , MacIntosh BJ , Alzheimer’s Disease Neuroimaging Initiative ((2016) ) Summative effects of vascular risk factors on cortical thickness in mild cognitive impairment. Neurobiol Aging 45: , 98–106. |
[28] | Wennberg AM , Spira AP , Pettigrew C , Soldan A , Zipunnikov V , Rebok GW , Roses AD , Lutz MW , Miller MM , Thambisetty M , Albert MS ((2016) ) Blood glucose levels and cortical thinning in cognitively normal, middle-aged adults. J Neurol Sci 365: , 89–95. |
[29] | Alosco ML , Gunstad J , Xu X , Clark US , Labbe DR , Riskin-Jones HH , Terrero G , Schwarz NF , Walsh EG , Poppas A , Cohen RA , Sweet LH ((2014) ) The impact of hypertension on cerebral perfusion and cortical thickness in older adults. J Am Soc Hypertens 8: , 561–570. |
[30] | J SR-F , Sa-Roriz TM , Rosset I , Camozzato AL , Santos AC , Chaves ML , Moriguti JC , Roriz-Cruz M ((2009) ) (Pre)diabetes, brain aging, and cognition. Biochim Biophys Acta 1792: , 432–443. |
[31] | Rozanski M , Richter TB , Grittner U , Endres M , Fiebach JB , Jungehulsing GJ ((2014) ) Elevated levels of hemoglobin A1c are associated with cerebral white matter disease in patients with stroke. Stroke 45: , 1007–1011. |
[32] | Gouw AA , van der Flier WM , Fazekas F , van Straaten EC , Pantoni L , Poggesi A , Inzitari D , Erkinjuntti T , Wahlund LO , Waldemar G , Schmidt R , Scheltens P , Barkhof F , Group LS ((2008) ) Progression of white matter hyperintensities and incidence of new lacunes over a 3-year period: The Leukoaraiosis and Disability study. Stroke 39: , 1414–1420. |
[33] | Zhao WQ , Townsend M ((2009) ) Insulin resistance and amyloidogenesis as common molecular foundation for type 2 diabetes and Alzheimer’s disease. Biochim Biophys Acta 1792: , 482–496. |
[34] | Posner HB , Tang MX , Luchsinger J , Lantigua R , Stern Y , Mayeux R ((2002) ) The relationship of hypertension in the elderly to AD, vascular dementia, and cognitive function. Neurology 58: , 1175–1181. |
[35] | Muller M , van der Graaf Y , Visseren FL , Mali WP , Geerlings MI , SMART Study Group ((2012) ) Hypertension and longitudinal changes in cerebral blood flow: The SMART-MR study. Ann Neurol 71: , 825–833. |
[36] | Wang LY , Larson EB , Sonnen JA , Shofer JB , McCormick W , Bowen JD , Montine TJ , Li G ((2009) ) Blood pressure and brain injury in older adults: Findings from a community-based autopsy study. J Am Geriatr Soc 57: , 1975–1981. |
[37] | Franceschi C , Campisi J ((2014) ) Chronic inflammation (inflammaging) and its potential contribution to age-associated diseases.S. J Gerontol A Biol Sci Med Sci 69: (Suppl 1), 4–9. |
[38] | Jung UJ , Choi MS ((2014) ) Obesity and its metabolic complications: The role of adipokines and the relationship between obesity, inflammation, insulin resistance, dyslipidemia and nonalcoholic fatty liver disease. Int J Mol Sci 15: , 6184–6223. |
[39] | Maggio M , Guralnik JM , Longo DL , Ferrucci L ((2006) ) Interleukin-6 in aging and chronic disease: A magnificent pathway. J Gerontol A Biol Sci Med Sci 61: , 575–584. |
[40] | Weaver JD , Huang MH , Albert M , Harris T , Rowe JW , Seeman TE ((2002) ) Interleukin-6 and risk of cognitive decline: MacArthur studies of successful aging. Neurology 59: , 371–378. |
[41] | Wright CB , Sacco RL , Rundek T , Delman J , Rabbani L , Elkind M ((2006) ) Interleukin-6 is associated with cognitive function: The Northern Manhattan Study. J Stroke Cerebrovasc Dis 15: , 34–38. |
[42] | McCarrey AC , Pacheco J , Carlson OD , Egan JM , Thambisetty M , An Y , Ferrucci L , Resnick SM ((2014) ) Interleukin-6 is linked to longitudinal rates of cortical thinning in aging. Transl Neurosci 5: , 1–7. |
[43] | Jefferson AL , Massaro JM , Wolf PA , Seshadri S , Au R , Vasan RS , Larson MG , Meigs JB , Keaney JF Jr , Lipinska I , Kathiresan S , Benjamin EJ , DeCarli C ((2007) ) Inflammatory biomarkers are associated with total brain volume: The Framingham Heart Study. Neurology 68: , 1032–1038. |
[44] | Satizabal CL , Zhu YC , Mazoyer B , Dufouil C , Tzourio C ((2012) ) Circulating IL-6 and CRP are associated with MRI findings in the elderly: The 3C-Dijon Study. Neurology 78: , 720–727. |
[45] | Taki Y , Thyreau B , Kinomura S , Sato K , Goto R , Wu K , Kakizaki M , Tsuji I , Kawashima R , Fukuda H ((2013) ) Correlation between high-sensitivity C-reactive protein and brain gray matter volume in healthy elderly subjects. Hum Brain Mapp 34: , 2418–2424. |
[46] | Wersching H , Duning T , Lohmann H , Mohammadi S , Stehling C , Fobker M , Conty M , Minnerup J , Ringelstein EB , Berger K , Deppe M , Knecht S ((2010) ) Serum C-reactive protein is linked to cerebral microstructural integrity and cognitive function. Neurology 74: , 1022–1029. |
[47] | Aribisala BS , Wiseman S , Morris Z , Valdes-Hernandez MC , Royle NA , Maniega SM , Gow AJ , Corley J , Bastin ME , Starr J , Deary IJ , Wardlaw JM ((2014) ) Circulating inflammatory markers are associated with magnetic resonance imaging-visible perivascular spaces but not directly with white matter hyperintensities. Stroke 45: , 605–607. |
[48] | Schmidt R , Schmidt H , Pichler M , Enzinger C , Petrovic K , Niederkorn K , Horner S , Ropele S , Watzinger N , Schumacher M , Berghold A , Kostner GM , Fazekas F ((2006) ) C-reactive protein, carotid atherosclerosis, and cerebral small-vessel disease: Results of the Austrian Stroke Prevention Study. Stroke 37: , 2910–2916. |
[49] | Fornage M , Chiang YA , O’Meara ES , Psaty BM , Reiner AP , Siscovick DS , Tracy RP , Longstreth WT Jr ((2008) ) Biomarkers of Inflammation and MRI-Defined Small Vessel Disease of the Brain The Cardiovascular Health Study. Stroke 39: , 1952–1959. |
[50] | Sparks DL , Schreurs BG ((2003) ) Trace amounts of copper in water induce beta-amyloid plaques and learning deficits in a rabbit model of Alzheimer’s disease. Proc Natl Acad Sci U S A 100: , 11065–11069. |
[51] | Sparks DL , Friedland R , Petanceska S , Schreurs BG , Shi J , Perry G , Smith MA , Sharma A , Derosa S , Ziolkowski C , Stankovic G ((2006) ) Trace copper levels in the drinking water, but not zinc or aluminum influence CNS Alzheimer-like pathology. J Nutr Health Aging 10: , 247–254. |
[52] | Singh I , Sagare AP , Coma M , Perlmutter D , Gelein R , Bell RD , Deane RJ , Zhong E , Parisi M , Ciszewski J , Kasper RT , Deane R ((2013) ) Low levels of copper disrupt brain amyloid-beta homeostasis by altering its production and clearance. Proc Natl Acad Sci U S A 110: , 14771–14776. |
[53] | Kitazawa M , Hsu HW , Medeiros R ((2016) ) Copper exposure perturbs brain inflammatory responses and impairs clearance of amyloid-beta. Toxicol Sci 152: , 194–204. |
[54] | Bo S , Durazzo M , Gambino R , Berutti C , Milanesio N , Caropreso A , Gentile L , Cassader M , Cavallo-Perin P , Pagano G ((2008) ) Associations of dietary and serum copper with inflammation, oxidative stress, and metabolic variables in adults. J Nutr 138: , 305–310. |
[55] | Skalnaya MG , Skalny AV , Tinkov AA ((2017) ) Serum copper, zinc, and iron levels, and markers of carbohydrate metabolism in postmenopausal women with prediabetes and type 2 diabetes mellitus. J Trace Elem Med Biol 43: , 46–51. |
[56] | Brewer GJ ((2007) ) Iron and copper toxicity in diseases of aging, particularly atherosclerosis and Alzheimer’s disease. Exp Biol Med (Maywood) 232: , 323–335. |
[57] | Rosano C , Marsland AL , Gianaros PJ ((2012) ) Maintaining brain health by monitoring inflammatory processes: A mechanism to promote successful aging. Aging Dis 3: , 16–33. |


