
A Retrospective Belgian Multi-Center MRI Biomarker Study in Alzheimer’s Disease (REMEMBER)
Abstract
Background:
Magnetic resonance imaging (MRI) acquisition/processing techniques assess brain volumes to explore neurodegeneration in Alzheimer’s disease (AD).
Objective:
We examined the clinical utility of MSmetrix and investigated if automated MRI volumes could discriminate between groups covering the AD continuum and could be used as a predictor for clinical progression.
Methods:
The Belgian Dementia Council initiated a retrospective, multi-center study and analyzed whole brain (WB), grey matter (GM), white matter (WM), cerebrospinal fluid (CSF), cortical GM (CGM) volumes, and WM hyperintensities (WMH) using MSmetrix in the AD continuum. Baseline (n = 887) and follow-up (FU, n = 95) T1-weighted brain MRIs and time-linked neuropsychological data were available.
Results:
The cohort consisted of cognitively healthy controls (HC, n = 93), subjective cognitive decline (n = 102), mild cognitive impairment (MCI, n = 379), and AD dementia (n = 313). Baseline WB and GM volumes could accurately discriminate between clinical diagnostic groups and were significantly decreased with increasing cognitive impairment. MCI patients had a significantly larger change in WB, GM, and CGM volumes based on two MRIs (n = 95) compared to HC (FU>24months, p = 0.020). Linear regression models showed that baseline atrophy of WB, GM, CGM, and increased CSF volumes predicted cognitive impairment.
Conclusion:
WB and GM volumes extracted by MSmetrix could be used to define the clinical spectrum of AD accurately and along with CGM, they are able to predict cognitive impairment based on (decline in) MMSE scores. Therefore, MSmetrix can support clinicians in their diagnostic decisions, is able to detect clinical disease progression, and is of help to stratify populations for clinical trials.
INTRODUCTION
In Alzheimer’s disease (AD), the spread of neurodegeneration, and especially tau pathology and synapse loss, is the most important pathological substrate of clinical symptoms [1]. Biomarkers of neurodegeneration, including volumetric analyses of relevant brain regions on magnetic resonance imaging (MRI), correlate better with the degree of cognitive impairment in AD patients as compared to biomarkers of amyloid-β (Aβ) deposition [1–3]. Volumetric brain imaging should include areas in which the neuropathological process of AD is prominent, such as the medial temporal lobe that includes the hippocampus. The atrophy can often be detected at the stage of mild cognitive impairment (MCI) [4–15]. Therefore, hippocampal volume has been proposed as a neuroimaging biomarker for early AD diagnosis in the revised diagnostic criteria of AD [16–20]. Other neuro-anatomical structures, such as the entorhinal cortex [7, 9, 21, 22] and cerebral cortex [23] are also prone to AD pathology. Their morphological characteristics such as volume, shape, and thickness can be used as biomarkers of the extent of neurodegeneration as well [24, 25]. Nevertheless, measuring brain atrophy has some limitations because evolution of disease-related regional atrophy does not necessarily follow the anatomical boundaries of structures. To overcome these limitations, the whole brain (WB) and the (whole) grey matter (GM) volumes have been used as neuroimaging biomarkers for AD diagnosis and evolution [3, 26–33]. Since these anatomical structures are considerably larger than the hippocampus or cortex, the automated quantification of their volumes is, in general, less prone to measurement errors.
To date, different MRI acquisition and processing techniques have been developed to measure volumes of specific brain regions. However, their accuracy is still limited by a moderate sensitivity and a rather low specificity for AD [34]. Manual segmentation approaches, which are time consuming, have been widely used and are considered a standard approach by experts in neuroanatomy [35, 36], though large-scale studies are limited [4, 37]. Semi-automated techniques are less time consuming, however a priori information such as user-defined landmarks is needed, which also limits their usefulness for large clinical studies [38–40]. To date, an increasing number of studies have investigated structural brain changes in AD populations with an automated image-based brain morphometry analysis, as this is less time consuming and does not suffer from large intra- and inter-observer variability compared to manual and semi-automated approaches. This trend relates to both the widespread availability of brain imaging equipment in clinical routine and research, and the concurrent development of image analysis software packages released over the past years [41–46]. MSmetrix, is another fully automated and European Conformity (CE)-labelled and Food and Drug Administration (FDA)-cleared tool, specifically designed to measure atrophy in patients with multiple sclerosis (MS) and has been validated in these patients (we refer to Supplementary Material for more detailed information of the validation process) [47–51]. As this method uses clinical brain MRI scans in contrast to many other tools that apply MRI scans from selected clinical trial/research cohorts, we decided to use the output of MSmetrix, which included WB, (whole) GM, white matter (WM), cerebrospinal fluid (CSF), cortical GM (CGM) volumes, and WM hyperintensities (WMH), in a ‘retrospective Belgian multi-center MRI biomarker study in dementia’ (REMEMBER). We examined whether MSmetrix is an accurate and reproducible segmentation approach to differentiate between healthy controls and AD patients, covering the entire AD continuum, and thus is of clinical utility for the diagnostic work-up and for clinical trials. Therefore, we set up a study to assess the diagnostic value of automated volumetry using MSmetrix in a population comprising the entire AD continuum (AD, MCI, subjective cognitive decline (SCD)), as well as cognitively healthy elderly (primary objective). The secondary objective of this study was to investigate if automated volumetry using MSmetrix is an early diagnostic marker for AD and as a possible predictor for clinical progression.
MATERIALS AND METHODS
Study design
The retrospective Belgian multi-center study cohort consists of participants who underwent a baseline brain MRI scan, in combination with a clinical neurological and neuropsychological evaluation for diagnostic purposes. A neuropsychological evaluation, at least consisting of a screening instrument such as the Mini-Mental State Examination (MMSE) test was sufficient to be included in the study.
A subset of the population underwent a repeat brain MRI scan with or without a neuropsychological evaluation (time interval between baseline and follow-up investigations, for both MRI and neuropsychological evaluations, was at least three months).
The study was approved by the ethics committee of University of Antwerp/Universitair Ziekenhuis Antwerpen (N°16/2/18), Antwerp and by the ethics committees of Algemeen Ziekenhuis Sint-Jan Brugge-Oostende, Brugge (N°1992); Centre Hospitalier Universitaire Brugmann (CHU Brugmann), Brussels (N°2016/84); Centre Hospitalier Universitaire Liège (CHU Liège), Liège (N°2012/274); Cliniques Universitaires de Bruxelles (ULB), Hôpital Erasme, Brussels (N°P2016/187); Cliniques Universitaires Saint-Luc (UCL), Brussels (N°2016/07jui/261); Cliniques St-Pierre Ottignies, Ottignies (N°OM045); Universitair Ziekenhuis Brussel, Brussels (N°2016/183); and Ziekenhuis Netwerk Antwerp (ZNA), Antwerp (N°4730).
Study population
Patients and cognitively healthy controls were selected from existing cohorts in several memory clinics that are members of the Belgian Dementia Council (BeDeCo). SCD, MCI, and dementia due to AD patients were included in this retrospective multi-center study. The group of cognitively healthy elderly was selected among available (research) cohorts, like spouses of patients who visited the memory clinic and community-dwelling volunteers.
2.2.1Clinical diagnostic criteria
In order to avoid a selection bias, all patients were considered for inclusion, irrespective of the severity of cognitive deterioration. The patients were diagnosed by an experienced clinician in each center. Diagnosis of dementia due to AD was based on NIA-AA criteria [17, 19]. At baseline, MCI due to AD was diagnosed by applying the NIA-AA criteria [16–18, 20]. When sufficient neuropsychological data were available, MCI patients were divided into four subgroups. MCI patients were categorized in single-domain (sd) and multi-domain (md) MCI based on the neurocognitive domains scoring below 1.5 SD on their respective z-scores. Z-scores were used from population-based norms and were age-adjusted. In addition, MCI patients were also categorized as amnestic MCI (aMCI) and non-amnestic MCI (naMCI) based on z-scores below – 1.5 SD per cognitive domain. In case the delayed memory domain was below a z-score of 1.5 SD, a patient was classified as aMCI, whereas naMCI was based on z-scores from one of the other cognitive domains, such as immediate memory, visuospatial/constructional abilities, language or attention. SCD patients were diagnosed by the Jessen’s et al. criteria in the same way as the MCI patients but without an objective cognitive impairment, so all neuropsychological subtests having a z-score above – 1.5 [52]. All control subjects underwent at least a cognitive screening test to rule out cognitive impairment. The control subjects did not meet the Jessen’s et al. criteria of SCD [52].
Exclusion criteria for the total population consisted of brain tumors, large cerebral infarction/bleeding, strategic infarctions, other neurodegenerative diseases, severe head trauma, epilepsy, brain infections, severe depression, unregulated diabetes mellitus, untreated thyroid disorders, or any severe somatic co-morbidity that interferes with study participation.
Imaging
2.3.1Image acquisition
All MRI scans were obtained from respective Neuroimaging Departments, to which subjects were referred. MRI scans from all scanner types were accepted. The minimal requirements for the MRI protocol included a T1-weighted image with a preferred voxel size of the 3D T1 (1×1×1 mm). A FLAIR image was optional, with the same preferences as the above described T1-weighted image.
2.3.2Image analyses
The MRI data were processed using the CE-labelled and FDA-cleared software called MSmetrix, to extract WB, GM, WM, CSF (intra- and inter-ventricular CSF), CGM, and WMH volumes (MSmetrix-cross). Thereto, the T1-weighted MRI images were segmented into WM, GM, and CSF using a probabilistic model, including bias field correction. In case a FLAIR image was available, WMH were extracted using an outlier model and lesion filling of the T1-weighted image was performed prior to segmentation into WM, GM, and CSF [50]. Finally, WB was computed as WM and GM, while CGM was extracted from the GM segmentation based on prior knowledge of the shape and appearance of the cortical area. The duration was approximately less than 30 minutes per individual. This includes on average 22 minutes processing and 7 minutes QC per subject.
If a repeat brain MRI was available a longitudinal registration based approach was used, using the cross-sectional segmentations as an input to extract brain atrophy and lesion changes (MSmetrix-long). This ensures a low measurement error of the brain atrophy measurements [47] and a more consistent evaluation of lesion changes [49].
All extracted measures were corrected for head size, as a consequence only normalized measures were used in further analyses. Head size was normalized by scaling the measured volume of the image with the determinant of the affine transformation matrix that describes the transformation between the Montreal Neurological Institute (MNI) atlas and the image.
A quality control (QC) of the extracted measurements was performed per center by E.N. and H.S. Moreover, a visual assessment of the segmentations was performed for all ‘outlier’ measurements. The ‘outliers’ included scans with volumes below the 10th and above the 90th percentile within the cohort of the center. Volumes that were not correctly segmented were completely rejected or approved with remarks. In detail, in case the segmentation approach completely failed, volumes were not trustworthy and values were excluded for further analyses. If the volumetric approach was in part correctly segmented and the WB volumetric analysis could be trusted, the scans were classified as approved with remarks. All other scans, with a correct segmentation were subdivided as approved. WMH underwent the same ‘outlier QC’ and were divided into two groups, namely approved or rejected. The QC of the scans was always dependent on the protocol used in each center. Therefore, scans were often rejected due to a low quality of the scans and/or large slice thickness (>3 mm) that led to missegmentation of the volumes.
Statistical analyses
Distribution of categorical variables, such as gender, within subject groups were analyzed with a Chi-Square test, and percentages were reported. Demographic comparisons and other analyses including MRI measures were based on ANOVA and/or ANCOVA tests with post hoc Bonferroni tests. ANCOVA tests were performed to analyze the extracted MRI measures and were corrected for center and age at baseline (date of MRI acquisition) in cross-sectional analyses. Longitudinal analyses, performed by ANCOVA tests to analyze the differences in volumes between two MRI scans were corrected for center, age at baseline, and time between the MRI scans. In case neuropsychological test scores were used as outcome variable, ANCOVA tests corrected for years of education, age at baseline, and baseline clinical diagnoses were used (based on baseline MRI scans). Field strength was not included as a covariate, as the study of Lysandropoulos et al. detected no significant difference for this variable when MSmetrix was used [48]. Area under the curves (AUCs) of receiver operating characteristics (ROC) curves were calculated for volumetric measurements and cut-offs were determined. A single variable linear regression model was used to analyze the relationship between volumetric measures and the MMSE scores. In the first model, the relationship of each volume (independent variable) with MMSE score (dependent variable) was assessed (model 1). In a second model, the same relationships were assessed after controlling for age and baseline clinical diagnosis (model 2). Results are represented as standardized regression coefficients (β-values) with 95% CI and p-values to allow comparisons of effect sizes.
For all analyses, two-tailed p-values below 0.05 were considered significant. All statistical analyses were performed using GraphPad Prism 6 and IBM SPSS Statistics 24.
RESULTS
Overview of the REMEMBER cohort
The study cohort from eight Belgian centers, included cognitively healthy controls (n = 93), SCD (n = 102), MCI (n = 379), and AD dementia patients (n = 313), and represented a total of 887 subjects (Supplementary Table 1).
Table 1
REMEMBER baseline study population
| Controls (n = 93) | SCD (n = 102) | MCI (n = 379) | AD dementia (n = 313) | p | |
| Gender (% male/female) | 47/53 | 46/54 | 51/49 | 39/61 | 0.018 |
| Age at BL (y) | 67.3±8.5 [61.2–74.2]∧, # | 68.6±9.8 [61.1–76.3]∧, # | 74.6±8.0 [69.4–80.3]*, #, ‡ | 77.5±8.0 [72.6–83.9]*, ∧, ‡ | 0.001 |
| Time between BL NPE and last clinical visit (y) (n) | 2.5±1.6 (43) [2.0–2.0] | 2.2±2.2 (73) [0.3–4.1] | 2.3±1.8 (305) [0.9–3.6]# | 1.8±1.8 (212) [0.4–2.7]∧ | 0.020 |
| Time between BL and conversion (y) (n) | – | 1.9±1.5 (17) [0.7–3.7] | 1.8±1.3 (101) [0.9–2.4] | – | 0.066 |
| MMSE from 0–30 (n) | 29.3±0.9 (72) [29.0–30.0]∧, # | 28.6±1.4 (94) [28.0–30.0]∧, # | 25.1±3.3 (361) [23.0–28.0]*, #, ‡ | 20.6±4.7 (300) [18.0–24.0]*, ∧, ‡ | 0.001 |
| YOE (years) | 14.9±3.8 (60) [12.0–17.0]∧, # | 15.1±4.0 (94) [12.0–18.0]∧, # | 13.0±4.1 (353) [10.0–17.0]*, #, ‡ | 10.9±4.0 (277) [8.0–14.0]*, ∧, ‡ | 0.001 |
| WB (mL) | 1442.3±63.6 (90) | 1392.4±72.6 (97) | 1353.9±71.2 (340) | 1319.6±82.4 (277) | 0.001, 0.013¶ |
| [1396.6–1491.4]*, ∧, # | [1344.0–1440.5]∧, #, ‡ | [1308.1–1401.7]*, #, ‡ | [1263.2–1365.6]*, ∧, ‡ | ||
| GM (mL) | 844.3±42.8 (89) | 817.2±55.7 (96) | 793.7±60.2 (334) | 779.2±69.4 (227) | 0.001, 0.003, |
| [819.5–872.9]∧, # | [778.6–857.9]∧, # | [754.3–837.9]*, #, ‡ | [735.1–824.1]*, ∧, ‡ | 0.043¥ | |
| WM (mL) | 597.1±47.6 (89) | 575.3±45.2 (96) | 559.6±48.0 (334) | 549.8±52.4 (227) | 0.001, 0.018£ |
| [564.8–633.1]*, ∧, # | [539.9–614.1]‡ | [525.8–593.8]‡ | [517.3–587.0]‡ | ||
| CSF (mL) | 534.2±77.0 (89) | 600.7±101.6 (96) | 640.0±114.0 (334) | 675.9±134.3 (227) | 0.001, 0.008, |
| [481.8–572.8]*, ∧, # | [533.5–663.0]#, ‡ | [558.7–704.7]#, ‡ | [572.6–754.2]*, ∧, ‡ | 0.007± | |
| CGM (mL) | 796.8±40.1 (89) | 770.7±53.2 (96) | 749.8±56.6 (334) | 737.1±64.6 (277) | 0.001§ |
| [774.9–819.8]∧, # | [736.1–807.2]∧, # | [713.9–789.9]*, ‡ | [695.4–779.8]*, ‡ | ||
| WMH (mL) | 5.1±6.5 (43) [1.7–5.1] | 11.8±14.4 (66) [2.6–15.0] | 15.1±13.7 (202) [5.6–20.8] | 19.3±15.5 (148) [6.5–29.0] | 0.121 |
Legend: data are mean±SD and [IQR], percentages (%), and numbers (n). P-values are general Chi-Square for gender or ANCOVA test results (for all other measures), whereas the p-values described below are based on the differences of post hoc analyses. Normalized brain volumes (WB, GM, WM, CSF, CGM, and WMH) are reported. ¶SCD versus MCI p = 0.013. Other comparisons: p = 0.001. ¥SCD versus MCI p = 0.003; MCI versus AD dementia p = 0.043. Other comparisons: p = 0.001. £Controls versus SCD p = 0.018. Other comparisons: p = 0.001. ±Controls versus SCD p = 0.008; MCI versus AD dementia p = 0.007. Other comparisons: p = 0.001. §SCD versus MCI p = 0.004. Other comparisons: p = 0.001. *Significantly different compared to SCD. ∧Significantly different compared to MCI. #Significantly different compared to AD dementia. ‡Significantly different compared to controls. AD, Alzheimer’s disease; BL, baseline; CGM, cortical grey matter; CSF, cerebrospinal fluid; FU, follow-up; GM, grey matter; IQR, interquartile range; MCI, mild cognitive impairment; MMSE, Mini-Mental State Examination; NPE, neuropsychological examination; REMEMBER, retrospective Belgian multi-center MRI biomarker study in dementia; SCD, subjective cognitive decline; SD, standard deviation; WB, whole brain; WM, white matter; WMH, white matter hyperintensities; YOE, years of education.
Baseline brain MRI scans were available for all subjects and volumetric analyses were performed (MSmetrix-cross). Baseline scans were acquired at 1.5T (Siemens, n = 126; GE, n = 90; Philips, n = 119) and 3T scanners (Siemens, n = 313; GE, n = 50; Philips, n = 189; we refer to Supplementary Tables 2 and 3 for more detailed information). In total, 746 scans (84%) were approved after QC and all volumes (WB, GM, WM, CSF, CGM) were included for further analyses. Fifty-eight MRI scans were approved with remarks after QC as the volumes were not correctly segmented but WB volumes were still accurate and were included in the analyses of WB volume. This led to a total of 804 subjects (91%) with an approved WB volume. Eighty-three scans were excluded for analysis due to large slice thickness (>3 mm) and/or missegmentation of volumes due to low quality of scans. To analyze WMH, 629 FLAIR sequences were available of which 170 scans were rejected after QC, and further analysis was performed on a total of 459 MRI scans (73%).
Table 2
REMEMBER based on follow-up MRI: study population
| HC-SCD (n = 25) | MCI (n = 50) | AD dementia (n = 20) | p | |
| Gender (% male/female) | 40/60 | 46/54 | 55/45 | NS |
| Age at BL (y) | 66.0 [60.2–70.6]∧, # | 72.2 [67.8–77.3]‡ | 72.9 [67.7–78.7]‡ | 0.006, 0.009¶ |
| Time between scans (mo) | 23.5 [12.5–27.0] | 20.9 [12.4–24.7] | 17.9 [11.7–24.1]‡ | NS |
| Time between BL and last FU (y) (n) | 2.0 [1.0–2.5] (21) | 2.0 [1.0–3.3] (45) | 2.1 [1.0–2.6] (20) | NS |
| Time between BL and conversion (y) (n) | 1.1 [0.9–1.2] (5) | 1.8 [1.0–2.1] (17) | – | NS |
| MMSE from 0–30 | 28.7 [27.5–30.0]∧, # | 25.7 [23.0–28.0]#, ‡ | 22.0 [20.3–24.0]∧, ‡ | 0.001 |
| YOE (years) (n) | 16.8 [12.8–20.3] (24) # | 15.1 [12.0–19.0] (43) | 14.1 [12.0–16.0] (19) ‡ | 0.018 |
| WB (%) | – 1.26 [– 2.31: – 0.41] | – 1.62 [– 2.66: – 0.81] | – 1.64 [– 2.79: – 0.64] | NS |
| GM (%) | – 0.83 [– 1.73: – 0.20] | – 1.26 [– 2.78: – 0.46] | – 1.37 [– 2.59: – 0.49] | NS |
| WM (%) | – 1.85 [– 2.78: – 1.26] | – 2.14 [– 3.52: – 0.49] | – 2.01 [– 3.00: – 0.70] | NS |
| CSF (%) | 4.66 [1.73: 7.91] | 4.78 [2.38: 7.20] | 4.09 [2.26: 5.96] | NS |
| CGM (%) | – 0.88 [– 1.82: – 0.19] | – 1.28 [– 2.90: – 0.38] | – 1.42 [– 2.64: – 0.27] | NS |
| WMH (mL) | – 0.31 [– 0.99: 1.37] | – 0.75 [– 2.31: 1.03] | 2.22 [– 0.05: 2.22] | NS |
Legend: data are mean and [IQR], percentages (%), and numbers (n). P-values are general ANCOVA test results, whereas the p-values described below are based on the differences of post hoc analyses. Changes in normalized brain volumes (WB, GM, WM, CSF, and CGM) at two time points are reported in percentages (%). WMH volume changes at two time points are reported in mL. ¶HC-SCD and MCI p = – 0.006; HC-SCD and AD dementia p = 0.009. ∧Significantly different compared to MCI. #Significantly different compared to AD dementia. ‡Significantly different compared to HC-SCD. AD, Alzheimer’s disease; BL, baseline; CGM, cortical grey matter; HC-SCD, group of controls and subjective cognitive decline; CSF, cerebrospinal fluid; FU, follow-up; GM, grey matter; IQR, interquartile range; MCI, mild cognitive impairment; MMSE, Mini-Mental State Examination; NS, not significant; REMEMBER, retrospective Belgian multi-center MRI biomarker study in dementia; WB, whole brain; WM, white matter; WMH, white matter hyperintensities; YOE, years of education.
Follow-up brain MRI scans were available in 95 subjects (11%) and all volumetric analyses were approved, for both MSmetrix-cross and MSmetrix-long. Follow-up scans were acquired at 1.5T(Siemens, n = 4; Philips, n = 7) and 3T scanners (Siemens, n = 75;] Philips, n = 9). The cohort consisted, based on baseline diagnosis, of a group of cognitively healthy controls and SCD, abbreviated as HC-SCD (n = 25), MCI (n = 50), and AD dementia patients (n = 20).
Study population
The demographic and clinical characteristics of the different diagnostic subgroups are given in Table 1. The AD dementia group consisted of significantly more females than males. Age at baseline was significantly different between all groups (p = 0.001), except between cognitively healthy controls and SCD patients. AD dementia patients were the oldest patient group followed by MCI, SCD, and controls. Time between baseline MRI and neuropsychological examination was in most cases short (mean [interquartile range (IQR)] 2.7 [0.0–2.1] months). In total, 633 subjects were clinically followed-up with a mean total follow-up of 2.1 [IQR: 0.6–3.2] years (Table 1). The time interval between baseline MRI scan and last clinical visit was only significantly different between MCI and AD dementia patients, which was shorter for AD dementia patients compared to the MCI group. In case an SCD subject developed MCI/AD dementia (n = 15/n = 2, 17%) or in case an MCI patient progressed to dementia (n = 101, 27%), the time between baseline MRI and diagnostic conversion was not different between those two groups (mean [IQR] 1.8 [0.9–2.4] years, p = 0.066). MMSE scores were significantly different between all groups, except between cognitively healthy controls and SCD patients, with the lowest scores in AD dementia patients and highest scores in the control and SCD subjects. Cognitively healthy controls and SCD patients were significantly more educated than MCI and AD dementia patients.
In total, 95 subjects had a follow-up MRI scan (Table 2). Gender, time between scans, and time between baseline and last clinical follow-up/conversion were not significantly different between the clinical diagnostic groups. The MCI and AD dementia patients were significantly older compared to the HC-SCD subjects (respectively, p = 0.006 and p = 0.009). MMSE scores were significantly different between all clinical diagnostic groups (p = 0.001). Individuals with a follow-up MRI scan had higher MMSE scores compared to subjects without a follow-up scan, however this was only significantly different in the MCI patients (p = 0.004). HC-SCD subjects were higher educated compared to AD dementia subjects (p = 0.018).
Imaging analyses
3.3.1Cross-sectional MSmetrix analyses in the total population
All volumes and WMH discriminated AD dementia patients and cognitively healthy controls with a high diagnostic accuracy (sensitivity and specificity), as shown in Table 3 (for cut-offs, see Supplementary Table 4). Cross-sectional analyses, corrected for age at baseline and center, showed significant differences between all clinical diagnostic groups for WB (Fig. 1A). GM was significantly different between all groups, except between cognitively healthy controls and SCD patients (Fig. 1B). WM and CSF volumes were significantly different between controls and all other groups, and CSF volumes of AD dementia patients were significantly larger than SCD and MCI patients. MCI and AD dementia patients showed a significant smaller CGM volume compared to controls and SCD (Fig. 1C). The largest WB, GM, WM, and CGM volumes were detected in the control group and decreased by cognitive impairment (SCD<MCI<AD dementia), whereas the opposite was found for the CSF volume. No significant differences were detected for the WMH between the different clinical diagnostic groups. Stable MCI patients (n = 162) and MCI patients that progressed to AD dementia (n = 101) were not significantly different for any of the volumetric measurements and WMH on baseline MRI scans.
Fig.1
WB, GM, and CGM volumes across the different clinical diagnosis. Scatterplots of WB (A), GM (B), and CGM (C) volumes in mL per clinical diagnostic category with their corresponding mean±SD. Significant differences were reported between clinical diagnoses, p = 0.001* or p < 0.05 (a-d). Volumes were significantly different between a clinical diagnostic group and cognitively healthy controls (a), to SCD (b), to MCI (c), or to AD dementia patients (d). WB was significantly different between all diagnostic groups. GM was significantly different between all diagnostic groups, except between controls and SCD. The CGM was significantly different between controls and SCD versus MCI and AD dementia. AD, Alzheimer’s disease; CGM, cortical grey matter; GM, grey matter; MCI, mild cognitive impairment; SCD, subjective cognitive decline; SD, standard deviation; WB, whole brain.
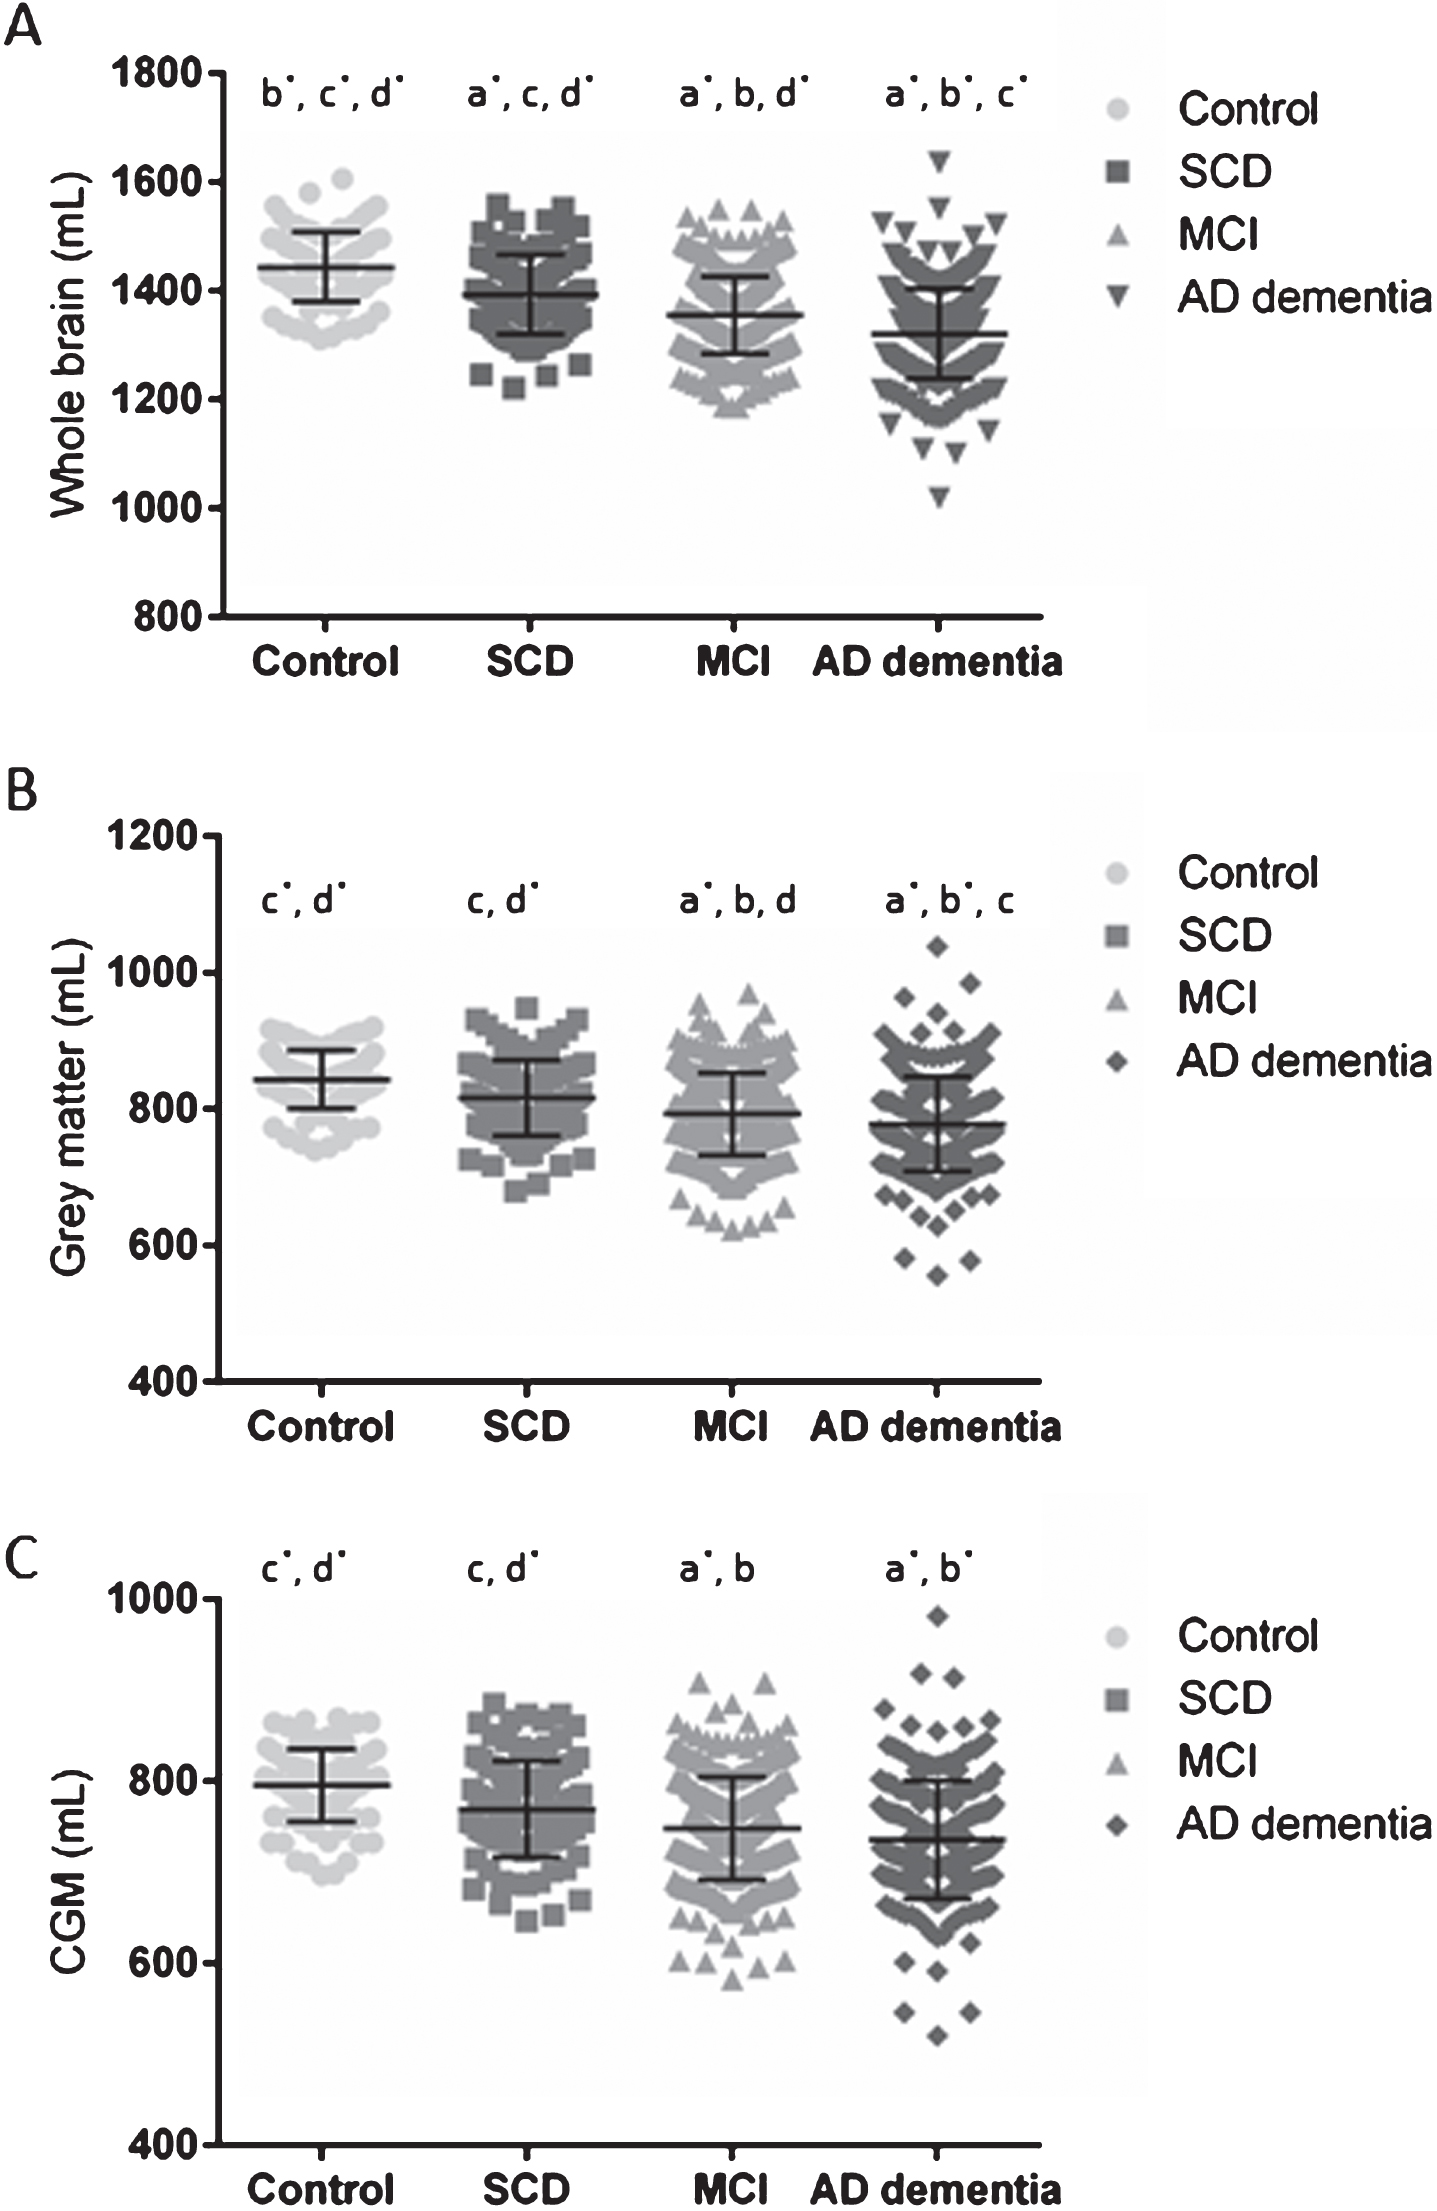
Table 3
Diagnostic performance of volumetric measurements between cognitively healthy controls and AD dementia patients
| Versus SCD stage | Versus MCI stage | Versus AD dementia stage | ||||||||||
| AUC | Sens (%) | Spec (%) | 95% CI | AUC | Sens (%) | Spec (%) | 95% CI | AUC | Sens (%) | Spec (%) | 95% CI | |
| WB | ||||||||||||
| HC | 0.700 | 81.1 | 52.6 | 0.626–0.775 | 0.820 | 84.4 | 67.4 | 0.774–0.865 | 0.882 | 85.6 | 78.8 | 0.847–0.918 |
| SCD | 0.645 | 67.0 | 57.1 | 0.584–0.706 | 0.750 | 67.0 | 73.3 | 0.697–0.804 | ||||
| GM | ||||||||||||
| HC | 0.655 | 78.7 | 54.2 | 0.576–0.735 | 0.753 | 82.0 | 63.2 | 0.702–0.804 | 0.795 | 79.8 | 71.4 | 0.746–0.844 |
| SCD | 0.613 | 63.5 | 57.5 | 0.552–0.674 | 0.674 | 86.5 | 47.1 | 0.614–0.735 | ||||
| WM | ||||||||||||
| HC | 0.629 | 78.7 | 44.8 | 0.549–0.709 | 0.703 | 78.7 | 52.4 | 0.643–0.764 | 0.746 | 78.7 | 59.9 | 0.688–0.805 |
| SCD | 0.585 | 31.3 | 85.9 | 0.520–0.649 | 0.636 | 70.8 | 50.2 | 0.571–0.701 | ||||
| CSF | ||||||||||||
| HC | 0.706 | 58.4 | 77.1 | 0.631–0.780 | 0.783 | 597.5 | 67.4 | 0.732–0.834 | 0.824 | 85.4 | 70.9 | 0.776–0.872 |
| SCD | 0.615 | 63.5 | 59.3 | 0.552–0.677 | 0.673 | 71.9 | 59.5 | 0.612–0.735 | ||||
| CGM | ||||||||||||
| HC | 0.656 | 79.8 | 56.3 | 0.577–0.736 | 0.749 | 85.4 | 59.3 | 0.698–0.800 | 0.791 | 79.8 | 72.2 | 0.741–0.841 |
| SCD | 0.607 | 79.2 | 39.8 | 0.545–0.669 | 0.664 | 85.4 | 47.6 | 0.603–0.726 | ||||
| WMH | ||||||||||||
| HC | 0.678 | 83.7 | 51.1 | 0.576–0.779 | 0.811 | 83.7 | 74.8 | 0.737–0.885 | 0.852 | 81.4 | 84.5 | 0.787–0.916 |
| SCD | 0.628 | 62.1 | 63.4 | 0.545–0.711 | 0.684 | 48.5 | 84.5 | 0.604–0.764 | ||||
Data are AUC, sensitivity, specificity, and 95% CI. AUCs were determined by ROC for all volumetric measurements. Highest accuracies were detected between HC and AD dementia (0.746–0.882) or MCI patients (0.703–0.820) and between SCD and AD dementia patient (0.629–0.706), with the highest accuracies for WB. However, differentiating in the earlier stages of the disease showed lower accuracies (HC versus SCD 0.629–0.796; SCD versus MCI 0.558–0.645) for all volumetric measurements. AD, Alzheimer’s disease; AUC, area under the curve; CGM, cortical grey matter; CI, confidence interval; CSF, cerebrospinal fluid; GM, grey matter; HC, cognitively healthy controls; MCI, mild cognitive impairment; ROC, receiver operating characteristic; SCD, subjective cognitive decline; sens, sensitivity; spec, specificity; WB, whole brain; WM, white matter; WMH, white matter hyperintensities.
Table 4
Prediction of disease severity based on extracted MRI measures by the MMSE score
| Model 1-volume | Model 2 – volume: age and clinical diagnosis at BL | |||||
| R2 | β [95% CI] | p-value | R2 | β [95% CI] | p | |
| WB (n = 804) | 0.165 | 0.406 [0.34: 0.47] | 0.001 | 0.422 | 0.150 [0.08: 0.22] | 0.001 |
| GM (n = 746) | 0.115 | 0.339 [0.27: 0.41] | 0.001 | 0.449 | 0.156 [0.10: 0.21] | 0.001 |
| WM (n = 746) | 0.047 | 0.216 [0.14: 0.29] | 0.001 | 0.428 | 0.012 [– 0.05: 0.07] | 0.706 |
| CSF (n = 746) | 0.111 | – 0.333 [– 0.40: – 0.26] | 0.001 | 0.439 | – 0.119 [– 0.18: – 0.06] | 0.001 |
| CGM (n = 746) | 0.107 | 0.327 [0.26: 0.40] | 0.001 | 0.447 | 0.148 [0.09: 0.21] | 0.001 |
| WMH (n = 459) | 0.063 | – 0.252 [.034: – 0.16] | 0.001 | 0.426 | – 0.044 [– 0.12: 0.04] | 0.280 |
Data are R square (R2), standardized regression coefficients (β-values) with 95% confidence intervals [95% CI], and p-values. Model 1 predicted the MMSE score significantly for all volumes, whereas model 2 showed a significant difference for WB, GM, CSF, and CGM when age and clinical diagnosis at baseline were introduced to the analysis. BL, baseline; CGM, cortical grey matter; CI, confidence interval; CSF, cerebrospinal fluid; GM, grey matter; MMSE, Mini-Mental State Examination; WB, whole brain; WM, white matter; WMH, white matter hyperintensities.
3.3.2Cross-sectional MSmetrix analyses in the MCI patients
By dividing the MCI patients in sd MCI (n = 129) and md MCI (n = 211), significantly larger volumetric measurements were detected between HC and all other diagnostic groups, SCD and md MCI patients or AD dementia, and sd MCI and AD dementia patients. In case aMCI and naMCI were taken into account, both sd MCI subgroups (sd aMCI, n = 84; sd naMCI, n = 45) had significantly larger volumes (all volumetric measurements) compared to AD dementia, whereas no significant differences were detected between both md MCI groups (md aMCI (n = 191) and md naMCI (n = 20)) and AD dementia. In addition, the only MCI subgroup that had significantly smaller volumes (all volumetric measurements) compared to SCD was the md aMCI group. WMH were not significantly different between any MCI patient subgroup.
3.3.3Longitudinal MSmetrix analyses (Table 2)
Longitudinal data analyses (n = 95), of two MRI scans for the same subject, corrected for center, age at baseline MRI scan, and time between MRI scans showed no significant differences between clinical diagnostic groups for the change in volumes over time. However, in case the interval between two scans was more than 24 months (n = 31) there was a significant difference between the HC-SCD (n = 10) and MCI (n = 16) patients for the change in WB (mean difference of 2.130, p = 0.019), GM (mean difference of 2.524, p = 0.038), and CGM (mean difference of 2.475, p = 0.048). The largest changes were detected in the AD dementia group and the smallest changes in the HC-SCD for WM, GM, and CGM.
3.3.4Neuropsychological data analyses in combination with volumetric MRI measures
An MMSE score was available for 93% of all subjects. Linear regression models per volume (model 1), significantly predicted the MMSE scores for all volumes (Table 4). When age and clinical diagnosis at baseline were introduced to the analyses (model 2), WB, GM, CSF, and CGM could significantly predict MMSE score.
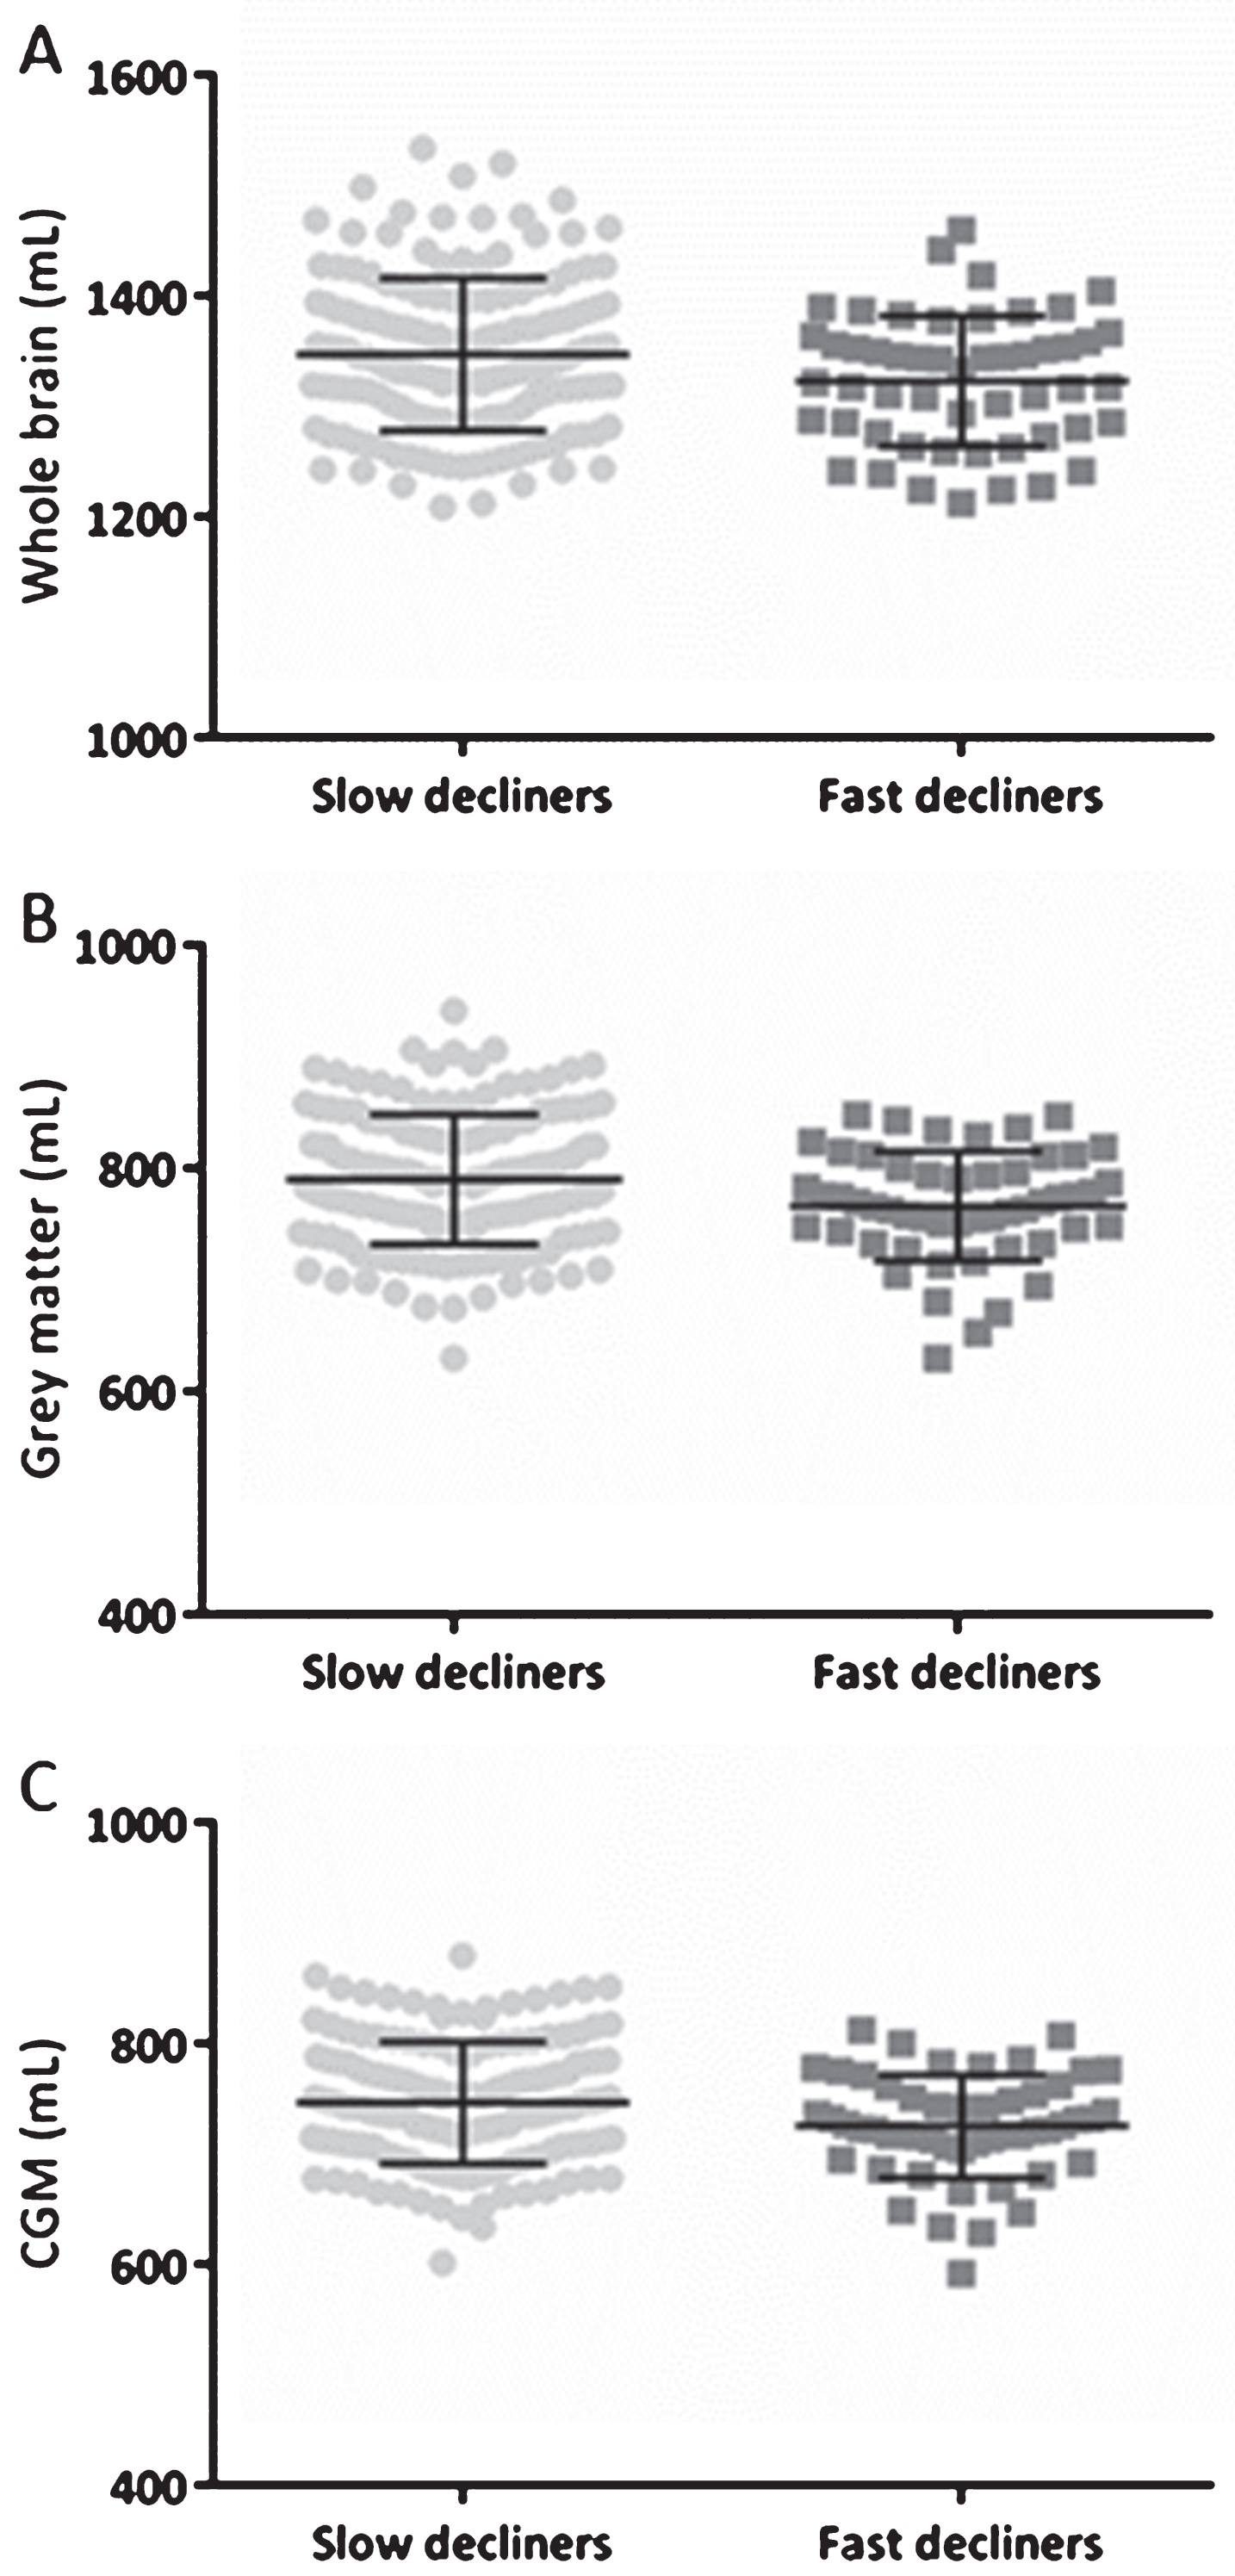
Follow-up MMSE scores, with at least three months between baseline and last follow-up MMSE score, were available in 429 subjects (2.4 [1.1–3.4] years). The MMSE slopes were calculated based on the difference in MMSE scores and were divided by the follow-up time. Subjects were divided in four groups: (1) subjects with an improvement in MMSE score (n = 117, improvers: MMSE slope<0), (2) with no change in MMSE score (n = 71, stable: MMSE slope = 0), (3) with a slow decline (n = 182, slow decliners), and (4) with a fast decline in MMSE score (n = 59, fast decliners). Subjects were categorized as slow decliners in case the MMSE slope was smaller than three, and if the slope was equal or larger than three subjects were categorized as fast decliners. Significant differences were found for the baseline measurements of WB, GM, and CGM between fast and slow decliners, with smaller baseline volumes in the fast decliners (Fig. 2).
Fig.2
WB, GM, and CGM volumes across slow and fast decliners in the total population based on MMSE. Scatterplots of WB (A), GM (B), and CGM (C) volumes in mL at baseline with their corresponding mean±SD. The MMSE slopes were calculated based on the difference in MMSE scores and were divided by the follow-up time. Subjects were categorized as slow decliners in case the MMSE slope was smaller than three, and if the slope was equal or larger than three a subject was categorized as a fast decliner. Significant differences were found for all volumes showed. CGM, cortical grey matter; GM, grey matter; MMSE, Mini-Mental State examination; SD, standard deviation; WB, whole brain.
DISCUSSION
In the present large multi-center study, including 887 subjects, we analyzed volumetric brain measurements with the CE-labeled and FDA-approved software pipeline MSmetrix that has been developed for clinical use in MS and has proven high accuracy for longitudinal analyses at the individual patient level [47–51]. Moreover, this study used this fully automated segmentation approach to further decrease the observer dependency as well as the time needed from the expert (<30 min/subject), and standardize the quantification of MRI readings. Thus, the fully automated procedure has reduced reliance on anatomical expertise and provide rapid results compatible with clinical practice. In addition, MSmetrix uses clinical brain MRI scans in contrast to many other tools that apply MRI scans from selected clinical trial/research cohorts. Another advance of MSmetrix is the use of Digital Imaging and Communications in Medicine (DICOM) format images, which are ideal to create a fast clinical workflow. Therefore, MSmetrix translates the volumetric measures from a research setting to routine clinical practice. Nevertheless, in differential dementia diagnosis the usefulness of these MRI measures is limited due to effect that atrophy is not AD-specific.
By applying this software in the AD continuum and cognitively healthy elderly, we found that the volumetric volumes were significantly smaller with increased cognitive impairment. In addition, WB and GM accurately discriminated between clinical diagnostic groups, whereas WM, CSF, and CGM were less accurate. For this reason, the output measures of MSmetrix are able to support the clinical diagnostic work-up of AD. The diagnostic accuracies of the volumetric measures are comparable or better compared to the current literature [3, 26, 53–55]. WMH were not significantly different between diagnostic groups. A higher degree of WMH is known to be associated with poorer cognitive function [56, 57]. However, the lack of significant differences could be explained by the reflection of low variability, as a trend was found in the expected direction with more WMH by more cognitive impairment (Table 1).
In addition, the method failed to distinguish stable MCI patients from MCI patients that progressed to AD dementia as no significant differences were detected for baseline volumetric measurements. A possible explanation is that volume change of specific brain regions over time may be more indicative than a static cross-sectional assessment. Moreover, the brain is affected by normal aging and disease progression, and there is individual variation in brain anatomy, which makes it difficult to discriminate between groups. Especially the MCI subgroups are difficult to distinguish as they are in the same disease stage of the continuum. Longitudinal data could avoid the limitations of cross-sectional analyses [58–61], however in our cohort also no differences between the stable MCI patients and MCI converters were detected in the longitudinal analyses. Probably, this is due to a small sample size of available longitudinal MRI scans in MCI patients (n = 50, of which 9 converters). In general, brain volume changes over time correlate with and predict deterioration of cognitive performance [34] and seem more sensitive to AD-like brain atrophy features than CSF measures or β-amyloid deposition measured with positron emission imaging (PET) [62]. Thus, longitudinal assessment of MSmetrix-long is relevant in the setting of chronic and progressive neurologic conditions, such as AD and MS. Another solution to differentiate the MCI subgroups is to consider analyzing specific brain regions, such as the hippocampus [13–15]. Nevertheless, our longitudinal data analyses (interval between MRI scans >24 months) showed a significant decrease in WB, GM, and CGM volumes in MCI patients compared to the HC-SCD patients. As the sample size of longitudinal data was small we should interpret the results with caution. However, these results are in line with ADNI data, however in those studies a significant difference after 12 months interval was also detected [63, 64].
The primary objective of this study was to identify which atrophy measures accurately discriminate between groups by using MSmetrix. Our cross-sectional data confirm that a high diagnostic accuracy was observed between AD dementia patients and cognitively healthy controls for the extracted volumes. However, when corrected for age and center, WB and GM were the most robust MRI biomarkers to distinguish between clinical groups. Those volumetric measures can support disease diagnosis and thus, may assist clinicians in their decisions. The secondary objective was to investigate MSmetrix as a possible predictor for clinical progression. The single variable linear regression models showed that increased CSF volumes and atrophy of WB, GM, and CGM predicted cognitive impairment, independent of age and baseline diagnosis, which is confirmed by other studies [65–67]. Next, the prediction of disease evolution based on the decline in MMSE score was also detected in WB, GM, and CGM where slow and fast MMSE decliners showed significant differences for those volumes, with smaller baseline volumes in the fast decliners, in line with the literature [3, 30–32]. In here, the volumetric measures are of help to the clinicians to track the clinical progression of the disease, as increased CSF volumes and brain atrophy correlate with clinical decline.
This study focused on the output measurements of MSmetrix, which are large volumes (WB, GM, WM, CSF, CGM) that can overcome the limitations of disease-related regional atrophy. Nevertheless, many groups investigated regional atrophy and especially medial temporal lobe, including hippocampal atrophy, as this is a sensitive AD biomarker [18, 34]. A potential benefit of these specific AD-pathological regions is that they possibly allow the discrimination between sd MCI and md MCI patients [13–15, 55]. This possible discrimination was not observed in the current study, as expected by the proposed models [18, 20]. Indeed, sd MCI patients and SCD subjects had comparable volumes and also no significant difference was found between md MCI and AD dementia patients. A possible explanation could be that the neuropsychological examinations showed inter- and intra-rater and/or center variability as the neuropsychological tests were administered in different centers by different neuropsychologists. To take this limitation into account a correction for center was applied in the statistical analyses.
Another limitation of this study was the significant difference in age for diagnostic groups at baseline, although we corrected the statistical analyses to overcome this problem. Next, few follow-up MRI scans were available which probably led to less significant differences in the longitudinal volumetric measurements. Lastly, analyzing the different volumes based on only T1 images versus T1 in combination with FLAIR sequences could be seen as another limitation of this study, as differences in results could be found in case larger WMH volumes were present. Those WMH volumes could be wrongly detected as GM volumes. Nevertheless, the WB volume is usually robust because WMH volumes are classified as CSF, as has been observed in the validation of MSmetrix in MS patients [47–51]. Despite these disadvantages, the large amount of data included in this multi-center study, the short time between baseline measures, and the mean clinical follow-up time of 2.1 years [IQR: 0.6–3.2] are certainly strengths of this study. Even though we have used MRI scans that were acquired in routine clinical practice, and thus from different scanner types which could be seen as a limitation, only 15.9% of the scans were rejected, which demonstrates the clinical usefulness of this method. Moreover, MSmetrix can be integrated easily in the clinical workflow as it uses DICOM images from all scanner types without any restrictions of the image sequences and produces results in an accurate and rapid way.
In conclusion, volumes measured with a fully automated tool (MSmetrix) accurately discriminated between clinical diagnostic groups in an AD population, and thus can support clinicians in their decisions. Especially WB and GM, and CGM are MRI biomarkers that distinguished between clinical diagnostic groups and were possible predictors for clinical progression based on (decline in) MMSE scores. Those volumes could therefore be used to define the clinical spectrum of AD more accurately, are able to track clinical progression of disease, are of help to select appropriate populations for clinical trials and can be applied for assessment of the efficacy of (future disease-modifying) treatments.
ACKNOWLEDGMENTS
This research was in part supported by the University Research Fund of the University of Antwerp. For the University of Liège center, this work was supported by a French Speaking Community Concerted Research Action (ARC-06/11-340) and a Belgian InterUniversity Attraction Pole (P6/29). We acknowledge the contribution of Ellen De Roeck, Naomi De Roeck, Charisse Somers, Peter Mariën, Jos Saerens, and Nore Somers.
MSmetrix is proprietary software, developed by icometrix for the automated quantification of brain volumes and white matter hyperintensities.
Authors’ disclosures available online (https://www.j-alz.com/manuscript-disclosures/17-1140r2).
SUPPLEMENTARY MATERIAL
[1] The supplementary material is available in the electronic version of this article: http://dx.doi.org/10.3233/JAD-171140.
REFERENCES
[1] | Terry RD , Masliah E , Salmon DP , Butters N , DeTeresa R , Hill R , Hansen LA , Katzman R ((1991) ) Physical basis of cognitive alterations in Alzheimer’s disease: Synapse loss is the major correlate of cognitive impairment. Ann Neurol 30: , 572–580. |
[2] | Jack Jr CR , Petersen RC , O’Brien PC , Tangalos EG ((1992) ) MR-based hippocampal volumetry in the diagnosis of Alzheimer’s disease. Neurology 42: , 183–188. |
[3] | Fox NC , Scahill RI , Crum WR , Rossor MN ((1999) ) Correlation between rates of brain atrophy and cognitive decline in AD. Neurology 52: , 1687–1689. |
[4] | Convit A , De Leon MJ , Tarshish C , De Santi S , Tsui W , Rusinek H , George A ((1997) ) Specific hippocampal volume reductions in individuals at risk for Alzheimer’s disease. Neurobiol Aging 18: , 131–138. |
[5] | Shi F , Liu B , Zhou Y , Yu C , Jiang T ((2009) ) Hippocampal volume and asymmetry in mild cognitive impairment and Alzheimer’s disease: Meta-analyses of MRI studies. Hippocampus 19: , 1055–1064. |
[6] | Scheltens P , Leys D , Barkhof F , Huglo D , Weinstein HC , Vermersch P , Kuiper M , Steinling M , Wolters EC , Valk J ((1992) ) Atrophy of medial temporal lobes on MRI in “probable” Alzheimer’s disease and normal ageing: Diagnostic value and neuropsychological correlates. J Neurol Neurosurg Psychiatry 55: , 967–972. |
[7] | Killiany RJ , Hyman BT , Gomez-Isla T , Moss MB , Kikinis R , Jolesz F , Tanzi R , Jones K , Albert MS ((2002) ) MRI measures of entorhinal cortex vs hippocampus in preclinical AD. Neurology 58: , 1188–1196. |
[8] | Visser PJ , Verhey FR , Hofman PA , Scheltens P , Jolles J ((2002) ) Medial temporal lobe atrophy predicts Alzheimer’s disease in patients with minor cognitive impairment. J Neurol Neurosurg Psychiatry 72: , 491–497. |
[9] | Devanand DP , Pradhaban G , Liu X , Khandji A , De Santi S , Segal S , Rusinek H , Pelton GH , Honig LS , Mayeux R , Stern Y , Tabert MH , de Leon MJ ((2007) ) Hippocampal and entorhinal atrophy in mild cognitive impairment: Prediction of Alzheimer disease. Neurology 68: , 828–836. |
[10] | Ries ML , Carlsson CM , Rowley HA , Sager MA , Gleason CE , Asthana S , Johnson SC ((2008) ) Magnetic resonance imaging characterization of brain structure and function in mild cognitive impairment: A review. J Am Geriatr Soc 56: , 920–934. |
[11] | Tondelli M , Wilcock GK , Nichelli P , De Jager CA , Jenkinson M , Zamboni G ((2012) ) Structural MRI changes detectable up to ten years before clinical Alzheimer’s disease. Neurobiol Aging 33: , 825, e825–836. |
[12] | O’Brien JT ((2007) ) Role of imaging techniques in the diagnosis of dementia. Br J Radiol 80: (Spec No 2), S71–77. |
[13] | Jack Jr CR , Shiung MM , Gunter JL , O’Brien PC , Weigand SD , Knopman DS , Boeve BF , Ivnik RJ , Smith GE , Cha RH , Tangalos EG , Petersen RC ((2004) ) Comparison of different MRI brain atrophy rate measures with clinical disease progression in AD. Neurology 62: , 591–600. |
[14] | Morra JH , Tu Z , Apostolova LG , Green AE , Avedissian C , Madsen SK , Parikshak N , Hua X , Toga AW , Jack Jr CR , Schuff N , Weiner MW , Thompson PM , Alzheimer’s Disease Neuroimaging Initiative ((2009) ) Automated 3D mapping of hippocampal atrophy and its clinical correlates in 400 subjects with Alzheimer’s disease, mild cognitive impairment, and elderly controls. Hum Brain Mapp 30: , 2766–2788. |
[15] | Ridha BH , Anderson VM , Barnes J , Boyes RG , Price SL , Rossor MN , Whitwell JL , Jenkins L , Black RS , Grundman M , Fox NC ((2008) ) Volumetric MRI and cognitive measures in Alzheimer disease: Comparison of markers of progression. J Neurol 255: , 567–574. |
[16] | Albert MS , DeKosky ST , Dickson D , Dubois B , Feldman HH , Fox NC , Gamst A , Holtzman DM , Jagust WJ , Petersen RC , Snyder PJ , Carrillo MC , Thies B , Phelps CH ((2011) ) The diagnosis of mild cognitive impairment due to Alzheimer’s disease: Recommendations from the National Institute on Aging-Alzheimer’s Association workgroups on diagnostic guidelines for Alzheimer’s disease. Alzheimers Dement 7: , 270–279. |
[17] | Dubois B , Feldman HH , Jacova C , Hampel H , Molinuevo JL , Blennow K , DeKosky ST , Gauthier S , Selkoe D , Bateman R , Cappa S , Crutch S , Engelborghs S , Frisoni GB , Fox NC , Galasko D , Habert MO , Jicha GA , Nordberg A , Pasquier F , Rabinovici G , Robert P , Rowe C , Salloway S , Sarazin M , Epelbaum S , de Souza LC , Vellas B , Visser PJ , Schneider L , Stern Y , Scheltens P , Cummings JL ((2014) ) Advancing research diagnostic criteria for Alzheimer’s disease: The IWG-2 criteria. Lancet Neurol 13: , 614–629. |
[18] | Jack Jr CR , Albert MS , Knopman DS , McKhann GM , Sperling RA , Carrillo MC , Thies B , Phelps CH ((2011) ) Introduction to the recommendations from the National Institute on Aging-Alzheimer’s Association workgroups on diagnostic guidelines for Alzheimer’s disease. Alzheimers Dement 7: , 257–262. |
[19] | McKhann GM , Knopman DS , Chertkow H , Hyman BT , Jack Jr CR , Kawas CH , Klunk WE , Koroshetz WJ , Manly JJ , Mayeux R , Mohs RC , Morris JC , Rossor MN , Scheltens P , Carrillo MC , Thies B , Weintraub S , Phelps CH ((2011) ) The diagnosis of dementia due to Alzheimer’s disease: Recommendations from the National Institute on Aging-Alzheimer’s Association workgroups on diagnostic guidelines for Alzheimer’s disease. Alzheimers Dement 7: , 263–269. |
[20] | Sperling RA , Aisen PS , Beckett LA , Bennett DA , Craft S , Fagan AM , Iwatsubo T , Jack Jr CR , Kaye J , Montine TJ , Park DC , Reiman EM , Rowe CC , Siemers E , Stern Y , Yaffe K , Carrillo MC , Thies B , Morrison-Bogorad M , Wagster MV , Phelps CH ((2011) ) Toward defining the preclinical stages of Alzheimer’s disease: Recommendations from the National Institute on Aging-Alzheimer’s Association workgroups on diagnostic guidelines for Alzheimer’s disease. Alzheimers Dement 7: , 280–292. |
[21] | Augustinack JC , Huber KE , Postelnicu GM , Kakunoori S , Wang R , van der Kouwe AJ , Wald LL , Stein TD , Frosch MP , Fischl B ((2012) ) Entorhinal verrucae geometry is coincident and correlates with Alzheimer’s lesions: A combined neuropathology and high-resolution ex vivo MRI analysis. Acta Neuropathol 123: , 85–96. |
[22] | Velayudhan L , Proitsi P , Westman E , Muehlboeck JS , Mecocci P , Vellas B , Tsolaki M , Kloszewska I , Soininen H , Spenger C , Hodges A , Powell J , Lovestone S , Simmons A , dNeuroMed Consortium ((2013) ) Entorhinal cortex thickness predicts cognitive decline in Alzheimer’s disease. J Alzheimers Dis 33: , 755–766. |
[23] | Bakkour A , Morris JC , Wolk DA , Dickerson BC ((2013) ) The effects of aging and Alzheimer’s disease on cerebral cortical anatomy: Specificity and differential relationships with cognition. Neuroimage 76: , 332–344. |
[24] | Plant C , Teipel SJ , Oswald A , Bohm C , Meindl T , Mourao-Miranda J , Bokde AW , Hampel H , Ewers M ((2010) ) Automated detection of brain atrophy patterns based on MRI for the prediction of Alzheimer’s disease. Neuroimage 50: , 162–174. |
[25] | Wang L , Miller JP , Gado MH , McKeel DW , Rothermich M , Miller MI , Morris JC , Csernansky JG ((2006) ) Abnormalities of hippocampal surface structure in very mild dementia of the Alzheimer type. Neuroimage 30: , 52–60. |
[26] | Holland D , Brewer JB , Hagler DJ , Fennema-Notestine C , Dale AM , Alzheimer’s Disease Neuroimaging Initiative ((2009) ) Subregional neuroanatomical change as a biomarker for Alzheimer’s disease. Proc Natl Acad Sci U S A 106: , 20954–20959. |
[27] | Jack Jr CR , Shiung MM , Weigand SD , O’Brien PC , Gunter JL , Boeve BF , Knopman DS , Smith GE , Ivnik RJ , Tangalos EG , Petersen RC ((2005) ) Brain atrophy rates predict subsequent clinical conversion in normal elderly and amnestic MCI. Neurology 65: , 1227–1231. |
[28] | Hashimoto M , Kitagaki H , Imamura T , Hirono N , Shimomura T , Kazui H , Tanimukai S , Hanihara T , Mori E ((1998) ) Medial temporal and whole-brain atrophy in dementia with Lewy bodies: A volumetric MRI study. Neurology 51: , 357–362. |
[29] | Nedelska Z , Ferman TJ , Boeve BF , Przybelski SA , Lesnick TG , Murray ME , Gunter JL , Senjem ML , Vemuri P , Smith GE , Geda YE , Graff-Radford J , Knopman DS , Petersen RC , Parisi JE , Dickson DW , Jack Jr CR , Kantarci K ((2015) ) Pattern of brain atrophy rates in autopsy-confirmed dementia with Lewy bodies. Neurobiol Aging 36: , 452–461. |
[30] | Schott JM , Crutch SJ , Frost C , Warrington EK , Rossor MN , Fox NC ((2008) ) Neuropsychological correlates of whole brain atrophy in Alzheimer’s disease. Neuropsychologia 46: , 1732–1737. |
[31] | Sluimer JD , van der Flier WM , Karas GB , Fox NC , Scheltens P , Barkhof F , Vrenken H ((2008) ) Whole-brain atrophy rate and cognitive decline: Longitudinal MR study of memory clinic patients. Radiology 248: , 590–598. |
[32] | Sluimer JD , Vrenken H , Blankenstein MA , Fox NC , Scheltens P , Barkhof F , van der Flier WM ((2008) ) Whole-brain atrophy rate in Alzheimer disease: Identifying fast progressors. Neurology 70: , 1836–1841. |
[33] | Josephs KA , Whitwell JL , Ahmed Z , Shiung MM , Weigand SD , Knopman DS , Boeve BF , Parisi JE , Petersen RC , Dickson DW , Jack Jr CR ((2008) ) Beta-amyloid burden is not associated with rates of brain atrophy. Ann Neurol 63: , 204–212. |
[34] | Frisoni GB , Fox NC , Jack Jr CR , Scheltens P , Thompson PM ((2010) ) The clinical use of structural MRI in Alzheimer disease. Nat Rev Neurol 6: , 67–77. |
[35] | Barnes J , Foster J , Boyes RG , Pepple T , Moore EK , Schott JM , Frost C , Scahill RI , Fox NC ((2008) ) A comparison of methods for the automated calculation of volumes and atrophy rates in the hippocampus. Neuroimage 40: , 1655–1671. |
[36] | Boccardi M , Ganzola R , Bocchetta M , Pievani M , Redolfi A , Bartzokis G , Camicioli R , Csernansky JG , de Leon MJ , deToledo-Morrell L , Killiany RJ , Lehericy S , Pantel J , Pruessner JC , Soininen H , Watson C , Duchesne S , Jack Jr CR , Frisoni GB ((2011) ) Survey of protocols for the manual segmentation of the hippocampus: Preparatory steps towards a joint EADC-ADNI harmonized protocol. J Alzheimers Dis 26: (Suppl 3), 61–75. |
[37] | Jack Jr CR , Theodore WH , Cook M , McCarthy G ((1995) ) MRI-based hippocampal volumetrics: Data acquisition, normal ranges, and optimal protocol. Magn Reson Imaging 13: , 1057–1064. |
[38] | Ghanei A , Soltanian-Zadeh H , Windham JP ((1998) ) Segmentation of the hippocampus from brain MRI using deformable contours. Comput Med Imaging Graph 22: , 203–216. |
[39] | Haller JW , Banerjee A , Christensen GE , Gado M , Joshi S , Miller MI , Sheline Y , Vannier MW , Csernansky JG ((1997) ) Three-dimensional hippocampal MR morphometry with high-dimensional transformation of a neuroanatomic atlas. Radiology 202: , 504–510. |
[40] | Freeborough PA , Fox NC , Kitney RI ((1997) ) Interactive algorithms for the segmentation and quantitation of 3-D MRI brain scans. Comput Methods Programs Biomed 53: , 15–25. |
[41] | Ashburner J , Friston KJ ((2005) ) Unified segmentation. Neuroimage 26: , 839–851. |
[42] | Smith SM , Jenkinson M , Woolrich MW , Beckmann CF , Behrens TE , Johansen-Berg H , Bannister PR , De Luca M , Drobnjak I , Flitney DE , Niazy RK , Saunders J , Vickers J , Zhang Y , De Stefano N , Brady JM , Matthews PM ((2004) ) Advances in functional and structural MR image analysis and implementation as FSL. Neuroimage 23: (Suppl 1), S208–219. |
[43] | Dale AM , Fischl B , Sereno MI ((1999) ) Cortical surface-based analysis. I. Segmentation and surface reconstruction. Neuroimage 9: , 179–194. |
[44] | Fischl B , Sereno MI , Dale AM ((1999) ) Cortical surface-based analysis. II: Inflation, flattening, and a surface-based coordinate system. Neuroimage 9: , 195–207. |
[45] | Brewer JB , Magda S , Airriess C , Smith ME ((2009) ) Fully-automated quantification of regional brain volumes for improved detection of focal atrophy in Alzheimer disease. AJNR Am J Neuroradiol 30: , 578–580. |
[46] | BrainVISA Anatomist, http://brainvisa.info. |
[47] | Smeets D , Ribbens A , Sima DM , Cambron M , Horakova D , Jain S , Maertens A , Van Vlierberghe E , Terzopoulos V , Van Binst AM , Vaneckova M , Krasensky J , Uher T , Seidl Z , De Keyser J , Nagels G , De Mey J , Havrdova E , Van Hecke W ((2016) ) Reliable measurements of brain atrophy in individual patients with multiple sclerosis. Brain Behav 6: , e00518. |
[48] | Lysandropoulos AP , Absil J , Metens T , Mavroudakis N , Guisset F , Van Vlierberghe E , Smeets D , David P , Maertens A , Van Hecke W ((2016) ) Quantifying brain volumes for Multiple Sclerosis patients follow-up in clinical practice - comparison of 1.5 and 3 Tesla magnetic resonance imaging. Brain Behav 6: , e00422. |
[49] | Jain S , Ribbens A , Sima DM , Cambron M , De Keyser J , Wang C , Barnett MH , Van Huffel S , Maes F , Smeets D ((2016) ) Two time point MS lesion segmentation in brain MRI: An expectation-maximization framework. Front Neurosci 10: , 576. |
[50] | Jain S , Sima DM , Ribbens A , Cambron M , Maertens A , Van Hecke W , De Mey J , Barkhof F , Steenwijk MD , Daams M , Maes F , Van Huffel S , Vrenken H , Smeets D ((2015) ) Automatic segmentation and volumetry of multiple sclerosis brain lesions from MR images. Neuroimage Clin 8: , 367–375. |
[51] | Steenwijk MD , Amiri H , Schoonheim MM , de Sitter A , Barkhof F , Pouwels PJW , Vrenken H ((2017) ) Agreement of MSmetrix with established methods for measuring cross-sectional and longitudinal brain atrophy. Neuroimage Clin 15: , 843–853. |
[52] | Jessen F , Amariglio RE , van Boxtel M , Breteler M , Ceccaldi M , Chetelat G , Dubois B , Dufouil C , Ellis KA , van der Flier WM , Glodzik L , van Harten AC , de Leon MJ , McHugh P , Mielke MM , Molinuevo JL , Mosconi L , Osorio RS , Perrotin A , Petersen RC , Rabin LA , Rami L , Reisberg B , Rentz DM , Sachdev PS , de la Sayette V , Saykin AJ , Scheltens P , Shulman MB , Slavin MJ , Sperling RA , Stewart R , Uspenskaya O , Vellas B , Visser PJ , Wagner M , Subjective Cognitive Decline Initiative Working Group ((2014) ) A conceptual framework for research on subjective cognitive decline in preclinical Alzheimer’s disease. Alzheimers Dement 10: , 844–852. |
[53] | Sorensen L , Igel C , Pai A , Balas I , Anker C , Lillholm M , Nielsen M , Alzheimer’s Disease Neuroimaging Initiative and the Australian Imaging Biomarkers and Lifestyle flagship study of ageing ((2017) ) Differential diagnosis of mild cognitive impairment and Alzheimer’s disease using structural MRI cortical thickness, hippocampal shape, hippocampal texture, and volumetry. Neuroimage Clin 13: , 470–482. |
[54] | Kloppel S , Stonnington CM , Chu C , Draganski B , Scahill RI , Rohrer JD , Fox NC , Jack Jr CR , Ashburner J , Frackowiak RS ((2008) ) Automatic classification of MR scans in Alzheimer’s disease. Brain 131: , 681–689. |
[55] | Frisoni GB , Bocchetta M , Chetelat G , Rabinovici GD , de Leon MJ , Kaye J , Reiman EM , Scheltens P , Barkhof F , Black SE , Brooks DJ , Carrillo MC , Fox NC , Herholz K , Nordberg A , Jack Jr CR , Jagust WJ , Johnson KA , Rowe CC , Sperling RA , Thies W , Wahlund LO , Weiner MW , Pasqualetti P , Decarli C , ISTAART’s NeuroImaging Professional Interest Area ((2013) ) Imaging markers for Alzheimer disease: Which vs how. Neurology 81: , 487–500. |
[56] | Gunning-Dixon FM , Raz N ((2003) ) Neuroanatomical correlates of selected executive functions in middle-aged and older adults: A prospective MRI study. Neuropsychologia 41: , 1929–1941. |
[57] | Habes M , Erus G , Toledo JB , Zhang T , Bryan N , Launer LJ , Rosseel Y , Janowitz D , Doshi J , Van der Auwera S , von Sarnowski B , Hegenscheid K , Hosten N , Homuth G , Volzke H , Schminke U , Hoffmann W , Grabe HJ , Davatzikos C ((2016) ) White matter hyperintensities and imaging patterns of brain ageing in the general population. Brain 139: , 1164–1179. |
[58] | Sun Z , van de Giessen M , Lelieveldt BP , Staring M ((2017) ) Detection of conversion from mild cognitive impairment to Alzheimer’s disease using longitudinal brain MRI. Front Neuroinform 11: , 16. |
[59] | Smith SM , De Stefano N , Jenkinson M , Matthews PM ((2001) ) Normalized accurate measurement of longitudinal brain change. J Comput Assist Tomogr 25: , 466–475. |
[60] | Freeborough PA , Fox NC ((1997) ) The boundary shift integral: An accurate and robust measure of cerebral volume changes from registered repeat MRI. IEEE Trans Med Imaging 16: , 623–629. |
[61] | Boyes RG , Rueckert D , Aljabar P , Whitwell J , Schott JM , Hill DL , Fox NC ((2006) ) Cerebral atrophy measurements using Jacobian integration: Comparison with the boundary shift integral. Neuroimage 32: , 159–169. |
[62] | Sluimer JD , Bouwman FH , Vrenken H , Blankenstein MA , Barkhof F , van der Flier WM , Scheltens P ((2010) ) Whole-brain atrophy rate and CSF biomarker levels in MCI and AD: A longitudinal study. Neurobiol Aging 31: , 758–764. |
[63] | Jack Jr CR , Lowe VJ , Weigand SD , Wiste HJ , Senjem ML , Knopman DS , Shiung MM , Gunter JL , Boeve BF , Kemp BJ , Weiner M , Petersen RC , Alzheimer’s Disease Neuroimaging Initiative ((2009) ) Serial PIB and MRI in normal, mild cognitive impairment and Alzheimer’s disease: Implications for sequence of pathological events in Alzheimer’s disease. Brain 132: , 1355–1365. |
[64] | Evans MC , Barnes J , Nielsen C , Kim LG , Clegg SL , Blair M , Leung KK , Douiri A , Boyes RG , Ourselin S , Fox NC , Alzheimer’s Disease Neuroimaging Initiative ((2010) ) Volume changes in Alzheimer’s disease and mild cognitive impairment: Cognitive associations. Eur Radiol 20: , 674–682. |
[65] | Verlinden VJ , van der Geest JN , Hofman A , Niessen WJ , van der Lugt A , Vernooij MW , Ikram MA ((2017) ) Brain MRI-markers associate differentially with cognitive versus functional decline leading to dementia. J Am Geriatr Soc 65: , 1258–1266. |
[66] | Mungas D , Reed BR , Jagust WJ , DeCarli C , Mack WJ , Kramer JH , Weiner MW , Schuff N , Chui HC ((2002) ) Volumetric MRI predicts rate of cognitive decline related to AD and cerebrovascular disease. Neurology 59: , 867–873. |
[67] | Kovacevic S , Rafii MS , Brewer JB , Alzheimer’s Disease Neuroimaging Initiative ((2009) ) High-throughput, fully automated volumetry for prediction of MMSE and CDR decline in mild cognitive impairment. Alzheimer Dis Assoc Disord 23: , 139–145. |


