
A Systematic Review and Aggregated Analysis on the Impact of Amyloid PET Brain Imaging on the Diagnosis, Diagnostic Confidence, and Management of Patients being Evaluated for Alzheimer’s Disease
Abstract
Background:
Amyloid PET (aPET) imaging could improve patient outcomes in clinical practice, but the extent of impact needs quantification.
Objective:
To provide an aggregated quantitative analysis of the value added by aPET in cognitively impaired subjects.
Methods:
Systematic literature searches were performed in Embase and Medline until January 2017. 1,531 cases over 12 studies were included (1,142 cases over seven studies in the primary analysis where aPET was the key biomarker; the remaining cases included as defined groups in the secondary analysis). Data was abstracted by consensus among two observers and assessed for bias. Clinical utility was measured by diagnostic change, diagnostic confidence, and patient management before and after aPET. Three groups were further analyzed: control patients for whom feedback of aPET scan results was delayed; aPET Appropriate Use Criteria (AUC+) cases; and patients undergoing additional FDG/CSF testing.
Results:
For 1,142 cases with only aPET, 31.3% of diagnoses were revised, whereas 3.2% of diagnoses changed in the delayed aPET control group (p < 0.0001). Increased diagnostic confidence following aPET was found for 62.1% of 870 patients. Management changes with aPET were found in 72.2% of 740 cases and in 55.5% of 299 cases in the control group (p < 0.0001). The diagnostic value of aPET in AUC+ patients or when FDG/CSF were additionally available did not substantially differ from the value of aPET alone in the wider population.
Conclusions:
Amyloid PET contributed to diagnostic revision in almost a third of cases and demonstrated value in increasing diagnostic confidence and refining management plans.
INTRODUCTION
An accurate dementia diagnosis is crucial to optimize effective patient management strategies. Recent diagnostic criteria for Alzheimer’s disease and its prodromal states now include measurement of at least one biomarker to support clinical assessments [1–4]. The approval of 18F-labelled amyloid PET (aPET) tracers—AmyvidTM (Eli Lilly, [5, 6]), NeuraceqTM (Piramal Inc., [7, 8]), and VizamylTM (GE Healthcare, [9, 10])—in multiple countries worldwide from 2012 onwards, has meant that aPET has been increasingly used in routine evaluation of patients with cognitive impairment.
As part of regulatory approval processes for aPET tracers, autopsy studies correlating tracer uptake to pathologically detected amyloid demonstrated sensitivities of 91–98% and specificities of 89–100% [11–14]. Previous aPET meta-analyses focused on diagnostic accuracy relative to clinical or pathological standards of truth [15–17]. Similar analyses have been conducted on other relevant dementia tests, such as [18F]fluorodeoxyglucose PET (FDG) [18, 19], cerebrospinal fluid (CSF) analysis [18, 20], magnetic resonance imaging (MRI) [18], and Mini-Mental State Examination (MMSE) scoring [21].
This aggregated analysis expands on the recent paper by Barthel and Sabri [22] who focused on a high level qualitative overview of aPET utility across individual studies. Here, the primary analysis consolidates individual patient data from each included study, generating deeper insight into diagnostic changes and clinical value added by aPET in cognitively impaired subjects. Using as baseline working diagnoses and management plans before aPET scanning, aPET is analyzed in its utility as a tool to aid differential diagnosis, diagnostic confidence and patient management. Individual diagnostic trajectories pre- to post-scan are also described for four different patient groups relevant to the quantification of aPET utility and include confidence intervals to give an estimate of variability around the pooled patient groups. The latter include the Appropriate Use Criteria (AUC) patient group, recommended jointly by the Alzheimer’s Association and the Society for Nuclear Medicine and Molecular Imaging [23, 24] and comprised only of cases where aPET is specifically recommended (indeterminate persistent mild cognitive impairment (MCI), atypical or mixed disease presentation or atypically early age of onset).
METHODS
Study identification and selection
To classify for inclusion, studies had:
• A diagnostic and clinical utility analysis of aPET imaging visually interpreted by pre-established [5–10] dichotomization methods (i.e., amyloid positive or negative).
• More than ten cognitively impaired patients.
• Pre-aPET working diagnoses based on symptoms, clinical history, neuropsychological testing and/or structural imaging and without aPET.
• Post-aPET final diagnoses based on in vivo clinical diagnostic criteria of the highest standards available at the time of study execution [1–4, 25, 26]. Histopathological validation of the final diagnoses was not reported in any aPET utility study.
• A unique and sequential association between aPET and post-aPET diagnosis. Post-aPET diagnoses accompanied by FDG/CSF tests were collected separately.
• A publication in peer-reviewed scientific journals or a conference presentation with peer-reviewed abstract selection.
Search methods
The systematic search was carried out through MEDLINE and EMBASE (both up to week 4 2017, Ovid interface) using 38 terms (Supplementary Table 1) to identify the included population and disease type, imaging modality, tracers, clinical utility terms and publication language (English). References within review articles were searched for any additional papers (see Supplementary Figure 1 for study selection flow). An additional, more focused 56-term literature search was performed by a second blinded researcher for closer inspection of publications reporting utility measures and as reported in Supplementary Table 2 and Supplementary Figure 2.
From both searches, studies selected for inclusion were reviewed by two authors (E.F., A.C.) (Table 1). Studies with overlapping cohorts were refined only to include the largest studies. Authors were contacted for clarifications when required. Studies excluded at the final manual selection stage are listed in Supplementary Table 3 with the relevant rationale for exclusion.
Table 1
Overall characteristics of the included studies and incoming patients
| Study name | Study designa | Purpose of studyb | Type of care centerc | N sites | Radiotracerd | N casese | Type of incoming cohort | Indeterminate cohort included | Pre-scan Dx certainty (%)f | Tests other than aPETg |
| Ishii [37] | Prosp | DxC, Conf | 3y | 1 | PIB | 233 | Any | No | <100 | His, NP, MR |
| Grundman [31] | Prosp | DxC, PM, Conf | 2y | 19 | FBP | 229 | Any, Uncertain etiology | Yesh | <85 | His, NP, CT/MR, |
| Sanchez-Juan [41] | Retro | DxC, PM | 3y | 1 | PIB | 140 | Any, Uncertain etiology | Yesh | <100 | NPCT/MR, FDGi |
| Mitsis [43] | Prosp | DxC | 3y | 1 | FBP, PIB | 30 | Any, routine cohort | Yes | <100 | His, NP, MR |
| Zwan [32] | Prosp | DxC, PM, Conf | 3y | 2 | FMM | 211 | Early onset, MCI | No | <90 | His, NP, MR |
| Boccardi [33] | Prosp | DxC, PM, Conf | 3y | 18 | FBP | 228 | Any | No | 15–85 | NP, CT, MR, FDG, CSF |
| Frederiksen [38] | Retro | DxC, Conf | 2y &3y | 1 | PIB | 57 | Uncertain etiology | Yesh | <100 | NP, CT, MR, FDG, CSF |
| Ossenkoppele [34] | Prosp | Conf | 3y | 1 | PIB | 154 | Any | Yesh | ≤100 | His, NP, MR, FDGi |
| Pontecorvo [42] | Prosp RCT | DxC, PM | 2y &3y | 57 | FBP | 600 | Any | Yes | 15–85 | n/a |
| Schipke [39] | Retro, Quest | PM, Conf | Unclear | 14 | FBB | 121 | Any, hypothetical | No | <100 | MR, CSF |
| Bensaidane [35] | Prosp | DxC, PM, Conf | 3y | 1 | NAV | 28 | Any, atypical | No | <100 | His, NP, MR, FDG |
| Weston [36] | Prosp | DxC, PM, Conf | 3y | 1 | FBP | 20 | Any | No | 68±16 | NP, MR, CSF |
aPET, amyloid PET; Dx, diagnosis. a) RCT, randomized controlled trial; Prosp, prospective; Retro, retrospective; Quest, questionnaire. b) DxC, change in diagnosis; PM, change in patient management; Conf, change in diagnostic confidence. c) Secondary care centers (2y) visit patients with general geriatric, neurological or psychiatric issues. Tertiary centers (3y) are specialized memory or dementia clinics. Unclear cases may involve either secondary or tertiary care centers. d) FMM, [18F]flutemetamol; FBP, [18F]florbetapir; FBB, [18F]florbetaben; PIB, [11C]PiB; NAV, [18F]NAV4694. e) Selected cases were included in each type of aPET utility analysis and Group as detailed in the caption of each relevant Table. f) When not explicit, the incoming diagnostic certainty inclusion criteria was inferred from the patient selection methods wording. g) His, clinical history; NP, neuropsychological tests; CT, structural computed tomography; MR, magnetic resonance imaging. h) The traceability of indeterminate cases in these studies was partial and could only be accomplished in full for those cases undergoing diagnostic change toward AD. i) Adjunct FDG is performed together with aPET between the initial and revised diagnosis.
QUADAS
The methodological and reporting quality of the individual studies selected was assessed with the 14-question QUADAS tool [27, 28] adapted by two investigators (E.F., A.C.) to suit this review (see Supplementary Table 4). QUADAS was then applied to each study independently by each investigator and a consensus on scoring reached (Supplementary Table 4). QUADAS was independent of the analysis and not designed to weigh data [29, 30].
Analysis methods
A total number of 1,531 subjects from 12 studies were considered for this aggregated analysis, focusing on assimilating individual study data (rather than summary study results of aPET utility) into quantitative measures. All patients were broadly classified into presumed AD, Non-AD or indeterminate as per Supplementary Table 6. Of these, 1142 cognitively impaired subjects from 7 studies with pre- and post-aPET diagnosis, aPET scans and no FDG/CSF testing were considered for the primary measure (Fig. 1) and consisted of an aggregate analysis of all included patients. A secondary analysis detailing more in-depth patient diagnostic trajectories was also performed (Table 2). This included patient-level data processed into measures useful to draw comparisons between four patient groups from across all 12 studies. Additionally, data on both diagnostic confidence (described in text) and patient management impact (Table 3) was available from a proportion of the studies reviewed and was synthesized insofar as the granularity of reporting allowed.
Fig.1
Primary analysis of the diagnostic trajectories for patients without CSF or FDG-PET data available at the time of the pre-scan diagnosis (Group 1). All included subjects were broadly classified into presumed AD, Non-AD or indeterminate as per Supplementary Table 6. Due to the included studies’ reporting format, it was not possible to include cases that undergo the following trajectories: indeterminate-nonAD, nonAD-indeterminate, indeterminate-indeterminate. Hence the only trajectory from indeterminate is indeterminate-AD. Each percentage reported relates to the level above it. Dx, diagnosis. PET, amyloid PET. Color coding from Post-scan Dx onwards: Grey boxes: diagnoses in line with aPET; Black boxes: diagnoses changed in line with PET, Light grey boxes: diagnoses changed or confirmed contradicting PET.
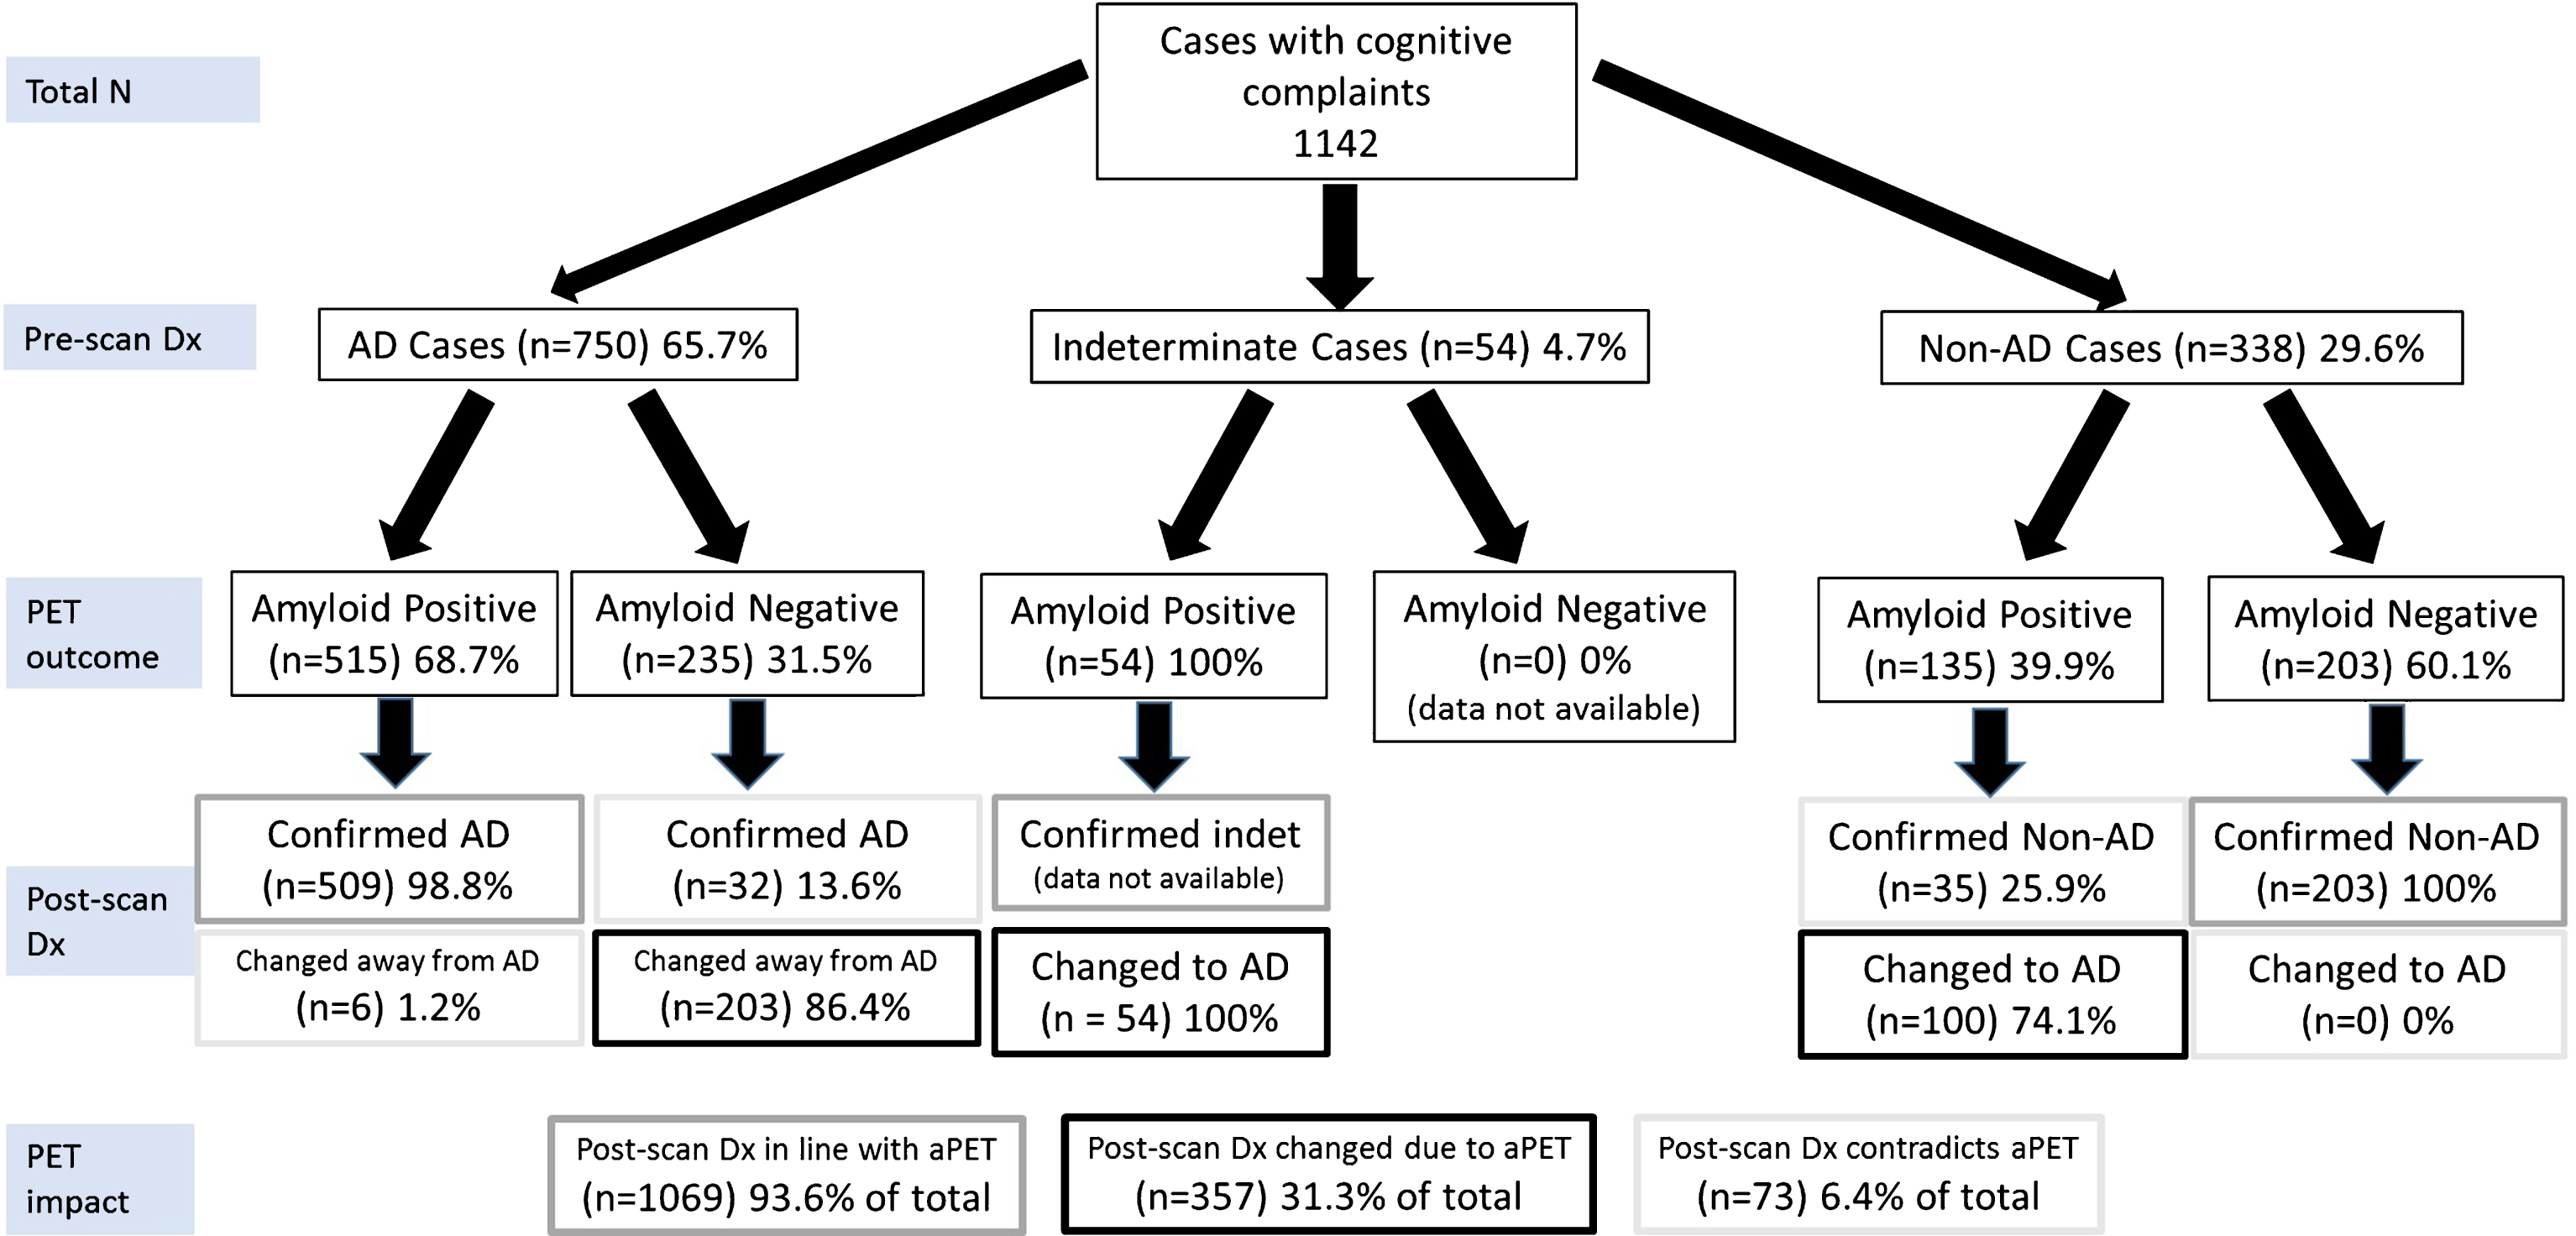
Table 2
Secondary analysis of the diagnostic trajectories. 95% CI were calculated by the Clopper-Pearson method
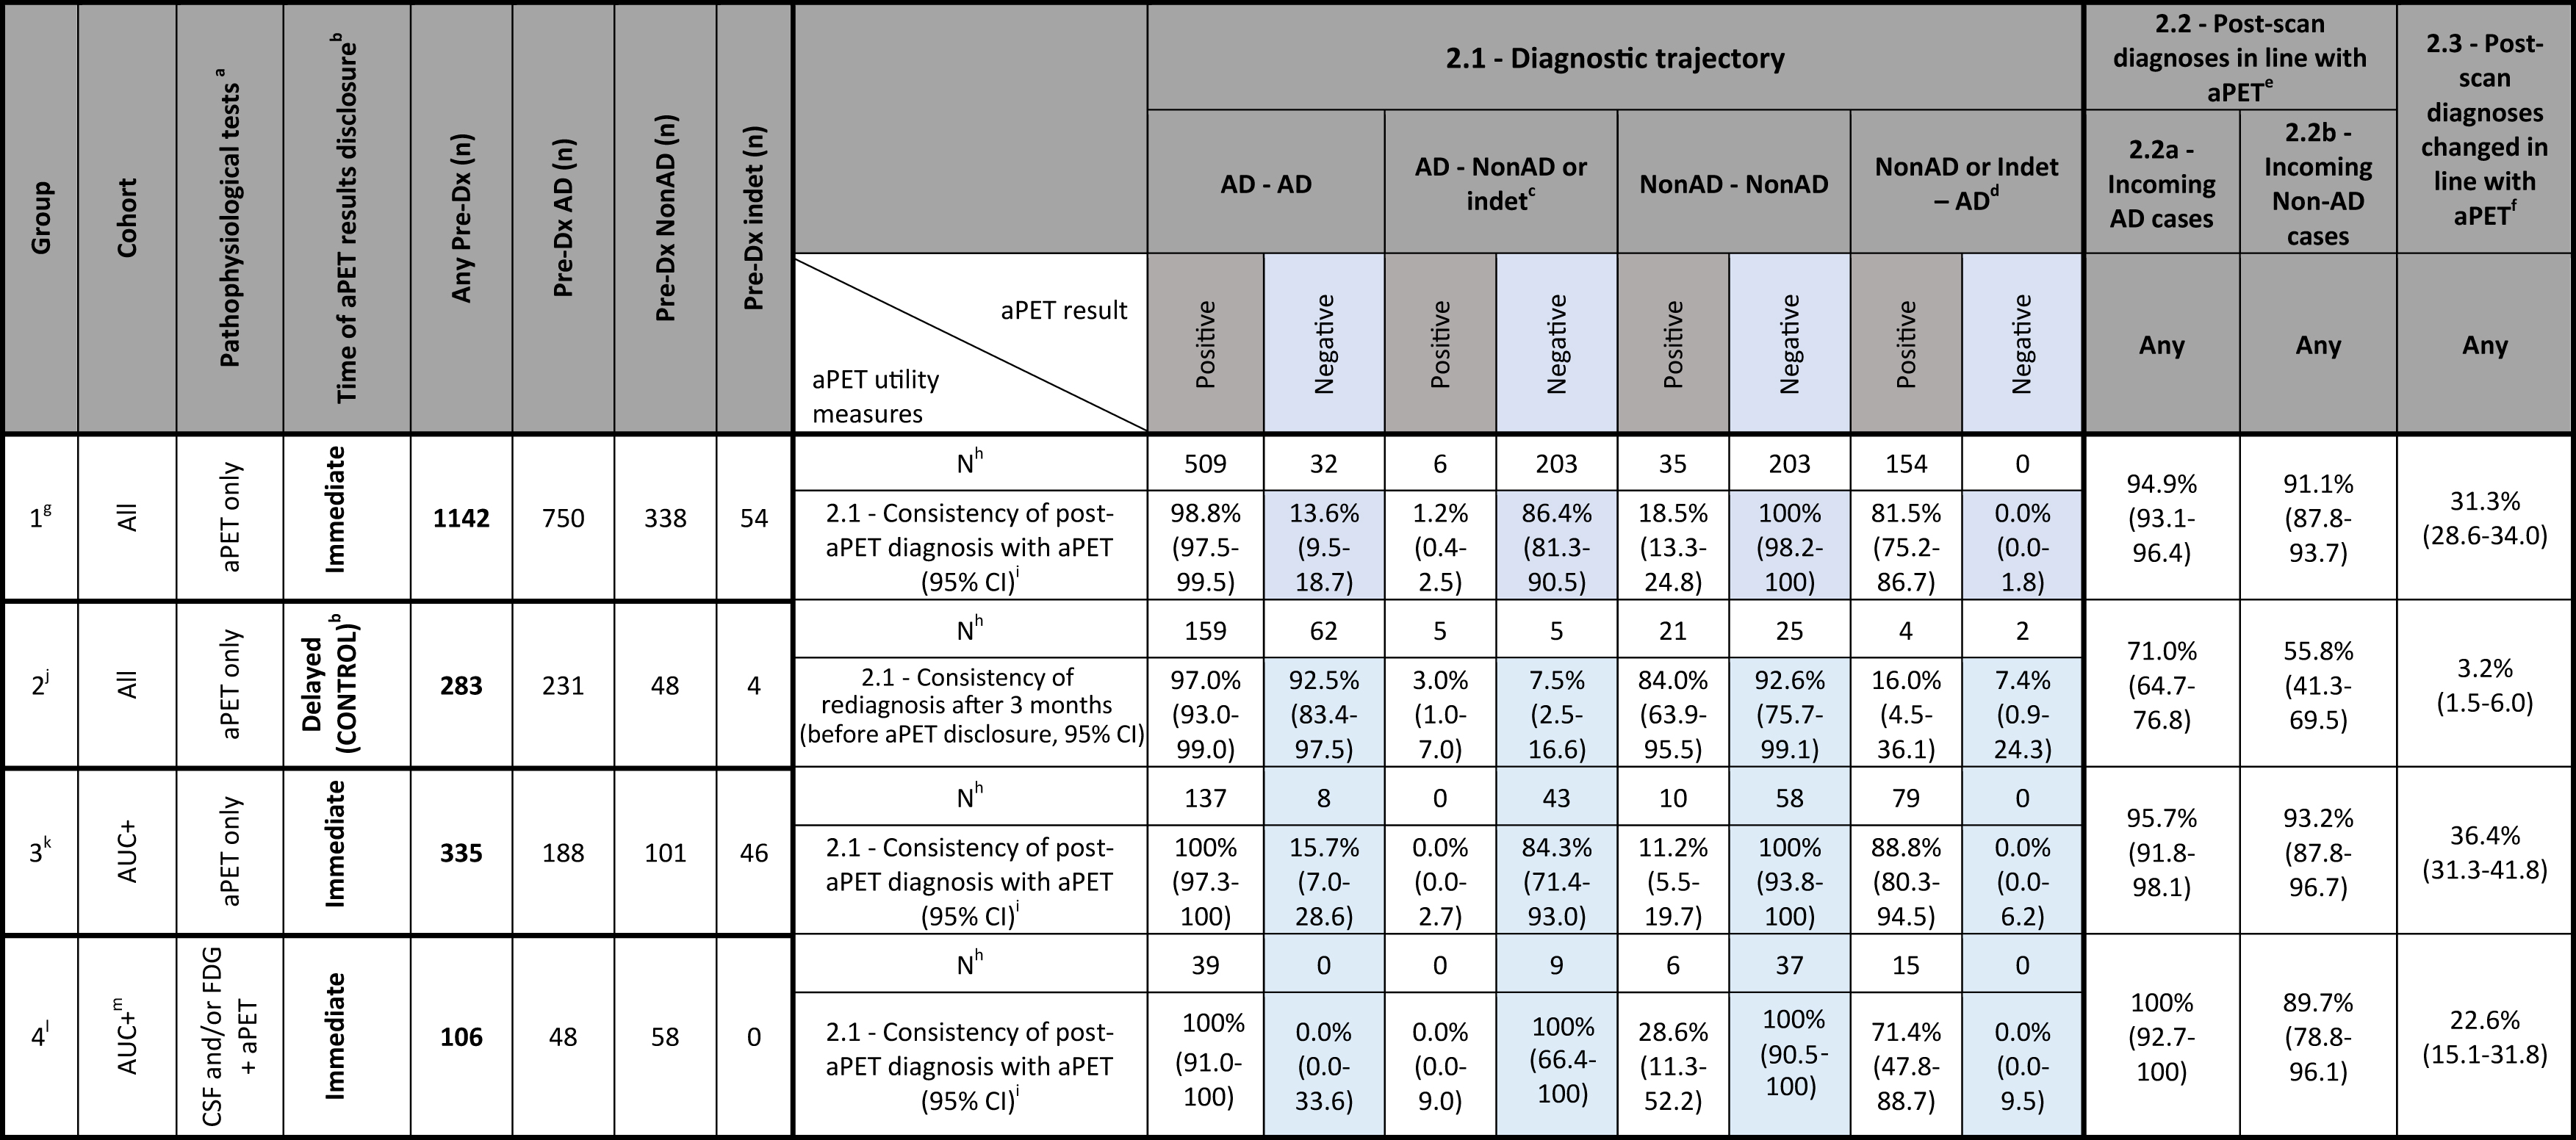 |
Diagnostic trajectory is defined as confirmation or change of pre-aPET AD or Non-AD diagnosis in the post-aPET diagnosis. a) Pathophysiological tests include only aPET, FDG and CSF analysis. b) When the aPET result was delayed, the re-diagnosis after 3 months was solely based on time-related changes (and thus acted as a control post-aPET diagnosis). c) For diagnostic change, AD change represents change “away from AD”, i.e., to either Non-AD or indeterminate Dx. d) For diagnostic change, Non-AD change represents change “towards AD”, i.e., from either Non-AD or indeterminate to AD. Non-AD confirmation only includes the Non-AD to Non-AD trajectory. e) 2.2 – Post-scan diagnoses in line with aPET: Percentage of initial AD/Non-AD cases where aPET results were followed through in the revised diagnosis. f) 2.3 – Post-scan diagnoses changed in line with aPET: Overall percentage of cases that without the use of aPET would potentially result in a wrong diagnosis. g) Group 1 is comprised of 7 studies: Ishii 2016, Grundman 2013 (including 20/229 undiscernible cases with FDG and 14/229 cases with CSF), Sanchez-Juan 2014 (only 6/140 cases without FDG), Mitsis 2014 (only 28/30 cases without FDG), Zwan 2017, Boccardi 2016 (including some undiscernible cases with FDG and CSF), Pontecorvo 2016 (only 301/600 “information” cases). Analysis was also performed without Grundman 2013 and Boccardi 2016 where some cases (around 10–15% of total) with prior FDG and CSF remained undiscernible. In this case, out of 761 total patients, 499 (65.6%) had pre-Dx of AD and 262 (34.4%) had a Dx other than AD (Non-AD or indeterminate). Out of the AD patients 355 (71.1%) had positive aPET, resulting in 349 (98.3%) AD confirmations. Instead, 144 (28.9%) had negative aPET, resulting in 125 (86.8%) diagnostic changes away from AD. Out of the Non-AD and indeterminate patients, 100 (37.1%) had positive aPET, resulting in 79 (79.0%) diagnostic changes towards AD. Instead, 162 (61.8%) had negative aPET, resulting in 162 (100.0%) Non-AD confirmations. Overall, the AD consistency was 95.0%, the Non-AD consistency was 92.0% and the maximal prevention of misdiagnosis was 26.8%. h) N subjects excludes indeterminate subjects confirmed as indeterminate or converting to Non-AD, as not enough data was reported in the studies for these patients to be included. i) 2.1 – Consistency of post-aPET diagnosis with aPET: Percentage of Pos/Neg PET cases with either confirmed or changed diagnosis vs. any diagnostic trajectory. j) Group 2 is comprised of 1 study: Pontecorvo 2016 (only 283/600 “control” cases). k) Group 3 is comprised of 5 studies: Ishii 2016 (only 66/233 cases with early onset dementia), Grundman 2013 (only 61/229 cases with indeterminate diagnosis), Mitsis 2014 (only 13/30 AUC+cases), Zwan 2017 (all cases) and Pontecorvo 2016 (only 21/600 “information cases with indeterminate diagnosis). Analysis was also performed for all patients with pre-Dx tests “FDG, CSF or none”. In this case, out of 420 total patients, 222 (52.9%) had pre-Dx of AD and 198 (47.1%) had a Dx other than AD (Non-AD or indeterminate). Out of the AD patients 163 (73.4%) had positive aPET, resulting in 163 (100.0%) AD confirmations. Instead, 59 (26.6%) had negative aPET, resulting in 51 (86.4%) diagnostic changes away from AD. Out of the Non-AD and indeterminate patients, 104 (52.5%) had positive aPET, resulting in 88 (84.6%) diagnostic changes towards AD. Instead, 94 (47.5%) had negative aPET, resulting in 94 (100.0%) Non-AD confirmations. Overall, the AD consistency was 96.4%, the Non-AD consistency was 91.9% and the maximal prevention of misdiagnosis was 33.1%. l) Group 4 is comprised of 3 studies: Mitsis 2014 (2/30 cases with FDG), Frederiksen 2012, Bensaidane 2016, and Weston 2016. m) All patients in Group 4 are AUC+due to the inclusion criteria in the included studies.
Table 3
Management changes. 95% CI were calculated by the Clopper-Pearson method
| Group | Cohort | Pathophysiological testsa | Time of aPET outcome disclosureb | Medication change | Overall management change | ||||||
| All PET | All PET | Positive PET | Negative PET | ||||||||
| N | % (95% CI) | N | % (95% CI) | N | % (95% CI) | N | % (95% CI) | ||||
| 1c | All | aPET only | Immediate | 740 | 26.4% (23.2–29.7) | 740 | 72.2% (68.8–75.4) | 247 | 53.9% (47.4–60.2) | 193 | 45.1% (37.9–52.4) |
| 2d | All | aPET only | Delayede | 299 | 22.1% (17.5–27.2) | 299 | 55.5% (49.7–61.2) | ||||
| 3f | AUC+g | CSF and/or FDG+aPET | Immediate | 211 | 24.2% (18.6–30.5) | 239 | 41.4% (35.1–48.0) | 148 | 52.0% (43.7–60.3) | 91 | 38.5% (28.4–49.2) |
| 4h | Alli | CSF and/or FDG | Immediate | 157 | 34.4% (27.0–42.4) | 185 | 41.1% (33.9–48.5) | 101 | 32.7% (23.9–43.1) | 84 | 31.0% (21.3–42.0) |
a) Pathophysiological tests include only aPET, FDG and CSF analysis. b) When the aPET result was delayed, the post-aPET diagnosis was solely based on time-related changes (and thus acted as a control post-aPET diagnosis). c) Group 1 is comprised of 3 studies: Grundman 2013 (including 20/229 undiscernible cases with FDG and 14/229 cases with CSF), Zwan 2017 and Pontecorvo 2016 (no data by PET result). d) Group 2 is comprised of 1 study: Pontecorvo 2016 (only 299/600 “control” cases), no data by aPET result. e) When the aPET result was delayed, the post-aPET diagnosis was solely based on time-related changes (and thus acted as a control post-aPET diagnosis). f) Group 3 is comprised of 2 studies: Zwan 2017 and Bensaidane 2016 (no data for changes in medications). g) AUC+patients comprise of early onset patients and patients with indeterminate, atypical or unclear diagnosis. h. Group 4 is comprised of 4 studies: Sanchez-Juan 2014 (comprising 131/140 cases with adjunct FDG and 6/140 undiscernible cases with aPET only), Bensaidane 2016 (no data for changes in medications) and Weston 2016 (no data by PET result). For management change, Group 4 includes both AUC+and AUC- patients due to various inclusion criteria in the included studies (which are in turn different from the diagnostic change Group 4 which instead are all AUC+).
The primary analysis assimilates all cases with pre-aPET diagnoses based only on a combination of clinical history, neurocognitive assessment and/or structural imaging and a post-aPET diagnosis. Three measures were calculated:
1.1 Post-aPET diagnoses in line with amyloid PET status (as a percentage);
1.2 Post-aPET diagnoses in contradiction to amyloid PET status (as a percentage);
1.3 Post-aPET diagnoses changed due to amyloid PET result (as a percentage).
A secondary more in-depth analysis of patient diagnostic trajectories was performed on a set of groups, defined based on the following patient or pre-aPET testing characteristics.
1. Group 1 further analyses all subjects examined in the primary analysis.
2. Group 2 acted as control where the aPET scan result was not disclosed during the 3-month diagnostic assessment period. This served to reveal the extent of diagnostic change independent of aPET.
3. Group 3 only included subjects consistent with the aPET Appropriate Use Criteria (AUC+).
4. Group 4 captured all cases where pre-aPET diagnosis was based on CSF testing and/or FDG in addition to the standard combination of clinical history, neurocognitive assessment and structural imaging.
The above groups were analyzed using three measures outlined below (calculations further outlined in Table 2 caption):
2.1 Consistency of post-scan diagnosis with aPET result. For each of four possible pre-scan to post-scan diagnostic trajectories (e.g., AD confirmed as AD or Non-AD changed to AD) data is shown for both positive and negative aPET scans (therefore 8 permutations reported as percentages).
2.2 Post-aPET diagnosis in line with the aPET result (includes those confirmed and those changed) when pre-aPET diagnoses of either AD or Non-AD were recorded (two measures, 2.2a and 2.2b, reported as percentages).
2.3 Post-aPET diagnoses changed due to amyloid PET result because of the insight provided by aPET (one measure reported as a percentage). This measure is similar to that captured in 1.3 in the primary analysis but is recorded here for all 4 patient groups.
Two measures of impact on confidence were used. The first examined the extent of change in confidence over the population for which quantitative data was available (6 studies, 725 cases [31–36]) and the second assessed the proportion of patients having a diagnostic confidence increase (6 studies, 870 cases [32, 33, 36–39]), further subdivided by aPET outcome when reported (5 studies, 850 cases [32, 33, 37–39]).
The impact on patient management was assessed according to overall management change (in terms of changes in therapy, care plan or additional testing) by aPET outcome and by the change in medications. The same four groups as for the aPET impact on diagnostic change were considered. Some studies discriminated patient management by aPET outcome only (7 studies, 1046 cases [31, 32, 35, 36, 39–41]) whereas others (4 studies, 605 cases [31, 32, 35, 41]) split the analysis between positive and negative aPET outcome.
Statistical analysis
Each measure of aPET utility had 95% confidence intervals calculated (Clopper-Pearson method, GraphPad Prism 7). Statistical significance between groups of possible clinical interest (group 1 versus 2 and AD diagnostic rule-in versus rule-out) was analyzed by Pearson Chi-Square Tests on SAS V9.3.
RESULTS
Study characteristics
This review included 12 studies: nine prospective (8 open-label and one randomized to immediate and delayed aPET result disclosure [42]), two retrospective observational studies [38, 41], and a questionnaire extension of a retrospective study [39] (Table 1). The data for [42] was retrieved from a conference poster which was later published in full with no alteration of data [40].
Studies included cohorts of variable size and study reporting format, including some with patient-level data [32–34, 36, 37, 43] and others with summary data [31, 35, 38, 41, 42].
Risk of bias within and across studies
The heterogeneity of cohorts included required reclassification of patient diagnostic categories into standardized groups (presumed AD, Non-AD and indeterminate) by consideration of diagnostic guidelines [1] (Supplementary Table 6). Supplementary Table 7 shows the diagnostic language used in each study to include subjects, breakdown of subjects fulfilling the AUC criteria and numbers of patients with additional FDG or CSF testing. The presence within standardized diagnostic groups of a mix of disease stage (prodromal, SCI, MCI, established dementia), age of onset (early, late), symptomatic presentation (typical, atypical, mixed) and certainty of diagnosis (low to high) is acknowledged but its impact is difficult to quantify with the limited data granularity available to correlate to observed diagnostic changes. Nevertheless, this underlying diversity is inherent to populations observed throughout memory clinics, allowing for a clinically relevant and current analysis of the utility of aPET.
The less specialized the clinical setting, the higher the proportion of patients with diagnostic uncertainty, although study inclusion criteria mitigate this effect. Similarly, studies involving an element of randomization, such as unselected consecutive patients [32, 33, 38, 43] or non-disclosure of aPET result during the diagnostic assessment period [42], are less prone to bias when assessing true aPET impact. Additionally, the group analysis performed in the secondary analysis is limited by the subjects in group 2 coming from the same patient cohort [42] (this point is further expanded in the discussion).
An assessment of study bias can be inferred from QUADAS [27, 28] in Supplementary Table 4.
Quantitative analysis
Impact on diagnosis
Primary analysis: In 1142 patients undergoing aPET and no FDG/CSF testing, the pre-scan working diagnosis was AD in 65.7%, Non-AD in 29.6% and indeterminate in 4.7% of cases (Fig. 1). Among presumed AD subjects, 68.7% were aPET-positive. AD dementia was confirmed post-aPET in 98.8% of these cases, while the diagnosis was changed in the remaining 1.2% despite positive aPET. Among presumed Non-AD subjects, 60.1% were aPET-negative and in all a Non-AD diagnosis was confirmed. All indeterminate cases had positive aPET, and all diagnoses were subsequently revised to AD (by inclusion criteria, see caption to Fig. 1).
Amyloid PET results were incongruent with the pre-aPET working diagnoses in 31.5% of the incoming presumed AD cases and in 39.9% of Non-AD cases, leading to a significantly higher (p = 0.0031) AD diagnosis rule-out (86.4%) than AD rule-in (74.1%). Interestingly, despite discordant aPET results, the pre-aPET working diagnosis was confirmed in 13.6% of AD and 25.9% of Non-AD cases.
Overall, 93.6% of final diagnoses reflect disease pathophysiology suggested by aPET either by confirming the pre-aPET working diagnosis (62.3%) or by a discordant aPET result supporting a change in diagnosis (31.3%). A minority of cases (6.4%) had a revised diagnosis inconsistent with amyloid status.
Secondary analysis:
For the secondary analysis (Table 2), comparisons between patient groups were performed. No substantial difference in terms of the influence of aPET on diagnosis was found for all three outcome measures between group 1 (aPET only, all subjects), group 3 (AUC+ patients) and group 4 (aPET and CSF or FDG, AUC+ patients).
Comparison between group 1 and control group 2 where aPET results were withheld from clinicians until after formulation of a revised diagnosis, allows to compare time-related diagnostic changes in the absence and presence of aPET. As a result (group 1 versus 2, Table 2):
• In the absence of the aPET data, the diagnosis remains largely unchanged over time.
When aPET data is available and is discordant from the pre-aPET diagnosis there is significant diagnostic change. Two examples are described: in analysis measure 2.1 92.5% AD cases remain AD when negative aPET result is withheld (control group 2), while when negative aPET is disclosed (group 1) only 13.6% AD cases remain AD. Conversely, when the Group 1 AD cases have a negative scan, 86.4% of diagnoses are changed to Non-AD, whereas in the control group the change to Non-AD diagnosis over 3 months was only 7.5%.
• In the control group, the amyloid burden revealed by aPET at the end of the 3-month observation period is more frequently inconsistent with the working diagnosis (see measure 2.1): in control group 2 the percentage of cases having an AD/Non-AD/indeterminate final diagnosis is unvaried irrespective of aPET outcome, whereas with immediate disclosure (group 1) these percentages vary depending on aPET outcome.
• For both incoming presumed AD and Non-AD cases there is high consistency with aPET compared to when aPET results were withheld (see measures 2.2a and 2.2b, both >91% for group 1 but only 56-71% for group 2).
• In the period when aPET results are withheld there is only 3.2% change in pre-aPET working diagnosis versus 31.3% when aPET is disclosed (see measure 2.3).
Impact on diagnostic confidence
The impact of aPET on diagnostic confidence was assessed in descriptive summary terms due to variability of reported data. It is also recognized that this measure may be subjective and dependent on clinician expertise levels.
Overall, aPET raises diagnostic confidence by a mean of 12.7±35.3% (with a net decrease in confidence being associated with negative aPET cases, 6 Studies, 725 cases [31–36]). Where specified, the pre-aPET diagnostic confidence was modest (e.g., 68% in Zwan et al. [32], 71% in Ossenkoppele et al. [34]). Diagnostic confidence increases in a total of 62.1% [95% CI 58.8% –65.3%] of 870 incoming subjects, 6 studies [32, 33, 36–39]). An increase in diagnostic confidence (25.7% of 850 cases, 5 studies [32, 33, 37–39]) occurs more often for patients with positive aPET (both concordant and discordant from pre-aPET working diagnoses; 71.4% [95% CI 67.3%–75.3%] of cases) than for aPET negative patients (both concordant and discordant from working diagnoses, 45.6% [95% CI 40.2%–51.2%] of cases).
Impact on patient management
Results are described according to Table 3.
A) Changes in medication ranged between 24–34% in the three groups having aPET available with a similar percentage (22%) in the control group with delayed aPET disclosure.
B) The overall combined management changes (in terms of changes in therapy, care plan and additional testing) in both the AUC+ group (group 3) and wider cohort (group 1) were similar both with positive aPET (52% and 54% respectively) and negative aPET (39% and 45% respectively). Lower management changes were found in group 4, where aPET was combined with CSF/FDG.
C) In some cases, management changes were reported for all aPET results combined. These ranged widely, e.g., 72% in the wider cohort (group 1) down to 41% in group 4 where aPET was combined with CSF/FDG. In the control group, reported management changes were 56% indicating propensity to change in the absence of pathophysiological evidence.
DISCUSSION
This study is a systematic review and quantitative aggregated analysis aiming to reach a consensus over the extent of utility of amyloid brain PET imaging across different radiotracers and cohorts of cognitively impaired patients assessed in conditions close to routine clinical practice. The aim is to generate data which could support diagnostic decision-making and possible future cost-benefit assessments. The systematic review primarily discusses the utility of aPET though it is recognized that other tests for measuring amyloid load such as CSF provide an alternative opportunity to influence diagnosis despite some current limitations of this technique [20, 44–48].
Our primary analysis in 1,142 patients shows that the adjunctive use of aPET (in absence of CSF/FDG) leads to revision of up to 31.3% [95% CI 28.6%–34.0%] diagnoses by elucidation of disease pathophysiology. Additionally, for 94.9% [95% CI 93.1%–96.4%] of these cases initially diagnosed with AD and 91.1% [95% CI 87.8%–93.7%] of Non-AD cases (measures 2.2a/2.2b, Table 2), aPET results are consistent with the revised diagnosis, demonstrating strong confidence in aPET for assisting diagnostic decision-making. It is particularly noteworthy that when aPET result disclosure is delayed rather than immediate [42], the working diagnosis at the end of the 3 month control period is much less frequently consistent with the amyloid burden eventually revealed by aPET (measure 2.1, Table 2).
It is now understood that cognitive decline is anticipated by alterations in normal molecular biomarker patterns, with amyloid being the first majorly affected [49]. In this context, frequent discordance between pre-aPET working diagnosis and aPET result is noteworthy and underscores the notion that earlier amyloid imaging may valuably contribute to measuring risk of future cognitive decline [50].
It is recognized that what constitutes sufficient clinical utility in a practical setting varies by center, clinician, clinical population, and the wider context. However, the evidence in this aggregated analysis and other reviews [22] indicates that in general aPET supports diagnostic change in as high as one out of three patients, emphasizing a strong need for clinical practice to shift away from symptom-based diagnoses and towards pathophysiologically-driven diagnoses [1, 25]. Nonetheless, the extent of utility needed to justify clinical adoption of this technique is a complex matter that requires to consider both the therapeutic implications and the wider health-economic impact including care planning, hospitalization, additional clinical time and possible alternative diagnosis methods available [51]. On the other hand, the assessment of utility remains a subjective topic which some have attempted to address by surveying patient willingness-to-pay in a variety of diagnostic scenarios [52].
There are small numbers of cases where the confirmed diagnosis is inconsistent with the etiology suggested by aPET. These few cases show that clinical symptoms consistent with Non-AD dementias can still overrule positive PET amyloid status. Amyloid-negative confirmed AD cases are likely “Suspected Non-Alzheimer’s Pathology” (SNAP) patients [53], increasingly recognized as a syndrome in their own right. Furthermore, negative aPET results are significantly more useful in diagnostic decision-making than positive aPET results (Fig. 1), confirming the primary use as an adjunct test for ruling out AD as recommended by EU and US regulators [5–10]. In itself, the negative predictive value of aPET is highly impactful from diagnostic management [54], financial [55, 56] and patient well-being [57] standpoints. Nevertheless, positive aPET maintains a substantial 74.1% utility for ruling-in AD, which supports its use in this function as anecdotally reported by others [58, 59].
Regarding aPET positioning in the diagnostic decision-making process, it is still widely debated which test may most cost-effectively serve physicians in determining an accurate diagnosis for cognitively impaired subjects, particularly in early disease stages [17, 19–21, 60–64]. If we examine the AUC+ patients only, there is lack of substantial difference in aPET utility between aPET alone and accompanied by CSF/FDG (Table 2). This suggests that FDG and CSF may not substantially alter the impact of aPET both from a diagnostic and management perspective. Possible reasons for this observation could be the less precise correspondence between FDG uptake patterns and (particularly early) disease etiology [19, 49] and/or the potentially non-linear association between CSF and amyloid burden as the disease progresses [47]. Additionally, data from Sanchez-Juan et al. [41] in cognitively impaired subjects of uncertain disease etiology indicated greater relative impact of aPET than FDG when both were employed for diagnostic decision-making (Supplementary Table 5). Comparable results (albeit with less detail reported) were observed by Ossenkoppele et al. [34]. This is particularly the case when imaging results are discordant from pre-aPET diagnoses indicating that to maximize the impact of investigative procedures it may be beneficial for aPET to precede FDG. The patient outcome benefits of making use of aPET rather than FDG as a first-line test in certain cases has been previously argued [19, 65]. In particular, aPET may be more valuable in earlier stages of dementia pathogenesis, when regional FDG uptake variations are less revealing of different pathological processes [65] despite this being a time when treatments may be most effective [66]. Moreover, it is worth highlighting that aPET appeared most suitable when borderline CSF resulted in equivocal amyloid status as analyzed in Weston et al. [36].
As for patient management change, significant increase (over 16% extra cases, Table 3) occurs following amyloid PET, both compared to patients with delayed aPET results and to those having prior CSF/FDG. This suggests that the increase in management changes is independent of time-related disease progression and could be related to increased diagnostic confidence associated with pathophysiological evidence provided by aPET. The availability of CSF/FDG (group 4) prior to aPET could allow some triaging of the patient management which decreases somewhat the impact of additional aPET scanning. Positive aPET drives more management changes than negative aPET. Medication changes were apparent both in the absence and presence of aPET with similar levels seen in all groups (approximately 22–34%). These results indicate that even in the absence of pathophysiological data there is a bias to treat despite medications ultimately shown as inconsistent with the amyloid status when revealed (Table 2, group 2). Earlier aPET could therefore provide more informed medication planning [41].
Regarding diagnostic confidence, this study found an increase with both positive and negative aPET results concordant with pre-aPET working diagnosis due to additional pathophysiological diagnostic evidence. Conversely, discordant results had lower impact on diagnostic confidence since often giving rise to diagnostic changes. Overall, positive aPET was associated with diagnostic confidence increases in 25.7% cases more than negative aPET.
Clinical guidelines published in 2013 [23, 24] indicated distinct patient categories where the use of aPET is deemed appropriate (AUC+). However, the analysis in this study indicates that subjects beyond the AUC criteria (i.e., group 1) could benefit similarly to those in the AUC+ group in terms of diagnostic impact (group 3). This is corroborated by previous reports by others [67–69] who have found post-aPET diagnostic and treatment plan changes to be somewhat independent of age of onset and diagnostic confidence. Additionally, three studies included in this analysis [34, 35, 43] reported diagnostic confidence increases in AUC+ patients and a noticeably stronger impact in the management of AUC+ cases in amyloid-positive (but not negative) patients. This outcome-specific impact could be explained by the enhanced understanding of disease etiology offered by affirmative test results.
This analysis has some limitations. While necessary to effectively analyze diagnostic changes with respect to aPET, the reclassification of patient diagnoses into standardized groups (AD, Non-AD and indeterminate) by consideration of the latest diagnostic guidelines [1] lead to some loss of granularity. The majority of studies assessed here are also simple observational studies with the diagnosis observed before and after the aPET scan. The presence of a single study [42] with a control cohort (i.e., no aPET test considered between diagnoses) represents a limitation which is recognized as a known issue and is being addressed in new amyloid utility studies such as AMYPAD [70]. Furthermore, the heterogeneity of patient populations across individual studies could affect the quantification of utility (Supplementary Table 7 and Risk of Bias section in Methods). Given the detail available in each paper, it is not possible to quantify at this time how different patient groups benefit from aPET, as this requires further research to avoid speculative conclusions. This is particularly the case for Non-AD aPET positives and cognitively normals.
Conversely, the aggregation of this data inherently displaying a variety routine practice patient groups allows to quantify more broadly the value of aPET in the general population visiting secondary and tertiary centers and could be useful for cost-effectiveness analyses and clinical decision-making.
Our observations in this analysis are based on the post-aPET diagnosis as standard of clinical truth in absence of histopathological verification as the ultimate standard of truth. This may alter the figures obtained from the true aPET impact. However, aPET imaging and histopathological findings at autopsy have been shown to correlate strongly with over 90% accuracy [5, 7, 9, 71] and this highly-powered analysis has the advantage of reducing both physician, population and test selection biases, giving good estimations of true aPET utility. Also, concordance between diagnostic change after aPET and extent of mismatch between clinical diagnosis and final neuropathological diagnosis [72] indicates overall high diagnostic performance of aPET. This analysis is also not intended to examine the impact of CSF and FDG as tests in their own right.
Analysis of the extent of impact of study-specific population and test variations on aPET utility was restricted by the limited detail available within the studies considered. Thus, the overall quantification of aPET utility assumed all cases in this aggregated analysis carry equal weight in reflection of the inherent variability of cases incoming in routine practices. Nonetheless, the consideration of individual patient data represents an advancement from Barthel and Sabri [22] where overall utility measures are only based on summary results as calculated in each individual study and then weighted according to study power. Furthermore, the impact of aPET on patient health, quality of life and institutionalization remain a domain for further research. Finally, the effect of medication and management changes on longer term patient outcomes useful for reimbursement discussions, is a subject that studies such as IDEAS [73] and AMYPAD [70] aim to address.
Since this analysis has been performed other studies have come to light examining the utility of aPET. Ceccaldi et al. [74] studied 205 subjects in a multi-center tertiary memory setting where CSF testing was not feasible or was equivocal. In this group of subjects, the patients presented with complex clinical features and a high degree of clinical uncertainly and hence the change in diagnosis after aPET (in this case [18F]florbetaben) was greater (66.8%) than seen in the meta-analysis reported here. A further [18F]florbetaben study of 507 subjects [75] examined an unselected memory clinic cohort of equal numbers of AUC and non-AUC subjects (for example subjective cognitive decliners) and reported similar levels of diagnostic changes; 28% in the AUC and 23% in the non-AUC group after the aPET scan further indicating the consistency of data reported in our paper.
Conclusion
The data retrieved in this aggregated analysis support the utility of aPET in diagnostic decision-making, confidence of diagnosis and management planning for patients with cognitive impairment. The relative impact of aPET on diagnostic change was >30%, consistent with the difference previously reported by Beach et al. [72] between clinical and post-mortem diagnoses.. Additionally, the substantial number of cases having diagnostic confidence increases and management changes point to a broad impact of aPET on patient outcomes.
ACKNOWLEDGMENTS
The authors wish to thank Michelle Zanette of GE Healthcare for the statistical analysis support. E.F. and G.F. are employed by GE Healthcare. A.C., A.H., and J.O. received no funding for this analysis from GE Healthcare and are employees of Kings College London (A.C., A.H.) and the University of Cambridge (J.O.). J.O. has acted as a consultant for GE Healthcare.
Authors’ disclosures available online (https://www.j-alz.com/manuscript-disclosures/17-1093r1).
SUPPLEMENTARY MATERIAL
[1] The supplementary material is available in the electronic version of this article: http://dx.doi.org/10.3233/JAD-171093.
REFERENCES
[1] | Dubois B , Feldman HH , Jacova C , Hampel H , Molinuevo JL , Blennow K , Dekosky ST , Gauthier S , Selkoe D , Bateman R , Cappa S , Crutch S , Engelborghs S , Frisoni GB , Fox NC , Galasko D , Habert MO , Jicha GA , Nordberg A , Pasquier F , Rabinovici G , Robert P , Rowe C , Salloway S , Sarazin M , Epelbaum S , de Souza LC , Vellas B , Visser PJ , Schneider L , Stern Y , Scheltens P , Cummings JL ((2014) ) Advancing research diagnostic criteria for Alzheimer’s disease: The IWG-2 criteria. Lancet Neurol 13: , 614–629. |
[2] | Albert MS , DeKosky ST , Dickson D , Dubois B , Feldman HH , Fox NC , Gamst A , Holtzman DM , Jagust WJ , Petersen RC , Snyder PJ , Carrillo MC , Thies B , Phelps CH ((2011) ) The diagnosis of mild cognitive impairment due to Alzheimer’s disease: Recommendations from the National Institute on Aging-Alzheimer’s Association workgroups on diagnostic guidelines for Alzheimer’s disease. Alzheimers Dement 7: , 270–279. |
[3] | McKhann GM , Knopman DS , Chertkow H , Hyman BT , Jack CR , Kawas CH , Klunk WE , Koroshetz WJ , Manly JJ , Mayeux R , Mohs RC , Morris JC , Rossor MN , Scheltens P , Carrillo MC , Thies B , Weintraub S , Phelps CH ((2011) ) The diagnosis of dementia due to Alzheimer’s disease: Recommendations from the National Institute on Aging-Alzheimer’s Association workgroups on diagnostic guidelines for Alzheimer’s disease. Alzheimers Dement 7: , 263–269. |
[4] | Sperling RA , Aisen PS , Beckett LA , Bennett DA , Craft S , Fagan AM , Iwatsubo T , Jack CR , Kaye J , Montine TJ , Park DC , Reiman EM , Rowe CC , Siemers E , Stern Y , Yaffe K , Carrillo MC , Thies B , Morrison-Bogorad M , Wagster M V. , Phelps CH ((2011) ) Toward defining the preclinical stages of Alzheimer’s disease: Recommendations from the National Institute on Aging-Alzheimer’s Association workgroups on diagnostic guidelines for Alzheimer’s disease. Alzheimers Dement 7: , 280–292. |
[5] | European Medicines Agency (EMA) Amyvid EU Summary of Product Characteristics 2013 [Internet]. [cited 2017 Mar 20]. Available from: http://www.ema.europa.eu/ema/index.jsp?curl=pages/medicines/human/medicines/002422/human_med_001611.jsp&mid=WC0b01ac058001d124 |
[6] | FDA. US Prescribing information for Amyvid 2013 [Internet]. [cited 2017 Mar 20]. Available from: https://www.accessdata.fda.gov/drugsatfda_docs/label/2013/202008s020lbl.pdf |
[7] | EMA. Neuraceq EU Summary of Product characteristics 2016 [Internet]. [cited 2017 Mar 20]. Available from: http://www.ema.europa.eu/docs/en_GB/document_library/EPAR_-_Product_Information/human/002553/WC500162592.pdf |
[8] | FDA. US Prescribing information for Neuraceq 2016 [Internet]. [cited 2017 Mar 20]. Available from: http://www.accessdata.fda.gov/drugsatfda_docs/label/2016/204677s012lbl.pdf |
[9] | EMA. Vizamyl EU Summary of Product characteristics 2017 [Internet]. [cited 2017 Mar 20]. Available from: http://www.ema.europa.eu/docs/en_GB/document_library/EPAR_-_Product_Information/human/002557/WC500172950.pdf |
[10] | FDA. US Prescribing information for Vizamyl 2017 [Internet]. [cited 2017 Mar 16]. Available from: http://www.accessdata.fda.gov/drugsatfda_docs/label/2017/203137s008lbl.pdf |
[11] | Salloway S , Gamez JE , Singh U , Sadowsky CH , Villena T , Sabbagh MN , Beach TG , Duara R , Fleisher AS , Frey KA , Walker Z , Hunjan A , Escovar YM , Agronin ME , Ross J , Bozoki A , Akinola M , Shi J , Vandenberghe R , Ikonomovic MD , Sherwin PF , Farrar G , Smith APL , Buckley CJ , Thal DR , Zanette M , Curtis C ((2017) ) Performance of [18F]flutemetamol amyloid imaging against the neuritic plaque component of CERAD and the current (2012) NIA-AA recommendations for the neuropathologic diagnosis of Alzheimer’s disease. Alzheimers Dement (Amst) 9: , 25–34. |
[12] | Sabri O , Seibyl J , Rowe C , Barthel H ((2015) ) Beta-amyloid imaging with florbetaben. Clin Transl Imaging 3: , 13–26. |
[13] | Clark CM , Schneider JA , Bedell BJ , Beach TG , Bilker WB , Mintun M , Pontecorvo MJ , Hefti F , Carpenter AP , Flitter ML , Krautkramer MJ , Kung HF , Coleman RE , Doraiswamy PM , Fleisher AS , Sabbagh MN , Sadowsky CH , Reiman EP , Zehntner SP , Skovronsky DM ((2011) ) Use of florbetapir-PET for imaging beta-amyloid pathology. JAMA 305: , 275–283. |
[14] | Clark CM , Pontecorvo MJ , Beach TG , Bedell BJ , Coleman RE , Doraiswamy PM , Fleisher AS , Reiman EM , Sabbagh MN , Sadowsky CH , Schneider JA , Arora A , Carpenter AP , Flitter ML , Joshi AD , Krautkramer MJ , Lu M , Mintun MA , Skovronsky DM ((2012) ) Cerebral PET with florbetapir compared with neuropathology at autopsy for detection of neuritic amyloid-beta plaques: A prospective cohort study. Lancet Neurol 11: , 669–678. |
[15] | Morris E , Chalkidou A , Hammers A , Peacock J , Summers J , Keevil S ((2015) ) Diagnostic accuracy of 18F amyloid PET tracers for the diagnosis of Alzheimer’s disease: A systematic review and meta-analysis. Eur J Nucl Med Mol Imaging 43: , 374–385. |
[16] | Yeo JM , Waddell B , Khan Z , Pal S ((2015) ) A systematic review and meta-analysis of 18F-labeled amyloid imaging in Alzheimer’s disease. Alzheimers Dement (Amst) 1: , 5–13. |
[17] | Zhang S , Smailagic N , Hyde C , Han D , Takwoingi Y , Mcshane R , Noel-Storr A , Takwoingi Y , Mcshane R ((2013) ) C-PIB-PET for the early diagnosis of Alzheimer’s disease dementia and other dementias in people with mild cognitive impairment (MCI). Cochrane Database Syst Rev, CD010386. |
[18] | Bloudek LM , Spackman DE , Blankenburg M , Sullivan SD , Pharma H ((2014) ) Review and meta-analysis of biomarkers and diagnostic imaging in Alzheimer’s disease. J Alzheimers Dis 26: , 627–645. |
[19] | Smailagic N , Vacante M , Hyde C , Martin S , Ukoumunne O , Sachpekidis C ((2015) ) 18F-FDG PET for the early diagnosis of Alzheimer’s disease dementia and other dementias in people with mild cognitive impairment (MCI). Cochrane Database Syst Rev 1: , CD010632. |
[20] | Ritchie C , Smailagic N , Ec L , Ah N , Ukoumunne O , Martin S ((2013) ) CSF tau and the CSF tau/ABeta ratio for the diagnosis of Alzheimer’s disease dementia and other dementias in people with mild cognitive impairment (MCI). Cochrane Database Syst Rev 3: , CD010803. |
[21] | Arevalo-Rodriguez I , Smailagic N , Roque i Figuls M , Ciapponi A , Sanchez-Perez E , Giannakou A , Pedraza O , Bonfill Cosp X , Cullum S ((2015) ) Mini-Mental State Examination (MMSE) for the detection of Alzheimer’s disease and other dementias in people with mild cognitive impairment (MCI). Cochrane Database Sytematic Rev CD010783. |
[22] | Barthel H , Sabri O ((2017) ) Clinical use and utility of amyloid imaging. J Nucl Med 58: , 1711–1717. |
[23] | Johnson KA , Minoshima S , Bohnen NI , Donohoe KJ , Foster NL , Herscovitch P , Karlawish JH , Rowe CC , Carrillo MC , Hartley DM , Hedrick S , Pappas V , Thies WH , Alzheimer’s Association, Society of Nuclear Medicine and Molecular Imaging, Amyloid Imaging Taskforce ((2013) ) Appropriate use criteria for amyloid PET: A report of the Amyloid Imaging Task Force, the Society of Nuclear Medicine and Molecular Imaging, and the Alzheimer’s Association. Alzheimers Dement 9: , e-1–16. |
[24] | Johnson KA , Minoshima S , Bohnen NI , Donohoe KJ , Foster NL , Herscovitch P , Karlawish JH , Rowe CC , Hedrick S , Pappas V , Carrillo MC , Hartley DM , Amyloid Imaging Task Force of the Alzheimer’s Association and Society for Nuclear Medicine and Molecular Imaging ((2013) ) Update on appropriate use criteria for amyloid PET imaging: Dementia experts, mild cognitive impairment, and education. Alzheimers Dement 9: , e106–109. |
[25] | Jack CR , Albert MS , Knopman DS , McKhann GM , Sperling RA , Carrillo MC , Thies B , Phelps CH ((2011) ) Introduc-tion to the recommendations from the National Institute on Aging-Alzheimer’s Association workgroups on diagnostic guidelines for Alzheimer’s disease, Elsevier” Ltd. |
[26] | Jack CR Jr , Bennett DA , Blennow K , Carrillo MC , Dunn B , Elliott C , Haeberlein SB , Holtzman DM , Jagust W , Jessen F , Karlawish J , Liu E , Masliah E , Molinuevo JL , Montine T , Phelps C , Rankin KP , Rowe C , Ryan L , Scheltens P , Siemers E , Silverberg N , Snyder HM , Sperling R ((2017) ) NIA-AA Research Framework: Towards a biological definition of Alzheimer’s disease (Draft 11-27-17). Alzheimer’s Association–https://www.alz.org/aaic/_downloads/nia-aa-draft-11-27-2017.pdf. |
[27] | Whiting P , Rutjes AW , Reitsma JB , Bossuyt PM , Kleijnen J ((2003) ) The development of QUADAS: A tool for the quality assessment of studies of diagnostic accuracy included in systematic reviews. BMC Med Res Methodol 3: , 25. |
[28] | Whiting P , Weswood M , Rutjes A , Reitsma J , Bossuyt P , Kleijnen J ((2006) ) Evaluation of QUADAS, a tool for the quality assessment of diagnostic accuracy studies. BMC Med Res Methodol 6: , 9. |
[29] | Leeflang MMG , Deeks JJ , Gatsonis C , Bossuyt PMM ((2008) ) Systematic reviews of diagnostic test accuracy. Ann Intern Med 149: , 889–897. |
[30] | Whiting P , Harbord R , Kleijnen J ((2005) ) No role for quality scores in systematic reviews of diagnostic accuracy studies. BMC Med Res Methodol 5: , 19. |
[31] | Grundman M , Pontecorvo MJ , Salloway SP , Doraiswamy PM , Fleisher AS , Sadowsky CH , Nair AK , Siderowf A , Lu M , Arora AK , Agbulos A , Flitter ML , Krautkramer MJ , Sarsour K , Skovronsky DM , Mintun MA , 45-A17 Study Group ((2013) ) Potential impact of amyloid imaging on diagnosis and intended management in patients with progressive cognitive decline. Alzheimer Dis Assoc Disord 27: , 4–15. |
[32] | Zwan MD , Bouwman FH , Konijnenberg E , Flier WM Van Der , Lammertsma AA , Verhey FRJ , Aalten P , Berckel BNM Van , Scheltens P ((2017) ) Diagnostic impact of [18F] flutemetamol PET in early-onset dementia. Alzheimers Res Ther 9: , 2. |
[33] | Boccardi M , Altomare D , Ferrari C , Festari C , Guerra UP , Paghera B , Pizzocaro C , Lussignoli G , Geroldi C , Zanetti O , Cotelli MS , Turla M , Borroni B , Rozzini L , Mirabile D , Defanti C , Gennuso M , Prelle A , Gentile S , Morandi A , Vollaro S , Volta GD , Bianchetti A , Conti MZ , Cappuccio M , Carbone P , Bellandi D , Abruzzi L , Bettoni L , Villani D , Raimondi MC , Lanari A , Ciccone A , Facchi E , Fazio I Di , Rozzini R , Boffelli S , Manzoni L , Salvi G Pietro , Cavaliere S , Belotti G , Avanzi S , Pasqualetti P , Muscio C , Padovani A ((2016) ) Assessment of the incremental diagnostic value of Florbetapir F 18 imaging in patients with cognitive impairment: The incremental diagnostic value of amyloid PET with [18F]-Florbetapir (INDIA-FBP) Study. JAMA Neurol 256: , 184–192. |
[34] | Ossenkoppele R , Prins ND , Pijnenburg YA , Lemstra AW , van der Flier WM , Adriaanse SF ((2013) ) Impact of molecular imaging on the diagnostic process in a memory clinic. Alzheimers Dement 9: , 414–421. |
[35] | Bensaïdane MR , Beauregard JM , Poulin S , Buteau FA , Guimond J , Bergeron D , Verret L , Fortin MP , Houde M , Bouchard RW , Soucy JP , Laforce R ((2016) ) Clinical utility of amyloid PET imaging in the differential diagnosis of atypical dementias and its impact on caregivers. J Alzheimers Dis 52: , 1251–1262. |
[36] | Weston PSJ , Paterson RW , Dickson J , Barnes A , Bomanji JB , Kayani I , Lunn MP , Mummery CJ , Warren JD , Rossor MN , Fox NC , Zetterberg H , Schott JM ((2016) ) Diagnosing dementia in the clinical setting: Can amyloid PET provide additional value over cerebrospinal fluid? J Alzheimers Dis 54: , 1297–1302. |
[37] | Ishii K , Ishibashi K , Sakata M , Wagatsuma K , Toyohara J , Murayama S ((2016) ) Clinical impact of amyloid PET with [C-11]Pittsburgh Compound B on the diagnosis of early onset dementias.12 (7 Suppl),. Alzheimers Dement P1161–P1162. |
[38] | Frederiksen KS , Hasselbalch SG , Hejl AM , Law I , Højgaard L , Waldemar G ((2012) ) Added diagnostic value of (11)C-PiB-PET in memory clinic patients with uncertain diagnosis. Dement Geriatr Cogn Dis Extra 2: , 610–621. |
[39] | Schipke CG , Peters O , Heuser I , Grimmer T , Sabbagh MN , Sabri O , Hock C , Kunz M , Kuhlmann J , Reininger C , Blankenburg M ((2012) ) Impact of beta-amyloid-specific florbetaben pet imaging on confidence in early diagnosis of Alzheimer’s disease. Dement Geriatr Cogn Disord 33: , 416–422. |
[40] | Pontecorvo MJ , Siderowf A , Dubois B , Doraiswamy PM , Frisoni GB , Grundman M , Nobili F , Sadowsky C , Salloway S , Anupa AK , Chevrette A , Deberdt W , Dell’Agnello G , Flitter M , Galante N , Lowrey MJ , Lu M , McGeehan A , Devous MDS , Mintun MA ((2017) ) Effectiveness of Florbetapir PET imaging in changing patient management. Dement Geriatr Cogn Disord 44: , 129–143. |
[41] | Sanchez-Juan P , Ghosh PM , Hagen J , Gesierich B , Henry M , Grinberg LT , O’Neil JP , Janabi M , Huang EJ , Trojanowski JQ , Vinters HV , Gorno-Tempini M , Seeley WW , Boxer AL , Rosen HJ , Kramer JH , Miller BL , Jagust WJ , Rabinovici GD , Sanchez-Juan P , Ghosh PM , Hagen J , Gesierich B , Henry M , Grinberg LT , O’Neil JP , Janabi M , Huang EJ , Trojanowski JQ , Vinters HV , Gorno-Tempini M , Seeley WW , Boxer AL , Rosen HJ , Kramer JH , Miller BL , Jagust WJ , Rabinovici GD ((2014) ) Practical utility of amyloid and FDG-PET in an academic dementia center. Neurology 82: , 230–238. |
[42] | Pontecorvo M , Dell’Agnello G , Deberdt W , Chevrette A , Ming L , Lenox-Smith A ((2016) ) A randomised, controlled, multicentre, international study of the impact of florbetapir (18F) PET amyloid imaging on patient diagnosis and management. Br Nucl Med Soc Spring Meet 1: , P42. |
[43] | Mitsis EM , Bender HA , Kostakoglu L , Machac J , Martin J , Woehr JL , Sewell MC , Aloysi A , Goldstein MA , Li C , Sano M , Gandy S ((2014) ) A consecutive case series experience with [(18) F] florbetapir PET imaging in an urban dementia center: Impact on quality of life, decision making, and disposition. Mol Neurodegener 9: , 10. |
[44] | Palmqvist S , Zetterberg H , Mattsson N , Johansson P , Minthon L , Blennow K , Olsson M , Hansson O ((2015) ) Detailed comparison of amyloid PET and CSF biomarkers for identifying early Alzheimer disease. Neurology 85: , 1240–1249. |
[45] | Palmqvist S , Zetterberg H , Blennow K , Vestberg S , Andreasson U , Brooks DJ , Owenius R , Hägerström D , Wollmer P , Minthon L , Hansson O ((2014) ) Accuracy of brain amyloid detection in clinical practice using cerebrospinal fluid β-amyloid 42. JAMA Neurol 71: , 1282. |
[46] | Adamczuk K , Schaeverbeke J , Vanderstichele HMJ , Lilja J , Nelissen N , Van Laere K , Dupont P , Hilven K , Poesen K , Vandenberghe R ((2015) ) Diagnostic value of cerebrospinal fluid Aβ ratios in preclinical Alzheimer’s disease. Alzheimer’s Res Ther 7: , 75. |
[47] | Toledo J , Bjerke M , Da X , Al E ((2015) ) Nonlinear association between cerebrospinal fluid and florbetapir f-18 β-amyloid measures across the spectrum of Alzheimer disease. JAMA Neurol 72: , 571–581. |
[48] | Palmqvist S , Mattsson N , Hansson O ((2016) ) Cerebrospinal fluid analysis detects cerebral amyloid- beta accumulation earlier than positron emission tomography. Brain 139: (Pt 4), 1226–1236. |
[49] | Clifford RJJ , Knopman DS , Jagust WJ , Petersen RC , Weiner MW , Aisen PS , Shaw LM , Vemuri P , Wiste HJ , Weigand SD , Lesnick TG , Pankratz VS , Donohue MC , Trojanowski JQ ((2013) ) Update on hypothetical model of Alzheimer’s disease biomarkers. Lancet Neurol 12: , 207–216. |
[50] | Donohue MC , Sperling RA , Petersen R , Sun C-K , Weiner MW , Aisen PS ((2017) ) Association between elevated brain amyloid and subsequent cognitive decline among cognitively normal persons. JAMA 317: , 2305–2316. |
[51] | Black CM , Fillit H , Xie L , Hu X , Kariburyo MF , Ambegaonkar BM , Baser O , Yuce H , Khandker RK ((2018) ) Economic burden, mortality, and institutionalization in patients newly diagnosed with Alzheimer’s disease. J Alzheimers Dis 61: , 185–193. |
[52] | Lin P-J , Cangelosi MJ , Lee DW , Neumann PJ ((2013) ) Willingness to pay for diagnostic technologies: A review of the contingent valuation literature. Value Heal 16: , 797–805. |
[53] | Jack Jr CR , Knopman DS , Chetelat G , Dickson D , Fagan AM , Frisoni GB , Jagust W , Mormino EC , Petersen RC , Sperling RA , van der Flier WM , Villemagne VL , Visser PJ , Vos SJB ((2016) ) Suspected non-Alzheimer disease pathophysiology - concept and controversy. Nat Rev Neurol 12: , 117–124. |
[54] | Chetelat G , Ossenkoppele R , Villemagne VL , Perrotin A , Landeau B , Méezenge F , Jagust WJ , Dore V , Miller BL , Egret S , Seeley WW , Van Der Flier WM , La Joie R , Ames D , Van Berckel BNM , Scheltens P , Barkhof F , Rowe CC , Masters CL , De La Sayette V , Bouwman F , Rabinovici GD ((2016) ) Atrophy, hypometabolism and clinical trajectories in patients with amyloid-negative Alzheimer’s disease. Brain 139: , 2528–2539. |
[55] | Getsios D , Blume S , Ishak KJ , Maclaine G , Hernández L ((2012) ) An economic evaluation of early assessment for Alzheimer’s disease in the United Kingdom. Alzheimers Dement 8: , 22–30. |
[56] | Geldmacher DS , Kirson NY , Birnbaum HG , Eapen S , Kantor E , Cummings AK , Joish VN ((2014) ) Implications of early treatment among Medicaid patients with Alzheimer’s disease. Alzheimers Dement 10: , 214–224. |
[57] | Dubois B , Padovani A , Scheltens P , Rossi A , Agnello GD ((2016) ) Timely diagnosis for Alzheimer’s disease: A literature review on benefits and challenges. J Alzheimers Dis 49: , 617–631. |
[58] | Rowe CC , Bourgeat P , Ellis KA , Brown B , Lim YY , Mulligan R , Jones G , Maruff P , Woodward M , Price R , Robins P , Tochon-Danguy H , O’Keefe G , Pike KE , Yates P , Szoeke C , Salvado O , Macaulay SL , O’Meara T , Head R , Cobiac L , Savage G , Martins R , Masters CL , Ames D , Villemagne VL ((2013) ) Predicting Alzheimer disease with beta-amyloid imaging: Results from the Australian imaging, biomarkers, and lifestyle study of ageing. Ann Neurol 74: , 905–913. |
[59] | Hatashita S , Yamasaki H ((2013) ) Diagnosed mild cognitive impairment due to Alzheimer’s disease with PET biomarkers of beta amyloid and neuronal dysfunction. PLoS One 8: , e66877. |
[60] | Ivanoiu A , Dricot L , Gilis N , Grandin C , Lhommel R , Quenon L , Hanseeuw B ((2015) ) Classification of non-demented patients attending a memory clinic using the new diagnostic criteria for Alzheimer’s disease with disease-related biomarkers. J Alzheimers Dis 43: , 835–847. |
[61] | Blennow K , Dubois B , Fagan AM , Lewczuk P , De Leon MJ , Hampel H ((2015) ) Clinical utility of cerebrospinal fluid biomarkers in the diagnosis of early Alzheimer’s disease. Alzheimers Dement 11: , 58–69. |
[62] | Lee SAW , Sposato LA , Hachinski V , Cipriano LE ((2016) ) Cost-effectiveness of cerebrospinal biomarkers for the diagnosis of Alzheimer’s disease. Alzheimers Res Ther 9: , 18. |
[63] | Moulin-Romsee G , Maes A , Silverman D , Mortelmans L , Van Laere K , Laere K Van ((2005) ) Cost-effectiveness of 18F-fluorodeoxyglucose positron emission tomography in the assessment of early dementia from a Belgian and European perspective. Eur J Neurol 12: , 254–263. |
[64] | Silverman D , Torosyan N , Manne M , Durcanova B , Dahlbom M , Apostolova L ((2014) ) Value of amyloid imaging for predicting conversion to dementia in MCI subjects with initially indeterminate FDG-PET scans. Alzheimers Dement 10: , P18–P19. |
[65] | Ishii K ((2014) ) PET approaches for diagnosis of dementia. AJNR Am J Neuroradiol 35: , 2030–2038. |
[66] | Alzheimer’s Disease International ((2011) ) Alzheimer’s Report: The benefits of early diagnosis and intervention. |
[67] | Boccardi M , Altomare D , Guerra UP , Pievani M , Albanese E , Festari C , Antelmi L , Pasqualetti P , Muscio C , Nobili F , Padovani A , Frisoni GB ((2016) ) Appraisal of the utility of the AIT appropriate use criteria of the amyloid-PET: P12010. Eur J Neurol 23: , 256. |
[68] | Apostolova LG , Haider J , Goukasian N , LeClair H , Chételat G , Rabinovici GD , Ringman JM , Kremen S , Restrepo L , Mendez M , Silverman D ((2017) ) Critical appraisal of the appropriate use criteria: Effect on diagnosis and patient care. Alzheimers Dement 11: , P23. |
[69] | Dell’Agnello G ((2015) ) Amyloid PET utility within the AUC. In Associazione Italiana di Medicina Nucleare ed Imaging Molecolare (AIMN). |
[70] | AMYPAD. [cited 2018 February 5]. Available from:, –http://amypad.eu/. |
[71] | Driscoll I , Troncoso JC , Rudow G , Sojkova J , Pletnikova O , Zhou Y , Kraut MA , Ferrucci L , Mathis CA , Klunk WE , O’Brien RJ , Davatzikos C , Wong DF , Resnick SM ((2012) ) Correspondence between in vivo 11C-PiB-PET amyloid imaging and postmortem, region-matched assessment of plaques. Acta Neuropathol 124: , 823–831. |
[72] | Beach TG , Monsell SE , Phillips LE , Kukull W ((2012) ) Accuracy of the clinical diagnosis of Alzheimer disease at National Institute on Aging Alzheimer Disease Centers, 2005-2010. J Neuropathol Exp Neurol 71: , 266–273. |
[73] | Imaging Dementia—Evidence for Amyloid Scanning (IDEAS) Study (IDEAS) - NCT02420756. |
[74] | Ceccaldi M , Jonveaux T , Verger A , Krolak-Salmon P , Houzard C , Godefroy O , Shields T , Perrotin A , Gismondi R , Bullich S , Jovalekic A , Raffa N , Pasquier F , Semah F , Dubois B , Habert M-O , Wallon D , Chastan M , Payoux P , NEUUS in AD study group, Stephens A , Guedj E ((2018) ) Added value of (18)F-florbetaben amyloid PET in the diagnostic workup of most complex patients with dementia in France: A naturalistic study. Alzheimers Dement 14: , 293–305. |
[75] | Wilde A de , Ossenkoppele R , Pelkmans W , Bouwman F , Groot C , Zwan M , Yaqub M , Barkhof F , Lammertsma A , Van Der Flier W , Berckel B van , Scheltens P ((2018) ) Impact of the appropriate use criteria: Effect of amyloid imaging on diagnosis and patient management in an unselected memory clinic cohort: The ABIDE project. 12th Hum Amyloid Imaging Conf Abstr B 1: , 357. |


