
Separating Symptomatic Alzheimer’s Disease from Depression based on Structural MRI
Abstract
Older patients with depression or Alzheimer’s disease (AD) at the stage of early dementia or mild cognitive impairment may present with objective cognitive impairment, although the pathology and thus therapy and prognosis differ substantially. In this study, we assessed the potential of an automated algorithm to categorize a test set of 65 T1-weighted structural magnetic resonance images (MRI). A convenience sample of elderly individuals fulfilling clinical criteria of either AD (n = 28) or moderate and severe depression (n = 37) was recruited from different settings to assess the potential of the pattern recognition method to assist in the differential diagnosis of AD versus depression. We found that our algorithm learned discriminative patterns in the subject’s grey matter distribution reflected by an area under the receiver operator characteristics curve of up to 0.83 (confidence interval ranged from 0.67 to 0.92) and a balanced accuracy of 0.79 for the separation of depression from AD, evaluated by leave-one-out cross validation. The algorithm also identified consistent structural differences in a clinically more relevant scenario where the data used during training were independent from the data used for evaluation and, critically, which included five possible diagnoses (specifically AD, frontotemporal dementia, Lewy body dementia, depression, and healthy aging). While the output was insufficiently accurate to use it directly as a means for classification when multiple classes are possible, the continuous output computed by the machine learning algorithm differed between the two groups that were investigated. The automated analysis thus could complement, but not replace clinical assessments.
INTRODUCTION
In the elderly population, depressive symptoms are frequently associated with cognitive impairment which can also be a manifestation of a neurodegenerative disorder [1]. As clinical symptoms of old age depression are particularly variable and impact cognitive performance, the distinction between depression and mild cognitive impairment or mild dementia due to a neurodegenerative disorder is often challenging [2]. This is illustrated by the term pseudo-dementia [3] which refers to the cognitive impairments related to depression. Reliable figures on the frequency of misdiagnosis are difficult to obtain as depressive symptoms may be an early sign of neurodegeneration [4]. Reports indicate that around 30% of referrals to a memory clinic had symptoms of depression and no evidence of dementia [5]. Those figures could, however, be an overestimation as general practitioners may refer patients who fear early signs of dementia with the aim to exclude that.
Both dementia due to Alzheimer’s disease (AD) and depressive symptoms are frequent in the elderly population. Given the substantial prognostic and therapeutic differences between depression and AD in its early clinical stages (mild cognitive impairment (MCI), and mild dementia due to AD), an accurate diagnostic distinction is necessary. Studies examining the classification accuracy of specific diagnostic tools such as cued recall [6] found that MCI could be separated from depression with a sensitivity of 0.58 and a specificity of 0.85.
Cerebral imaging is part of the recommended workup for suspected dementia. It may aid in the differential diagnosis and provides more objective markers than the assessment of symptoms. Although subjects with late-life depression often show more atrophy compared to healthy aging in a number of brain regions, including the hippocampus [7], the pattern of structural changes is not completely overlapping with that of AD [8]. Two studies reported a negative correlation between hippocampal volume and the duration of depression [9, 10] but more recent large studies and reviews failed to confirm such findings [7, 11].
So far, no study has attempted to separate early symptomatic stages of AD, including MCI, from depression at the level of the individual patient using MRI and automatic image analysis. As current evidence indicates that a combination of distributed regions will be most informative for this separation [8], pattern recognition methods are ideally suited for that purpose [12]. Automated multivariate MRI based volumetry separates dementia due to AD or MCI from healthy aging [13–17], but also, clinically more challenging, separates between different types of dementia [18, 16, 19], or between those with MCI who convert to dementia or remain stable [20–25]. Recently, these methods have also been applied to patients with late-life depression and successfully separated those with future cognitive decline from those remaining stable [26]. Technically, these supervised machine learning methods identify separating patterns of grey matter (GM) changes from training data and apply it to separate testing data.
We set out to assess the ability of an automated pattern recognition algorithm to separate patients with depression from patients with early dementia or MCI based on structural MRI. We investigated two scenarios. In the first scenario, data from the same imaging center served for training and evaluation using a cross-validation scheme, a scheme typical for research studies [12]. In the second, clinically more relevant and more challenging setting, the algorithm was trained with external data which included five diagnostic categories (specifically, patients with AD-dementia, frontotemporal dementia, Lewy body dementia, depression, and healthy elderly). We hypothesized, that automatically generated scores derived from structural MRI could provide similar or better discriminative performance than neuropsychological tests [6] and thus could serve as complementary diagnostic tool.
MATERIAL AND METHODS
Study design
This study was set up as a retrospective study to complement previous work on differential diagnosis with a new research question in which we hypothesized that the employed machine learning algorithm would be able to discriminate between elderly subjects with early dementia and those with old age depression.
Data sets and clinical characterization
For the within center analysis (first scenario in Fig. 1), we identified a convenience clinical sample of 65 individuals from a single site (Department of Geriatric Psychiatry, Mannheim, Germany) with either (1) diagnosis of dementia, which was probably caused by AD (NINCDS-ADRDA Alzheimer’s Criteria after McKhann et al. [27]), or (2) diagnosis of moderate or severe depression (Table 1). A subset of patients of the latter group has already been included in a previous study [28]. Subjects with moderate or severe symptoms of dementia (MMSE<20) were excluded as the identification of progressed dementia is less challenging. Furthermore, we did not include individuals with AD and relevant current depressive symptoms. Depression was excluded over the diagnostic course of dementia through psychiatric examination by an experienced psychiatrist. The 37 cases with depression (but no clinical indication of AD) fulfilled ICD-10 criteria for moderate or severe depression and had an average Hamilton Rating Scale for Depression score [29] of 23.0+/–8.4, reached 32.9+/–7.5 on the Montgomery–Åsberg Depression Rating Scale (MADRS) [30] and were aged 60 or above. The classification of the MADRS into severity categories according to [31] mirrored the ICD-10 classification as all these patients had a moderate (17<MADRS<23) to severe (MADRS≥24) depression. We also report the fraction of relapsing versus first episode depression. Structural T1 weighted MRI of this population were acquired on a Siemens TimTrio with 1.9 seconds repetition time, 2.32 milliseconds echo time, and 9 flip angle at a magnetic field strength of 3 Tesla using a 32 channel head coil. The acquired images had 192×192×160 voxels with 1 mm isotropic voxel size. All included MRI scans were free of major artefacts as judged by visual inspection of the T1 weighted image by a single rater and the according neuro-radiological report did not mention other neurological disorders except white matter hyperintensities [28]. The set also served as test set in the second scenario as detailed below.
Fig.1
Use of the three data sets to estimate hyperparameters for the regression model (A), producing binary cross-validation predictions (B), and multi-class predictions based on a model that was independent from the test data (C). Each leave-one-out cross-validation fold and the training of the multi-class SVM involved a grid search with a series of inner cross-validation loops to find the optimal SVM parameter C (see the Methods for more details).
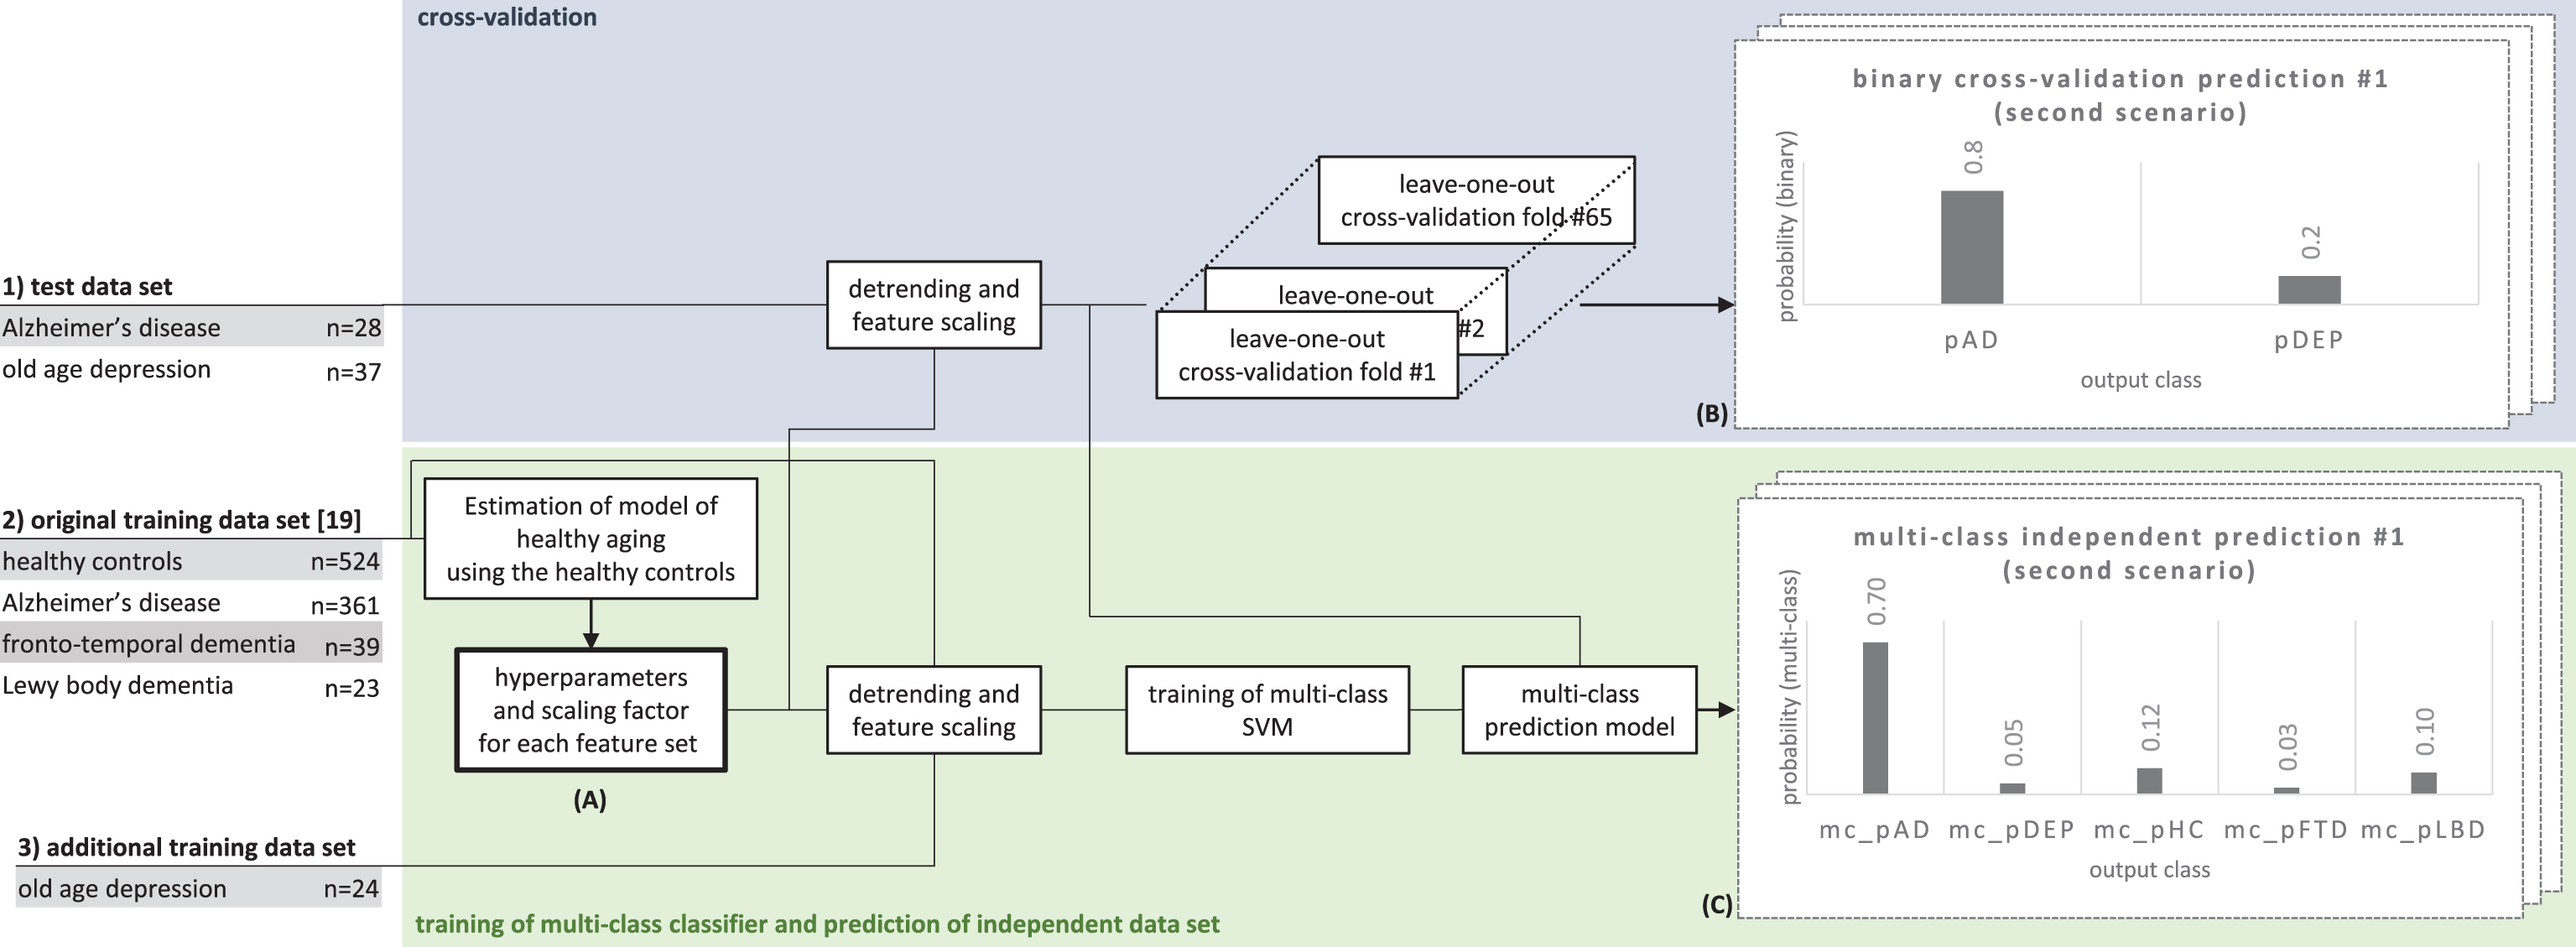
Table 1
Demographics and basic clinical information on training and test data set including healthy controls (HC), patients with mild cognitive impairment or dementia due to Alzheimer’s disease (AD), patients with depression (DEP), frontotemporal dementia (FTD), or Lewy body dementia (LBD)
| Diagnostic group | Group size (female) | Mean age [y]±1 SD | Mean MMSE±1 SD | Relapsing depression | |
| TEST | AD | 28 (16) | 69.3±10.4 | 24.3±2.5 | n.a. |
| DEP | 37 (21) | 72.3±6.3 | 27.3±3.4 (n = 26) | 18 | |
| TRAIN | AD | 360 (178) | 75.2±7.8 | 23.1±2.0 | n.a. |
| DEP | 24 (16) | 70.4±5.0 | n.a. | 15 | |
| FTD | 39 (19) | 58.6±6.4 | 24.5±3.8 | n.a. | |
| LBD | 23 (7) | 73.4±4.6 | 22.7±3.5 | n.a. | |
| HC | 586 (299) | 74.7±5.8 | 29.0±1.2 | n.a. |
Note. The mini-mental state examination score (MMSE) from patients with depression was available only from 26 subjects of the test set. Healthy controls were used to correct for confounding effects of sex, age, and total intracranial volume.
For the prediction based on independent training data (second scenario in Fig. 1), we employed an independent training set. The data set included elderly healthy controls as well as patients with dementia, including AD-dementia, Lewy body dementia and frontotemporal dementia. All cases, expect those with depression have been reported previously [19]. In brief, data consisted of a combination of data sets from public and non-public sources acquired in a large number of sites with various scanner types and different T1 weighted protocol variants. There were substantial differences in the number of cases per class (nHC = 586, nAD = 360, nFTD = 39, nLBD = 23, nDEP = 24) and in the age distribution per diagnostic group and site. A portion of the publicly available training data was from the ADNI-study (http://www.adni-info.org) and from the AIBL study (http://www.aibl.org). The ADNI was launched in 2003 by the National Institute on Aging (NIA), the National Institute of Biomedical Imaging and Bioengineering (NIBIB), the Food and Drug Administration (FDA), private pharmaceutical companies and non-profit organizations, as a $60 million, 5-year public- private partnership. The public database provides extended longitudinal data including neuropsychological tests, genetic data, imaging, and cerebrospinal fluid data. We included the same data set as previously used for training [19] that had four diagnostic classes and added a class of patients with depression to complete the training data set. Of note, since we excluded patients with MMSE lower than 20 only in the test set inclusion criteria differed between training and test set.
Patients with depression contributing to the training set were recruited from regular clinical routine at a single centre (Freiburg, Germany) and totalled 24 cases, treated in the psychiatric hospital with a diagnosis of either first episode or relapsing depression according to ICD-10 criteria for moderate or severe depressive episode. Additional inclusion criteria were an age above 50 years and a cerebral MRI scan without contrast agent and without major artefacts less than a year apart from the hospitalisation. Subjects with a cerebral disorder (such as stroke, long-term alcohol abuse or Parkinson’s disease) were excluded. MR-sequences that would allow to reliably quantify subtle white matter hyperintensities were not always available. Subjects were therefore included unless clinical reports indicated symptoms typically associated with white matter pathology (cognitive slowing, focal neurological signs). The structural MRI data were acquired on a Siemens TrioTim with 1.44 seconds repetition time, 2.15 ms echo time, and 15 flip angle at a magnetic field strength of 3 Tesla using a 32 channel head coil. The acquired MRI images had 256×256×160 voxels and 1 mm isotropic voxel sizes.
The study was carried out in accordance with the latest update of the Declaration of Helsinki and approved by the local ethics committees (primary site: University of Freiburg, Ethics ID 89/15).
MRI processing
The MRI pre-processing was the same as that in our previous study [19] and is depicted in Fig. 2. The main steps include estimation of GM probability maps and transformation into common template space, warp and modulation of GM probability maps, extraction of four feature sets and correction of effects of age, sex, and intracranial volume. T1 weighted images were segmented using VBM8 (http://www.neuro.uni-jena.de/vbm/download/), a toolbox for SPM8 (http://www.fil.ion.ucl.ac.uk/spm/software/spm8/) implemented in Matlab R2015a (http://www.mathworks.com). The resulting GM probability maps were non-linearly transformed into a common space using DARTEL [32] and corrected for local volume changes due to the spatial transformation. After these procedures, the value in each voxel represents local GM tissue volume. Classification was based on the combination of four sets of features. Two feature sets consisted of local GM volumes across the whole brain GM at each voxel either sampled without spatial smoothing at 1.5 mm isotropic voxel spacing defined by the common template space or after smoothing with an isotropic Gaussian filter with 8 mm full width at half maximum sampled at 2 mm resolution of the LONI probabilistic brain atlas (LPBA) [33]. Two feature sets were constrained to regions of interest. One consisted of the 56 weighted averages over anatomical regions, whereby for each region each voxel was weighted by the probability for the respective region in the LPBA. The second regional feature set consisted of the average local GM values of voxels within seven spherical ROIs with a diameter of one centimetre. The coordinates of the centre of the spheres of these ROIs were taken from a meta-analysis that identified regions with consistent differences in GM between healthy controls and patients with late life depression [8]. Prior classification, we corrected the data for effects of age, sex, and total intracranial volume using Gaussian process regression with a non-linear covariance function with age, sex, and total intracranial volume as covariance factors. We followed the approach of [34], whereby Gaussian process regression was employed to estimate the effects of the covariates using a covariance function that can account for linear as well as non-linear effects. The variance-bias trade-off was balanced by maximizing the log marginal likelihood with respect to a set of hyperparameters of the covariance function. Only the group of healthy controls was used to estimate the regression parameters, as we aimed to estimate the effects of healthy aging only.
Fig.2
Data pre-processing for extraction of the raw features for each individual T1 weighted image. The pipeline extracts four different features sets from the native T1 image, including smoothed and unsmoothed voxel-wise local grey matter (GM) volumes, average GM volumes of seven ROIs identified in an independent meta-analysis [8], as well as weighted averages of local GM volumes weighted by the LONI probabilistic brain atlas (LPBA) [47]. The estimation of local grey matter was computed using the VBM8 toolbox (http://www.neuro.uni-jena.de/vbm/) with default parameters and modulation by the Jacobian determinant of the local non-linear deformation field. The number of features per feature set varies between 7 (spherical ROI features) and 254255 (unsmoothed voxel features).
![Data pre-processing for extraction of the raw features for each individual T1 weighted image. The pipeline extracts four different features sets from the native T1 image, including smoothed and unsmoothed voxel-wise local grey matter (GM) volumes, average GM volumes of seven ROIs identified in an independent meta-analysis [8], as well as weighted averages of local GM volumes weighted by the LONI probabilistic brain atlas (LPBA) [47]. The estimation of local grey matter was computed using the VBM8 toolbox (http://www.neuro.uni-jena.de/vbm/) with default parameters and modulation by the Jacobian determinant of the local non-linear deformation field. The number of features per feature set varies between 7 (spherical ROI features) and 254255 (unsmoothed voxel features).](https://content.iospress.com:443/media/jad/2018/63-1/jad-63-1-jad170964/jad-63-jad170964-g002.jpg)
SVM-based classification
GM image data that was corrected for age, sex, and total intracranial volume were classified using an SVM classifier [35]. Briefly, an SVM is a machine learning method that learns a function to separate two classes based on training examples. In practice, SVMs perform well on high dimensional data and are computationally very efficient, even with hundreds of thousands of dimensions that are typical for MRI data, where every voxel of a processed image is one feature. Extensions of the classical formulation of SVM classifiers include probabilistic outputs and multiple classes [36–38]. As in our previous work [19], we employed a soft margin SVM with a linear kernel using freely available software (https://www.csie.ntu.edu.tw/ cjlin/libsvm; version 3.22). The kernel function was the weighted sum of the dot product of the whole-brain feature set and the dot product of the voxels within the ROIs. To balance the importance of both feature sets we normalized the kernel matrices such that the mean of the diagonals were equal to one before summing them up. We also tuned the SVM cost hyperparameter C using a nested cross-validation (10 folds in the inner partitions) by selecting in each outer fold the cost C among the candidates C = {exp(–4), exp(–3.9), exp(–3.8),..., exp(2)} which had highest accuracy.
For the single center data analysis, we aimed to categorize individuals into one of two groups using a leave-one-out cross-validation scheme. We quantified the diagnostic accuracy by assessing the receiver operating characteristics (ROC) curves and respective area under the curve (AUC) using the scaled, probabilistic output of the SVM [36] which ranges from zero to one and sums up to one across the two classes. We denote the continuous probabilistic outputs of the binary classifier trained with data from patients with AD or patients with depression as cv_pDEP and cv_pAD. Note, that cv_pAD = 1-cv_DEP, as the two values sum up to one. The class AD was defined as the positive class. We also provide the balanced accuracy obtained with a threshold of cv_pAD = 0.5 as a measure of classification performance in the case that the algorithm is forced to make a decision.
For the second scenario, we trained an SVM classifier with five possible diagnoses (specifically, AD-dementia, fronto-temporal dementia, Lewy body dementia, depression, and healthy aging) and thereby extended our previously published classifier [19] as it now also included a group of subjects with depression. Since the test data were acquired at a different site, there was a strict separation of data used for training and data used for evaluating the performance, thus mimicking a prospective study. Of note, when classifying multiple classes, the SVM multi-class algorithm first learns multiple binary classifiers [39] and then aggregates the results and scales them between zero and one to produce one probabilistic output per class for each subject [38]. The five predicted class probabilities for each subject sum up to one.
We provide code necessary to replicate the pre-processing, feature extraction, correction for covariates, and classification at http://github.com/abdulka/mri-classification.
Evaluation of performance
We computed the ROCs based on the (pseudo-)probabilistic classifier outputs.. In the first scenario, we used the cross-validated posterior predictions. For the discrimination performance of AD versus depression of the multi-class classifier, we report the ROCs based on the multi-class probability of AD (mc_pAD), depression (mc_pDEP), and healthy aging (mc_pHC). We also illustrate the class-wise distribution of the three aforementioned probabilities with boxplots including all individual data points. For consistency, the class AD was defined as positive class and in case of the output for healthy controls and depression, we used 1-mc_pHC and 1-mc_pDEP to compute the ROC curves and plot associated characteristics such as sensitivity and 1-specificity. The classification performance at a pre-defined cut-off is reported as sensitivity and specificity at the default threshold of 0.5. We report the area under the ROC curve as a quantitative measure of how well the classifier can discriminate between two classes without enforcing a pre-defined cut-off. To obtain pointwise confidence bounds we created 1000 bootstrap replicas at each threshold. If the 5% confidence bound of the area under the ROC curve was above 0.5, we reject the hypothesis that the result was obtained by chance alone. In addition to the ROC analysis, we report confusion matrices when the class label was determined by the class that obtained the highest posterior probability.
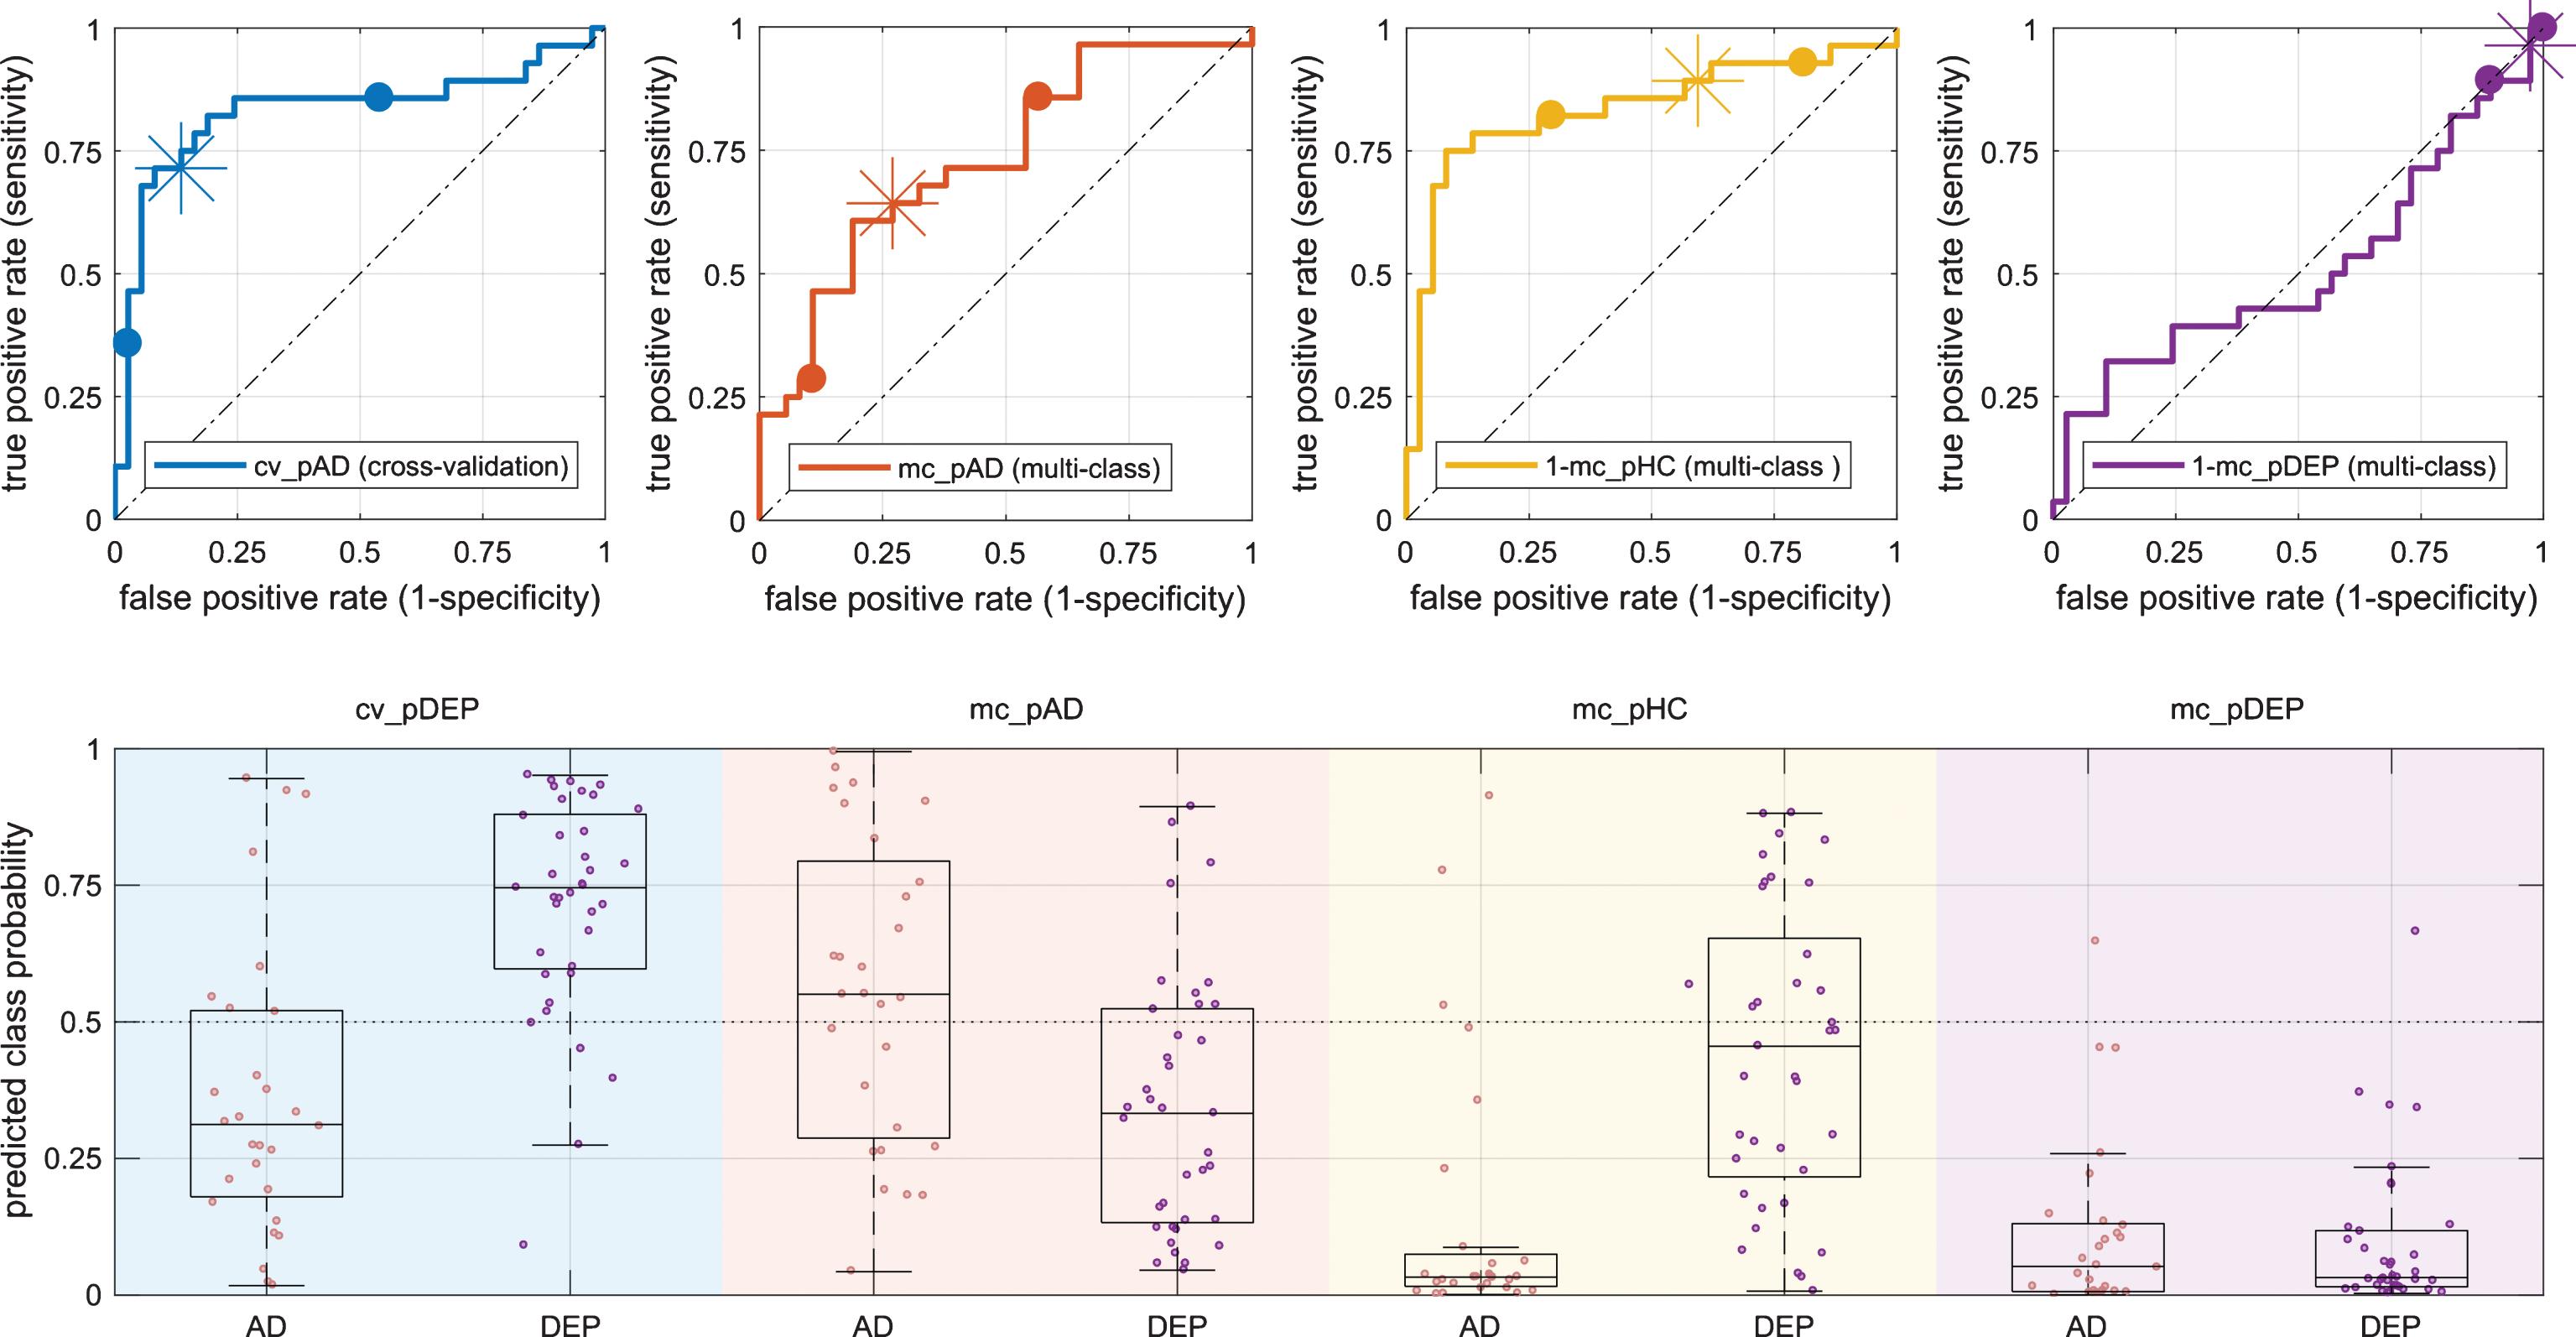
Fig.3
Class-probabilities for individuals and corresponding box plots (bottom row) grouped by diagnosis (AD/DEP) and prediction output (background color) with according receiver operator characteristics plots (top row). The bottom panel shows the class probabilities estimated by the cross validation (light blue, cv_pAD) and three class probabilities estimated by the multi-class classification, specifically, probability for AD (mc_pAD, orange), probability for HC (mc_pHC, yellow), and probability for depression (mc_pDEP, violet). The graphs in the top row use the same color-codes as the background in the bottom row and plot true versus false positive rate and highlight the positions at different probability thresholds (0.25/0.75 as dots and 0.5 as asterisk). AD, Alzheimer’s disease; DEP, depression.
RESULTS
We quantified the classification performance by area under the ROC curve, sensitivity (true positive rate), specificity (1-false positive rate), and balanced accuracy. We report the numbers on Table 2 and illustrate the results in Fig. 3. In the within site cross-validation analysis, the area under the curve was 0.83 and the estimated lower confidence bound was 0.67 and the upper confidence bound was 0.92. The balanced accuracy of the scenario evaluated by cross-validation was 0.79. The area under the curve based on the mc_pHC – the probability of class HC obtained from the the multi-class classifier – was similarly high. In contrast, the balanced accuracy of the cross-validation was at least 0.12 percent points higher than that obtained with any of the multi-class outputs. Area under the curve and balanced accuracy based on mc_pDEP – the probability of class DEP obtained from the multi-class classifier – was at chance level and almost all values were below 0.5. Additionally, the area under the curve of the conditional probability of AD given that only AD or DEP were possible (computed as mc_pAD/(mc_pAD+mc_pDEP) was substantially worse than the area under the curve of mc_pAD – the probability of class AD obtained from the multi-class classifier. The distributions of estimated class-conditional posterior probabilities of AD and HC cases are relatively similar in the cross-validation experiment compared to the multi-class estimations (Fig. 3). In the cross-validation predictions, the median of AD cases is 0.31 and the median of DEP cases is 0.75 and inter-quartile distances are 0.35 and 0.28 for the cases AD and DEP, respectively. The median of the multi-class posterior probabilities of the AD cases was lowest for mc_pHC (median: 0.02, interquartile distance 0.08) and highest for mc_pAD (median: 0.56, interquartile distance: 0.45). The multi-class posterior probability estimates for HC cases were lowest for mc_pDEP (median: 0.03, interquartile distance 0.10) and highest for mc_pHC (median: 0.46, interquartile distance: 0.44). Table 3. shows the confusion matrix of the classification result. Sixty-four percent of the AD patients were classified as such by the machine. Only five percent of patients with depression were correctly classified. Fifty-four percent of patients with depression were classified as healthy controls.
Table 2
Performance was evaluated in groups of patients with mild cognitive impairment dementia due to Alzheimer’s disease (AD) and patients with depression (DEP)
| Classification | Output | AUC [CI] | SE | SP | BAC |
| AD > DEP | cv_pAD | 0.83 [0.67 0.92] | 0.89 | 0.71 | 0.79 |
| AD > DEP | mc_pAD | 0.74 [0.58 0.84] | 0.70 | 0.61 | 0.67 |
| AD > DEP | 1-mc_pHC | 0.84 [0.69 0.93] | 0.43 | 0.86 | 0.63 |
| AD > DEP | 1-mc_pDEP | 0.51 [0.36 0.66] | 0.03 | 0.93 | 0.50 |
Evaluation of the classification performance of the test set obtained either by cross-validation (cv_pAD) or with multiple outputs of an independent multi-class classifier, specifically, multiclass probability for AD (mc_pAD), healthy (mc_pHC), and depression (mc_pDEP). The reported performance is based on the receiver operation characteristic curves (Fig. 3, top row). We report sensitivity and specificity at the 0.5 probability threshold of the classifier output. AD is defined as the positive class. AUC, area under the curve; 95% CI, confidence interval; SE, sensitivity or true positive rate; SP, specificity or 1-false positive rate; BAC, balanced accuracy.
Table 3
Confusion matrix of reference test and multi-class classifier decision
| Index test (multi-class prediction based on structural MRI) | |||||||
| AD | DEP | HC | FTD | LBD | Σ | ||
| Reference test | AD | 18 | 3 | 5 | 2 | 0 | 28 |
| (clinical | DEP | 13 | 2 | 20 | 2 | 0 | 37 |
| examination) | Σ | 31 | 5 | 25 | 4 | 0 | 65 |
DISCUSSION
We complemented our previous study on employing automated diagnosis in clinically relevant and challenging scenarios [19] by adding old age depression as additional class, using training data from clinical practice, while keeping the data set and principle methodology as previously [19] in order to minimize the risk of a false positive finding given the small sample size. Since the differentiation between early AD and old age depression is challenging and the diagnoses of the test data were not validated with follow-up analyses or nuclear medicine, the reference test that defined the class labels was not certain.
The ROC curves and AUC of the cross-validation results indicate that the multivariate classification algorithm found structural features in the GM maps that differentiate patients with early dementia due to AD and patients with depression. Furthermore, the balanced accuracy was 0.79. As for other similar studies, the results reported in this study are associated with rather large confidence intervals due to the small sample size. A meta-study that collectively reported the classification accuracies of more than 200 studies that were conducted between 1994 and 2015 of various methods, modalities and disorders, including major depression disorder and AD revealed a large range variability in the reported accuracy [40]. Specifically, for the classification of major depression disorder versus healthy controls, the accuracies ranged from 60 to almost 100 percent. Although structural changes related to depression in the elderly have been reported [8], these changes are likely far more subtle compared to those inflicted by a neurodegenerative disorder. The classification performance, when evaluated on a model trained for multi-class differential classification of three types of dementia, depression, and healthy aging, varied substantially dependent on the output of the classifier. Almost all cases with AD appeared as clearly not healthy (Fig. 3, third column, mc_pHC). Specifically, the median of the AD cases was 0.02. The estimated probabilities for healthy controls (mc_PHC) of the DEP cases were spread widely and the median was below 0.5. Both, cases with AD and cases with Depression, had a low median (<0.1) and small interquartile distance of mc_pDEP which was also reflected by an area under the curve close to 0.5. Thus, while the group of AD cases appeared distinctively in terms of mc_HC, the group of DEP cases did not. Further supporting the hypothesis that the DEP group did not show consistent differences with the group of HC. A high number of algorithms for classification of disease states based on brain MRI exist and employ a wide range of pre-processing and classification algorithms. See [41] for an overview of classification methods in dementia from a pattern classification perspective, [42, 14] for examples of works that compared algorithms directly in the context of dementia, and [40] for a meta-study of reported performances across a wide range of data sets, MRI modalities, disorders, and classification methods. Some of those methods or modifications to our method such as unequal class-weights and optimization of the SVM cost C within each one-versus-one classification may achieve better performance. Testing across a range of algorithms could however lead to too optimistic results unless appropriate validation strategies are in place. We thus refrained from those modifications to maintain a methodological consistency with our previous work [19], as we used it in combination with a data set that also was used for this study. For the evaluation based on outputs of the multi-class classifier, specifically mc_pAD and mc_pHC, the lower confidence bound remained above 0.5, which means that the obtained performance was unlikely due to chance alone. The added group of 24 patients with dementia did not produce a useful output for the differentiation between dementia and depression. In a direct comparison of three-way classification methods for AD, MCI, and healthy controls [42], our method, that was very similar to that used in this study, performed among the best in terms of AUC but was only average in terms of accuracy. That means that the method in or previous work found a good discriminative function but did not use a suitable function to discretize the scores into the three categories. Given this result, we expected that the classifier favors larger training classes. However, the extent of this effect is noteworthy. Our algorithm categorized most patients with depression as healthy controls. A relatively high heterogeneity in the depressed group could further contribute to the decrease in performance from the first to the second scenario. Specifically, as we do not have clinical follow-up of cases with depression and for some, depressive symptoms may be an early sign of AD which already alters brain structure [4]. Since the data on which the classification performance were evaluated were the same in both scenarios, the results obtained in the cross-validation setting and in the independent training setting were not independent and potential biases in the data sets could affect both results. The selected samples for training and evaluation were a retrospective convenience samples and not sufficient to make reliable estimation of the diagnostic accuracy in the general population but rather focused on the differential diagnosis of early AD and old age depression. Taken together, these findings argue against the direct use of the probabilities for diagnostic decisions, but indicate measurable differences between the population of old age depression and dementia that may aid individual diagnosis.
The focus of the study was on differentiating early AD from depression based on structural MRI. To better understand and optimize the classification system it would be useful to include an independent data set of healthy controls and possibly other types of dementias in order to clarify if the multi-class classifier confuses subjects with depression with controls or indeed can identify multivariate structural differences between elderly healthy controls and elderly subjects with major depression.
Compared to a separation based on the performance in a cued recall task [6], our results perform in the same range but require an MRI scan. Since imaging is part of the recommended clinical workup of cognitive decline [43–46], has no known adverse effects if the safety rules are respected, and as our methods rely on routine MPRAGE sequences that become increasingly available, the application of machine learning in the routine is becoming feasible. Larger training sets tend to produce more accurate results [47] but the addition of the relatively small group of patients with depression was not sufficient to correctly classify the test data set in the realistic multi-class prediction scenario that was investigated in this study.
ACKNOWLEDGMENTS
AA acknowledges funding by the grant KF3223201LW3 of the ZIM (Zentrales Innovationsprogramm Mittelstand) and grant 173880 of the Swiss National Science Foundation awarded to SK. The funding sources did neither have an influence on the interpretation of the results nor on the writing of the manuscript. Data collection and sharing for this project was funded by the Alzheimer’s Disease Neuroimaging Initiative (ADNI) (National Institutes of Health Grant U01 AG024904) and DOD ADNI (Department of Defense award number W81XWH-12-2-0012).
ADNI is funded by the National Institute on Aging, the National Institute of Biomedical Imaging and Bioengineering, and through generous contributions from the following: Alzheimer’s Association; Alzheimer’s Drug Discovery Foundation; Araclon Biotech; BioClinica, Inc.; Biogen Idec Inc.; Bristol-Myers Squibb Company; Eisai Inc.; Elan Pharmaceuticals, Inc.; Eli Lilly and Company; EuroImmun; F. Hoffmann-La Roche Ltd and its affiliated company Genentech, Inc.; Fujirebio; GE Healthcare; IXICO Ltd.; Janssen Alzheimer Immunotherapy Research & Development, LLC.; Johnson & Johnson Pharmaceutical Research & Development LLC.; Medpace, Inc.; Merck & Co., Inc.; Meso Scale Diagnostics, LLC.; NeuroRx Research; Neurotrack Technologies; Novartis Pharmaceuticals Corporation; Pfizer Inc.; Piramal Imaging; Servier; Synarc Inc.; and Takeda Pharmaceutical Company. The Canadian Institutes of Health Research is providing funds to support ADNI clinical sites in Canada. Private sector contributions are facilitated by the Foundation for the National Institutes of Health (http://www.fnih.org). The grantee organization is the Northern California Institute for Research and Education, and the study is coordinated by the Alzheimer’s Disease Cooperative Study at the University of California, San Diego. ADNI data are disseminated by the Laboratory for Neuro Imaging at the University of Southern California.
Authors’ disclosures available online (https://www.j-alz.com/manuscript-disclosures/17-0964r2).
REFERENCES
[1] | Leyhe T , Reynolds CF , Melcher T , Linnemann C , Klöppel S , Blennow K , Zetterberg H , Dubois B , Lista S , Hampel H ((2017) ) A common challenge in older adults: Classification, overlap, and therapy of depression and dementia. Alzheimers Dement 13: , 59–71. |
[2] | Steffens DC ((2008) ) Separating mood disturbance from mild cognitive impairment in geriatric depression. Int Rev Psychiatry 20: , 374–381. |
[3] | Kiloh LG ((1961) ) Pseudo-dementia. Acta Psychiatr Scand 37: , 336–351. |
[4] | Zahodne LB , Stern Y , Manly JJ ((2014) ) Depressive symptoms precede memory decline, but not vice versa, in non-demented older adults. J Am Geriatr Soc 62: , 130–134. |
[5] | Fisher CAH , Larner AJ ((2007) ) Frequency and diagnostic utility of cognitive test instrument use by GPs prior to memory clinic referral. Fam Pract 24: , 495–497. |
[6] | Dierckx E , Engelborghs S , Raedt de R , Deyn de PP , Ponjaert-Kristoffersen I ((2007) ) Differentiation between mild cognitive impairment, Alzheimer’s disease and depression by means of cued recall. Psychol Med 37: , 747–755. |
[7] | Sexton CE , Mackay CE , Ebmeier KP ((2013) ) A systematic review and meta-analysis of magnetic resonance imaging studies in late-life depression. Am J Geriatr Psychiatry 21: , 184–195. |
[8] | Boccia M , Acierno M , Piccardi L ((2015) ) Neuroanatomy of Alzheimer’s disease and late-life depression: A coordinate-based meta-analysis of MRI studies. J Alzheimers Dis 46: , 963–970. |
[9] | Bell-McGinty S , Butters MA , Meltzer CC , Greer PJ , Reynolds CF , Becker JT ((2002) ) Brain morphometric abnormalities in geriatric depression: Long-term neurobiological effects of illness duration. Am J Psychiatry 159: , 1424–1427. |
[10] | Sheline YI , Wang PW , Gado MH , Csernansky JG , Vannier MW ((1996) ) Hippocampal atrophy in recurrent major depression. Proc Natl Acad Sci U S A 93: , 3908–3913. |
[11] | Schmaal L , Veltman DJ , van Erp TGM , Sämann PG , Frodl T , Jahanshad N , Loehrer E , Tiemeier H , Hofman A , Niessen WJ , Vernooij MW , Ikram MA , Wittfeld K , Grabe HJ , Block A , Hegenscheid K , Völzke H , Hoehn D , Czisch M , Lagopoulos J , Hatton SN , Hickie IB , Goya-Maldonado R , Krämer B , Gruber O , Couvy-Duchesne B , Rentería ME , Strike LT , Mills NT , de Zubicaray GI , McMahon KL , Medland SE , Martin NG , Gillespie NA , Wright MJ , Hall GB , MacQueen GM , Frey EM , Carballedo A , van Velzen LS , van Tol MJ , van der Wee NJ , Veer IM , Walter H , Schnell K , Schramm E , Normann C , Schoepf D , Konrad C , Zurowski B , Nickson T , McIntosh AM , Papmeyer M , Whalley HC , Sussmann JE , Godlewska BR , Cowen PJ , Fischer FH , Rose M , Penninx BWJH , Thompson PM , Hibar DP ((2016) ) Subcortical brain alterations in major depressive disorder: Findings from the ENIGMA Major Depressive Disorder working group. Mol Psychiatry 21: , 806–812. |
[12] | Klöppel S , Abdulkadir A , Jack CR , Koutsouleris N , Mourão-Miranda J , Vemuri P ((2012) ) Diagnostic neuroimaging across diseases. Neuroimage 61: , 457–463. |
[13] | Adaszewski S , Dukart J , Kherif F , Frackowiak R , Draganski B ((2013) ) How early can we predict Alzheimer’s disease using computational anatomy?. Neurobiol Aging 34: , 2815–2826. |
[14] | Cuingnet R , Gerardin E , Tessieras J , Auzias G , Lehéricy S , Habert M-O , Chupin M , Benali H , Colliot O ((2011) ) Automatic classification of patients with Alzheimer’s disease from structural MRI: A comparison of ten methods using the ADNI database. Neuroimage 56: , 766–781. |
[15] | Dukart J , Kherif F , Mueller K , Adaszewski S , Schroeter ML , Frackowiak RSJ , Draganski B ((2013) ) Generative FDG-PET and MRI model of aging and disease progression in Alzheimer’s disease. PLoS Comput Biol 9: , e1002987. |
[16] | Klöppel S , Stonnington CM , Chu C , Draganski B , Scahill RI , Rohrer JD , Fox NC , Jack CR , Ashburner J , Frackowiak RSJ ((2008) ) Automatic classification of MR scans in Alzheimer’s disease. Brain 131: , 681–689. |
[17] | Vemuri P , Whitwell JL , Kantarci K , Josephs KA , Parisi JE , Shiung MS , Knopman DS , Boeve BF , Petersen RC , Dickson DW , Jack CR ((2008) ) Antemortem MRI based STructural Abnormality iNDex (STAND)-scores correlate with postmortem Braak neurofibrillary tangle stage. Neuroimage 42: , 559–567. |
[18] | Davatzikos C , Resnick SM , Wu X , Parmpi P , Clark CM ((2008) ) Individual patient diagnosis of AD and FTD via high-dimensional pattern classification of MRI. Neuroimage 41: , 1220–1227. |
[19] | Klöppel S , Peter J , Ludl A , Pilatus A , Maier S , Mader I , Heimbach B , Frings L , Egger K , Dukart J , Schroeter ML , Perneczky R , Häussermann P , Vach W , Urbach H , Teipel S , Hüll M , Abdulkadir A ((2015) ) Applying automated MR-based diagnostic methods to the memory clinic: A prospective study. J Alzheimers Dis 47: , 939–954. |
[20] | Davatzikos C , Bhatt P , Shaw LM , Batmanghelich KN , Trojanowski JQ ((2011) ) Prediction of MCI to AD conversion, via MRI, CSF biomarkers, and pattern classification. Neurobiol Aging 32: , 2322.e19–27. |
[21] | Fan Y , Batmanghelich N , Clark CM , Davatzikos C ((2008) ) Spatial patterns of brain atrophy in MCI patients, identified via high-dimensional pattern classification, predict subsequent cognitive decline. Neuroimage 39: , 1731–1743. |
[22] | Heister D , Brewer JB , Magda S , Blennow K , McEvoy LK ((2011) ) Predicting MCI outcome with clinically available MRI and CSF biomarkers. Neurology 77: , 1619–1628. |
[23] | Misra C , Fan Y , Davatzikos C ((2009) ) Baseline and longitudinal patterns of brain atrophy in MCI patients, and their use in prediction of short-term conversion to AD: Results from ADNI. Neuroimage 44: , 1415–1422. |
[24] | Teipel SJ , Born C , Ewers M , Bokde ALW , Reiser MF , Möller H-J , Hampel H ((2007) ) Multivariate deformation-based analysis of brain atrophy to predict Alzheimer’s disease in mild cognitive impairment. Neuroimage 38: , 13–24. |
[25] | Vemuri P , Wiste HJ , Weigand SD , Shaw LM , Trojanowski JQ , Weiner MW , Knopman DS , Petersen RC , Jack CR , Alzheimer’s Disease Neuroimaging Initiative ((2009) ) MRI and CSF biomarkers in normal, MCI, and AD subjects Predicting future clinical change. Neurology 73: , 294–301. |
[26] | Lebedeva AK , Westman E , Borza T , Beyer MK , Engedal K , Aarsland D , Selbaek G , Haberg AK ((2017) ) MRI-based classification models in prediction of mild cognitive impairment and dementia in late-life depression. Front Aging Neurosci 9: , 13. |
[27] | McKhann G , Drachman D , Folstein M , Katzman R , Price D , Stadlan EM ((1984) ) Clinical diagnosis of Alzheimer’s disease: Report of the NINCDS-ADRDA Work Group under the auspices of Department of Health and Human Services Task Force on Alzheimer’s Disease. Neurology 34: , 939–944. |
[28] | Schwichtenberg J , Al-Zghloul M , Kerl HU , Wenz H , Hausner L , Frölich L , Groden C , Förster A ((2017) ) Late-onset major depression is associated with age-related white matter lesions in the brainstem. Int J Geriatr Psychiatry 32: , 446–454. |
[29] | Hamilton M ((1960) ) A rating scale for depression. J Neurol Neurosurg Psychiatr 23: , 56–62. |
[30] | Williams JBW , Kobak KA ((2008) ) Development and reliability of a structured interview guide for the Montgomery Asberg Depression Rating Scale (SIGMA). Br J Psychiatry 192: , 52–58. |
[31] | Zimmerman M , Martinez JH , Young D , Chelminski I , Dalrymple K ((2013) ) Severity classification on the Hamilton Depression Rating Scale. J Affect Disord 150: , 384–388. |
[32] | Ashburner J ((2007) ) A fast diffeomorphic image registration algorithm. Neuroimage 38: , 95–113. |
[33] | Shattuck DW , Mirza M , Adisetiyo V , Hojatkashani C , Salamon G , Narr KL , Poldrack RA , Bilder RM , Toga AW ((2008) ) Construction of a 3D probabilistic atlas of human cortical structures. Neuroimage 39: , 1064–1080. |
[34] | Kostro D , Abdulkadir A , Durr A , Roos R , Leavitt BR , Johnson H , Cash D , Tabrizi SJ , Scahill RI , Ronneberger O , Klöppel S ((2014) ) Correction of inter-scanner and within-subject variance in structural MRI based automated diagnosing. Neuroimage 98: , 405–415. |
[35] | Cortes C , Vapnik V ((1995) ) Support-vector networks. Mach Learn 20: , 273–297. |
[36] | Platt JC ((1999) ) Probabilistic outputs for support vector machines and comparisons to regularized likelihood methods. In: Advances in Large Margin Classifiers, MIT Press, pp.61–74. |
[37] | Li H , Qi F , Wang S ((2005) ) A comparison of model selection methods for multi-class support vector machines. In: Proceedings of the 2005 International Conference on Computational Science and Its Applications - Volume Part IV, Springer-Verlag: Berlin, Heidelberg, pp.1140–1148. |
[38] | Wu T-F , Lin C-J , Weng RC ((2004) ) Probability estimates for multi-class classification by pairwise coupling. J Mach Learn Res 5: , 975–1005. |
[39] | Hsu C-W , Lin C-J ((2002) ) A comparison of methods for multiclass support vector machines. IEEE Trans Neural Netw 13: , 415–425. |
[40] | Arbabshirani MR , Plis S , Sui J , Calhoun VD ((2017) ) Single subject prediction of brain disorders in neuroimaging: Promises and pitfalls. Neuroimage 145: , 137–165. |
[41] | Zheng C , Xia Y , Pan Y , Chen J ((2016) ) Automated identification of dementia using medical imaging: A survey from a pattern classification perspective. Brain Inform 3: , 17–27. |
[42] | Bron EE , Smits M , van der Flier WM , Vrenken H , Barkhof F , Scheltens P , Papma JM , Steketee RME , Méndez Orellana C , Meijboom R , Pinto M , Meireles JR , Garrett C , Bastos-Leite AJ , Abdulkadir A , Ronneberger O , Amoroso N , Bellotti R , Cárdenas-Peña D , Álvarez-Meza AM , Dolph CV , Iftekharuddin KM , Eskildsen SF , Coupé P , Fonov VS , Franke K , Gaser C , Ledig C , Guerrero R , Tong T , Gray KR , Moradi E , Tohka J , Routier A , Durrleman S , Sarica A , Di Fatta G , Sensi F , Chincarini A , Smith GM , Stoyanov ZV , Sørensen L , Nielsen M , Tangaro S , Inglese P , Wachinger C , Reuter M , van Swieten JC , Niessen WJ , Klein S ((2015) ) Standardized evaluation of algorithms for computer-aided diagnosis of dementia based on structural MRI: The CADDementia challenge. Neuroimage 111: , 562–579. |
[43] | National Collaborating Centre for Mental Health (UK) ((2007) ), Dementia: A NICE-SCIE Guideline on Supporting People With Dementia and Their Carers in Health and Social Care. |
[44] | Scottish Intercollegiate Guideline Network ((2006) ) Management of patients with dementia: A national clinical guideline. SIGN Edinburgh. |
[45] | Dormont D , Seidenwurm DJ ((2008) ) Dementia and movement disorders. Am J Neuroradiol 29: , 204–206. |
[46] | Maier W , Jessen F ((2010) ) Introduction to the topic: Evidence-based standards for care of patients with dementia. The interdisciplinary 53 guideline for dementia. Nervenarzt 81: , 795. |
[47] | Abdulkadir A , Mortamet B , Vemuri P , Jack CR , Krueger G , Klöppel S ((2011) ) Effects of hardware heterogeneity on the performance of SVM Alzheimer’s disease classifier. Neuroimage 58: , 785–792. |


