
The Relevance of Iron in the Pathogenesis of Multiple System Atrophy: A Viewpoint
Abstract
Iron is essential for cellular development and maintenance of multiple physiological processes in the central nervous system. The disturbance of its homeostasis leads to abnormal iron deposition in the brain and causes neurotoxicity via generation of free radicals and oxidative stress. Iron toxicity has been established in the pathogenesis of Parkinson’s disease; however, its contribution to multiple system atrophy (MSA) remains elusive. MSA is characterized by cytoplasmic inclusions of misfolded α-synuclein (α-SYN) in oligodendrocytes referred to as glial cytoplasmic inclusions (GCIs). Remarkably, the oligodendrocytes possess high amounts of iron, which together with GCI pathology make a contribution toward MSA pathogenesis likely. Consistent with this observation, the GCI density is associated with neurodegeneration in central autonomic networks as well as olivopontocerebellar and striatonigral pathways. Iron converts native α-SYN into a β-sheet conformation and promotes its aggregation either directly or via increasing levels of oxidative stress. Interestingly, α-SYN possesses ferrireductase activity and α-SYN expression underlies iron mediated translational control via RNA stem loop structures. Despite a correlation between progressive putaminal atrophy and iron accumulation as well as clinical decline, it remains unclear whether pathologic iron accumulation in MSA is a secondary event in the cascade of neuronal degeneration rather than a primary cause. This review summarizes the current knowledge of iron in MSA and gives evidence for perturbed iron homeostasis as a potential pathogenic factor in MSA-associated neurodegeneration.
INTRODUCTION
Multiple system atrophy (MSA) is a severe, fast progressing neurodegenerative disease characterized by parkinsonism, cerebellar ataxia, and autonomic failure. According to the predominant motor presentation, patients are categorized as MSA-Parkinson variant (MSA-P) or MSA-cerebellar variant (MSA-C). Neuronal loss consistent with pronounced striatonigral degeneration or olivopontocerebellar atrophy reflects the predominant motor phenotype [1]. Additionally, affected brain areas responsible for autonomic or non-motor features are found in the brain stem and spinal cord [2]. Neuroinflammation, oxidative stress (OS), and iron accumulation are increasingly recognized as pathological features of MSA inducing neuronal loss [3, 4].
The diagnostic cellular hallmark of MSA are oligodendroglial cytoplasmic protein aggregates mainly composed of misfolded, hyperphosphorylated, and nitrated α-synuclein (α-SYN) referred to as glial cytoplasmic inclusions (GCIs) [5]. MSA, together with idiopathic Parkinson’s disease (IPD) and dementia with Lewy bodies (DLB), belongs to the group of α-synucleinopathies, which are all characterized by intracellular aggregations of α-SYN. However, the distribution of α-SYN deposits is different among this group of pathologically linked diseases; in IPD and DLB α-SYN deposits are found in neurons referred to as Lewy bodies and Lewy neurites, whereas in MSA oligodendrocytes are the main cells of attack. The density of GCIs is correlated with neuronal loss in affected brain regions and with disease duration [1, 6]. Thus, GCIs are believed to play a major role in the pathogenesis of MSA. However, the underlying etiology and pathogenesis of α-SYN aggregates and neurodegeneration are still elusive.
Dyshomeostasis in transitional metals has been proposed to be involved in neurodegenerative disorders, whereupon iron has received special attention: Increased iron levels and consecutive high levels of OS were proposed to contribute to neuronal loss in Parkinson’s disease, multiple sclerosis and AD [7–11]. Interestingly, a meta-analysis on transitional metals in AD brought up controversies as to which extend iron levels are elevated and that a bias toward reporting increased iron content in AD in review articles might play a role [12].
High iron content in degenerating brain regions as well as regulatory interactions between iron and α-SYN biology, via ferrireductase activity of α-SYN and iron mediated translational regulation of α-SYN involving iron responsive elements (IREs) within the 5’ untranslated region of α-SYN mRNA, have resulted in the idea that iron may contribute to the pathophysiology of MSA [9, 13–19]. However, the relationship between iron accumulation and α-SYN aggregation has poorly been investigated and the mechanisms of iron dyshomeostasis in respective brain regions remain elusive. Additionally, it is unclear whether increased iron levels are the cause of neurodegeneration or rather an epiphenomenon of such. In this review, we have collected data on iron accumulation/dysmetabolism in the brain and its association with OS and neuroinflammation found in MSA. Moreover, the putative functional interactions of α-SYN and iron are highlighted. Before discussing brain iron metabolism in healthy people and MSA patients we highlight excellent reviews that provide a comprehensive understanding on the topic of iron metabolism and toxicity [20–30].
BRAIN IRON IN HEALTHY PEOPLE
In the central nervous system (CNS), iron is essential for synthesis of neurotransmitters including dopamine, serotonin, and gamma-aminobutyric acid, and it is involved in the differentiation of oligodendrocytes and myelination [31–33]. Transit of iron to the CNS via the blood-brain barrier and the blood-cerebrospinal fluid (CSF) barrier is coordinated and mostly accomplished by transferrin receptor (TfR)-mediated endocytosis [34]. However, additional uptake mechanisms have been suggested including cellular uptake of ferritin favoring H-Ferritin over L-Ferritin [35] and by the divalent metal transporter (DMT1) [36]. Regarding iron export from the intracellular endosome and the capillary endothelial cells controversies exist to whether DMT1 and ferroportin (FPN) are involved [7, 37–41]. In the interstitial fluid of the brain, iron is bound to transferrin (Tf) which is produced by oligodendrocytes and circulates to target cells within the CNS [8, 20].
Inside the brain there seems to exist cell specific expression profiles determining iron uptake, utilization and storage mechanisms [20, 42, 43]. Neurons possess TfR, DMT1, ferritin, FPN, ceruloplasmin, and hephaestin. Astrocytes express DMT1, ferritin, FPN, and ceruloplasmin. Much less is known about transport mechanisms of microglia cells, although they have capacities to acquire, store and release iron [44, 45].
Ferritin serves as the dominant iron storage protein in the CNS and highest levels are detected in oligodendrocytes, followed by microglia and neurons. The smallest amount is found within astrocytes [44]. Hence, under normal conditions oligodendrocytes are the iron richest cells among brain cells and are therefore regarded the iron regulatory cells in the CNS [44, 46–48]. Nevertheless, the function of the high iron content held within ferritin in oligodendrocytes is insufficiently understood so far. Both isoforms of ferritin are found in oligodendrocytes, albeit H-Ferritin seems to be the major source of iron in oligodendrocytes [49]. Oligodendrocytes acquire iron by TfR uptake and H-Ferritin by receptor induced endocytosis during their maturing process (progenitor cells). Since mature oligodendrocytes do not express TfR alternative iron uptake mechanisms must exist and the more recently reported ferritin (Tim-2) receptor pathway (uptake of H-Ferritin) appears to be a likely candidate [48–52]. Among neurons and microglia, a unique distribution of H- and L-ferritin is observed in association with utilization requirements where H-Ferritin is predominantly found in neurons and L-Ferritin in microglial cells [33]. Further, CNS distinct storage arrangements are found in neuromelanin (NM) containing cells of the substantia nigra (SN), and the locus coeruleus (LC) [53]. Similar to systemic iron homeostasis, brain cellular iron metabolism is also operated by IREs and iron responsive proteins (IRPs) and mutations/deletions of IRP2 have been demonstrated to result in neuronal damage [28, 54].
It is important to note, that in the CNS iron distribution is distinct among different brain regions and cell populations and that iron accumulation in the CNS is a phenomenon of the aging brain [28, 55]. Not only the levels of iron but also the degree of iron accumulation vary in different brain regions. Physiological distribution of iron has been extensively studied by different histological, chemical and spectro-analytical procedures using Prussian blue/Perls’ stain, atomic absorption spectroscopy, inductively coupled plasma spectroscopy, instrumental neutron activation, and colorimetry as well as magnetic resonance imaging (MRI) based techniques. There are multiple contributors to MRI signals, particularly at iron concentrations in the range of white matter and cortical grey matter. In the areas of the brain with higher iron concentration, like the basal ganglia, the bulk of the signal on these iron-sensitive MR sequences is thought to originate from iron, although there certainly remains the possibility of other elements contributing. Highest levels of iron are found in the extrapyramidal system: globus pallidus (GP) (lateral > medial part) > SN > putamen > caudate nucleus (NC) > hippocampus > amygdala > grey > white matter of cerebral cortex = cerebellum [56–63]. Advanced MRI techniques offer in vivo brain iron estimations and confirmed postmortem biochemical studies [64–69]. Additional changes of cellular storage capacities among neurons and glial cells and their different storage modalities including ferritin, NM, and hemosiderin are not fully understood [44]. Unlike microglia, astrocytes, and neurons, oligodendrocytes do not physiologically accumulate iron upon aging [44]. The cause of cell specific iron accumulation upon aging is unclear. However, the fact that extrapyramidal brain regions tend to contain more iron than non-motor linked regions [70] has led to the association of iron accumulation and movement disorders. In the context of IPD in which severe neuronal loss is found in SN, detailed studies on iron, storage proteins ferritin and NM have been performed and indicated that physiologically the SN is more prone to iron induced damage due to accumulation of iron, ferritin and NM in contrast to LC [44, 71–74].
BRAIN IRON IN MSA
MSA has been proposed to be a primary oligodendrogliopathy due to the pathological hallmark of cellular inclusion bodies mainly composed of α-SYN predominating in oligodendroglial cells [75]. Oligodendrocytes are the iron richest cell population in the CNS and there is compelling evidence that iron plays a decisive role in the pathogenesis of MSA being associated with regions of neurodegeneration and α-SYN aggregation in the context of OS and neuroinflammation.
We here review histopathological and imaging data on the potential implications of iron dyshomeostasis in MSA pathology. Postmortem studies determining tissue iron, mainly used histochemical methods including Prussian blue/Perls’ stain as well as immunohistochemistry targeting iron related proteins (i.e., ferritin). In vivo estimations of brain iron can be obtained by MRI (see below).
Histopathological findings in MSA
Histopathological studies in MSA are scarce, but they all clearly demonstrate that iron deposition in the putamen of MSA patients is a hallmark of the disease [76]. To this end, several postmortem analyses revealed increased iron content and associated neuronal loss particularly in the putamen, while some authors also made these observations in the SN, GP, and NC of MSA patients [59, 77–81]. In MSA, iron accumulation in putamen is accompanied by elevated levels of ferritin [59, 82]. Less pronounced increase of ferritin immunoreactivity is also found in SN in MSA [59].
Regarding the actual amount of iron in basal ganglia of MSA patients, varying data exist possibly due to different methodologies applied to measure tissue iron. Nevertheless, there is evidence that iron content in putamen, GP, and SN is higher in MSA than in IPD, DLB, and controls, being similar to the levels found in progressive supranuclear palsy (PSP) as assessed by qualitative measurements of Jellinger in 2003 [59, 81]. The higher iron levels in SN of PSP and MSA >IPD were suggested to be associated with shorter disease duration and pronounced vulnerability to iron induced cellular damage. Hence, it was proposed that disease duration might be correlated inversely to brain iron accumulation [83]. Aside from basal ganglia, diffuse ferritin deposition was observed in the dentate nucleus of cerebellum of MSA brains [84]. Interestingly, alterations in iron concentrations have not been documented in LC, albeit severe neuronal loss was described in MSA neuropathology [81]. The source of increased ferritin levels in GP and SN of MSA is not known; evaluation of ferritin levels in the CSF of 15 MSA patients revealed no significant change compared to healthy individuals [85] making the CSF as source very unlikely.
In contrast, increased total iron levels have been linked to decreased ferritin and copper content, and increased zinc levels in the SN of IPD suggesting that free bioavailable iron and altered iron handling contribute to neurodegeneration in this area [86]. There are conflicting reports about the stage of disease progression at which nigral iron changes occur, which concurs with the notion that IPD represents different subgroups with different potential pathogenic pathways [83, 87]. Very recently, it has been suggested, that autophagy dysfunction and, less, OS are critical in the iron-induced pathogenesis and iron-induced α-SYN pathology of IPD. Maintaining proper activity of the autophagy pathway is essential for eliminating aberrant protein aggregates like α-SYN [88]. Whether this mechanism of iron induced α-SYN pathology by causing autophagy dysfunction plays a role in MSA remains to be investigated.
Ceruloplasmin acts as a ferroxidase and is essential for the functionality of FPN mediated cellular iron efflux. In two autopsy-proven MSA cases with hypoceruloplasminemia and two MSA controls increased iron deposition in SN and putamen was found, but neither in pons, cerebellum nor in the inferior olive [80, 89]. Although hypoceruloplasminemia and mutant ceruloplasmin have been demonstrated in MSA patients, the role of ceruloplasmin in the pathogenesis of MSA is still elusive [80, 90].
Further analyses of iron and its storage and utilization proteins support the idea of a reduction in bioavailable iron occurring in MSA [91]. Visanji and colleagues performed a detailed postmortem analysis of human brain tissue (MSA, IPD, and control) assessing iron, ferritin, TfR, and FPN distribution in pons, putamen, and SN of MSA tissue and detected region-specific differences: Increased tissue iron, increased ferritin, and decreased FPN were found in pons of MSA tissue and was regarded disease specific. A dysregulation of iron export coupled with an increase in ferritin iron was detected to a lesser extent also in putamen in MSA. A limiting factor of this study may be the small number of only 3 MSA and 3 control subjects [91]. It remains unclear whether neuroinflammation induced elevation of ferritin and consecutively increased intracellular iron levels occur because inflammatory signals and stimuli raise ferritin and decrease FPN expression or whether elevated iron accumulations induce ferritin production and activates microglia via OS [91, 92]. Moreover, it has been speculated that the expression pattern of iron proteins in pons of MSA (with increased tissue iron, increased ferritin and decreased FPN indicating reduction of bioavailable iron) may reflect neuroinflammation with associated induction of hepcidin. Hepcidin originating from the liver acts as a systemic hormone or hepcidin can be produced locally following inflammation-driven generation in macrophage like cells such as microglia then acting in a paracrine fashion resulting in tissue iron retention via FPN downregulation and consequently reduced extracellular iron bioavailability [93, 94].
In summary, histopathological data on iron metabolism in MSA are very limited and number of MSA cases in postmortem studies is rather small. The only truly quantitative assessment of iron concentration in MSA was done by Dexter and colleagues in 1991 and that quantitative iron levels in the putamen in MSA is known from only 8 cases [59]. Additionally, variable histochemical methods make comparisons among studies difficult. More work is needed to corroborate the postulated increase of iron levels in the basal ganglia of MSA patients with putamen possessing highest amounts accompanied by increased ferritin content. Considering that iron bound to ferritin is non-reactive, the findings of increased iron content linked to elevated ferritin levels found in the putamen and SN of MSA patients suggest that a reduction of free – bioavailable iron may occur in these areas. However, the mechanism how iron dyshomeostasis contributes to neurodegeneration and neuroinflammation in MSA remains elusive.
Table 1 gives an overview of histopathological studies investigating iron in MSA.
Table 1
Summarizes histopathological studies investigating iron metabolism/dysregulation in MSA
| Methods | Major findings | Population | Strength (+)/Weakness (–) of the study | Reference |
| Perls’ stain | Variable amounts of putaminal iron content | 4 MSA | (–) sample size | Spokes et al. [77] |
| (–) lack of controls | ||||
| Inductively coupled plasma spectroscopy, radio-immunoassay technique, IHC targeting ferritin | Increase in total iron levels in SN (59%), medial putamen (67%) and NC (42%) in MSA versus HC | 8 MSA 27 IPD 11 PSP 10 HD 13 HC | (+) iron quantification, detailed determination of total copper, manganese, zinc levels and ferritin immunoreactivity | Dexter et al. [59] |
| Increase in iron levels (44 %) in lateral putamen (ns) | (+) comparison groups | |||
| Ferritin immunoreactivity was increased in putamen (59–73%) and differed significantly from controls; in SN (34%) it did not reach significance in MSA | (–) sample size (MSA group) | |||
| No change in total iron levels and ferritin immunoreactivity in cerebral cortex, NC, GP and cerebellum in MSA | ||||
| Ferritin in CSF was measured with the “Enzymun Ferritin coated tube assay” | CSF ferritin of MSA and IPD patients did not differ significantly from HC | 15 MSA 72 IPD 15 PDD 11 AD 20 HC | (+) sample size and comparison groups | Kuiper et al. [85] |
| (–) no tissue iron analyses performed | ||||
| (–) MSA group formed a heterogeneous group including also 3 PSP patients | ||||
| Berlin blue stain | Iron depositions in SN and putamen of MSA with hypoceruloplasmin and in MSA controls | 2 MSA patients with a-/hypo-ceruloplasminemia and 2 MSA | (–) sample size | Kurisaki et al. [80] |
| Perls’ stain | Iron depositions in putamen, SNc and GP in MSA were similar to PSP and more pronounced than in IPD/HC | 12 MSA 14 IPD 8 DLB 5 PSP 6 HC | (+) sample size and comparison groups | Jellinger [81] |
| Severe neuronal loss in LC without alterations in iron levels | ||||
| GFAAS, IRM, IHC targeting ferritin, FPN, TfR | Increase in tissue iron and ferritin along with decrease in FPN in pons>putamen indicating a reduction of bioavailable iron in MSA | 3 MSA 3 IPD 3 HC | (+) detailed analyses of iron and related proteins using IHC, western blot, GFAAS, IRM | Visanji et al. [91] |
| No change in iron and ferritin levels in SN in MSA versus HC | (–) sample size |
AD, Alzheimer’s disease; FPN, ferroportin; CSF, cerebrospinal fluid; DLB, dementia with Lewy bodies; GP, globus pallidus; HC, healthy controls; HD, Huntington’s disease; LC, locus coeruleus; MSA, multiple system atrophy; NC, caudate nucleus; ns, not significant; IPD, idiopathic Parkinson’s disease; PDD, Parkinson’s disease with dementia; PSP, progressive supranuclear palsy; SN, substantia nigra; SNc, substantia nigra pars compact; TfR, transferrin receptor; IHC, immunohistochemistry; GFAAS, Graphite Furnace Atomic Absorption Spectroscopy; IRM, isothermal remanent magnetization.
Iron imaging findings in MSA
Brain iron can be visualized in vivo using MRI [95]. Iron sensitive imaging sequences include T2/T2*, susceptibility-weighted imaging (SWI), and R2* (= 1/T2) [65, 96]. However, these imaging sequences cannot distinguish between different forms of iron (heme-bound iron; ferritin-bound, Tf-bound, free iron) [65, 97]. Nonetheless, it could be demonstrated that higher magnetic field MRI (3T) is able to more precisely localize iron accumulation within the putamen in MSA [98]. Iron deposits selectively reduce T2 signals (spin echo sequence) appearing as hypointensity in T2 weighted images [79]; whereas gliosis results in hyperintense MRI signal. Superior to T2 imaging in terms of iron detection is T2*-weighted (gradient echo) sequence analysis due to its higher sensitivity for magnetic susceptibility changes [99] similar to R2* and SWI sequences. More recently, development of quantitative susceptibility mapping (QSM) has been introduced in order to quantify brain iron in vivo. However, to our knowledge QSM studies have not been published in MSA so far. Several authors have demonstrated that hypointense T2 signal on MRI in the basal ganglia in MSA correlates with postmortem determined iron accumulation in respective brain regions (see Table 3) [79, 82, 84].
In MSA, the hypointensity of the posterolateral region of putamen received particular attention being associated with highest iron concentrations [100–106]. Therefore, low intensity of putamen of T2/T2*-weighted/SWI modalities of mostly 1.5T MRI has been suggested to be a specific feature of MSA in contrast to IPD and has attracted interest for the differential diagnosis between IPD and MSA-P [79, 106–113]. However, on visual rating of routine MRI images this discrimination between MSA and IPD proved unreliable [101, 103, 114]. Nevertheless, it could be shown that putaminal T2 hypointensity relative to GP is more specific for MSA [101, 103, 104].
The source of iron that causes hypointensity on MRI has been poorly investigated. There are only very few studies combining imaging and histochemistry in MSA [79, 82, 84] and little evidence shows that MRI signal change in putamen might reflect greater levels of ferritin-bound iron, accumulation of hemosiderin and NM in patients with MSA, but not in patients with IPD/healthy individuals [82, 108, 115].
Matsusue and colleagues compared postmortem T2-weighted imaging (1.5T) of MSA-P with histological findings of putamen and found that putaminal hypointensity reflects diffuse ferritin and iron deposition. In MSA-C hypointensity in dentate nuclei was associated with diffuse ferritin depositions [82, 84].
The attempt to quantify brain iron accumulation led to the introduction of a visual grading scale for hypointensity of putamen and subregional examination of putamen by some authors [100, 106, 116–118]. As a result, the inner region of the putamen was proposed to be the most valuable region in differentiating MSA-P from IPD [106]. Grading of putaminal hypointensity among MSA patients revealed that even early stage MSA-P is associated with putaminal hypointensity grade≥2 (like in advanced disease) indicating that iron accumulation might occur early in the disease process [117]. However, no correlation of disease duration and putaminal hypointensity could be demonstrated [110, 117]. Further MRI studies demonstrated that MSA-P could be differentiated from IPD by grade 3 hypointensity of posterior putamen [118]. The results of postmortem analyses revealing higher iron concentration of the posterior putamen in MSA-P compared to IPD complement the MRI based grading of putaminal hypointensity and also allowed differentiation of PSP and MSA/IPD [81, 116].
The topography of iron distribution in putamen of MSA was further studied [117, 119, 120]: There is an ascending T2 signal intensity from lateral to medial putamen, even in very early stages of disease without clinical symptoms – and therefore, this pattern was proposed MSA specific [117, 119]. Different iron deposition pattern in MSA-P and PSP were evaluated using R2* values and more severe iron accumulation in posterior/dorsal parts of putamen and GP in MSA-P was shown [120]. MSA-P could be differentiated from PSP by significantly lower R2* values of NC in MSA-P. Furthermore, higher R2* values were determined in the putamen of MSA-P compared to IPD/controls. In a subsequent study, Lee and colleagues evaluated 3T T2*-weighted gradient echo sequences in MSA, PSP, IPD, and controls and found that T2* is superior in detecting iron deposition compared to T2 and demonstrated its usefulness in differentiating patients with MSA from IPD and healthy controls [121].
Interestingly, the highest iron content as assessed by histochemistry and imaging studies in putamen colocalizes with highest GCI density and α-SYN aggregation in MSA brains [79, 122]. In addition to high iron levels in putamen in MSA, hypointensity on MRI is associated with high iron content in NC, SN, the adjacent lateral aspect of GP and in the pulvinar thalami as estimated by T2/T2* imaging analyses [106, 108–110, 116, 118, 119].
Since contradictory findings regarding hypointensity associated with iron accumulation using different MRI field strengths arose, Watanabe and colleagues investigated the influence of different MRI field strengths (0.35/1.5/3T) on the putaminal signal in patients with MSA. Beside severity of gliosis and iron accumulation determining the MRI signal, the field strengths have profound influence on MRI findings with further implications for the diagnostic value. It has been demonstrated that an increasing field strength was associated with a lower frequency of putaminal hyperintensity (considering putaminal body and margin). In contrast, the occurrence of putaminal hypointensity increased concomitantly with the field strength [98].
Among the predominant motor presentations of MSA it could be demonstrated that putaminal hypointensity is more pronounced in MSA-P compared to MSA-C [79]. Additionally, a longitudinal MRI study by Lee and coworkers revealed a faster progression of putaminal pathology (atrophy and hypointensity) in MSA-P than MSA-C correlating to faster symptom progression in MSA-P [121].
The “putaminal rim sign” is a T2-hyperintense MRI sign at the dorsolateral border of the putamen which is believed to result from gliosis and can help to differentiate MSA-P from IPD [82, 111, 121, 123–126]. This is, however, a non-specific sign and, therefore, not included in the revised consensus criteria [127], while putaminal atrophy shows 92.3% specificity but low sensitivity (44.4%) for distinguishing MSA-P from IPD [128]. It can be speculated that iron deposition at the putaminal rim might be masked by predominant gliosis in this region [129].
Taken together, increased putaminal iron [108, 119, 120] is the most consistent finding in MRI studies and its visualization may be helpful in making the differential diagnosis between IPD and MSA or PSP [106, 108, 116]. Correlating the severity of atrophy and iron accumulation suggests that iron accumulation is a secondary effect of neurodegeneration as significantly increased iron in the putamen is associated with advanced atrophy compared to moderate iron accumulation in GP along with less severe atrophy [120]. Nevertheless, MRI studies need to be interpreted with great caution due to heterogeneous study populations, variation in stage of disease, lacking discrimination of MSA subtypes, different MRI protocols including slice thickness, fast versus conventional spin echo, T2*, R2*, SWI, quantitative and qualitative assessment, and field strengths (see Table 2).
Table 2
Summarizes MRI studies looking at brain iron content in MSA
| Methods | Major findings | Population | Strength (+)/Weakness (–) of the study | Reference |
| 1.5T MRI | Putaminal T2 hypointensity in MSA-P >MSA-C | 32 MSA (11 MSA-P and 21 MSA-C) | (+) sample size | Schulz et al. [100] |
| (+) discrimination between MSA subtypes | ||||
| Putaminal hypointensity grade 0–3 [114] | (+) quantitative and qualitative assessment | |||
| (–) lack of postmortem confirmation | ||||
| (–) half of the patients were studied retrospectively | ||||
| (–) no comparison groups except either MSA variant | ||||
| 0.5T/1.5T MRI | Exclusive finding of hyperintense putaminal rim in 30% (0.5T) – 41% (1.5T) of MSA patients | 44 MSA (28 MSA-P and 16 MSA-C) | (+) sample size and comparison groups | Schrag et al. [101] |
| Putaminal signal intensity was rated in relation to GP/cortical signal | Relative putaminal T2 hypointensity in MSA >IPD/HC (ns, 1.5T) | 47 IPD | (–) lack of postmortem confirmation | |
| 45 HC | (–) no discrimination between MSA subtypes in terms of signal intensity | |||
| (–) retrospective study design | ||||
| (–) limited to visual rating | ||||
| 1.5T MRI | Combination of relative hypointense putamen and hyperintense rim on T2 is highly specific of MSA-P | 15 MSA-P | (+) sample size and comparison groups | Kraft et al. [103] |
| Putaminal signal intensity was rated in relation to GP | 65 IPD | (–) limited to visual rating | ||
| 10 PSP | (–) lack of postmortem confirmation | |||
| (–) lack of HC group | ||||
| 1.5T MRI | T1 and T2 shortening in GP consistent with reported increases in ferritin-bound iron | 8 MSA | (–) lack of postmortem confirmation | Vymazal et al. [108] |
| Changes in putamen consistent with reported accumulation of hemosiderin in the posterior portion and remaining NM in MSA | 23 IPD | |||
| 18 HC | (–) sample size | |||
| (–) no differentiation of MSA subtypes | ||||
| (–) imaging features were compared to historically reported ferritin/hemosiderin levels | ||||
| 0.5T/1.5T MRI | Differentiation between MSA and PSP by signal decrease in GP (mainly on 1.5-T scans) and a hyperintense rim or hyperintensity of the whole putamen (the latter only on 0.5-T scans) by T2 sequence imaging | 54 MSA (30 MSA-P and 24 MSA-C) | (+) sample size and comparison groups | Schrag et al. [102] |
| Putaminal signal intensity was rated in relation to GP/cortical signal | 35 PSP | (–) lack of postmortem confirmation in most cases | ||
| 5 CBD | (–) no discrimination between MSA subtypes | |||
| 44 HC | (–) retrospective study design | |||
| (–) limited to visual rating (with exception of midbrain diameter) | ||||
| 1.5T MRI | Relative hypointense putaminal signal changes can differentiate MSA from IPD using T2*, not T2 | 15 MSA 40 IPD 17 HC | (+) sample size and comparison groups | Kraft et al. [109] |
| Putaminal signal intensity was rated in relation to GP | ||||
| T2* weighted GE sequences are of diagnostic value for patients with parkinsonism | (–) lack of postmortem confirmation | |||
| (–) retrospective study design | ||||
| (–) limited to visual rating | ||||
| (–) no differentiation of MSA subtypes | ||||
| 1.0T MRI | Combination of T2* signal loss of dorsolateral putamen and hyperintense lateral rim on FLAIR is helpful in differentiating MSA from IPD | 52 MSA (47 MSA-P and 5 MSA-C) | (+) sample size except MSA-C | Von Lewinski et al. [110] |
| Diagnostic accuracy of ROI analyses to differentiate MSA from IPD >0.82 | 88 IPD | (+) qualitative and quantitative assessment | ||
| No difference between MSA-P and MSA-C detected | 29 HC | (–) lack of postmortem confirmation | ||
| (–) comparability of 1.0 T MRI versus 1.5/3 T MRI | ||||
| 1.5T MRI | Putaminal SWI hypointensity PSP >IPD, but no difference between PSP and MSA-P or PSP and IPD | 12 MSA-P | (+) advanced MRI technique (SWI) | Gupta et al. [116] |
| Hypointensity grade 0–3 [116] | Hypointensity of SN and red nucleus PSP >MSA-P/IPD/HC | 11 IPD | (–) lack of postmortem confirmation | |
| 12 PSP | (–) lack of age-matched controls in consideration of PSP and IPD | |||
| 11 HC | (–) sample size (IPD, HC) | |||
| (–) late stage of disease | ||||
| (–) limited to visual rating | ||||
| (–) SWI is influenced by other minerals | ||||
| 0.35T/1.5T/3.0T MRI | Magnetic field strengths affect the diagnostic value - higher magnetic field strength improves signal-to-noise ratio and enhances the magnetic susceptibility effect | 15 MSA (8 MSA-P and 7 MSA-C) | (+) evaluation and comparison of various magnetic field strengths | Watanabe et al. [98] |
| 3.0T MRI: higher sensitivity in detection of putaminal hypointensity than 0.35T or 1.5T | 60 IPD | (+) discrimination between MSA subtypes | ||
| Putaminal hyperintensity was more frequent in MSA-P than in MSA-C | (–) lack of postmortem confirmation | |||
| (–) lack of HC group | ||||
| (–) limited to visual rating | ||||
| 3.0T MRI | Hemi-/bilateral putaminal SWI hypointensity (≥grade 2) plus hyperintense lateral rim in 82% and 55% of MSA-P | 11 MSA-P | (+) advanced MRI technique (SWI, 3.0T) | Lee and Baik [117] |
| Putaminal hypointensity grade 0–3 [116] | Scores of putaminal hypointensity were significantly higher in MSA than in IPD/HC and a score≥2 differentiated MSA-P from IPD/HC even in early stage of disease (duration <1 year) | 30 IPD | (+) early stage of disease | |
| 30 HC | (–) lack of postmortem confirmation | |||
| (–) retrospective study design | ||||
| (–) limited to visual rating | ||||
| (–) SWI is influenced by other minerals | ||||
| 1.5T MRI | High iron content in putamen >PT differentiates MSA-P from IPD (evaluated by SWI phase shift) | 8 MSA-P | (+) advanced MRI technique (SWI) | Wang et al. [106] |
| Putamen was divided in 4 sub-regions | The lower inner region of the putamen presents the most valuable region in differentiating MSA-P from IPD | 16 IPD | (+) early stage of disease | |
| 44 HC | (+) quantitative evaluation | |||
| (–) lack of postmortem confirmation | ||||
| (–) sample size | ||||
| (–) MR rating performed by only one rater | ||||
| (–) SWI is influenced by other minerals | ||||
| 3.0T MRI | MSA-P and PSP showed higher SWI phase shift values (= levels of iron depositions) than IPD/HC | 12 MSA-P | (+) advanced MRI technique (SWI, 3.0T) | Han et al. [119] |
| MSA-P had lower iron levels in SN than PSP/IPD and in RN, GP and TH than PSP | 11 PSP | (+) early stage of disease | ||
| MSA-P revealed higher iron levels in putamen than PSP/IPD/HC - especially the posterolateral putamen and lateral aspect of GP are characterized by iron-related hypointense signal on VBA of SWI in MSA | 15 IPD | (+) quantitative evaluation | ||
| 20 HC | (–) lack of postmortem confirmation | |||
| (–) SWI is influenced by other minerals | ||||
| 3.0T MRI | Significantly higher R2* values in putamen in MSA-P versus IPD/HC | 15 MSA-P | (+) advanced MRI technique (R2*, 3.0T) | Lee et al. [120] |
| Transverse relaxation rate R2* as surrogate of iron in brain tissue | Higher R2* values in GP in PSP than IPD/HC, higher R2* values in NC in PSP >MSA-P/IPD/HC | 13 PSP | (+) early stage of disease | |
| In MSA-P GP and in PSP putamen showed higher R2* values than IPD/HC (ns) | 29 IPD | (+) automated region-based analysis | ||
| MSA-P could be differentiated from PSP by significantly lower R2* values of NC in MSA-P | 21 HC | (–) lack of postmortem confirmation | ||
| Subregion analyses: different iron deposition pattern in MSA-P and PSP with more iron accumulation in posterior/dorsal parts of putamen and GP in MSA-P | (–) R2* is influenced by other factors and minerals | |||
| (–) SN and RN were not included in the analyses | ||||
| 3.0T MRI | Baseline MRI: R2* values in putamen significantly higher in MSA-P compared to IPD | 17 MSA (8 MSA-P and 9 MSA-C) | (+) advanced MRI technique (R2*, 3.0T) | Lee et al. [121] |
| 15 IPD | (+) discrimination between MSA subtypes | |||
| Longitudinal study follow-up ∼ 18–24 M | Follow up MRI: R2* value in putamen significantly higher in MSA-P than in IPD/MSA-C. | |||
| Significant progression in putaminal R2* values and atrophy in MSA-P >MSA-C >IPD. | (+) automated region-based analysis | |||
| Putamen as most significant area to distinguish MSA-P versus MSA-C | (+) longitudinal study design | |||
| (+) early stage of disease | ||||
| (–) lack of postmortem confirmation | ||||
| (–) lack of HC group | ||||
| (–) no evaluation of volumes and R2* values in brainstem and cerebellar structures | ||||
| 1.5T MRI | Putaminal abnormalities: T2*-weighted GE sequences are superior in detecting iron deposition | 15 MSA (9 MSA-P and 6 MSA-C) | (–) lack of postmortem confirmation | Sugiyama et al. [111] |
| MSA could be differentiated from IPD, PSP, HC | 16 IPD | (–) conventional MRI applied only | ||
| Diagnostic accuracy: higher in T2*L than in T2L | 9 PSP | (–) sample size (HC) | ||
| T2*L for differentiation MSA versus IPD/PSP and HC | 10 HC | (–) no discrimination between MSA subtypes | ||
| 3.0T MRI | SWI improves diagnostic accuracy of putaminal hypointensity in MSA in comparison to T2 | 12 MSA-P | (+) advanced MRI technique (SWI, 3.0T) | Meijer et al. [118] |
| Putaminal hypointensity grade 0–3 [116] | Posterior part of putamen was most valuable in differentiating MSA-P from IPD | 38 IPD | (+) early stage of disease | |
| Mean putaminal SWI signal intensity was significantly lower in MSA-P versus IPD/HC | 3 PSP | (–) lack of postmortem confirmation | ||
| Severe putaminal hypointensity (grade 3) is indicative of MSA | 3 DLB | (–) sample size (PSP, DLB) | ||
| Lower SWI in NC in MSA-P than in IPD | 13 HC | (–) SWI is influenced by other minerals | ||
| 3 T MRI | Putaminal SWI hypointensity in MSA >IPD/controls | 39 MSA (18 MSA-P and 21 MSA-C) | (+) advanced MRI technique (SWI, 3.0T) | Wang et al. [113] |
| “Swallow-tail” evaluation (nigrosome 1) of SN and putaminal hypointensity grade 0–3 [116] | The combination of bilateral “swallow-tail” sign and putaminal hypointensity (≥grade 2) on SWI differentiates MSA from IPD | 18 IPD | (+) sample size and comparison groups except IPD population | |
| Lateral to medial gradient of putaminal hypointensity in MSA | 31 HC | (–) lack of postmortem confirmation | ||
| (–) retrospective study design | ||||
| (–) limited to visual rating | ||||
| (–) no discrimination between MSA subtypes |
GE, gradient echo; GP, globus pallidus; HC, healthy controls; MRI, magnetic resonance imaging; MSA, multiple system atrophy; MSA-P, multiple system atrophy Parkinson variant; MSA-C, multiple system atrophy cerebellar variant; CBD, corticobasal degeneration; NM, neuromelanin; IPD, idiopathic Parkinson’s disease; PSP, progressive supranuclear palsy; PT, pulvinar thalamus; RN, red nucleus; SN, substantia nigra; TH, thalamus; NC, caudate nucleus; FLAIR, fluid attenuated inversion recovery sequences; R2*, tissue relaxation time of MRI (1/T2); SWI, susceptibility weighted imaging; T, Tesla; T2, tissue relaxation of MRI investigation; T2L/T2*L, low-intensity signal within the putamen on T2/T2*-weighted images; ns, not significant; ROI, region of interest; VBA, voxel-based analyses.
An overview about iron on MRI is given in Table 2.
Studies combining MRI with histology are given in Table 3.
Table 3
Summarizes studies correlating MRI features with postmortem tissue analyses
| Methods | Results | Population | Strength (+)/Weakness (–) of the study | Reference |
| Clinicopathological study | Correlation of putaminal T2 hypointense changes with post mortem analyses of increased iron | 3 MSA-P | (–) sample size | Lang et al. [79] |
| 1.5T MRI-T2, Perls’ stain for iron evaluation in putamen | A lateral to medial gradient of putaminal changes in all three patients | (–) lack of HC | ||
| Most prominent changes/damage in posterolateral part of putamen | (–) no standardized MRI protocol as based on retrospective analysis of MRI | |||
| Postmortem study | Putaminal iso- or hypointensity reflected diffuse ferritin and Fe3 + deposition | 7 autopsy-proven MSA cases | (+) detailed description of clinical, pathologic and imaging findings | Matsusue et al. [82] |
| 1.5T MRI-T2 | Hyperintensity reflects tissue rarefaction | (+) several staining methods applied | ||
| histology study (HE; Klüver-Barrera, Bielschowsky, Berlin blue, ferritin IHC) | Hyperintensive putaminal rim reflects degeneration of the putaminal lateral margin and/or external capsule | (–) evaluation of postmortem MR images | ||
| (–) lack of HC | ||||
| Postmortem study | Hypointensities in the dentate nucleus reflect diffuse ferritin deposition in preserved dentate nuclei and white matter around and within the nuclei | 7 autopsy-proven MSA cases | (+) several staining methods applied | Matsusue et al. [84] |
| 1.5T MRI-T2 | (–) evaluation of postmortem MR images | |||
| histology study (HE; Klüver-Barrera, Bielschowsky, Berlin blue, GFAP and ferritin IHC) | (–) lack of HC |
GE, gradient echo; HC, healthy controls; MRI, magnetic resonance imaging; MSA, multiple system atrophy; MSA-P, multiple system atrophy Parkinson variant; T2, tissue relaxation of MRI investigation; T, Tesla; HE, hematoxylin eosin; GFAP, glial fibrillary acidic protein; IHC, immunohistochemistry.
Iron, α-synuclein, oxidative stress, and neuroinflammation
Collectively, histopathological and imaging data clearly demonstrate that iron levels are elevated in specific MSA brain regions with highest levels in the putamen. However, the mechanisms and consequences of iron accumulation have not been elucidated in MSA so far. In the following part potential interactions and mechanisms of iron dyshomeostasis in the pathogenic cascade are highlighted.
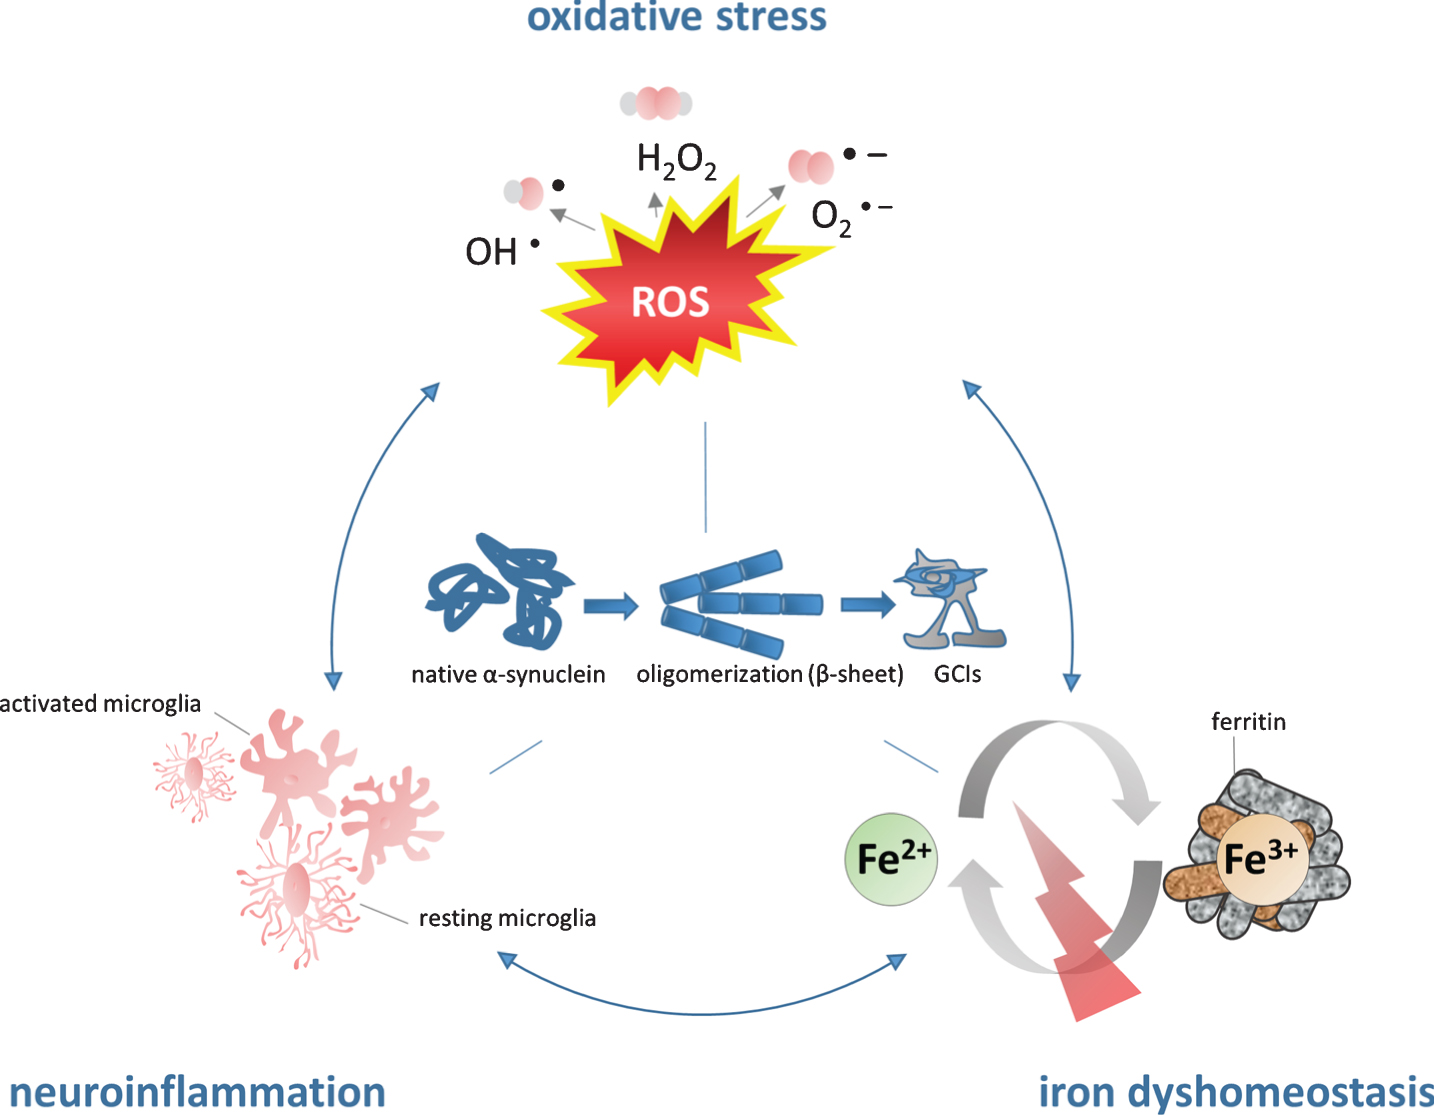
Figure 1 illustrates the vicious circle how iron may contribute to α-SYN pathology: iron accumulation results in high levels of OS/microglial activation leading to iron induced OS/neuroinflammation promoting α-SYN aggregation.
Fig.1
The role of iron in the pathogenesis of MSA. Iron dyshomeostasis is associated with increased levels of oxidative stress and microglial activation. The consecutive formation of a synergistic self-feeding cycle promotes α-SYN aggregation and secondary neurodegeneration. Fe2 +, ferrous form of iron, Fe3 +, ferric form of iron, GCIs, glial cytoplasmic inclusions; H2O2, hydrogen peroxide; O2-, superoxide anion; OH-, hydroxyl radical; ROS, reactive oxygen species.
α-SYN consists of 140 amino acids and physiologically it is a soluble α-helical protein reversibly attached to the cell membrane in the cytoplasm of brain cells. As part of the soluble N-ethylmaleimide-sensitive-factor attachment receptor (SNARE) complex it is believed to interact with the plasma/vesicular membrane in the process of neurotransmission. α-SYN has been implicated in the pathogenesis of IPD, MSA, and DLB [81, 130], which are all characterized by cellular aggregation and fibrillation of the protein. While α-SYN inclusions are mainly found in neurons in IPD and DLB, MSA is characterized by oligodendroglial α-SYN aggregation. As mature oligodendroglial cells do not express α-SYN physiologically, the origin of intracellular α-SYN aggregates as well as the trigger of α-SYN aggregation in MSA remain unknown [131]. It has been speculated that oligodendrocytes actively take up α-SYN that is released by neighboring neurons resulting in accumulation in oligodendrocytes [132]. This hypothesis is further supported by in vitro evidence pointing toward a neuron-to oligodendroglia cell to cell prion-like transmission of α-SYN [133–135]. Furthermore, a link between cell to cell propagation and neuroinflammation has been proposed for IPD [136] which might be translated to MSA. Disease progression and neurodegeneration appear to reflect increased levels of OS and proinflammatory cytokines released by activated microglia in mouse models of MSA and IPD [3, 137–139].
Post-translational modifications have been implicated in the pathogenesis of proteinopathies. In healthy humans phosphorylated α-SYN accounts for only 5% in contrast to synucleinopathies with the majority of α-SYN being phosphorylated [140] characteristically at position serin-129. OS seems to play a major role in these modifications as several in vivo and in vitro experiments demonstrated that increased OS leads to conformational changes of α-SYN structure, phosphorylation, oxidation and nitration and further accelerates oligomer formation, aggregation and increased production of reactive oxygen species (ROS) [19, 140–147].
As we have learned from in vitro experiments excess iron can promote α-SYN aggregation [143, 148] in a dose-dependent manner and dopamine exposure can further stimulate this process [19]. The exact mechanism remains unknown, although increased iron levels as well as iron catalyzed OS have been shown to promote the conversion of the α-helical conformation into β-sheet or spherical oligomer structure resulting in further α-SYN aggregation [17, 143] similar to that emerging upon incubation of (misfolded) α-SYN alone [149]. Whether a direct interaction of iron and α-SYN is involved is not known, although an iron binding site has been identified on α-SYN among other metal binding sites, resulting in conformational and solubility changes of the protein [17, 150–152]. Both ferric and ferrous iron were shown to bind to α-SYN [153], and it has been demonstrated that ferrous iron promotes α-SYN aggregation [154]. Interestingly, phosphorylation of α-SYN, occurring during OS, results in increased affinity to the metal binding site for iron [155].
Where OS arises, the oxidation of iron to its ferric form leads to aggravation of α-SYN pathology. To this end, the in vitro identification of an enzymatic activity, namely ferric-reductase activity within α-SYN by Davies and coworkers may explain the contrasting relative distribution of ferrous and ferric iron in SN: ferrous >ferric iron = 2:1 in healthy controls versus 1:1 in IPD [61, 156–158]. Consequently, an increased abundance of ferric iron and the consecutive propagation of OS via the Fenton reaction [159] may further accelerate α-SYN aggregation [13].
Another putative mechanism of iron induced α-synucleinopathy may be proposed by the discovery of a functional IRE within the 5-untranslated region of human α-SYN mRNA underlying iron mediated stimulation of α-SYN expression via translational regulation [160]. In vitro experiments demonstrated that in the presence of iron α-SYN mRNA is upregulated by IRP-knockdown resulting in pronounced cellular α-SYN aggregation [13, 161]. MSA is associated with disruption of long intervening non-coding RNAs (lincRNAs) along with protein-coding genes related to iron metabolism and immune response [162].
Generally, the crucial role of oligodendrocytes in MSA becomes clear by its intracellular aggregation profile of α-SYN. Their high intracellular iron levels along with low concentrations of anti-oxidative agents (glutathione) in combination with their high metabolic rate make them particularly vulnerable to oxidative damage [163, 164]. Plus, cytokines released by activated microglia in the context of inflammatory response have been shown to induce oligodendroglial cell death [165, 166]. Furthermore, oligodendroglial cytoplasmic aggregation of α-synuclein itself leads to increased susceptibility to OS and tumor necrosis factor alpha (TNF-α) [167, 168] building a self-sustaining damaging system.
Several cell culture investigations, animal models and PET imaging in MSA patients have demonstrated that neuroinflammation parallels α-SYN pathology [169–173]. Hence, neuroinflammation has been accepted as a prominent finding contributing to neurodegeneration and α-SYN mediated toxicity mainly originating from activated microglia cells [3, 167, 169, 174]. Microglial activation in MSA was reported in regions of neuronal loss including putamen, GP, pons, SN, and the dorsolateral prefrontal cortex using [C11]-(R)-PK11195 PET imaging [170] and it has been demonstrated that microglia activation results in morphological and functional changes, plus they release pro- and/or anti-inflammatory cytokines, neurotrophic factors, and cleavage damaged or dead cells [175–177]. However, albeit their indispensable mechanism of host defense and maintenance of neuronal viability, microglial cells can be over-activated leading to chronic inflammation and microgliosis which is found in several neurodegenerative diseases including MSA. As a result, neurotoxic factors including TNF-α and interleukin-1 beta as well as superoxide radicals including ROS and nitric oxide are released, which further provoke neuroinflammation and protein aggregation, creating a positive feedback loop facilitating neuronal damage and cell death [178–184]. Variable forms of α-SYN including native, misfolded α-SYN as well as nitrated α-SYN can trigger neuroinflammation by microglia activation in a dose and conformation dependent manner [3, 137, 138, 173, 175, 185–193]. Although the exact mechanisms of microglia uptake of α-SYN are not fully understood and an α-SYN specific receptor of microglia has not been identified yet, it has been demonstrated that an uptake mechanism must exist [194, 195] that in turn triggers the release of soluble immune modulators. One possible α-SYN uptake strategy includes the toll-like receptor 4 (TLR4) which is a pattern-recognition receptor that has been identified to play an essential role in microglial activation mediating phagocytic activity, release of proinflammatory cytokine and production of ROS after binding to α-SYN. Following, a modulatory role of TLR4 in neuroinflammation was suggested.
In summary, α-SYN aggregation is associated with GCI density in MSA specific areas and activated microglial cells [174]. Thus, the upregulation of inflammatory mediators and microglia-mediated neuroinflammation are associated with the pathogenesis of MSA [179, 186, 196, 197]. Since neuroinflammation and α-SYN are observed in early MSA neuropathology it remains unclear whether α-SYN induces neuroinflammation or neuroinflammation incudes protein aggregation.
Overall, the role of iron should no longer be questioned in the process of α-SYN related neurodegeneration as iron accumulates in degenerating brain regions, under inflammatory conditions and can aggravate cytokine induced oxidative and nitrosative stress responses along with distinct effects of iron on immune effector pathways [198]. Even though it is still unknown whether neuroinflammation is an initial or downstream effect [122] of synuclein and/or iron accumulation, it has been demonstrated that on the one hand, nitrated α-SYN resulting from OS activates microglia [138, 199] and elevates proinflammatory mediators [200, 201] and on the other hand that iron accumulation activates microglial cells leading to release of proinflammatory cytokines [202–205]. Consequently, concomitant iron accumulation, OS, and neuroinflammation can be particularly damaging in the brain by sustaining a self-promoting vicious circle.
CONCLUSION AND OUTLOOK
This review summarizes the currently available evidence of the putative functional association of iron dysregulation in MSA and points out possible targets for disease modification. Although iron is essential to maintain physiological functions, iron overload is linked to cellular damage and neurodegeneration. An elevation of brain tissue iron levels in MSA has been determined by histopathological analyses and conventional imaging studies using T2/T2* and SWI techniques of MRI. In MSA, highest levels of iron are detected in putamen. Histopathological investigations complement imaging findings in determining increased iron levels in basal ganglia, but implicate perturbation of iron homeostasis even leading to reduction of bioavailable iron in pons and putamen in MSA. Mechanistic analyses of iron and α-SYN point to several potential regulatory interactions including iron induced OS promoting neuroinflammation and α-SYN aggregation. Whether dysregulation of brain iron homeostasis acts as an inductor of neurodegeneration or is an epiphenomenon of cellular death remains to be elucidated. Imaging technologies and consecutive examinations can address this question and, indeed, increased iron levels in putamen have been shown in early disease stages in MSA. Unfortunately, MRI features and corresponding histopathological measurements are scarce and postmortem tissues are usually obtained from patients with advanced disease. Further limitations constitute the inability of MRI to detect low molecular forms of iron, the varying biochemical/histopathological methods used to determine iron in MSA and of course the small sample sizes.
In conclusion, iron seems to play a yet poorly understood role in the dynamic pathogenesis of MSA in the context of neuroinflammation and OS, and clearly has been an undervalued component in the past. Considering no currently available treatment options in MSA, the goal is to identify treatable targets to establish disease-modifying therapies. The complexity and multifactorial nature of MSA requires multiple strategies. Iron chelators which may either reduce brain tissue iron content or modify pathological iron accumulation in specific cells [206] may be promising in this respect for MSA treatment [207]. Indeed, treatment with the oral iron chelator Deferiprone in IPD resulted in significant decrease of iron deposition in SN using MRI-based measurements and motor scales [208, 209]. To access this question systematically, we need good animal models to study MSA and to understand the contributing role of iron in this process. This may also help to evaluate the potential of iron targeting strategies by iron chelators or other iron trafficking modifiers such as calcium antagonists or anti-hepcidin treatments [210–212].
ACKNOWLEDGMENTS
This work was supported by grants of the Austrian Science Fund (FWF) W01206-08, I2102 and F4414, and by a grant of the European Community’s Seventh Framework Programme (FP7/2007-2013) under agreement n 603646 (Multisyn).
Authors’ disclosures available online (https://www.j-alz.com/manuscript-disclosures/17-0601r2).
REFERENCES
[1] | Ozawa T , Paviour D , Quinn NP , Josephs KA , Sangha H , Kilford L , Healy DG , Wood NW , Lees AJ , Holton JL , Revesz T ((2004) ) The spectrum of pathological involvement of the striatonigral and olivopontocerebellar systems in multiple system atrophy: Clinicopathological correlations. Brain 127: , 2657–2671. |
[2] | Stefanova N , Wenning GK ((2016) ) Multiple system atrophy: Emerging targets for interventional therapies. Neuropathol Appl Neurobiol 42: , 20–32. |
[3] | Stefanova N , Reindl M , Neumann M , Kahle PJ , Poewe W , Wenning GK ((2007) ) Microglial activation mediates neurodegeneration related to oligodendroglial α-synucleinopathy: Implications for multiple system atrophy. Mov Disord 22: , 2196–2203. |
[4] | Jellinger KA , Wenning GK ((2016) ) Multiple system atrophy: Pathogenic mechanisms and biomarkers. J Neural Transm (Vienna) 123: , 555–572. |
[5] | Jellinger KA ((2014) ) Neuropathology. In Multiple System Atrophy, Wenning GK, Fanciulli A, eds. Springer Wien Heidelberg Dordrecht London New York. pp. 17–56. |
[6] | Inoue M , Yagishita S , Ryo M , Hasegawa K , Amano N , Matsushita M ((1997) ) The distribution and dynamic density of oligodendroglial cytoplasmic inclusions (GCIs) in multiple system atrophy: A correlation between the density of GCIs and the degree of involvement of striatonigral and olivopontocerebellar systems. Acta Neuropathol 93: , 585–591. |
[7] | Moos T , Morgan EH ((2004) ) The significance of the mutated divalent metal transporter (DMT1) on iron transport into the Belgrade rat brain. J Neurochem 88: , 233–245. |
[8] | Zecca L , Youdim MB , Riederer P , Connor JR , Crichton RR ((2004) ) Iron, brain ageing and neurodegenerative disorders. Nat Rev Neurosci 5: , 863–873. |
[9] | Berg D , Hochstrasser H ((2006) ) Iron metabolism in Parkinsonian syndromes. Mov Disord 21: , 1299–1310. |
[10] | Abo-Krysha N , Rashed L ((2008) ) The role of iron dysregulation in the pathogenesis of multiple sclerosis: An Egyptian study. Mult Scler 14: , 602–608. |
[11] | Barnham KJ , Bush AI ((2008) ) Metals in Alzheimer’s and Parkinson’s diseases. Curr Opin Chem Biol 12: , 222–228. |
[12] | Schrag M , Mueller C , Oyoyo U , Smith MA , Kirsch WM ((2011) ) Iron, zinc and copper in the Alzheimer’s disease brain: A quantitative meta-analysis. Some insight on the influence of citation bias on scientific oinion. Prog Neurobiol 94: , 296–306. |
[13] | Rogers JT , Mikkilineni S , Cantuti-Castelvetri I , Smith DH , Huang X , Bandyopadhyay S , Cahill CM , Maccecchini ML , Lahiri DK , Greig NH ((2011) ) The alpha-synuclein 5’untranslated region targeted translation blockers: Anti-alpha synuclein efficacy of cardiac glycosides and Posiphen. J Neural Transm (Vienna) 118: , 493–507. |
[14] | Gaeta A , Hider RC ((2005) ) The crucial role of metal ions in neurodegeneration: The basis for a promising therapeutic strategy. Br J Pharmacol 146: , 1041–1059. |
[15] | Jellinger KA ((2013) ) The relevance of metals in the pathophysiology of neurodegeneration, pathological considerations. Int Rev Neurobiol 110: , 1–47. |
[16] | Thomas M , Jankovic J ((2004) ) Neurodegenerative disease and iron storage in the brain. Curr Opin Neurol 17: , 437–442. |
[17] | Hashimoto M , Hsu LJ , Xia Y , Takeda A , Sisk A , Sundsmo M , Masliah E ((1999) ) Oxidative stress induces amyloid-like aggregate formation of NACP/α-synuclein in vitro. Neuroreport 10: , 717–721. |
[18] | Paik SR , Shin HJ , Lee JH , Chang CS , Kim J ((1999) ) Copper(II)-induced self-oligomerization of α-synuclein. Biochem J 340: , 821–828. |
[19] | Ostrerova-Golts N , Petrucelli L , Hardy J , Lee JM , Farer M , Wolozin B ((2000) ) The A53T α-synuclein mutation increases iron-dependent aggregation and toxicity. J Neurosci 20: , 6048–6054. |
[20] | Crichton RR , Dexter DT , Ward RJ ((2011) ) Brain iron metabolism and its perturbation in neurological diseases. J Neural Transm (Vienna) 118: , 301–314. |
[21] | Dusek P , Jankovic J , Le W ((2012) ) Iron dysregulation in movement disorders. Neurobiol Dis 46: , 1–18. |
[22] | Ponka P ((1999) ) Cellular iron metabolism. Kidney Int Suppl 69: , 2–11. |
[23] | Ohgami RS , Campagna DR , Greer EL , Antiochos B , McDonald A , Chen J , Sharp JJ , Fujiwara Y , Barker JE , Fleming MD ((2005) ) Identification of a ferrireductase required for efficient transferrin-dependent iron uptake in erythroid cells. Nat Genet 37: , 1264–1269. |
[24] | Hentze MW , Muckenthaler MU , Galy B , Camaschella C ((2010) ) Two to tango: Regulation of Mammalian iron metabolism. Cell 142: , 24–38. |
[25] | Nairz M , Schroll A , Demetz E , Tancevski I , Theurl I , Weiss G ((2015) ) ’Ride on the ferrous wheel’–the cycle of iron in macrophages in health and disease. Immunobiology 220: , 280–294. |
[26] | Arosio P , Levi S ((2010) ) Cytosolic and mitochondrial ferritins in the regulation of cellular iron homeostasis and oxidative damage. Biochim Biophys Acta 1800: , 783–792. |
[27] | Loreal O , Cavey T , Bardou-Jacquet E , Guggenbuhl P , Ropert M , Brissot P ((2014) ) Iron, hepcidin, and the metal connection. Front Pharmacol 5: , 128. |
[28] | Rouault TA , Cooperman S ((2006) ) Brain iron metabolism. Semin Pediatr Neurol 13: , 142–148. |
[29] | Anderson CP , Shen M , Eisenstein RS , Leibold EA ((2012) ) Mammalian iron metabolism and its control by iron regulatory proteins. Biochim Biophys Acta 1823: , 1468–1483. |
[30] | Wardman P , Candeias LP ((1996) ) Fenton chemistry: An introduction. Radiat Res 145: , 523–531. |
[31] | Riederer P , Youdim MBH ((1993) ) Iron in central nervous system disorders, Springer, Vienna. |
[32] | Beard JL , Connor JR , Jones BC ((1993) ) Iron in the brain. Nutr Rev 51: , 157–170. |
[33] | Connor JR , Menzies SL , Burdo JR , Boyer PJ ((2001) ) Iron and iron management proteins in neurobiology. Pediatr Neurol 25: , 118–129. |
[34] | Benarroch EE ((2009) ) Brain iron homeostasis and neurodegenerative disease. Neurology 72: , 1436–1440. |
[35] | Fisher J , Devraj K , Ingram J , Slagle-Webb B , Madhankumar AB , Liu X , Klinger M , Simpson IA , Connor JR ((2007) ) Ferritin: A novel mechanism for delivery of iron to the brain and other organs. Am J Physiol Cell Physiol 293: , C641–649. |
[36] | Burdo JR , Simpson IA , Menzies S , Beard J , Connor JR ((2004) ) Regulation of the profile of iron-management proteins in brain microvasculature. J Cereb Blood Flow Metab 24: , 67–74. |
[37] | Rouault TA , Zhang DL , Jeong SY ((2009) ) Brain iron homeostasis, the choroid plexus, and localization of iron transport proteins. Metab Brain Dis 24: , 673–684. |
[38] | Burdo JR , Menzies SL , Simpson IA , Garrick LM , Garrick MD , Dolan KG , Haile DJ , Beard JL , Connor JR ((2001) ) Distribution of divalent metal transporter 1 and metal transport protein 1 in the normal and Belgrade rat. J Neurosci Res 66: , 1198–1207. |
[39] | Yang WM , Jung KJ , Lee MO , Lee YS , Lee YH , Nakagawa S , Niwa M , Cho SS , Kim DW ((2011) ) Transient expression of iron transport proteins in the capillary of the developing rat brain. Cell Mol Neurobiol 31: , 93–99. |
[40] | McCarthy RC , Kosman DJ ((2012) ) Mechanistic analysis of iron accumulation by endothelial cells of the BBB. Biometals 25: , 665–675. |
[41] | Sohn YS , Ghoti H , Breuer W , Rachmilewitz E , Attar S , Weiss G , Cabantchik ZI ((2012) ) The role of endocytic pathways in cellular uptake of plasma non-transferrin iron. Haematologica 97: , 670–678. |
[42] | Skjørringe T , Møller LB , Moos T ((2012) ) Impairment of interrelated iron- and copper homeostatic mechanisms in brain contributes to the pathogenesis of neurodegenerative disorders. Front Pharmacol 3: , 169. |
[43] | Skjørringe T , Burkhart A , Johnsen KB , Moos T ((2015) ) Divalent metal transporter 1 (DMT1) in the brain: Imlications for a role in iron transport at the blood-brain barrier, and neuronal and glial pathology. Front Mol Neurosci 8: , 19. |
[44] | Connor JR , Menzies SL , St Martin SM , Mufson EJ ((1990) ) Cellular distribution of transferrin, ferritin, and iron in normal and aged human brains. J Neurosci Res 27: , 595–611. |
[45] | Beard JL , Connor JD , Jones BC ((1993) ) Brain iron: Location and function. Prog Food Nutr Sci 17: , 183–221. |
[46] | Connor JR ((1994) ) Iron acquisition and expression of iron regulatory proteins in the developing brain: Maniulation by ethanol exposure, iron deprivation and cellular dysfunction. Dev Neurosci 16: , 233–247. |
[47] | Connor JR , Menzies SL ((1996) ) Relationship of iron to oligodendrocytes and myelination. Glia 17: , 83–93. |
[48] | Todorich B , Zhang X , Slagle-Webb B , Seaman WE , Connor JR ((2008) ) Tim-2 is the receptor for H-ferritin on oligodendrocytes. J Neurochem 107: , 1495–1505. |
[49] | Todorich B , Zhang X , Connor JR ((2011) ) H-ferritin is the major source of iron for oligodendrocytes. Glia 59: , 927–935. |
[50] | Hulet SW , Powers S , Connor JR ((1999) ) Distribution of transferrin and ferritin binding in normal and multiple sclerotic human brains. J Neurol Sci 165: , 48–55. |
[51] | Hulet SW , Heyliger SO , Powers S , Connor JR ((2000) ) Oligodendrocyte progenitor cells internalize ferritin via clathrin-dependent receptor mediated endocytosis. J Neurosci Res 61: , 52–60. |
[52] | Han J , Seaman WE , Di X , Wang W , Willingham M , Torti FM , Torti SV ((2011) ) Iron uptake mediated by binding of H-ferritin to the TIM-2 receptor in mouse cells. PLoS One 6: , e23800. |
[53] | Zecca L , Shima T , Stroppolo A , Goj C , Battiston GA , Gerbasi R , Sarna T , Swartz HM ((1996) ) Interaction of neuromelanin and iron in substantia nigra and other areas of human brain. Neuroscience 73: , 407–415. |
[54] | Galy B , Ferring-Appel D , Kaden S , Gröne HJ , Hentze MW ((2008) ) Iron regulatory proteins are essential for intestinal function and control key iron absorption molecules in the duodenum. Cell Metab 7: , 79–85. |
[55] | Snyder AM , Connor JR ((2009) ) Iron, the substantia nigra and related neurological disorders. Biochim Biophys Acta 1790: , 606–614. |
[56] | Hallgren B , Sourander P ((1958) ) The effect of age on the non-haemin iron in the human brain. J Neurochem 3: , 41–51. |
[57] | Chen JC , Hardy PA , Clauberg M , Joshi JG , Parravano J , Deck JH , Henkelman RM , Becker LE , Kucharczyk W ((1989) ) T2 values in the human brain: Comparison with quantitative assays of iron and ferritin. Radiology 173: , 521–526. |
[58] | Chen JC , Hardy PA , Kucharczyk W , Clauberg M , Joshi JG , Vourlas A , Dhar M , Henkelman RM ((1993) ) MR of human postmortem brain tissue: Correlative study between T2 and assays of iron and ferritin in Parkinson and Huntington disease. AJNR Am J Neuroradiol 14: , 275–281. |
[59] | Dexter DT , Carayon A , Javoy-Agid F , Agid Y , Wells FR , Daniel SE , Lees AJ , Jenner P , Marsden CD ((1991) ) Alterations in the levels of iron, ferritin and other trace metals in Parkinson’s disease and other neurodegenerative diseases affecting the basal ganglia. Brain 114: , 1953–1975. |
[60] | Griffiths PD , Crossman AR ((1993) ) Distribution of iron in the basal ganglia and neocortex in postmortem tissue in Parkinson’s disease and Alzheimer’s disease. Dementia 4: , 61–65. |
[61] | Riederer P , Sofic E , Rausch WD , Schmidt B , Reynolds GP , Jellinger K , Youdim MB ((1989) ) Transition metals, ferritin, glutathione, and ascorbic acid in parkinsonian brains. J Neurochem 52: , 515–520. |
[62] | Sofic E , Paulus W , Jellinger K , Riederer P , Youdim MB ((1991) ) Selective increase of iron in substantia nigra zona compacta of parkinsonian brains. J Neurochem 56: , 978–982. |
[63] | Ward RJ , Zucca FA , Duyn JH , Crichton RR , Zecca L ((2014) ) The role of iron in brain ageing and neurodegenerative disorders. Lancet Neurol 13: , 1045–1060. |
[64] | Drayer B , Burger P , Darwin R , Riederer S , Herfkens R , Johnson GA ((1986) ) MRI of brain iron. AJR Am J Roentgenol 147: , 103–110. |
[65] | Haacke EM , Cheng NY , House MJ , Liu Q , Neelavalli J , Ogg RJ , Khan A , Ayaz M , Kirsch W , Obenaus A ((2005) ) Imaging iron stores in the brain using magnetic resonance imaging. Magn Reson Imaging 23: , 1–25. |
[66] | Bartzokis G , Tishler TA , Lu PH , Villablanca P , Altshuler LL , Carter M , Huang D , Edwards N , Mintz J ((2007) ) Brain ferritin iron may influence age- and gender-related risks of neurodegeneration. Neurobiol Aging 28: , 414–423. |
[67] | Aquino D , Bizzi A , Grisoli M , Garavaglia B , Bruzzone MG , Nardocci N , Savoiardo M , Chiapparini L ((2009) ) Age-related iron deposition in the basal ganglia: Quantitative analysis in healthy subjects. Radiology 252: , 165–172. |
[68] | Bartzokis G , Lu PH , Tingus K , Peters DG , Amar CP , Tishler TA , Finn JP , Villablanca P , Altshuler LL , Mintz J , Neely E , Connor JR ((2011) ) Gender and iron genes may modify associations between brain iron and memory in healthy aging. Neuropsychopharmacology 36: , 1375–1384. |
[69] | Acosta-Cabronero J , Betts MJ , Cardenas-Blanco A , Yang S , Nestor PJ ((2016) ) In vivo MRI mapping of brain iron deposition across the adult lifespan. J Neurosci 36: , 364–374. |
[70] | Koeppen AH ((1995) ) The heterogeneous distribution of brain transferrin. J Neurol Sci 134: , 1–9. |
[71] | Bohic S , Murphy K , Paulus W , Cloetens P , Salomé M , Susini J , Double K ((2008) ) Intracellular chemical imaging of the developmental phases of human neuromelanin using synchrotron X-ray microspectroscopy. Anal Chem 80: , 9557–9566. |
[72] | Ben-Shachar D , Youdim MB ((1993) ) Iron, melanin and dopamine interaction: Relevance to Parkinson’s disease. Prog Neuropsychopharmacol Biol Psychiatry 17: , 139–150. |
[73] | Hare DJ , Double KL ((2016) ) Iron and dopamine: A toxic couple. Brain 139: , 1026–1035. |
[74] | Hare DJ , Lei P , Ayton S , Roberts BR , Grimm R , George JL , Bishop DP , Beavis AD , Donovan SJ , McColl G , Volitakis I , Masters CL , Adlard PA , Cherny RA , Bush AI , Finkelstein DI , Doble PA ((2014) ) An iron–dopamine index predicts risk of parkinsonian neurodegeneration in the substantia nigra pars compacta. Chem Sci 5: , 2160–2169. |
[75] | Wenning GK , Stefanova N , Jellinger KA , Poewe W , Schlossmacher MG ((2008) ) Multiple system atrophy: A primary oligodendrogliopathy. Ann Neurol 64: , 239–246. |
[76] | Dickson DW , Lin W , Liu WK , Yen SH ((1999) ) Multiple system atrophy: A sporadic synucleinopathy. Brain Pathol 9: , 721–732. |
[77] | Spokes EG , Bannister R , Oppenheimer DR ((1979) ) Multiple system atrophy with autonomic failure: Clinical, histological and neurochemical observations on four cases. J Neurol Sci 43: , 59–82. |
[78] | Lantos PL , Papp MI ((1994) ) Cellular pathology of multiple system atrophy: A review. J Neurol Neurosurg Psychiatry 57: , 129–133. |
[79] | Lang AE , Curran T , Provias J , Bergeron C ((1994) ) Striatonigral degeneration: Iron deposition in putamen correlates with the slit-like void signal of magnetic resonance imaging. Can J Neurol Sci 21: , 311–218. |
[80] | Kurisaki H , Yomono H , Murayama S , Hebisawa A ((2002) ) [Multiple system atrophy with a-/hypo-ceruloplasminemia: Distribution of iron in brains of 2 autopsy cases]. Rinsho Shinkeigaku 42: , 293–298. |
[81] | Jellinger KA ((2003) ) Neuropathological spectrum of synucleinopathies. Mov Disord 18: , 2–12. |
[82] | Matsusue E , Fujii S , Kanasaki Y , Sugihara S , Miyata H , Ohama E , Ogawa T ((2008) ) Putaminal lesion in multiple system atrophy: Postmortem MR-pathological correlations. Neuroradiology 50: , 559–567. |
[83] | Sian-Hulsmann J , Mandel S , Youdim MB , Riederer P ((2011) ) The relevance of iron in the pathogenesis of Parkinson’s disease. J Neurochem 118: , 939–957. |
[84] | Matsusue E , Fujii S , Kanasaki Y , Kaminou T , Ohama E , Ogawa T ((2009) ) Cerebellar lesions in multiple system atrophy: Postmortem MR imaging-pathologic correlations. AJNR Am J Neuroradiol 30: , 1725–1730. |
[85] | Kuiper MA , Mulder C , van Kamp GJ , Scheltens P , Wolters EC ((1994) ) Cerebrospinal fluid ferritin levels of patients with Parkinson’s disease, Alzheimer’s disease, and multiple system atrophy. J Neural Transm Park Dis Dement Sect 7: , 109–114. |
[86] | Dexter DT , Jenner P , Schapira AH , Marsden CD ((1992) ) Alterations in levels of iron, ferritin, and other trace metals in neurodegenerative diseases affecting the basal ganglia. The Royal Kings and Queens Parkinson’s Disease Research Group. Ann Neurol 32: , 94–100. |
[87] | Zucca FA , Segura-Aguilar J , Ferrari E , Muñoz P , Paris I , Sulzer D , Sarna T , Casella L , Zecca L ((2017) ) Interactions of iron, dopamine and neuromelanin pathways in brain aging and Parkinson’s disease. Prog Neurobiol 155: , 96–119. |
[88] | Wan W , Jin L , Wang Z , Wang L , Fei G , Ye F , Pan X , Wang C , Zhong C ((2017) ) Iron deposition leads to neuronal alpha-synuclein pathology by inducing autophagy dysfunction. Front Neurol 8: , 1. |
[89] | Texel SJ , Xu X , Harris ZL ((2008) ) Ceruloplasmin in neurodegenerative diseases. Biochem Soc Trans 36: , 1277–1281. |
[90] | Yomono H , Kurisaki H , Murayama S , Hebisawa A , Miyajima H , Takahashi Y ((2003) ) [An autopsy case of multiple system atrophy with a heteroallelic ceruloplasmin gene mutation]. Rinsho Shinkeigaku 43: , 398–402. |
[91] | Visanji NP , Collingwood JF , Finnegan ME , Tandon A , House E , Hazrati LN ((2013) ) Iron deficiency in parkinsonism: Region-specific iron dysregulation in Parkinson’s disease and multiple system atrophy. J Parkinsons Dis 3: , 523–537. |
[92] | Ludwiczek S , Aigner E , Theurl I , Weiss G ((2003) ) Cytokine-mediated regulation of iron transport in human monocytic cells. Blood 101: , 4148–4154. |
[93] | Weiss G , Goodnough LT ((2005) ) Anemia of chronic disease. N Engl J Med 352: , 1011–1023. |
[94] | Theurl I , Theurl M , Seifert M , Mair S , Nairz M , Rumpold H , Zoller H , Bellmann-Weiler R , Niederegger H , Talasz H , Weiss G ((2008) ) Autocrine formation of hepcidin induces iron retention in human monocytes. Blood 111: , 2392–2399. |
[95] | Stankiewitz JM , Neema M , Ceccarelli A ((2014) ) Iron and multiple sclerosis. Neurobiol Aging 35: , 51–58. |
[96] | Kirsch W , McAuley G , Holshouser B , Petersen F , Ayaz M , Vinters HV , Dickson C , Haacke EM , Britt 3rd , Larsen J , Kim I , Mueller C , Schrag M , Kido D ((2009) ) Serial Susceptibility Weighted MRI measures brain iron and microbleeds in dementia. J Alzheimers Dis 17: , 599–609. |
[97] | Schenck JF , Zimmermann EA ((2004) ) High-field magnetic resonance imaging of brain iron: Birth of a biomarker? NMR Biomed 17: , 433–445. |
[98] | Watanabe H , Ito M , Fukatsu H , Senda J , Atsuta N , Kaga T , Kato S , Katsuno M , Tanaka F , Hirayama M , Naganawa S , Sobue G ((2010) ) Putaminal magnetic resonance imaging features at various magnetic field strengths in multiple system atrophy. Mov Disord 25: , 1916–1923. |
[99] | Zhang J , Zhang Y , Wang J , Cai P , Luo C , Qian Z , Dai Y , Feng H ((2010) ) Characterizing iron deposition in Parkinson’s disease using susceptibility-weighted imaging: An in vivo MR study. Brain Res 1330: , 124–130. |
[100] | Schulz JB , Klockgether T , Petersen D , Jauch M , Müller-Schauenburg W , Spieker S , Voigt K , Dichgans J ((1994) ) Multiple system atrophy: Natural history, MRI morphology, and dopamine receptor imaging with 123IBZM-SPECT. J Neurol Neurosurg Psychiatry 57: , 1047–1056. |
[101] | Schrag A , Kingsley D , Phatouros C , Mathias CJ , Lees AJ , Daniel SE , Quinn NP ((1998) ) Clinical usefulness of magnetic resonance imaging in multiple system atrophy. J Neurol Neurosurg Psychiatry 65: , 65–71. |
[102] | Schrag A , Good CD , Miszkiel K , Morris HR , Mathias CJ , Lees AJ , Quinn NP ((2000) ) Differentiation of atypical parkinsonian syndromes with routine MRI. Neurology 54: , 697–702. |
[103] | Kraft E , Schwarz J , Trenkwalder C , Vogl T , Pfluger T , Oertel WH ((1999) ) The combination of hypointense and hyperintense signal changes on T2-weighted magnetic resonance imaging sequences: A specific marker of multiple system atrophy? Arch Neurol 56: , 225–228. |
[104] | Bhattacharya K , Saadia D , Eisenkraft B , Yahr M , Olanow W , Drayer B , Kaufmann H ((2002) ) Brain magnetic resonance imaging in multiple-system atrophy and Parkinson disease: A diagnostic algorithm. Arch Neurol 59: , 835–842. |
[105] | Savoiardo M ((2003) ) Differential diagnosis of Parkinson’s disease and atypical parkinsonian disorders by magnetic resonance imaging. Neurol Sci 24: , 35–37. |
[106] | Wang Y , Butros SR , Shuai X , Dai Y , Chen C , Liu M , Haacke EM , Hu J , Xu H ((2012) ) Different iron-deposition patterns of multiple system atrophy with predominant parkinsonism and idiopathetic Parkinson diseases demonstrated by phase-corrected susceptibility-weighted imaging. AJNR Am J Neuroradiol 33: , 266–273. |
[107] | Kume A , Shiratori M , Takahashi A , Kato T , Ito K , Tadokoro M , Sakuma S ((1992) ) Hemi-parkinsonism in multiple system atrophy: A PET and MRI study. J Neurol Sci 110: , 37–45. |
[108] | Vymazal J , Righini A , Brooks RA , Canesi M , Mariani C , Leonardi M , Pezzoli G ((1999) ) T1 and T2 in the brain of healthy subjects, patients with Parkinson disease, and patients with multiple system atrophy: Relation to iron content. Radiology 211: , 489–495. |
[109] | Kraft E , Trenkwalder C , Auer DP ((2002) ) T2*-weighted MRI differentiates multiple system atrophy from Parkinson’s disease. Neurology 59: , 1265–1267. |
[110] | Von Lewinski F , Werner C , Jörn T , Mohr A , Sixel-Döring F , Trenkwalder C ((2007) ) T2*-weighted MRI in diagnosis of multiple system atrophy: A practical approach for clinicians. J Neurol 254: , 1184–1188. |
[111] | Sugiyama A , Ito S , Suichi T , Sakurai T , Mukai H , Yokota H , Yonezu T , Kuwabara S ((2015) ) Putaminal hypointensity on T2*-weighted MR imaging is the most practically useful sign in diagnosing multiple system atrophy: A preliminary study. J Neurol Sci 349: , 174–178. |
[112] | Yoon RG , Kim SJ , Kim HS , Choi CG , Kim JS , Oh J , Chung SJ , Lee CS ((2015) ) The utility of susceptibility-weighted imaging for differentiating Parkinsonism-predominant multiple system atrophy from Parkinson’s disease: Correlation with 18F-flurodeoxyglucose positron-emission tomography. Neurosci Lett 584: , 296–301. |
[113] | Wang N , Yang H , Li C , Fan G , Luo X ((2017) ) Using ‘swallow-tail’ sign and putaminal hypointensity as biomarkers to distinguish multiple system atrophy from idiopathic Parkinson’s disease: A susceptibility-weighted imaging study. Eur Radiol 27: , 3174–3180. |
[114] | Stern MB , Braffman BH , Skolnick BE , Hurtig HI , Grossman RI ((1989) ) Magnetic resonance imaging in Parkinson’s disease and parkinsonian syndromes. Neurology 39: , 1524–1526. |
[115] | Borit A , Rubinstein L , Urich H ((1975) ) The striatonigral degenerations: Putaminal pigments and nosology. Brain 98: , 101–112. |
[116] | Gupta D , Saini J , Kesavadas C , Sarma PS , Kishore A ((2010) ) Utility of susceptibility-weighted MRI in differentiating Parkinson’s disease and atypical parkinsonism. Neuroradiology 52: , 1087–1094. |
[117] | Lee JH , Baik SK ((2011) ) Putaminal hypointensity in the parkinsonian variant of multiple system atrophy: Simple visual assessment using susceptibility-weighted imaging. J Mov Disord 4: , 60–63. |
[118] | Meijer FJ , van Rumund A , Fasen BA , Titulaer I , Aerts M , Esselink R , Bloem BR , Verbeek MM , Goraj B ((2015) ) Susceptibility-weighted imaging improves the diagnostic accuracy of 3T brain MRI in the work-up of parkinsonism. AJNR Am J Neuroradiol 36: , 454–460. |
[119] | Han YH , Lee JH , Kang BM , Mun CW , Baik SK , Shin YI , Park KH ((2013) ) Topographical differences of brain iron deposition between progressive supranuclear palsy and parkinsonian variant multiple system atrophy. J Neurol Sci 325: , 29–35. |
[120] | Lee JH , Han YH , Kang BM , Mun CW , Lee SJ , Baik SK ((2013) ) Quantitative assessment of subcortical atrophy and iron content in progressive supranuclear palsy and parkinsonian variant of multiple system atrophy. J Neurol 260: , 2094–2101. |
[121] | Lee JH , Kim TH , Mun CW , Kim TH , Han YH ((2015) ) Progression of subcortical atrophy and iron deposition in multiple system atrophy: A comparison between clinical subtypes. J Neurol 262: , 1876–1882. |
[122] | Jellinger KA ((2014) ) Neuropathology of multiple system atrophy: New thoughts about pathogenesis. Mov Disord 29: , 1720–1741. |
[123] | Deguchi K , Ikeda K , Kume K , Takata T , Kokudo Y , Kamada M , Touge T , Honjo N , Masaki T ((2015) ) Significance of the hot-cross bun sign on T2*-weighted MRI for the diagnosis of multiple system atrophy. J Neurol 262: , 1433–1439. |
[124] | Hwang I , Sohn CH , Kang KM , Jeon BS , Kim HJ , Choi SH , Yun TJ , Kim JH ((2015) ) Differentiation of parkinsonism-predominant multiple system atrophy from idiopathic parkinson disease using 3T susceptibility-weighted MR imaging, focusing on putaminal change and lesion asymmetry. AJNR Am J Neuroradiol 36: , 2227–2234. |
[125] | Ramli N , Nair SR , Ramli NM , Lim SY ((2015) ) Differentiating multiple-system atrophy from Parkinson’s disease. Clin Radiol 70: , 555–564. |
[126] | Tha KK , Terae S , Tsukahara A , Soma H , Morita R , Yabe I , Ito YM , Sasaki H , Shirato H ((2012) ) Hyperintense putaminal rim at 1.5 T: Prevalence in normal subjects and distinguishing features from multiple system atrophy. BMC Neurol 12: , 39. |
[127] | Gilman S , Wenning GK , Low PA , Brooks DJ , Mathias CJ , Trojanowski JQ , Wood NW , Colosimo C , Dürr A , Fowler CJ , Kaufmann H , Klockgether T , Lees A , Poewe W , Quinn N , Revesz T , Robertson D , Sandroni P , Seppi K , Vidailhet M ((2008) ) Second consensus statement on the diagnosis of multiple system atrophy. Neurology 71: , 670–976. |
[128] | Feng JY , Huang B , Yang WQ , Zhang YH , Wang LM , Wang LJ , Zhong XL ((2015) ) The putaminal abnormalities on 3.0T magnetic resonance imaging: Can they separate parkinsonism-predominant multiple system atrophy from Parkinson’s disease? Acta Radiol 56: , 322–328. |
[129] | Watanabe H , Saito Y , Terao S , Ando T , Kachi T , Mukai E , Aiba I , Abe Y , Tamakoshi A , Doyu M , Hirayama M , Sobue G ((2002) ) Progression and prognosis in multiple system atrophy: An analysis of 230 Japanese patients. Brain 125: , 1070–1083. |
[130] | Jellinger KA , Lantos PL ((2010) ) Papp-Lantos inclusions and the pathogenesis of multiple system atrophy: An update. Acta Neuropathol 119: , 657–667. |
[131] | Miller DW , Johnson JM , Solano SM , Hollingsworth ZR , Standaert DG , Young AB ((2005) ) Absence of alpha-synuclein mRNA expression in normal and multiple system atrophy oligodendroglia. J Neural Transm 112: , 1613–1624. |
[132] | Wakabayashi K , Takahashi H ((2006) ) Cellular pathology in multiple system atrophy. Neuropathology 26: , 338–345. |
[133] | Kisos H , Pukaß K , Ben-Hur T , Richter-Landsberg C , Sharon R ((2012) ) Increased neuronal α-synuclein pathology associates with its accumulation in oligodendrocytes in mice modeling α-synucleinopathies. PLoS One 7: , e46817. |
[134] | Rey NL , George S , Brundin P ((2016) ) Review: Spreading the word: Precise animal models and validated methods are vital when evaluating prion-like behaviour of alpha-synuclein. Neuropathol Appl Neurobiol 42: , 51–76. |
[135] | Reyes JF , Rey NL , Bousset L , Melki R , Brundin P , Angot E ((2014) ) Alpha-synuclein transfers from neurons to oligodendrocytes. Glia 62: , 387–398. |
[136] | Lema Tomé CM , Tyson T , Rey NL , Grathwohl S , Britschgi M , Brundin P ((2013) ) Inflammation and α-synuclein’s prion-like behavior in Parkinson’s disease–is there a link? Mol Neurobiol 47: , 561–574. |
[137] | Reynolds AD , Glanzer JG , Kadiu I , Ricardo-Dukelow M , Chaudhuri A , Ciborowski P , Cerny R , Gelman B , Thomas MP , Mosley RL , Gendelman HE ((2008) ) Nitrated alpha-synuclein-activated microglial profiling for Parkinson’s disease. J Neurochem 104: , 1504–1525. |
[138] | Reynolds AD , Kadiu I , Garg SK , Glanzer JG , Nordgren T , Ciborowski P , Banerjee R , Gendelman HE ((2008) ) Nitrated α-synuclein and microglial neuroregulatory activities. J Neuroimmune Pharmacol 3: , 59–74. |
[139] | Wu DC , Jackson-Lewis V , Vila M , Tieu K , Teismann P , Vadseth C , Choi DK , Ischiropoulos H , Przedborski S ((2002) ) Blockade of microglial activation is neuroprotective in the 1-methyl-4-phenyl-1,2,3,6-tetrahydropyridine mouse model of Parkinson's disease. J Neurosci 22: , 1763–1771. |
[140] | Fujiwara H , Hasegawa M , Dohmae N , Kawashima A , Masliah E , Goldberg MS , Shen J , Takio K , Iwatsubo T ((2002) ) Alpha-Synuclein is phosphorylated in synucleinopathy lesions. Nat Cell Biol 4: , 160–164. |
[141] | Smith WW , Margolis RL , Li X , Troncoso JC , Lee MK , Dawson VL , Dawson TM , Iwatsubo T , Ross CA ((2005) ) A-synuclein phosphorylation enhances eosinophilic cytoplasmic inclusion formation in SH-SY5Y cells. J Neurosci 25: , 5544–5552. |
[142] | Souza JM , Giasson BI , Chen Q , Lee VM , Ischiropoulos H ((2000) ) Dityrosine cross-linking promotes formation of stable α -synuclein polymers. Implication of nitrative and oxidative stress in the pathogenesis of neurodegenerative synucleinopathies. J Biol Chem 275: , 18344–18349. |
[143] | Uversky VN , Li J , Fink AL ((2001) ) Metal-triggered structural transformations, aggregation, and fibrillation of human alpha-synuclein. A possible molecular NK between Parkinson’s disease and heavy metal exposure. J Biol Chem 276: , 44284–44296. |
[144] | Paxinou E , Chen Q , Weisse M , Giasson BI , Norris EH , Rueter SM , Trojanowski JQ , Lee V , Ischiropoulos H ((2001) ) Induction of α-synuclein aggregation by intracellular nitrative insult. J Neurol 15: , 8053–8061. |
[145] | Kakimura J , Kitamura Y , Takata K , Kohno Y , Nomura Y , Taniguchi T ((2001) ) Release and aggregation of cytochrome c and α-synuclein are inhibited by the antiparkinsonian drugs, talipexole and pramipexole. Eur J Pharmacol 417: , 59–67. |
[146] | Junn E , Mouradian MM ((2002) ) Human α-synuclein over-expression increases intracellular reactive oxygen species levels and susceptibility to dopamine. Neurosci Lett 320: , 146–150. |
[147] | Saito Y , Kawashima A , Ruberu NN , Fujiwara H , Koyama S , Sawabe M , Arai T , Nagura H , Yamanouchi H , Hasegawa M , Iwatsubo T , Murayama S ((2003) ) Accumulation of phosphorylated α-synuclein in aging human brain. J Neuropathol Exp Neurol 62: , 644–654. |
[148] | Febbraro F , Giorgi M , Caldarola S , Loreni F , Romero-Ramos M ((2012) ) α-Synuclein expression is modulated at the translational level by iron. Neuroreport 23: , 576–580. |
[149] | Olivares D , Huang X , Branden L , Greig NH , Rogers JT ((2009) ) Physiological and pathological role of α-synuclein in Parkinson’s disease through iron mediated oxidative stress; the role of a putative iron-responsive element. Int J Mol Sci 10: , 1226–1260. |
[150] | Cole NB , Murphy DD , Lebowitz J , Di Noto L , Levine RL , Nussbaum RL ((2005) ) Metal-catalyzed oxidation of alpha-synuclein: Heling to define the relationship between oligomers, protofibrils, and filaments. J Biol Chem 280: , 9678–9690. |
[151] | Golts N , Snyder H , Frasier M , Theisler C , Choi P , Wolozin B ((2002) ) Magnesium inhibits spontaneous and iron-induced aggregation of alpha-synuclein. J Biol Chem 277: , 16116–161123. |
[152] | Götz ME , Double K , Gerlach M , Youdim MB , Riederer P ((2004) ) The relevance of iron in the pathogenesis of Parkinson’s disease. Ann N Y Acad Sci 1012: , 193–208. |
[153] | Peng Y , Wang C , Xu HH , Liu YN , Zhou F ((2010) ) Binding of α- synuclein with Fe(III) and with Fe(II) and biological implications of the resultant complexes. J Inorg Biochem 104: , 365–370. |
[154] | Levin J , Högen T , Hillmer A , Bader B , Schmidt F , Kretzschmar H , Bötzel K , Giese A ((2011) ) Generation of ferric iron links oxidative stress to α-synuclein oligomer formation. J Parkinsons Dis 1: , 205–216. |
[155] | Lu Y , Prudent M , Fauvet B , Lashuel HA , Girault HH ((2011) ) Phosphorylation of α-synuclein at Y125 and S129 alters its metal binding properties: Implications for understanding the role of α-synuclein in the pathogenesis of Parkinson’s disease and related disorders. ACS Chem Neurosci 2: , 667–675. |
[156] | Davies P , Moualla D , Brown DR ((2011) ) Alpha-synuclein is a cellular ferrireductase. PLoS One 6: , e15814. |
[157] | Brown DR ((2013) ) α-Synuclein as a ferrireductase. Biochem Soc Trans 41: , 1513–1517. |
[158] | Sofic E , Riederer P , Heinsen H , Beckmann H , Reynolds GP , Hebenstreit G , Youdim MB ((1988) ) Increased iron (III) and total iron content in post mortem substantia nigra of parkinsonian brain. J Neural Transm 74: , 199–205. |
[159] | Montes S , Rivera-Mancia S , Diaz-Ruiz A , Tristan-Lopez L , Rios C ((2014) ) Copper and copper proteins in Parkinson’s disease. Oxid Med Cell Longev 2014: , 147251. |
[160] | Friedlich AL , Tanzi RE , Rogers JT ((2007) ) The 5’-untranslated region of Parkinson’s disease α-synuclein messengerRNA contains a predicted iron responsive element. Mol Psychiatry 12: , 222–323. |
[161] | Li YH , Gao N , Ye YW , Li X , Yu S , Yang H , Uéda K , Chan P ((2011) ) Alpha-synuclein functions as a negative regulator for expression of tyrosine hydroxylase. Acta Neurol Belg 111: , 130–135. |
[162] | Mills JD , Ward M , Kim WS , Halliday GM , Janitz M ((2016) ) Strand-specific RNA-sequencing analysis of multiple system atrophy brain transcriptome. Neuroscience 322: , 234–250. |
[163] | Juurlink BH ((1997) ) Response of glial cells to ischemia: Roles of reactive oxygen species and glutathione. Neurosci Biobehav Rev 21: , 151–166. |
[164] | Thorburne SK , Juurlink BH ((1996) ) Low glutathione and high iron govern the susceptibility of oligodendroglial precursors to oxidative stress. J Neurochem 67: , 1014–1022. |
[165] | Domercq M , Sanchez-Gomez MV , Sherwin C , Etxebarria E , Fern R , Matute C ((2007) ) System xc- and glutamate transporter inhibition mediates microglial toxicity to oligodendrocytes. J Immunol 178: , 6549–6556. |
[166] | Jurewicz A , Matysiak M , Tybor K , Kilianek L , Raine CS , Selmaj K ((2005) ) Tumour necrosis factor-induced death of adult human oligodendrocytes is mediated by apoptosis inducing factor. Brain 128: , 2675–2688. |
[167] | Stefanova N , Klimaschewski L , Poewe W , Wenning GK , Reindl M ((2001) ) Glial cell death induced by overexpression of alpha-synuclein. J Neurosci Res 65: , 432–438. |
[168] | Stefanova N , Schanda K , Klimaschewski L , Poewe W , Wenning GK , Reindl M ((2003) ) Tumor necrosis factor-alpha-induced cell death in U373 cells overexpressing alpha-synuclein. J Neurosci Res 73: , 334–340. |
[169] | Gerhard A , Banati RB , Goerres GB , Cagnin A , Myers R , Gunn RN , Turkheimer F , Good CD , Mathias CJ , Quinn N , Schwarz J , Brooks DJ ((2003) ) [11C]-(R)-PK11195 PET imaging of microglial activation in multiple system atrophy. Neurology 61: , 686–689. |
[170] | Chung CY , Koprich JB , Siddiqi H , Isacson O ((2009) ) Dynamic changes in presynaptic and axonal transport proteins combined with striatal neuroinflammation precede dopaminergic neuronal loss in a rat model of AAV alpha-synucleinopathy. J Neurosci 29: , 3365–3373. |
[171] | Theodore S , Cao S , McLean PJ , Standaert DG ((2008) ) Targeted overexpression of human alpha-synuclein triggers microglial activation and an adaptive immune response in a mouse model of Parkinson disease. J Neuropathol Exp Neurol 67: , 1149–1158. |
[172] | Lastres-Becker I , Ulusoy A , Innamorato NG , Sahin G , Rábano A , Kirik D , Cuadrado A ((2012) ) α-Synuclein expression and Nrf2 deficiency cooperate to aggravate protein aggregation, neuronal death and inflammation in early-stage Parkinson’s disease. Hum Mol Genet 21: , 3173–3192. |
[173] | Gao HM , Kotzbauer PT , Uryu K , Leight S , Trojanowski JQ , Lee VM ((2008) ) Neuroinflammation and oxidation/nitration of alpha-synuclein linked to dopaminergic neurodegeneration. J Neurosci 28: , 7687–7698. |
[174] | Ishizawa K , Komori T , Sasaki S , Arai N , Mizutani T , Hirose T ((2004) ) Microglial activation parallels system degeneration in multiple system atrophy. J Neuropathol Exp Neurol 63: , 43–52. |
[175] | van Rossum D , Hanisch UK ((2004) ) Microglia. Metab Brain Dis 19: , 393–411. |
[176] | del Rio-Hortega P ((1932) ) Microglia. In Cytology and cellular pathology of the nervous system. Penfield W, Hoeber PB, eds. New York, pp. 483–534. |
[177] | Glanzer JG , Enose Y , Wang T , Kadiu I , Gong N , Rozek W , Liu J , Schlautman JD , Ciborowski PS , Thomas MP , Gendelman HE ((2007) ) Genomic and proteomic microglial profiling: Pathways for neuroprotective inflammatory responses following nerve fragment clearance and activation. J Neurochem 102: , 627–645. |
[178] | Qian L , Flood PM , Hong JS ((2010) ) Neuroinflammation is a key player in Parkinson’s disease and a prime target for therapy. J Neural Transm 117: , 971–979. |
[179] | Qian L , Flood PM ((2008) ) Microglial cells and Parkinson’s disease. Immunol Res 41: , 155–164. |
[180] | Tansey MG , Goldberg MS ((2010) ) Neuroinflammation in Parkinson’s disease: Its role in neuronal death and implications for therapeutic intervention. Neurobiol Dis 37: , 510–518. |
[181] | Eklind S , Hagberg H , Wang X , Sävman K , Leverin AL , Hedtjärn M , Mallard C ((2006) ) Effect of lipopolysaccharide on global gene expression in the immature rat brain. Pediatr Res 60: , 161–168. |
[182] | Appel K , Honegger P , Gebicke-Haerter PJ ((1995) ) Expression of interleukin-3 and tumor necrosis factorbeta mRNAs in cultured microglia. J Neuroimmunol 60: , 83–91. |
[183] | Buttini M , Boddeke H ((1995) ) Peripheral lipopolysaccharide stimulation induces interleukin-1 beta messenger RNA in rat brain microglial cells. Neuroscience 65: , 523–530. |
[184] | Dean JM , Wang X , Kaindl AM , Gressens P , Fleiss B , Hagberg H , Mallard C ((2010) ) Microglial MyD88 signaling regulates acute neuronal toxicity of LPS-stimulated microglia in vitro. Brain Behav Immun 24: , 776–783. |
[185] | Fellner L , Jellinger KA , Wenning GK , Stefanova N ((2011) ) Glial dysfunction in the pathogenesis of α-synucleinopathies: Emerging concepts. Acta Neuropathol 121: , 675–693. |
[186] | Vieira BD , Radford RA , Chung RS , Guillemin GJ , Pountney DL ((2015) ) Neuroinflammation in multiple system atrophy: Response to and cause of α-synuclein aggregation. Front Cell Neurosci 9: , 437. |
[187] | Sanchez-Guajardo V , Tentillier N , Romero-Ramos M ((2015) ) The relation between α-synuclein and microglia in Parkinson’s disease: Recent developments. Neuroscience 302: , 47–58. |
[188] | Zhang W , Wang T , Pei Z , Miller DS , Wu X , Block ML , Wilson B , Zhang W , Zhou Y , Hong JS , Zhang J ((2005) ) Aggregated alpha-synuclein activates microglia: A process leading to disease progression in Parkinson’s disease. FASEB J 19: , 533–542. |
[189] | Beraud D , Twomey M , Bloom B , Mittereder A , Ton V , Neitzke K , Chasovskikh S , Mhyre TR , Maguire-Zeiss KA ((2011) ) alpha-Synuclein alters toll-like receptor expression. Front Neurosci 5: , 80. |
[190] | Lee EJ , Woo MS , Moon PG , Baek MC , Choi IY , Kim WK , Junn E , Kim HS ((2010) ) Alpha-synuclein activates microglia by inducing the expressions of matrix metalloproteinases and the subsequent activation of protease-activated receptor-1. J Immunol 185: , 615–623. |
[191] | Alvarez-Erviti L , Couch Y , Richardson J , Cooper JM , Wood MJ ((2011) ) Alpha-synuclein release by neurons activates the inflammatory response in a microglial cell line. Neurosci Res 69: , 337–342. |
[192] | Benner EJ , Banerjee R , Reynolds AD , Sherman S , Pisarev VM , Tsiperson V , Nemachek C , Ciborowski P , Przedborski S , Mosley RL , Gendelman HE ((2008) ) Nitrated alpha-synuclein immunity accelerates degeneration of nigral dopaminergic neurons. PLoS One 3: , e1376. |
[193] | Fellner L , Irschick R , Schanda K , Reindl M , Klimaschewski L , Poewe W , Wenning GK , Stefanova N ((2013) ) Toll-like receptor 4 is required for α-synuclein dependent activation of microglia and astroglia. Glia 61: , 349–360. |
[194] | Stefanova N , Fellner L , Reindl M , Masliah E , Poewe W , Wenning GK ((2011) ) Toll-like receptor 4 promotes alpha-synuclein clearance and survival of nigral dopaminergic neurons. Am J Pathol 179: , 954–963. |
[195] | Lee HJ , Suk JE , Bae EJ , Lee SJ ((2008) ) Clearance and deposition of extracellular alpha-synuclein aggregates in microglia. Biochem Biophys Res Commun 372: , 423–428. |
[196] | Rogers J , Mastroeni D , Leonard B , Joyce J , Grover A ((2007) ) Neuroinflammation in Alzheimer’s disease and Parkinson’s disease: Are microglia pathogenic in either disorder? Int Rev Neurobiol 82: , 235–246. |
[197] | Gagne JJ , Power MC ((2010) ) Anti-inflammatory drugs and risk of Parkinson disease: A meta-analysis. Neurology 74: , 995–1002. |
[198] | Weiss G ((2002) ) Iron and immunity: A double-edged sword. Eur J Clin Invest 32: , 70–78. |
[199] | Su X , Maguire-Zeiss KA , Giuliano R , Prifti L , Venkatesh K , Federoff HJ ((2008) ) Synuclein activates microglia in a model of Parkinson’s disease. Neurobiol Aging 29: , 1690–1701. |
[200] | Bartels AL , Willemsen AT , Doorduin J , de Vries EF , Dierckx RA , Leenders KL ((2010) ) [11C]-PK11195 PET: Quantification of neuroinflammation and a monitor of anti-inflammatory treatment in Parkinson’s disease? Parkinsonism Relat Disord 16: , 57–59. |
[201] | Su X , Federoff HJ , Maguire-Zeiss KA ((2009) ) Mutant α-synuclein overexpression mediates early proinflammatory activity. Neurotox Res 16: , 238–254. |
[202] | Zecca L , Stroppolo A , Gatti A , Tampellini D , Toscani M , Gallorini M , Giaveri G , Arosio P , Santambrogio P , Fariello RG , Karatekin E , Kleinman MH , Turro N , Hornykiewicz O , Zucca FA ((2004) ) The role of iron and copper molecules in the neuronal vulnerability of locus coeruleus and substantia nigra during aging. Proc Natl Acad Sci U S A 101: , 9843–9848. |
[203] | Zhang J , Stanton DM , Nguyen XV , Liu M , Zhang Z , Gash D , Bing G ((2005) ) Intrapallidal lipopolysaccharide injection increases iron and ferritin levels in glia of the rat substantia nigra and induces locomotor deficits. Neuroscience 135: , 829–838. |
[204] | Grünblatt E , Mandel S , Youdim MB ((2000) ) Neuroprotective strategies in Parkinson’s disease using the models of 6-hydroxydopamine and MPTP. Ann N Y Acad Sci 899: , 262–273. |
[205] | Youdim MB , Grünblatt E , Mandel S ((1999) ) The pivotal role of iron in NF-kappa B activation and nigrostriatal dopaminergic neurodegeneration. Prospects for neuroprotection in Parkinson’s disease with iron chelators. Ann N Y Acad Sci 890: , 7–25. |
[206] | Sohn YS , Mitterstiller AM , Breuer W , Weiss G , Cabantchik ZI ((2011) ) Rescuing iron-overloaded macrophages by conservative relocation of the accumulated metal. Br J Pharmacol 164: , 406–418. |
[207] | Sohn YS , Breuer W , Munnich A , Cabantchik ZI ((2008) ) Redistribution of accumulated cell iron: A modality of chelation with therapeutic implications. Blood 111: , 1690–1699. |
[208] | Grolez G , Moreau C , Sablonnière B , Garçon G , Devedjian JC , Meguig S , Gelé P , Delmaire C , Bordet R , Defebvre L , Cabantchik IZ1 , Devos D ((2015) ) Ceruloplasmin activity and iron chelation treatment of patients with Parkinson’s disease. BMC Neurol 15: , 74. |
[209] | Devos D , Moreau C , Devedjian JC , Kluza J , Petrault M , Laloux C , Jonneaux A , Ryckewaert G , Garçon G , Rouaix N , Duhamel A , Jissendi P , Dujardin K , Auger F , Ravasi L , Hopes L , Grolez G , Firdaus W , Sablonnière B , Strubi-Vuillaume I , Zahr N , Destée A , Corvol JC , Pöltl D , Leist M , Rose C , Defebvre L , Marchetti P , Cabantchik ZI , Bordet R ((2014) ) Targeting chelatable iron as a therapeutic modality in Parkinson’s disease. Antioxid Redox Signal 21: , 195–210. |
[210] | Ludwiczek S , Theurl I , Muckenthaler MU , Jakab M , Mair SM , Theurl M , Kiss J , Paulmichl M , Hentze MW , Ritter M , Weiss G ((2007) ) Ca(2+) channel blockers reverse iron overload by a new mechanism via divalent metal transporter-1. Nat Med 13: , 448–454. |
[211] | Sun CC , Vaja V , Chen S , Theurl I , Stepanek A , Brown DE , Cappellini MD , Weiss G , Hong CC , Lin HY , Babitt JL ((2013) ) A hepcidin lowering agent mobilizes iron for incorporation into red blood cells in an adenine-induced kidney disease model of anemia in rats. Nephrol Dial Transplant 28: , 1733–1743. |
[212] | Poli M , Asperti M , Ruzzenenti P , Regoni M , Arosio P ((2014) ) Hepcidin antagonists for potential treatments of disorders with hepcidin excess. Front Pharmacol 5: , 86. |


