
Deficit in Central Auditory Processing as a Biomarker of Pre-Clinical Alzheimer’s Disease
Abstract
Prevention of dementia due to Alzheimer’s disease (d/AD) requires interventions that slow the disease process prior to symptom onset. To develop such interventions, one needs metrics that assess pre-symptomatic disease progression. Familiar measures of progression include cerebrospinal fluid (CSF) biochemical and imaging analyses, as well as cognitive testing. Changes in the latter can sometimes be difficult to distinguish from effects of “normal” aging. A different approach involves testing of “central auditory processing” (CAP), which enables comprehension of auditory stimuli amidst a distracting background (e.g., conversation in a noisy bar or restaurant). Such comprehension is often impaired in d/AD. Similarly, effortful or diminished auditory comprehension is sometimes reported by cognitively healthy elders, raising the possibility that CAP deficit may be a marker of pre-symptomatic AD. In 187 cognitively and physically healthy members of the aging, AD family history-positive PREVENT-AD cohort, we therefore evaluated whether CAP deficits were associated with known markers of AD neurodegeneration. Such markers included CSF tau concentrations and magnetic resonance imaging volumetric and cortical thickness measures in key AD-related regions. Adjusting for age, sex, education, pure-tone hearing, and APOE ɛ4 status, we observed a persistent relationship between CAP scores and CSF tau levels, entorhinal and hippocampal cortex volumes, cortical thickness, and deficits in cognition (Repeatable Battery for Assessment of Neuropsychological Status total score, and several of its index scales). These cross-sectional observations suggest that CAP may serve as a novel metric for pre-symptomatic AD pathogenesis. They are therefore being followed up longitudinally with larger samples.
INTRODUCTION
The repeated failure to identify successful treatments for dementia due to Alzheimer’s disease (d/AD) suggests that dementia symptoms signify massive damage to the brain [1]. By contrast, a decades-long process of pre-symptomatic brain changes [2] affords a window of opportunity for preventive interventions [3]. The pre-symptomatic stages of AD can cause subtle changes in cognition [4], but these are mostly silent or indistinguishable from normal age-related cognitive decline [5]. To assess real-time effects of potential AD preventives, one therefore needs other measures of their effects.
Several biomarkers [6–10] trace the progress of AD evolution from mild cognitive impairment (MCI) to dementia, but less is known about markers that reveal change before persons have a cognitive diagnosis. Along with changes in biochemical, imaging, or sensitive cognitive performance measures [9, 11–14], the progress of pre-symptomatic AD may be revealed by diminished sensori-neural functions such as odor identification [15] or capacity to differentiate among simultaneous streams ofconversation.
Difficulty when listening in noise is a frequent complaint among cognitively intact normal elderly [16], as it often requires intense listening [17] or compensatory cognitive effort [18]. Auditory discrimination in such circumstances relies on intact abilities in central auditory processing (CAP), a term that refers to integrated neural processing of auditory information, being related to several higher-order measures of cognition [19], including attention and executive functioning [20, 21], and working memory [22, 23].
CAP dysfunction, a common disability in patients with d/AD, often results in auditory processing deficits not attributable to common sensorineural hearing loss (presbycusis) [24, 25]. In particular, such patients have difficulty comprehending speech in noisy or crowded settings [26–28], separating or grouping different sound sources in the auditory environment [29–31], or differentiating different messages presented concurrently to the two ears [32–36]. As well, presumably because of neurodegenerative deficits in inter-hemispheric communication or integrity [37], they may display a disproportionate “right ear advantage”, i.e., decreased comprehension of information presented to the left ear [27, 38]. MCI patients typically show similar but lesser difficulties [39] that are, nonetheless, distinct from those associated with subjective memory complaints only [25]. Importantly, impairment in these abilities in symptomatic persons is related to areas of the brain that are particularly vulnerable to AD neurodegeneration [29–31].
An important prior study had shown that CAP dysfunction, revealed by a test of dichotic sentence identification, predicted onset of dementia within four years, with a remarkable hazard ratio of 9.9 [32]. We therefore sought to verify whether central auditory dysfunction, alongside classic neuro-cognitive test deficits [13, 14], neuropathological markers [11], and neuroimaging changes [9, 12], could indicate the evolution of pre-clinical AD [20].
MATERIALS AND METHODS
Participants
We studied 187 members of the PREVENT-AD cohort, a high-risk group of aging cognitively intact persons (the range of scores on the Montreal Cognitive Assessment was from 23–30). Screening and eligibility for this cohort have been described elsewhere [40]. Briefly, participants were 60 or more years old and cognitively and physically healthy, but had a parent or multiple siblings affected by AD-like dementia. Persons aged 55–59 were also eligible if their parents’ or siblings’ onset of symptoms occurred at an age ≤15 years beyond their own present age. The relatives’ history of illness was revealed by careful family history review with reference to health records when available. When relatives’ diagnoses of dementia had been made by physicians without training in dementia assessment, they were reviewed using an informant questionnaire that established gradual onset and relatively smooth progression of symptoms, with no other obvious explanation [41]. As part of the nested randomized placebo-controlled INTREPAD pharmaco-prevention trial, a proportion of PREVENT-AD participants had also agreed to undergo serial lumbar punctures, analysis of which provided important information for thisstudy.
Auditory test battery
Participating INTREPAD and remaining PREVENT-AD participants underwent a battery of four auditory tasks. A Madsen Itera audiometer was used to control the frequency and level of stimuli. Attached to the audiometer were TDH-39 headphones through which the participant heard each stimulus, presented via an iPod Touch device.
1. General hearing screening
Participants underwent a hearing screening test. They heard a series of pure tones presented at a hearing level (HL) of 20 decibels (dB) to each ear separately. Tones at frequencies of 500 Hz (low-frequency), 1000 Hz (mid-frequency), and 4000 Hz (high frequency) were presented [42, 43] up to three times. Over these trials, participants were required successfully to indicate perception of all three tones. For participants having previously diagnosed or subjective difficulty with one ear, the better ear was tested first. Otherwise, the right ear was tested first.
2. Sentence identification in quiet
Testing of auditory abilities relied on tests that employed ten “pseudo-sentences” read aloud in a prescribed manner [44]. The nonsensical pseudo-sentences were used as relatively “pure” stimuli intended to avoid the influence of abilities in language comprehension and semantic interpretation. Instead, the stimuli were constructed using conditional probabilities of word sequences wherein each new word in the “sentence” was conditioned upon it’s typical co-occurrence with the two preceding words. The ten “sentences” were also matched for vocabulary and word familiarity, word length, “sentence” length, and syntactical structure [44].
In each ear, we determined a comfortable loudness level at which participants could identify the sentences in quiet (five to each ear).
Sound levels were adjusted using 5 dB increments over the sequence of sentences until we determined a comfortable level, which was then incorporated into the next two tasks. “Sentence” recognition itself was evidenced by the participant’s identification of a “sentence” number indicated on a referencecard.
3. Synthetic Sentence with Ipsilateral Competing Message (SSI-ICM)
This test involves identifying the ten pseudo-sentences heard over a competing narrative story [44]. The SSI-ICM is regarded as a test of auditory “closure,” i.e., the ability to fill in the missing components of words in the presence of background noise [45]. Because 90% of participants were francophones, we used the Canadian French version of the task developed by Normandin and Lynch [46]. A female voice speaks the “sentences.” The same speaker tells a continuous background story as the competing message. Both the sentence and the narrative are presented to the same(ipsilateral) ear.
The relative level of the SSI sentences and the competing message (message-to-competition ratio, MCR) can be varied from +10 dB (sentences 10 dB louder than story) to –10 dB MCR (sentences 10 dB down relative to story). The –10 dB condition increases the task difficulty, while the +10 dB MCR provides “control” on task comprehension. We chose the –10 dB condition as the standard SSI-ICM condition for testing, and also used the worse ear score (the lesser score in the right versus left ear) as per Gates, Anderson et al. [32].
4. Dichotic Sentence Identification (DSI)
The DSI tests dichotic listening by presenting two different pseudo-sentences simultaneously to the two ears. This test assesses abilities in binaural integration, i.e., ability to integrate stimuli heard from both ears at once [47]. Using the same “sentences” as the SSI-ICM, the participant is now asked to identify both presented stimuli from the printed list of ten pseudo-sentences. There is no request to identify the ears in which the “sentences” were heard (i.e., “free report mode” per [48]). We again used a Canadian French adaptation as established by Normandin and Lynch [46].
The principal DSI metric was the “worse ear score” (WES, the lesser score in the right versus left ear), but we also measured the right ear advantage (REA, i.e., right minus left ear score).
Genetic testing
DNA extraction, PCR amplification and genotyping of APOE from blood samples was obtained as previously described [49]. DNA extraction from buffy coat samples was performed using the QiaSymphony DNA mini kit (Qiagen, Toronto, ON, Canada). APOE genotyping was determined via PyroMark Q96 pyrosequencer (Qiagen, Toronto, ON, Canada). RT-PCR with the following primers was used for DNA amplification: forward primers 5’- ACGGCTGTCCAAGGAGCTG-3’ (rs429358) and 5’-CTCCGCGATGCCGATGAC-3’ (rs7412), and reverse biotinylated primers 5’-CACCTCGCCGCGGTACTG-3’ (rs429358) and 5’-CCCCGGCCTGGTACACTG-3’ (rs7412). The following primers were used for DNA sequencing: 5’-CGGACATGGAGGACG-3’ (rs429358) and 5’-CGATGACCTGCAGAAG-3’ (rs7412).
Cognition
All participants in both the INTREPAD trial and the remaining cohort underwent cognitive testing using a Canadian French translation of the Repeatable Battery for the Assessment of Neuropsychological Status (RBANS) [50]. The RBANS is a brief (30-min), test that is used commonly for the assessment of cognitive abilities in persons who are normal and at risk, or who have mild disability. The battery yields five Index Scores and a Total Scale score, each ranging from 40–160 points (participants in the present study ranging from 79–139). Other assessments included a health history and review of systems, as well as a neurologicalexamination.
Cerebrospinal fluid (CSF)
Lumbar puncture was performed after participants had fasted overnight. A neurologist (P. R-N.) inserted a sterile 24 gauge Sprotte atraumatic spinal needle in the L4-L5 interspace to withdraw 29 ml of CSF (yielding clinical lab samples and 25 0.5 ml aliquots). The latter were quick-frozen on dry ice and stored thereafter at -80C. CSF proteins were analyzed via ELISA using the Innogenetics Innotest kits for Aβ42, total-tau, and P-tau.
Magnetic resonance imaging (MRI)
All imaging was performed at the Cerebral Imaging Centre at the Douglas Mental Health University Institute. Structural MRI was performed on a 3T Siemens Trio scanner lying supine while wearing a standard 12-channel head coil. Whole brain cortical thickness data were analyzed via Matlab using CIVET 1.12 [51] and Random Field Theory (RFT), with a threshold of p < 0.1. SurfStat was used to correct for multiple comparisons. MRI volumetric analysis for the hippocampi and entorhinal cortices was performed using template segmentation of Collins and Pruessner [52].
Statistical analyses
Conventional software (MATLAB and SPSS) was used for data analysis, identifying as dependent variables the three CAP scores SSI-ICM, DSI-WES, and DSI-REA. Because the first two did not follow a normal distribution, we used a normalization technique described by Templeton and colleagues, which percentile ranks each score and then applies an inverse-normal transformation to create a distribution of z-scores [53]. We used robust-fit linear regression, to assess relationships between CAP scores and age, education, cognitive scores, CSF biomarkers, and structural MRI markers.
Ethics
This study received ethics approval from the Research Ethics Board of the Douglas Mental Health University Research Centre. Participants provided informed consent for all described procedures, which were conducted within guidelines of the Declaration of Helsinki, 1975.
RESULTS
Sample characteristics
Data were analyzed from 177 eligible participants who performed both the SSI-ICM and the DSI, as well as an additional ten participants who completed only the DSI (typically because of time constraints). Importantly, there was no multicollinearity between independent variables in these models.
Table 1 provides demographic and related characteristics for this sample. Participants were younger than is common for studies of aging cohorts [54, 55] and were well educated. Females predominated and, predictably in a family history-positive cohort, there was notable enrichment (37.4%) in persons with at least one APOE ɛ4 allele. Also, predictably in a sample of this age [56], two thirds of participants failed the tone hearing screening test. Average scores for both the SSI-ICM and DSI-WES were minimally, if at all, diminished compared to previously reported values [32, 57]. As is common, the DSI showed better performance in the right ear than in the left ear, with mean scores higher by 1.26. The DSI-WES and DSI-REA were not collinear, having a toleranceof 0.4.
Table 1
Sample characteristics
| Total Sample (n = 187) | |
| Age, y (s.d.) | 64.05 (5.15) |
| Education, y (s.d.) | 14.89 (3.15) |
| Gender, M/F | 48/139 |
| APOE ɛ4 status (+/-) | 70/117 |
| Tone test, pass/fail | 49/138 |
| SSI-ICM, mean (s.d.) | 7.14 (2.07) |
| DSI-WES, mean (s.d.) | 7.78 (2.09) |
| DSI-REA, mean (s.d.) | +1.26 (2.38) |
| RBANSTOTAL, mean (s.d.) | 101.36 (11.13) |
Relation of scores to tone test, age, gender, education, and APOE ɛ4 status
Table 2 shows results of robust-fit linear regression models. Both SSI-ICM and DSI-WES declined with age despite adjustment for other covariates, and the DSI-REA increased with age. Women generally performed better on both tests. All three CAP scores were associated with education, but (perhaps surprisingly) not with APOE ɛ4 carrier status or tone test performance. Although a difference in CAP scores was observed between those who “passed” and “failed” the tone test, this difference did not surviveadjustment for the other covariates. Even so, we retained APOE ɛ4 carrier status and tone test performance in all models as a conservative practice. Tinnitus, observed in 15 individuals, was not apparently related to CAP test scores. A previously-diagnosed hearing impairment was noted among 23 individuals, all of whom were noted as “failures” on the current hearingscreening.
Table 2
Robust-fit linear regression models of covariates as predictors of three CAP test scores
| Covariate | SSI-ICM n = 177 | DSI-WES n = 187 | DSI-REA n = 187 | |||||||||
| β | SE | tStat | p | β | SE | tStat | p | β | SE | tStat | p | |
| Tone test | 0.261 | 0.326 | 0.801 | 0.424 | 0.050 | 0.346 | 0.143 | 0.886 | 0.050 | 0.374 | 0.133 | 0.894 |
| Gender | 0.841 | 0.321 | 2.62 | 0.010 | 1.012 | 0.330 | 3.06 | 0.003 | –1.225 | 0.361 | –3.39 | 0.001 |
| APOE ɛ4 status | 0.445 | 0.280 | 1.59 | 0.114 | 0.320 | 0.292 | 1.10 | 0.274 | 0.014 | 0.319 | 0.043 | 0.965 |
| Education | 0.124 | 0.041 | 3.01 | 0.003 | 0.176 | 0.044 | 4.04 | 8.03e -5 | –0.108 | 0.048 | –2.25 | 0.026 |
| Age | –0.144 | 0.026 | –5.50 | 1.35e -7 | –0.115 | 0.026 | –4.39 | 1.93e -5 | 0.078 | 0.028 | 2.74 | 0.007 |
Table 2 provides results from three robust-fit multiple linear regression models (one for each CAP test). Estimated β coefficients with standard error (SE) are shown for each test. tStat shows the t-value for each variate, with corresponding p-value. There was no adjustment for multiple comparisons. Statistically significant terms for each test are in bold. All three tests were related to gender, education, and age. Neither APOE ɛ4 status nor tone test performance was associated significantly with any CAP test score.
Cognition
Table 3 depicts relationships, after adjustment for covariates, between CAP scores and total RBANS as well as Index scores. All CAP scores were associated with RBANSTOTAL. Similarly, the DSI-WES and REA scores were associated with all RBANS Index scores significantly or at trend level, except that the REA was not related to the Visuospatial-Constructive Index score. The SSI-ICM related to the Attention Index score.
Table 3
Robust-fit linear regression models of RBANSTOTAL and Index subscores as predictors of three CAP test scores
| RBANS result | SSI-ICM n = 172 | DSI-WES n = 185 | DSI-REA n = 185 | |||||||||
| β | SE | tStat | p | β | SE | tStat | p | β | SE | tStat | p | |
| Immediate Memory | 0.009 | 0.013 | 0.705 | 0.482 | 0.047 | 0.012 | 3.881 | 1.47e-4 | –0.029 | 0.014 | –2.009 | 0.046 |
| Delayed Memory | 0.014 | 0.018 | 0.821 | 0.413 | 0.055 | 0.017 | 3.188 | 1.70e-3 | –0.036 | 0.020 | –1.780 | 0.077 |
| Attention | 0.027 | 0.008 | 3.277 | 0.001 | 0.030 | 0.008 | 3.618 | 3.89e-4 | –0.019 | 0.010 | –1.911 | 0.058 |
| Language | 0.005 | 0.015 | 0.358 | 0.721 | 0.040 | 0.015 | 2.697 | 0.008 | –0.046 | 0.017 | –2.706 | 0.007 |
| Visuospatial- | ||||||||||||
| Construction | 0.004 | 0.010 | 0.399 | 0.691 | 0.022 | 0.010 | 2.176 | 0.031 | 0.007 | 0.011 | 0.597 | 0.551 |
| RBANSTOTAL | 0.029 | 0.013 | 2.240 | 0.026 | 0.065 | 0.012 | 5.337 | 2.89e-7 | –0.034 | 0.015 | –2.252 | 0.026 |
Table 3 shows results from robust-fit linear regression models of five RBANS index subscores as well as RBANSTOTAL score with adjustment for age, education, gender, APOE ɛ4 status, and tone test performance. Statistically significant terms are shown in bold. DSI-WES score was predicted significantly by all RBANS index scores, while DSI-REA showed significant or trend-level relationships to all scores except the visuospatial-construction subscore. The SSI-ICM was related only to the attention subscore. All three tests showed significant association with RBANSTOTAL score.
Cerebrospinal fluid AD biomarkers
Table 4 shows the relationship of CAP scores and CSF biomarkers of AD after controlling for covariates. Increased DSI-REA was associated with increased concentrations of total-tau (p = 0.035) and P-tau (p = 0.041). DSI-WES also related to total-tau and P-tau at a trend level (former p = 0.073, latter p = 0.109), but SSI-ICM showed no such association in fully adjusted models. A tolerance score of 0.1 suggested that the total-tau and P-tau measures were collinear, suggesting that either measure might be used. CSF Aβ42 did not predict any CAP score.
Table 4
Robust-fit linear regression models of CSF AD biomarkers as predictors of three CAP test scores
| Biomarker Measure | SSI-ICM n = 62 | DSI-WES n = 65 | DSI-REA n = 65 | |||||||||
| β | SE | tStat | p | β | SE | tStat | p | β | SE | tStat | p | |
| Aβ42 | 0.001 | 0.001 | 1.593 | 0.117 | 6.76e-5 | 0.001 | 0.064 | 0.949 | 3e-4 | 0.001 | 0.301 | 0.764 |
| total-tau | 3e-4 | 0.001 | 0.260 | 0.796 | –0.003 | 0.002 | –1.828 | 0.073 | 0.004 | 0.002 | 2.161 | 0.035 |
| P-tau | 0.003 | 0.011 | 0.265 | 0.792 | –0.023 | 0.014 | –1.629 | 0.109 | 0.031 | 0.015 | 2.095 | 0.041 |
| total-tau/Aβ42 | –0.164 | 0.856 | –0.192 | 0.849 | –1.539 | 1.034 | –1.489 | 0.142 | 1.820 | 1.132 | 1.608 | 0.113 |
| P-tau/Aβ42 | –3.337 | 7.686 | –0.434 | 0.666 | –12.602 | 9.113 | –1.383 | 0.172 | 14.133 | 9.967 | 1.418 | 0.162 |
As before, models were adjusted for age, education, gender, APOE ɛ4 status, and tone test performance. DSI-REA was predicted significantly by total-tau and P-tau levels and showed trends toward association with the ratios of total-tau or P-tau to Aβ42. DSI-WES showed a suggestive relationship to several biomarkers, with the notable exception of Aβ42, which appeared unrelated to any CAP test score.
To further explore the above findings, we analyzed whether participants with lower cognitive scores (i.e., farther along in the pre-symptomatic AD disease process) had greater association between CAP scores and CSF AD biomarkers. After performing a median split on the RBANS data we analyzed the relation in the “low” cognitive scoring group of CAP tests with CSF AD biomarkers. Among the 33 lower-performing individuals, the DSI-REA related to total-tau and P-tau more robustly (former p = 0.0059, latter p = 0.0044) as well as total-tau/Aβ42 ratio (p = 0.0090) and P-tau/Aβ42 ratio (p = 0.0079). DSI-WES also related to total-tau (p = 0.024) and P-tau (p = 0.029), as well as to the total-tau/Aβ42 ratio (p = 0.054) and the P- tau/Aβ42 ratio(p = 0.053).
Structural MRI
Hippocampal and entorhinal cortical volumes
As indicated by Table 5, the degree of REA on the DSI related significantly to left entorhinal volume, and similar trends were evident in adjusted models for right entorhinal and left hippocampal volumes. Larger REA (more positive value) predicted smaller volumes of these structures, but no such relationships were apparent with SSI-ICM score or the DSI-WES.
Table 5
Robust-fit linear regression of several imaging volumetric measures as predictors of three CAP test scores
| Volumetric Measure | SSI-ICM n = 163 | DSI-WES n = 173 | DSI-REA n = 173 | |||||||||
| β | SE | tStat | p | β | SE | tStat | p | β | SE | tStat | p | |
| Hc, L | –0.273 | 0.254 | –0.076 | 0.284 | –0.067 | 0.258 | –0.260 | 0.795 | –0.502 | 0.282 | –1.782 | 0.077 |
| Hc, R | –0.342 | 0.253 | –1.350 | 0.179 | –0.039 | 0.260 | –0.148 | 0.882 | –0.396 | 0.282 | –1.403 | 0.163 |
| EC, L | –0.001 | 0.002 | –0.447 | 0.655 | 0.002 | 0.002 | 0.641 | 0.522 | –0.006 | 0.003 | –2.168 | 0.032 |
| EC, R | –0.002 | 0.003 | –0.601 | 0.549 | 0.003 | 0.003 | 1.005 | 0.316 | –0.006 | 0.003 | –1.703 | 0.090 |
Table 5 shows results of multiple linear regression models as before, with predictor variables now being volume measures for four regions of interest. Hc, hippocampus; EC, entorhinal cortex; L, left; R, right. Models were again adjusted for age, education, gender, APOE ɛ4 status, and tone test performance, but not for multiple comparisons. Among the three CAP tests, only DSI-REA showed suggestive (trend) association with volumetric measures.
Cortical thickness
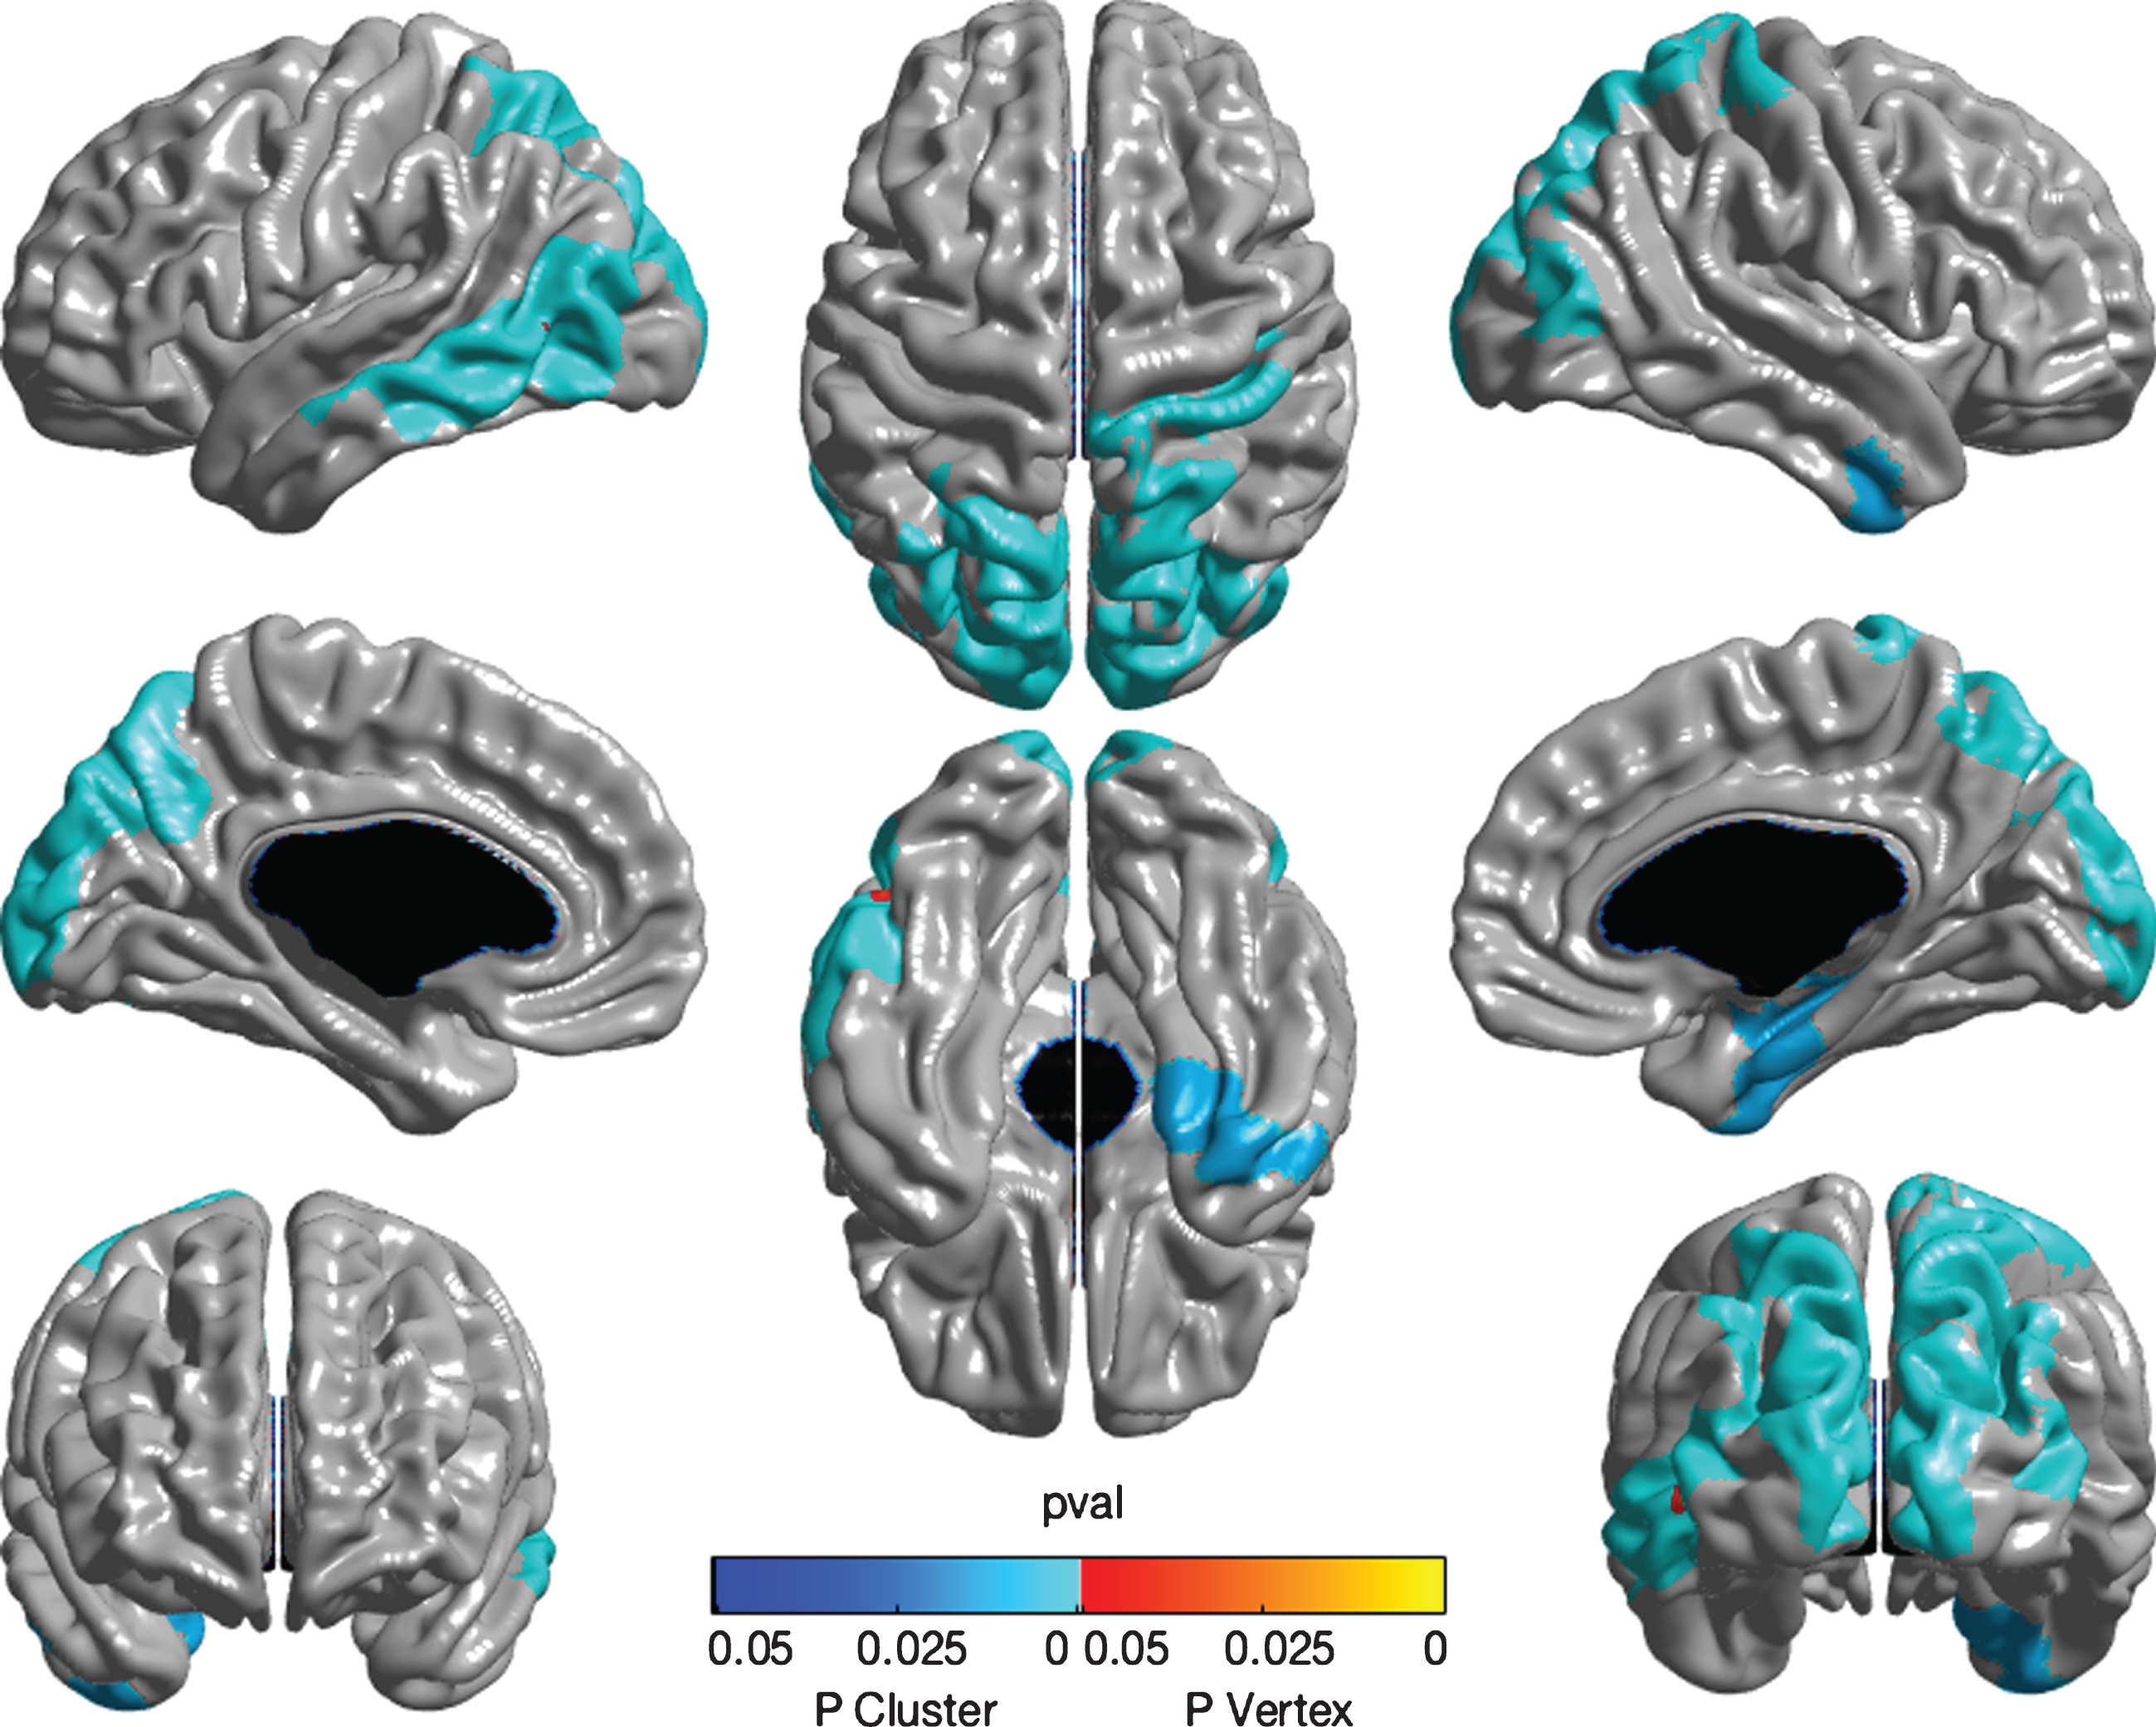
After adjustment for all covariates, cortical thickness analysis revealed a relationship between decreased SSI-ICM performance and atrophy in right Heschl’s gyrus at the peak level (see Fig. 1). Lower SSI-ICM score also related to thinner right parahippocampal and entorhinal cortices, as well as bilateral precuneus, occipital cortex, left inferior parietal lobule, and inferior and mid temporal gyri (see Fig. 1). These areas were all significant as regional clusters.
Fig.1
Whole brain cortical thickness measures associated with SSI-ICM. The figure displays a color map representing results of whole brain random-field theory cortical thickness analysis. The images, in sequence from top left, show left-lateral, dorsal, right-lateral, left-mesial, ventral, and right-mesial views, while the lower images show coronal views from rostral (left) and caudal (right) perspectives. Analyses adjusted for age, gender, education, APOE ɛ4 status, and tone test. The adjusted SSI-ICM score displayed a positive relationship with right Heschl’s gyrus at the peak level (indicated by red colored point). SSI-ICM score showed a positive relationship with thickness of the left and right precuneus, with extension to adjacent inferior parietal and occipital cortices. Also of interest are positive associations with right parahippocampal and entorhinal cortices, as well as left inferior and mid temporal gyri. All these areas are displayed as blue colored areas and are statistically significant as clusters.
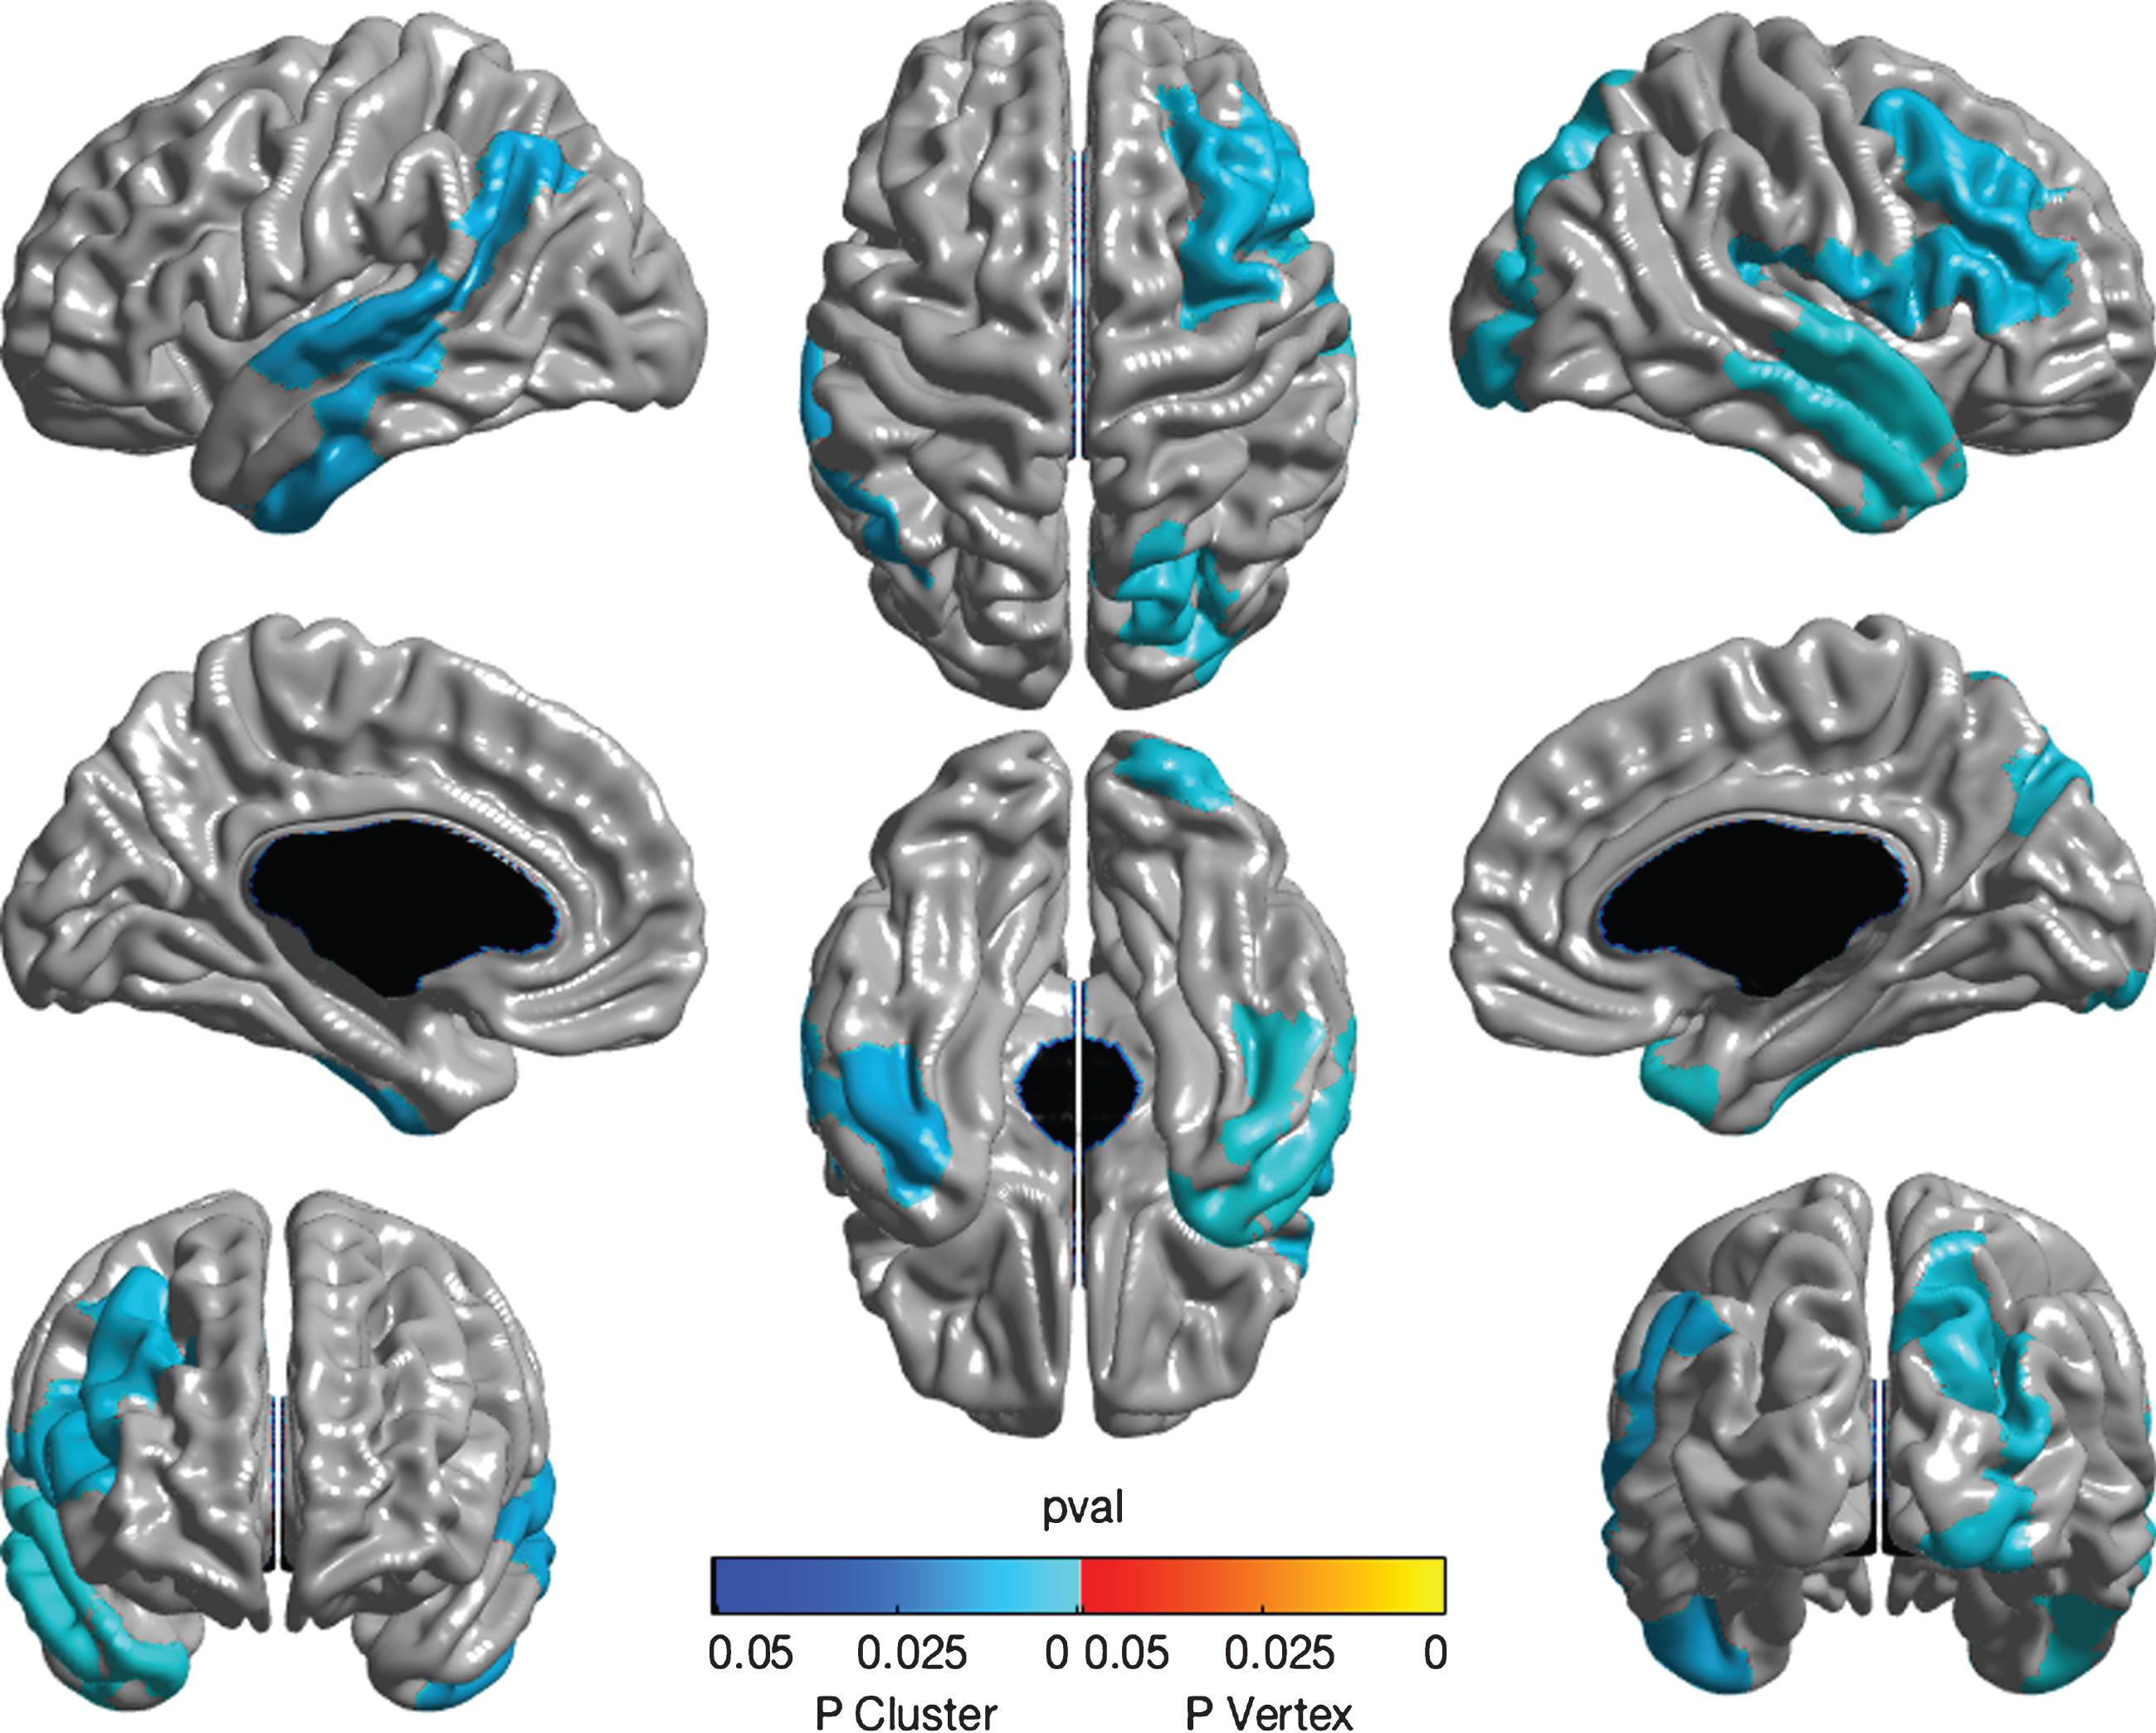
Greater DSI-REA score (representing loss of function) related to thinning of several cortical regions including the left superior and transverse temporal gyri, bilateral inferior temporal gyri, right anterior temporal pole, precuneus, dorsomedial frontal and inferior frontal gyri (see Fig. 2). After adjustment for multiple comparisons using random field theory, all these also appeared as significant clusters. However, DSI-WES was unrelated to any cortical thickness measure.
Fig.2
Whole brain cortical thickness measures associated with DSI-REA. Color map showing association of DSI-REA score with cortical thickness estimated using whole brain random-field theory analysis. The different image perspectives are as explained in Fig. 1. After adjustment for age, gender, education, APOE ɛ4 status, and tone test, DSI-REA score (representing presumed degeneration of transcortical auditory pathways) showed an inverse relationship with thickness of the right dorsomedial and inferior frontal cortices, as indicated in pale blue. Also shown are associations with thickness of left superior and transverse temporal cortices as well as bilateral inferior temporal gyri, right anterior temporal pole, and right precuneus. Analyses are significant at the cluster level, as shown. No significant peaks are observed.
DISCUSSION
We investigated two tests of central auditory processing (CAP) as possible indicators of pre-symptomatic AD progression in older persons at elevated risk. The SSI-SCM and the DSI are believed to test different auditory abilities. In particular, the right ear advantage (REA) measure on the DSI relies on interhemispheric communication and integrity [37]. Correlations were found between DSI-REA or the other two test scores and age, sex, or education. Adjusting for these covariates, relationships persisted between CAP scores and several more familiar domains of cognition, as well as indicators of AD pathology.
The relationships of CAP with age and education were expected [21, 34, 58–60]. Our finding of better performance on CAP tests by women also confirms results by Jerger and colleagues [61], but conflict with other accounts [62, 63]. A more even proportion of gender groups could have increased the power of our analyses. More surprising, however, was the tests’ lack of association with pure tone sensitivity or APOE ɛ4 status. The former may simply reflect participants’ option to select comfortable hearing volumes when tested, but it suggests that, as expected, CAP dysfunction represents more than simple “sensori-neural” hearing loss. Contrary to expectations, CAP performance on the SSI-ICM was, if anything, improved in those with the ɛ4 risk allele. While counterintuitive, this finding resembles cross-sectional results in a similar sample with another sensori-neural modality, odor identification [15]. We are uncertain whether similar findings would apply to other samples.
After adjusting for covariates, we observed significant relationships between CAP –especially the DSI-REA –and performance on several tests of cognition, on CSF biomarkers of AD, and on structural MRI modalities. In keeping with earlier work, [64, 65] CAP appeared particularly sensitive to attentional dysfunction as the only cognitive domain related appreciably to score on the SSI-ICM.
We are not aware of earlier reported investigations of CAP testing and CSF biomarkers of AD. In particular, total-tau and P-tau levels (thought typically to represent neurodegeneration) were associated with higher DSI-REA scores (lateralized difference in sentence identification), which has been shown by others to indicate an evolving AD process [27, 38, 66]. P-tau may be an especially specific marker for AD versus other degenerative dementias and psychiatric disorders [67, 68]. By contrast, we found no meaningful association between CAP test scores and CSF concentrations of relevant Aβ42 species, although such associations had been observed in pre-symptomatic AD with other cognitive tasks [69, 70]. Similarly, the association of CAP scores with CSF total-tau/Aβ42 and P-tau/Aβ42 ratios survived adjustment for age, but not for all covariates except in participants whose cognitive scores were in the lower half of the group. Associations of DSI-REA scores with CSF total-tau/Aβ42 and P-tau/Aβ42 ratios, present only at a trend level in the full sample, but were significant in lower-performing individuals. In addition, DSI-WES related significantly in this group to CSF total-tau and P-tau as well as total-tau/Aβ42 and P-tau/Aβ42 ratios. It appears that deficits in CAP may be more indicative of later stages (involving tau pathology) of pre-symptomatic AD pathogenesis.
DSI-REA scores also correlated with AD-related MRI structural volumetric markers in that higher scores (related decrease of left ear scores) showed trend-level or stronger association with smaller entorhinal cortices and hippocampi. Although these regions are not typically involved in auditory processing, the relationship is thought to be mediated by the underlying AD process reflected in decreased volumes, and impairment in the DSI. This relationship, alongside the CSF tau results, is consistent with reports of tau pathology in these regions early in the AD pathogenic cascade [71].
Confirming earlier studies [29, 30], whole brain analyses showed a significant correlation at the peak level between SSI-ICM scores and cortical thickness of the Heschl’s gyrus. This area is known as the primary cortex responsible for auditory processing [72]. The SSI-ICM also related to cortical thickness in the inferior parietal lobule. This region subserves sensory integration, including integration of auditory information, and it often shows gross atrophy and neurodegeneration in AD [73]. The finding of a previously unrecognized relationship between SSI-ICM score and the parahippocampal gyrus/entorhinal cortical thickness may be noteworthy, because these areas are also vulnerable to atrophy early in the pre-symptomatic phases of AD [3].
The DSI, and especially its REA score, were related as well to cortical thickness in the inferior frontal gyrus and auditory transverse and superior temporal gyri. These three are again involved in language and auditory functions that are commonly deficient in AD, and changes in their thickness have been shown in several studies to predict AD [10, 31, 73, 74]. DSI-REA score also predicted reduced cortical thickness of the middle frontal gyrus, an area responsible for working and episodic memory [75].
The observed relationship of these tests to occipital lobe cortical thickness was initially unexpected, but known deficits in vision and associated capacities (e.g., visuo-spatial abilities or memory or recognition) are also recognized features of AD [76]. Case reports have even described AD cases that present with a Balint syndrome, e.g., [77]. Both CAP test results also correlated with cortical thickness of the inferior and middle temporal gyri as well as precuneus, areas which are often the first to show gross atrophy in AD [10, 12, 78]. All these areas are recognizable as part of the default mode network [79], which is characteristically impaired in AD and MCI patients [80]. Volumetric and functional studies of precuneus in particular have been repeatedly shown to associate with CAP test results [30, 81–83].
Overall, the findings appear to support a hypothesis proposed by Gates and colleagues [32] that CAP dysfunction may serve as a marker of pre-symptomatic AD. The latter group showed that the strongest relationship between CAP dysfunction and subsequent incidence of AD was revealed by the DSI-WES (hazard ratio 9.9), rather than the SSI-ICM. Different CAP tests seem to reflect different processes, and the more attention-driven SSI-ICM seems to correlate better in cortical thickness while the DSI appears more sensitive as a biomarker of AD because of its relationship not only with many cognitive modalities, but also with pathological, volumetric, and cortical thickness measures. The DSI-REA is thought in particular to test a subject’s degree of reliance on the linguistic dominant side [84] revealing (in most individuals) a deficit in callosal interhemispheric connectivity [85, 86].
We would note that we did not design our studies to test individual hypotheses relating CAP to specific AD-related brain regional changes, functional deficits, or CSF biochemical markers. Such an approach might have necessitated correction for multiple comparisons, with attendant loss in statistical power. Instead our many observations that CAP test results relate to AD-related changes more generally evident across multiple modalities. Therefore, it appears that these simple, non-invasive test methods can identify several attributes of pre-symptomatic AD. While CAP testing should not presently be considered for early detection or prediction in clinical work, our study suggests that they deserve further investigation as indicators of disease progress that may contribute to outcomes in prevention trials [40]. Our group is therefore continuing investigations of the potential utility of CAP testing as a metric for AD progression, specifically with inclusion of longitudinal analyses.
ACKNOWLEDGMENTS
A complete list of past and present members of the PREVENT-AD Research Group can be found at https://preventad.loris.ca/team_2016_09_16.pdf. We would like to thank the entire team, as well as our dedicated study participants, all of whom are instrumental in our research. Thanks to Dr. George Gates for helpful suggestions on study design.
Funding was provided by McGill University, the Douglas Hospital Research Centre, and the Fonds de Recherche du Quebec – Santé. We gratefully acknowledge the contribution by Dr. Benoît Jutras of the audiometer used for these studies.
Authors’ disclosures available online (http://j-alz.com/manuscript-disclosures/17-0545r1).
REFERENCES
[1] | Bateman RJ , Xiong C , Benzinger TL , Fagan AM , Goate A , Fox NC , Marcus DS , Cairns NJ , Xie X , Blazey TM , Holtzman DM , Santacruz A , Buckles V , Oliver A , Moulder K , Aisen PS , Ghetti B , Klunk WE , McDade E , Martins RN , Masters CL , Mayeux R , Ringman JM , Rossor MN , Schofield PR , Sperling RA , Salloway S , Morris JC ; Dominantly Inherited Alzheimer Network ((2012) ) Clinical and biomarker changes in dominantly inherited Alzheimer’s disease. N Engl J Med 367: , 795–804. |
[2] | Sperling RA , Aisen PS , Beckett LA , Bennett DA , Craft S , Fagan AM , Iwatsubo T , Jack CR Jr , Kaye J , Montine TJ , Park DC , Reiman EM , Rowe CC , Siemers E , Stern Y , Yaffe K , Carrillo MC , Thies B , Morrison-Bogorad M , Wagster MV , Phelps CH ((2011) ) Toward defining the preclinical stages of Alzheimer’s disease: Recommendations from the National Institute on Aging-Alzheimer’s Association workgroups on diagnostic guidelines for Alzheimer’s disease. Alzheimers Dement 7: , 280–292. |
[3] | Jack CR Jr , Holtzman DM ((2013) ) Biomarker modeling of Alzheimer’s disease. Neuron 80: , 1347–1358. |
[4] | Small BJ , Fratiglioni L , Viitanen M , Winblad B , Bäckman L ((2000) ) The course of cognitive impairment in preclinical Alzheimerdisease: Three-and 6-year follow-up of a population-based sample. Arch Neurol 57: , 839–844. |
[5] | Morris JC , Storandt M , McKeel DW Jr , Rubin EH , Price JL , Grant EA , Berg L ((1996) ) Cerebral amyloid deposition and diffuse plaques in “normal” aging: Evidence for presymptomatic and very mild Alzheimer’s disease. Neurology 46: , 707–719. |
[6] | Tierney MC , Szalai JP , Snow WG , Fisher RH , Nores A , Nadon G , Dunn E , George-Hyslop PH ((1996) ) Prediction of probable Alzheimer’sdisease in memory-impaired patients A prospective longitudinalstudy. Neurology 46: , 661–665. |
[7] | Jacobs DM , Sano M , Dooneief G , Marder K , Bell K , Stern Y ((1995) ) Neuropsychological detection and characterization of preclinical Alzheimer’s disease. Neurology 45: , 957–962. |
[8] | Hardy J , Selkoe DJ ((2002) ) The amyloid hypothesis of Alzheimer’s disease: Progress and problems on the road to therapeutics. Science 297: , 353–356. |
[9] | Jack CR Jr , Petersen RC , O’Brien PC , Tangalos EG ((1992) ) MR-based hippocampal volumetry in the diagnosis of Alzheimer’s disease. Neurology 42: , 183–188. |
[10] | Dickerson BC , Feczko E , Augustinack JC , Pacheco J , Morris JC , Fischl B , Buckner RL ((2009) ) Differential effects of aging and Alzheimer’s disease on medial temporal lobe cortical thickness and surface area. Neurobiol Aging 30: , 432–440. |
[11] | Hansson O , Zetterberg H , Buchhave P , Londos E , Blennow K , Minthon L ((2006) ) Association between CSF biomarkers and incipient Alzheimer’s disease in patients with mild cognitive impairment: A follow-up study. Lancet Neurol 5: , 228–234. |
[12] | Dickerson BC , Wolk DA , Alzheimer’s Disease Neuroimaging Initiative ((2012) ) MRI cortical thickness biomarker predicts AD-like CSF and cognitive decline in normal adults. Neurology 78: , 84–90. |
[13] | Hall CB , Ying J , Kuo L , Sliwinski M , Buschke H , Katz M , Lipton RB ((2001) ) Estimation of bivariate measurements having different change points, with application to cognitive ageing. Stat Med 20: , 3695–3714. |
[14] | Masur DM , Sliwinski M , Lipton RB , Blau AD , Crystal HA ((1994) ) Neuropsychological prediction of dementia and the absence of dementia in healthy elderly persons. Neurology 44: , 1427–1432. |
[15] | Lafaille-Magnan ME , Poirier J , Etienne P , Tremblay-Mercier J , Frenette J , Rosa-Neto P , Breitner JC , PREVENT-AD Research Group ((2017) ) Odor identification as a biomarker of preclinical AD in older adults at risk. Neurology 89: , 327–335. |
[16] | Albers MW , Gilmore GC , Kaye J , Murphy C , Wingfield A , Bennett DA , Boxer AL , Buchman AS , Cruickshanks KJ , Devanand DP , Duffy CY , Gall CM , Gates GA , Granholm AC , Hensch T , Holtzer R , Hyman BT , Lin FR , McKee AC , Morris JC , Petersen RC , Silbert LC , Struble RG , Trojanowski JQ , Verghese J , Wilson DA , Xu S , Zhang LI ((2015) ) Atthe interface of sensory and motor dysfunctions and Alzheimer’sdisease. Alzheimers Dement 11: , 70–98. |
[17] | Gosselin PA , Gagné JP ((2011) ) Older adults expend more listening effort than young adults recognizing speech in noise. J Speech Lang Hear Res 54: , 944–958. |
[18] | Kathleen Pichora-Fuller M ((2008) ) Use of supportive context by younger and older adult listeners: Balancing bottom-up and top-down information processing. Int J Audiol 47: , S72–S82. |
[19] | American Speech-Language-Hearing Association ((1996) ) Central Auditory Processing: Current Status of Research and Implications for Clinical Practice. |
[20] | Gates GA , Gibbons LE , McCurry SM , Crane PK , Feeney MP , Larson EB ((2010) ) Executive dysfunction and presbycusis in olderpersons with and without memory loss and dementia. Cogn BehavNeurol 23: , 218–223. |
[21] | Humes LE , Lee JH , Coughlin MP ((2006) ) Auditory measures of selective and divided attention in young and older adults using single-talker competition. J Acoust Soc Am 120: , 2926–2937. |
[22] | Rönnberg J , Rudner M , Foo C , Lunner T ((2008) ) Cognition counts: A working memory system for ease of language understanding (ELU). Int J Audiol 47: , S99–S105. |
[23] | Akeroyd MA ((2008) ) Are individual differences in speech receptionrelated to individual differences in cognitive ability? A surveyof twenty experimental studies with normal and hearing-impairedadults. Int J Audiol 47: , S53–S71. |
[24] | No authors listed ((1988) ) Speech understanding and aging. Working group on speech understanding and aging. Committee on hearing, bioacoustics, and biomechanics, commission on behavioral and social sciences and education, national research council. J Acoust Soc Am 83: , 859–895. |
[25] | Idrizbegovic E , Hederstierna C , Dahlquist M , Kämpfe Nordström C , Jelic V , Rosenhall U ((2011) ) Central auditory function in early Alzheimer’s disease and in mild cognitive impairment. Age Ageing 40: , 249–254. |
[26] | Kurylo DD , Corkin S , Allard T , Zatorre RJ , Growdon JH ((1993) ) Auditory function in Alzheimer’s disease. Neurology 43: , 1893–1899. |
[27] | Strouse AL , Hall JW 3rd , Burger MC ((1995) ) Central auditory processing in Alzheimer’s disease. Ear Hear 16: , 230–238. |
[28] | Iliadou V , Kaprinis S ((2003) ) Clinical psychoacoustics inAlzheimer’s disease central auditory processing disorders andspeech deterioration. Ann Gen Hosp Psychiatry 2: , 12. |
[29] | Golden HL , Agustus JL , Goll JC , Downey LE , Mummery CJ , Schott JM , Crutch SJ , Warren JD ((2015) ) Functional neuroanatomy of auditory scene analysis in Alzheimer’s disease. Neuroimage Clin 7: , 699–708. |
[30] | Golden HL , Nicholas JM , Yong KX , Downey LE , Schott JM , Mummery CJ , Crutch SJ , Warren JD ((2015) ) Auditory spatial processing in Alzheimer’s disease. Brain 138: , 189–202. |
[31] | Goll JC , Kim LG , Ridgway GR , Hailstone JC , Lehmann M , Buckley AH , Crutch SJ , Warren JD ((2012) ) Impairments of auditory scene analysis in Alzheimer’s disease. Brain 135: , 190–200. |
[32] | Gates GA , Anderson ML , McCurry SM , Feeney MP , Larson EB ((2011) ) Central auditory dysfunction as a harbinger of Alzheimer dementia. Arch Otolaryngol Head Neck Surg 137: , 390–395. |
[33] | Gates GA , Beiser A , Rees TS , D’Agostino RB , Wolf PA ((2002) ) Central auditory dysfunction may precede the onset of clinical dementia in people with probable Alzheimer’s disease. J Am Geriatr Soc 50: , 482–488. |
[34] | Gates GA , Karzon RK , Garcia P , Peterein J , Storandt M , Morris JC , Miller JP ((1995) ) Auditory dysfunction in aging and senile dementia of the Alzheimer’s type. Arch Neurol 52: , 626–634. |
[35] | Grady CL , Grimes AM , Patronas N , Sunderland T , Foster NL , Rapoport SI ((1989) ) Divided attention, as measured by dichotic speech performance, in dementia of the Alzheimer type. Arch Neurol 46: , 317–320. |
[36] | Grimes AM , Grady CL , Foster NL , Sunderland T , Patronas NJ ((1985) ) Central auditory function in Alzheimer’s disease. Neurology 35: , 352–358. |
[37] | Martin JS , Jerger JF ((2005) ) Some effects of aging on central auditory processing. J Rehabil Res Dev 42: , 25–44. |
[38] | Mohr E , Cox C , Williams J , Chase TN , Fedio P ((1990) ) Impairment of central auditory function in Alzheimer’s disease. J Clin Exp Neuropsychol 12: , 235–246. |
[39] | Edwards JD , Lister JJ , Elias MN , Tetlow AM , Sardina AL , Sadeq NA , Brandino AD , Bush AL ((2017) ) Auditory processing of older adults with probable mild cognitive impairment. J Speech Lang Hear Res 60: , 1427–1435. |
[40] | Breitner JC , Poirier J , Etienne PE , Leoutsakos JM , PREVENT-AD Research Group ((2016) ) Rationale and structure for a new Center for Studies on Prevention of Alzheimer’s Disease (StoP-AD). J Prev Alz Dis 3: , 236–242. |
[41] | Breitner JC , Wyse BW , Anthony JC , Welsh-Bohmer KA , Steffens DC , Norton MC , Tschanz JT , Plassman BL , Meyer MR , Skoog I , Khachaturian A ((1999) ) APOE-epsilon4 count predicts age whenprevalence of AD increases, then declines: The Cache County Study. Neurology 53: , 321–331. |
[42] | Clark JG ((1981) ) Uses and abuses of hearing loss classification. ASHA 23: , 493–500. |
[43] | Lin FR , Thorpe R , Gordon-Salant S , Ferrucci L ((2011) ) Hearing loss prevalence and risk factors among older adults in the United States. J Gerontol A Biol Sci Med Sci 66: , 582–590. |
[44] | Speaks C , Jerger J ((1965) ) Method for measurement of speech identification. J Speech Lang Hear Res 8: , 185–194. |
[45] | Speaks C , Karmen JL , Benitez L ((1967) ) Effect of a competing message on synthetic sentence identification. J Speech Lang Hear Res 10: , 390–395. |
[46] | Lynch A , Normandin N ((1983) ) SSI: Élaboration d’une version française et application auprès d’une population d’enfants avec troubles d’apprentissage. Unpublished master’s thesis, University of Montreal, Montreal, Canada. |
[47] | Fifer RC , Jerger JF , Berlin CI , Tobey EA , Campbell JC ((1983) ) Development of a dichotic sentence identification test for hearing-impaired adults. Ear Hear 4: , 300–305. |
[48] | Jerger J , Martin J ((2004) ) Hemispheric asymmetry of the right ear advantage in dichotic listening. Hear Res 198: , 125–136. |
[49] | Gosselin N , De Beaumont L , Gagnon K , Baril AA , Mongrain V , Blais H , Montplaisir J , Gagnon JF , Pelleieux S , Poirier J , Carrier J ((2016) ) BDNF Val66Met polymorphism interacts with sleepconsolidation to predict ability to create new declarativememories. J Neurosci 36: , 8390–8398. |
[50] | Randolph C , Tierney MC , Mohr E , Chase TN ((1998) ) The Repeatable Battery for the Assessment of Neuropsychological Status (RBANS): Preliminary clinical validity. J Clin Exp Neuropsychol 20: , 310–319. |
[51] | Lerch JP , Evans AC ((2005) ) Cortical thickness analysis examined through power analysis and a population simulation. Neuroimage 24: , 163–173. |
[52] | Collins DL , Pruessner JC ((2009) ) Towards accurate, automatic segmentation of the hippocampus and amygdala from MRI. In International Conference on Medical Image Computing and Computer-Assisted Intervention, Springer, pp. 592–600. |
[53] | Templeton GF ((2011) ) A two-step approach for transforming continuous variables to normal: Implications and recommendations for IS research. CAIS 28: , 41–58. |
[54] | Dawber TR , Meadors GF , Moore FE Jr ((1951) ) Epidemiological approaches to heart disease: The Framingham Study. Am J Public Health Nations Health 41: , 279–286. |
[55] | Kukull WA , Higdon R , Bowen JD , McCormick WC , Teri L , Schellenberg GD , van Belle G , Jolley L , Larson EB ((2002) ) Dementia and Alzheimer disease incidence: A prospective cohort study. Arch Neurol 59: , 1737–1746. |
[56] | Morrell CH , Gordon-Salant S , Pearson JD , Brant LJ , Fozard JL ((1996) ) Age-and gender-specific reference ranges for hearing level and longitudinal changes in hearing level. J Acoust Soc Am 100: , 1949–1967. |
[57] | Gates GA , Anderson ML , Feeney MP , McCurry SM , Larson EB ((2008) ) Central auditory dysfunction in older persons with memory impairment or Alzheimer dementia. Arch Otolaryngol Head Neck Surg 134: , 771–777. |
[58] | Gelfand SA ((2009) ) Essentials of Audiology, Thieme. |
[59] | Harris KC , Dubno JR , Keren NI , Ahlstrom JB , Eckert MA ((2009) ) Speech recognition in younger and older adults: A dependency on low-level auditory cortex. J Neurosci 29: , 6078–6087. |
[60] | Murphy CF , Rabelo CM , Silagi ML , Mansur LL , Schochat E ((2016) ) Impact of educational level on performance on auditory processing tests. Front Neurosci 10: , 97. |
[61] | Jerger J , Chmiel R , Allen J , Wilson A ((1994) ) Effects of age and gender on dichotic sentence identification. Ear Hear 15: , 274–286. |
[62] | Gonçales AS , Cury MC ((2011) ) Assessment of two central auditory tests in elderly patients without hearing complaints. Braz J Otorhinolaryngol 77: , 24–32. |
[63] | Calais LL , Russo IC , Borges AC ((2008) ) Performance of elderly in a speech in noise test. Pro Fono 20: , 147–153. |
[64] | Kemper S , Herman RE , Lian CH ((2003) ) The costs of doing two things at once for young and older adults: Talking while walking, finger tapping, and ignoring speech of noise. Psychol Aging 18: , 181–192. |
[65] | Anderson S , White-Schwoch T , Parbery-Clark A , Kraus N ((2013) ) A dynamic auditory-cognitive system supports speech-in-noise perception in older adults. Hear Res 300: , 18–32. |
[66] | Duchek JM , Balota DA ((2005) ) Failure to control prepotent pathwaysin early stage dementia of the Alzheimer’s type: Evidence fromdichotic listening. Neuropsychology 19: , 687–695. |
[67] | de Jong D , Jansen RW , Kremer BP , Verbeek MM ((2006) ) Cerebrospinalfluid amyloid beta42/phosphorylated tau ratio discriminatesbetween Alzheimer’s disease and vascular dementia. J GerontolA Biol Sci Med Sci 61: , 755–758. |
[68] | Koopman K , Le Bastard N , Martin JJ , Nagels G , De Deyn PP , Engelborghs S ((2009) ) Improved discrimination of autopsy-confirmed Alzheimer’s disease (AD) from non-AD dementias using CSF P-tau(181P). Neurochem Int 55: , 214–218. |
[69] | Giannakopoulos P , Herrmann FR , Bussière T , Bouras C , Kövari E , Perl D , Morrison JH , Gold G , Hof PR ((2003) ) Tangleand neuron numbers, but not amyloid load, predict cognitive statusin Alzheimer’s disease. Neurology 60: , 1495–1500. |
[70] | Arriagada PV , Growdon JH , Hedley-Whyte ET , Hyman BT ((1992) ) Neurofibrillary tangles but not senile plaques parallel duration and severity of Alzheimer’s disease. Neurology 42: , 631–639. |
[71] | Braak H , Braak E ((1991) ) Neuropathological stageing ofAlzheimer-related changes. Acta Neuropathol 82: , 239–259. |
[72] | Zatorre RJ , Belin P ((2001) ) Spectral and temporal processing in human auditory cortex. Cereb Cortex 11: , 946–953. |
[73] | Brun A , Englund E ((1981) ) Regional pattern of degeneration in Alzheimer’s disease: Neuronal loss and histopathological grading. Histopathology 5: , 549–564. |
[74] | Fujiwara N , Nagamine T , Imai M , Tanaka T , Shibasaki H ((1998) ) Roleof the primary auditory cortex in auditory selectiveattention studied by whole-head neuromagnetometer. Brain ResCogn Brain Res 7: , 99–109. |
[75] | Ranganath C , Johnson MK , D’Esposito M ((2003) ) Prefrontal activity associated with working memory and episodic long-term memory. Neuropsychologia 41: , 378–389. |
[76] | Tzekov R , Mullan M ((2014) ) Vision function abnormalities in Alzheimer disease. Surv Ophthalmol 59: , 414–433. |
[77] | Welsh KA , Hoffman JM , McDonald WM , Earl NL , Breitner J ((1993) ) Concordant but different: Cognitive function, cerebral anatomy, and metabolism in monozygotic twins with Alzheimer’s disease. Neuropsychology 7: , 158–171. |
[78] | Fennema-Notestine C , Hagler DJ Jr , McEvoy LK , Fleisher AS , Wu EH , Karow DS , Dale AM , Alzheimer’s Disease Neuroimaging Initiative ((2009) ) Structural MRI biomarkers for preclinical and mild Alzheimer’s disease. Hum Brain Mapp 30: , 3238–3253. |
[79] | Fransson P , Marrelec G ((2008) ) The precuneus/posterior cingulate cortex plays a pivotal role in the default mode network: Evidence from a partial correlation network analysis. Neuroimage 42: , 1178–1184. |
[80] | Orban P , Madjar C , Savard M , Dansereau C , Tam A , Das S , Evans AC , Rosa-Neto P , Breitner JC , Bellec P , PREVENT-AD Research Group ((2015) ) Test-retest resting-state fMRI inhealthy lderly persons with a family history of Alzheimer’sdisease. Sci Data 2: , 150043. |
[81] | Hugdahl K , Westerhausen R , Alho K , Medvedev S , Laine M , Hämäläinen H ((2009) ) Attention and cognitive control:Unfolding the dichotic listening story. Scand J Psychol 50: , 11–22. |
[82] | Thomsen T , Rimol LM , Ersland L , Hugdahl K ((2004) ) Dichotic listening reveals functional specificity in prefrontal cortex: An fMRI study. Neuroimage 21: , 211–218. |
[83] | Pallesen KJ , Brattico E , Bailey CJ , Korvenoja A , Gjedde A ((2009) ) Cognitive and emotional modulation of brain default operation. J Cogn Neurosci 21: , 1065–1080. |
[84] | Bouma A , Gootjes L ((2011) ) Effects of attention on dichotic listening in elderly and patients with dementia of the Alzheimer type. Brain Cogn 76: , 286–293. |
[85] | Delbeuck X , Van der Linden M , Collette F ((2003) ) Alzheimer’s disease as a disconnection syndrome? Neuropsychol Rev 13: , 79–92. |
[86] | Gootjes L , Bouma A , Van Strien JW , Van Schijndel R , Barkhof F , Scheltens P ((2006) ) Corpus callosum size correlates with asymmetric performance on a dichotic listening task in healthy aging but not in Alzheimer’s disease. Neuropsychologia 44: , 208–217. |


